
Abstract
Objectives:
Autophagy-dependent cell death (ADCD) plays a pivotal role in solid tumors, ultimately influencing immunotherapeutic efficacy and cancer prognosis. However, its significance in hepatocellular carcinoma (HCC) remains underexplored.
Methods:
Through integrated analysis of single-cell and bulk transcriptomic data, this research systematically identified ADCD-associated genes in LIHC. This was achieved by applying AddModuleScore, ssGSEA, and WGCNA for robust gene screening. A prognostic model was developed for LIHC grounded in The Cancer Genome Atlas (TCGA) dataset. Its validity was confirmed through internal validation with an independent TCGA cohort and external validation using GEO datasets. Immune characteristics were assessed by adopting CIBERSORT and ESTIMATE algorithms. Through LASSO-Cox regression analysis, this research established a 9-gene ADCD signature and derived the ADCD-related risk score system (ADCDRS).
Results:
The ADCDRS demonstrated superior prognostic performance. Aside from that, this unique system was significantly associated with clinical features, immune infiltration patterns, and the tumor’s local environment. To improve clinical applicability, this research constructed a nomogram incorporating the ADCDRS. Additionally, potential therapeutic agents targeting specific risk subgroups were identified.
Conclusion:
This study highlights the prognostic and therapeutic potential of ADCD-related biomarkers in LIHC.
Keywords
Introduction
As the most prevalent primary liver malignancy, hepatocellular carcinoma (HCC) accounts for the third highest rate of cancer-related deaths globally.1,2 Typically arising from chronic liver disease, the main causes include infection with hepatitis B virus (HBV) or hepatitis C virus (HCV), excessive alcohol consumption, or non-alcoholic fatty liver disease (NAFLD). 3 Although recent advances in screening and imaging technologies have enabled early diagnosis and radical intervention for some high-risk individuals, such as surgical resection, radiofrequency ablation or liver transplantation, 4 more than half of hepatocellular carcinoma cases are diagnosed at an advanced stage. Consequently, this significantly reduces opportunities for curative treatment. 5 Overall 5-year survival remains unfavorable, particularly for patients with unresectable or metastatic disease. 6
Notably, the systemic treatment landscape of HCC has expanded significantly with the advent of multi-target tyrosine kinase inhibitors (TKIs) and immune checkpoint inhibitors (ICIs). The overall objective response rate (ORR) of these treatments remains modest, and only a subset of patients derive durable clinical benefit.2,7 The tumor microenvironment (TME) of HCC is not only highly heterogeneous, but also plays a pivotal role in antigen presentation, immunosuppression, and treatment resistance. Therefore, it serves as 1 of the key determinants in variable therapeutic outcomes. 8 This highlights the urgent need for novel biomarkers to refine prognostic assessment and guide personalized immunotherapy strategies.
Autophagy-dependent cell death (ADCD) is a newly characterized non-apoptotic form of programmed cell death. It is specifically distinguished by irreversible structural and functional damage resulting from excessive or sustained autophagy. 9 Under normal physiological conditions, autophagy is considered a protective mechanism that maintains cellular homeostasis, eliminates damaged organelles, and responds to metabolic stress. 10 However, pathological hyperactivation can lead to cellular damage and death. 11 ADCD is mediated by key regulators such as Beclin-1, ATG5, and ATG7. Mechanistically, it is distinct from apoptosis, as it proceeds independently of caspase activation and DNA fragmentation. Notably, ADCD has been proven to be correlated with the regulation of tumor progression, the modulation of immune responses, and the enhancement of sensitivity to certain anticancer therapies. 12 Despite its increasing importance, it remains largely unexplored about the biological and clinical relevance of ADCD in liver cancer. Moreover, no ADCD-related prognostic model has been established in HCC.
High-resolution technologies such as single-cell RNA sequencing (scRNA-seq) provide powerful tools to uncover cell heterogeneity and track immune cell dynamics, ultimately offering deeper insights into the immune-ecological role of ADCD in tumors. 13 Emerging evidence suggests that ADCD may facilitate immunogenic cell death. This occurs by promoting the release of damage-associated molecular patterns (DAMPs), enhancing dendritic cell activation, and priming T cell-mediated immune responses, thereby potentially increasing tumor sensitivity to immunotherapy. These immunomodulatory properties suggest that ADCD may serve as a potential target for improving the efficacy of immunotherapy interventions.11,14 However, it remains insufficiently characterized about the role of ADCD in liver cancer. For this reason, a comprehensive understanding of the expression patterns, regulatory networks, and immunological functions of ADCD-related genes in HCC could shed light on their involvement in immune evasion and therapeutic resistance.
Given the metabolic stress, hypoxia, and chronic inflammation characteristic of HCC, ADCD may represent a uniquely relevant programmed cell death pathway in this malignancy. Nevertheless, no studies have been reported to probe deep into its transcriptional landscape and clinical implications.
As a consequence, this research integrated single-cell and bulk transcriptomic data to systematically identify ADCD-related genes and construct an ADCD-related risk score system (ADCDRS) in HCC. We evaluated its prognostic significance, immune landscape associations, and potential value for guiding therapeutic decision-making. Our research seeks to advance precision oncology and immune-based treatment strategies in hepatocellular carcinoma. To the best of our knowledge, this study pioneered the comprehensive characterization of ADCD-related transcriptional programs in HCC and the development of an ADCD-based prognostic model. Figure 1 provides a workflow diagram of our study.
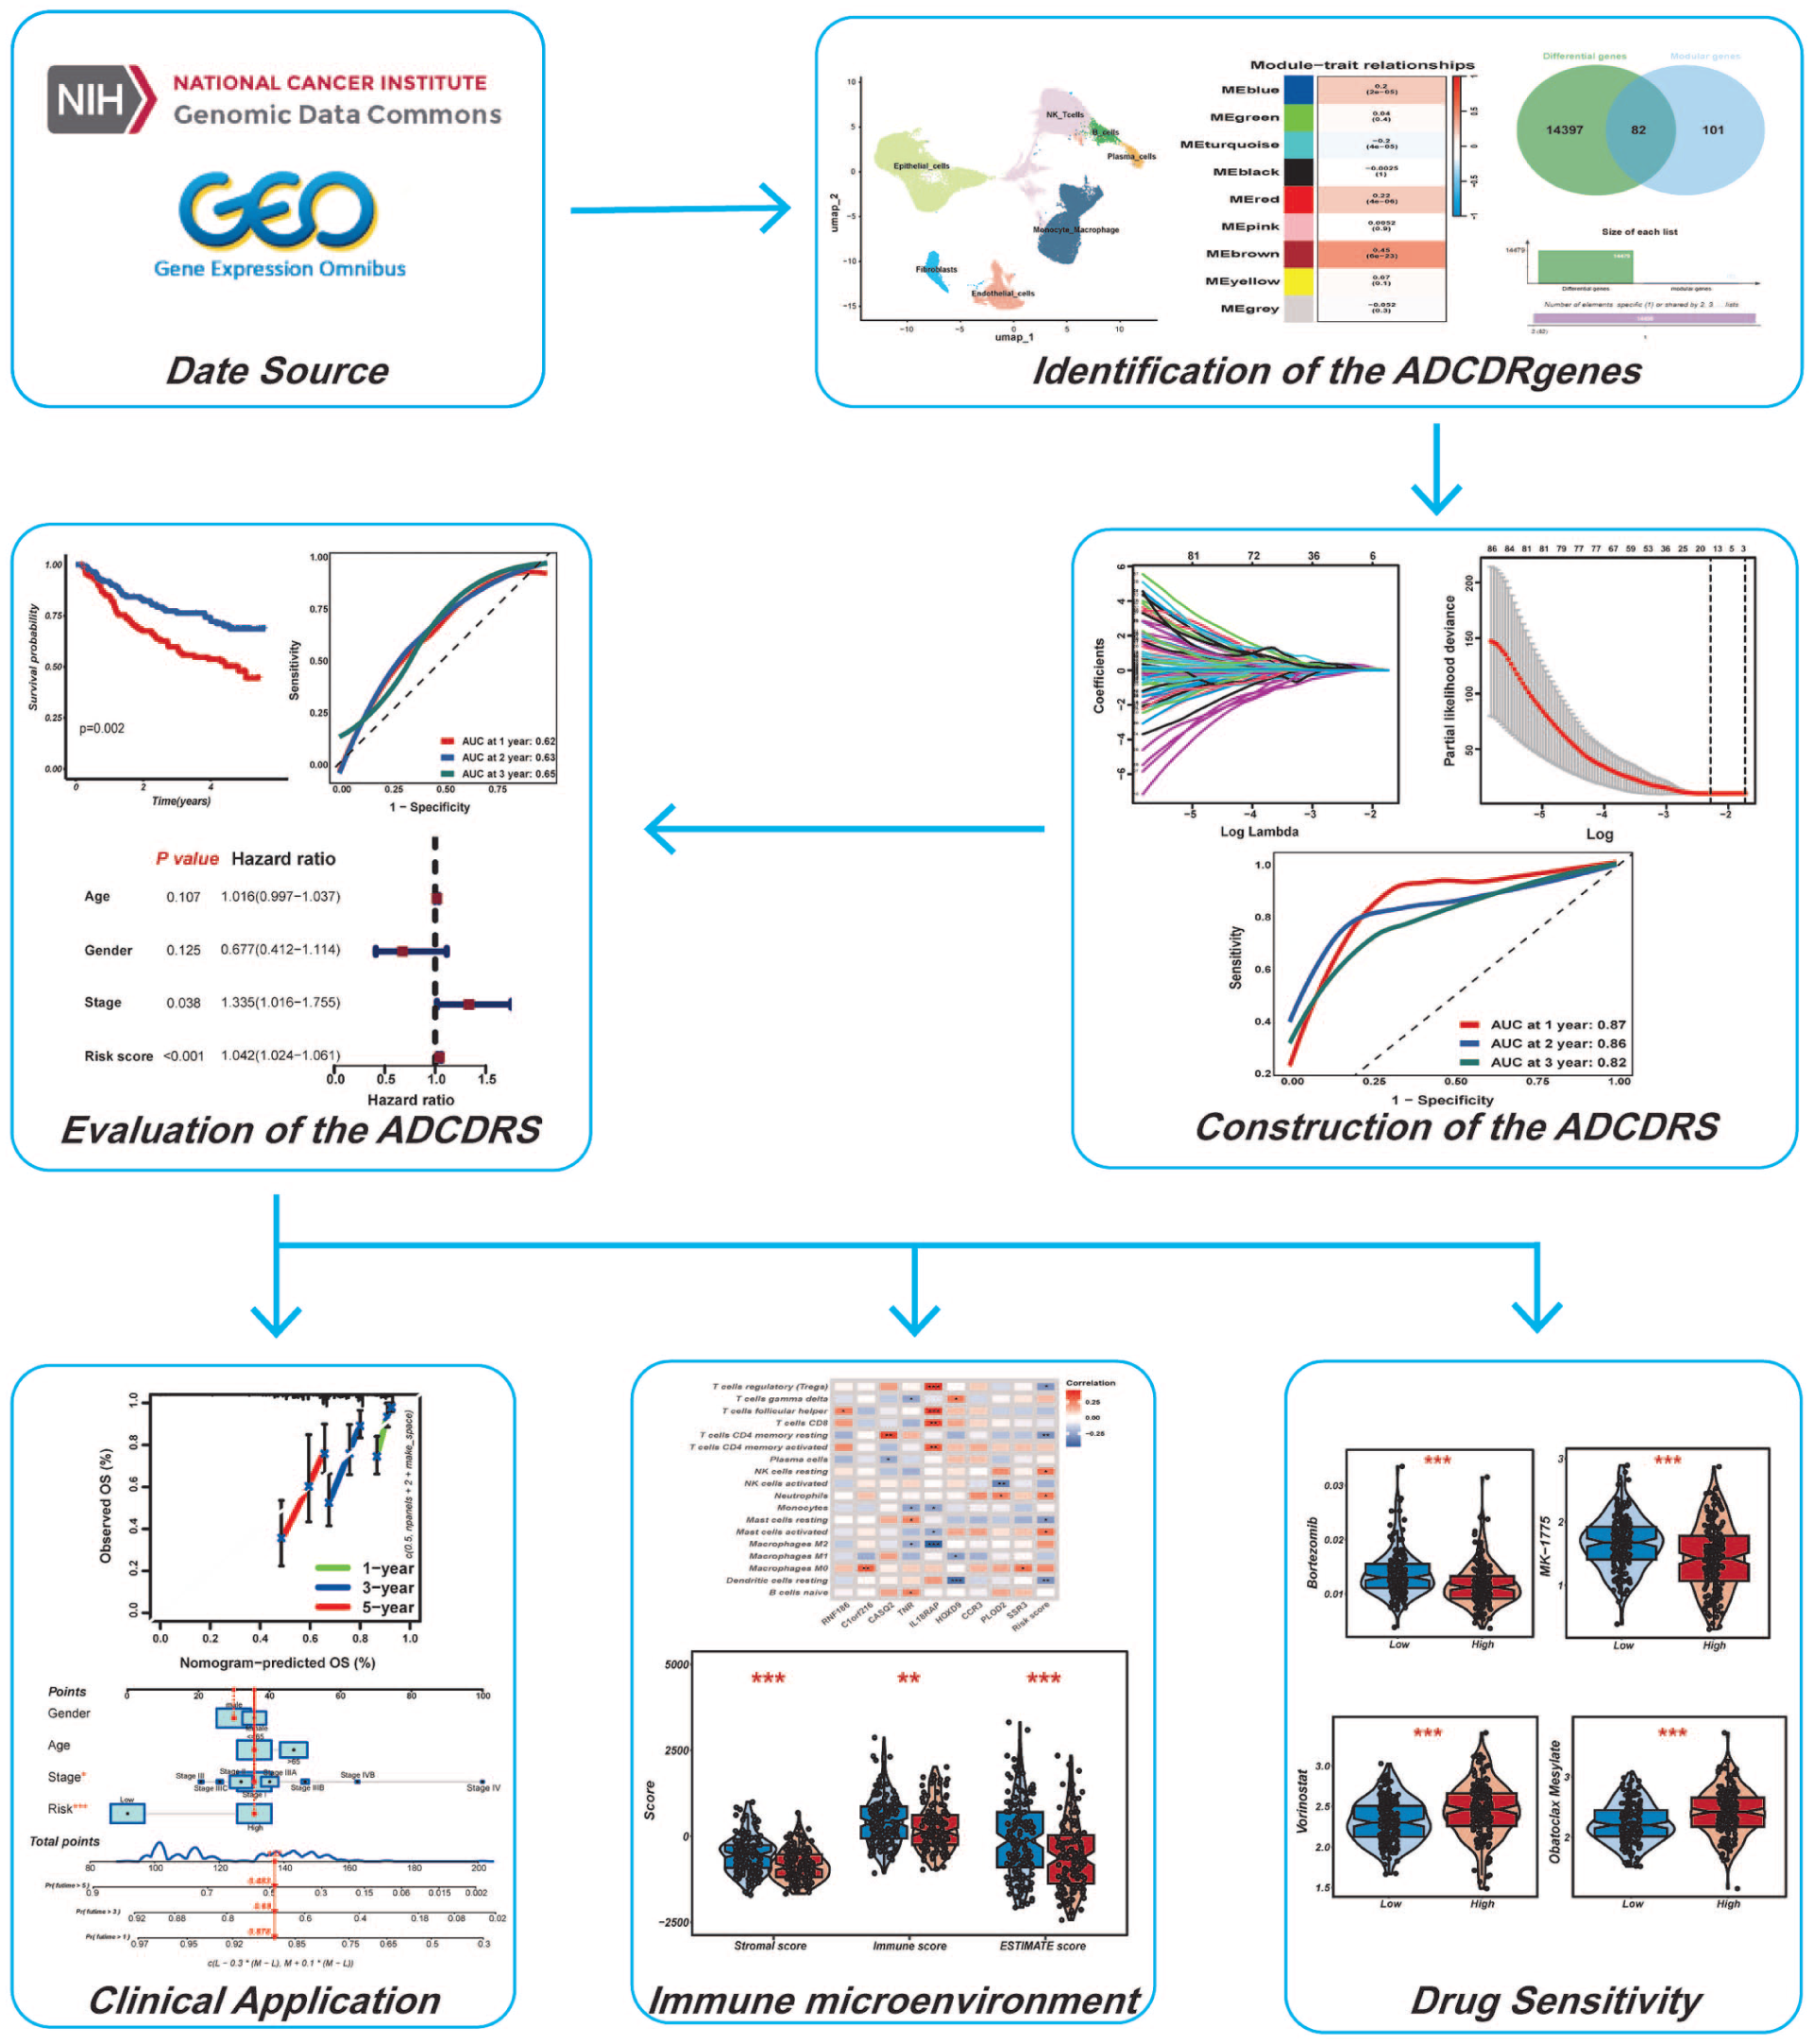
Flowchart summarizing the overall design and analytical workflow of this study.
Methods
Data Collection and Processing
The research employed RNA sequencing and associated clinical details for liver hepatocellular carcinoma (LIHC) from The Cancer Genome Atlas (TCGA). Transcriptomic profiles were normalized by utilizing transcripts per million (TPM). Afterward, genes with an average expression level below 0.1 were excluded to ensure data quality. In particular, a total of 421 samples were included after excluding cases with incomplete clinical pathology information, including 371 tumor samples and 50 normal samples.
To further explore the expression heterogeneity of key genes within the tumor microenvironment, this research integrated 1 single-cell RNA sequencing dataset from the Gene Expression Omnibus (GEO): GSE149614. The robustness and predictive utility of the gene signature were assessed by adopting 2 additional GEO datasets, namely, GSE14520 (445 samples) and GSE116174 (64 samples). A comprehensive review of the relevant literature was conducted to identify genes associated with ADCD. Subsequent to the above steps, a selected gene set of 367 candidate genes was finally obtained for downstream analysis (Supplemental Table S1).
Acquisition and Preprocessing of Single-Cell RNA Sequencing Data
In this section, one scRNA-seq dataset of HCC patients was obtained from the GEO, comprising a total of 184753 single cells. Data processing was conducted by utilizing the Seurat package. 15 Cells with over 10% mitochondrial content, over 3% erythrocyte gene content, less than 200 or more than 7500 detected genes were removed. A set of 2000 highly variable genes was identified by adopting the “vst” method. Subsequent to the above steps, data were log-normalized (scale.factor = 10 000) and scaled by regressing out UMI counts and mitochondrial percentage. Batch effects were subsequently corrected by adopting Harmony with default parameters. PCA was performed on variable genes, and clustering used FindNeighbors (dims = 1:30) and FindClusters (resolution = 1.5), followed by UMAP visualization. Cell types were annotated via canonical markers. AddModuleScore was applied to quantify ADCD gene set activity, and FindMarkers (Wilcox) identified DEGs by utilizing adjusted P < .05 and |log2FC| > 0.25. ADCD-related DEGs were further analyzed by adopting WGCNA. 16 Cell–cell communication was assessed by employing CellChat with default ligand–receptor databases. 17
Single-Sample Gene Set Enrichment Analysis (ssGSEA) and Weighted Gene Coexpression Network Analysis (WGCNA)
Single-sample gene set enrichment analysis (ssGSEA) was initially conducted to quantitatively assess the enrichment level of a specific gene set across each sample. 18 By employing the “GSVA” R package, the ADCD score was calculated for each sample in the TCGA-LIHC cohort, ultimately laying a solid foundation for subsequent identification and mechanism research of key genes.
Subsequently, weighted gene co-expression network analysis (WGCNA) was performed on the TCGA-LIHC transcriptomic data to systematically identify ADCD-associated gene modules. An appropriate soft-thresholding power (β) was chosen to guarantee the network maintained scale-free topology. A weighted adjacency matrix was constructed and transformed into a topological overlap matrix (TOM), from which gene dissimilarity (dissTOM) was calculated. Gene modules were delineated by adopting the dynamic tree cut analytical method. Correlation analyses were subsequently conducted to determine the modules most closely linked to ADCD scores. In this study, WGCNA was conducted by utilizing an unsigned network type. The soft-thresholding power was set at β = 14 under a scale-free topology criterion. Additionally, this research defined a minimum module size of 190 genes and applied a module merging threshold of 0.25. Core genes within these modules were further refined. This step ensured their functional relevance to ADCD regulation and their potential role in hepatocellular carcinoma progression. These findings laid a robust groundwork for in-depth mechanistic exploration of ADCD in HCC.
Consensus Clustering Grounded in ADCD Scores
Rooted in the expression profiles of autophagy-dependent cell death-related (ADCDR) genes, ADCD-based consensus clustering analysis was performed to classify individuals into distinct molecular subtypes. By utilizing the ConsensusClusterPlus R package and unsupervised clustering approach, this research first performed univariate Cox regression analysis of 82 ADCD-related genes to identify those significantly associated with overall survival. Eighteen genes with P-values less than .05 were retained. A prognostic interaction network was subsequently constructed to visualize their relationships. Rooted in the expression of these 18 genes, consensus clustering of TCGA-LIHC patients identified 2 robust molecular clusters (k = 2) with optimal clustering stability.
To assess the clinical relevance of these ADCD-related subtypes, Kaplan–Meier survival analyses were performed by utilizing the survival and survminer R packages. Principal component analysis (PCA) was conducted with ggplot2 to visualize subtype separation. The proportions of immune and stromal cells were estimated by employing the CIBERSORT algorithm, 19 while ssGSEA was applied to quantify immune cell infiltration scores for each sample.
We further explored the associations between these 2 ADCD-related clusters and key clinical/pathological features, including age, T stage, N stage, and patient outcomes. Kaplan–Meier analysis confirmed significant differences in overall survival between these 2 subtypes. Differentially expressed genes (DEGs) between clusters were identified by employing the limma R package, 20 with adjusted P-values < .05 and |log2 fold change| > 1. To delve into the intricacies of the data, this research utilized the ClusterProfiler package to perform comprehensive functional enrichment analyses, which incorporated Gene Ontology (GO) and Kyoto Encyclopedia of Genes and Genomes (KEGG) pathway investigations. This meticulous approach illuminated the enriched biological processes and pathways specific to each subgroup, offering a clearer picture of the underlying mechanisms at play. 21
Construction of a Prognostic Model and its Internal and External Validation
To quantify the ADCD pattern within individual tumors, this research developed the ADCD-related score (ADCDRS). To start with, univariate Cox regression analysis was performed on differentially expressed genes (DEGs) to identify those significantly associated with overall survival (OS) in LIHC patients. In an effort to construct and assess prognostic ADCDRS models, patients were subsequently randomized into a training cohort (n = 156) and a testing cohort (n = 155). To minimize overfitting, least absolute shrinkage and selection operator (LASSO) Cox regression was conducted by utilizing the “glmnet” R package. 22 Before model fitting, continuous variables were standardized to a mean of 0 and standard deviation of 1. Ten-fold cross-validation determined the optimal penalty parameter (lambda), where λmin (minimum mean cross-validation error) was utilized for model construction, while λ1se (most regularized model within 1 standard error of the minimum) was used for comparison.
For verification, validation was performed through both internal and external approaches. Internally, the dataset was randomly split into training and testing sets (50% each). Externally, GSE14520 (445 samples) and GSE116174 (64 samples) were used as 2 independent GEO datasets. They underwent preprocessing and normalization consistent with the training set to assess model generalizability. The prognostic ADCDRS was calculated from multivariate Cox regression, where Coefi and Expi represent risk coefficients and gene expression levels. Patients in both cohorts were divided into low-risk group and high-risk group on the basis of median ADCDRS. Kaplan–Meier survival analysis was conducted to assess survival differences, while time-dependent ROC curve analysis was employed to evaluate predictive performance.
In addition, this research conducted a comprehensive comparative analysis of previously published models to evaluate the performance of the ADCDRS relative to other established prognostic signatures. A total of 10 distinct signatures, encompassing both mRNA- and lncRNA-based features, this research selected for evaluation. These signatures are associated with diverse biological processes, including lactylation, immune-related functions, glycolysis, amino acid metabolism, pyroptosis, and disulfidptosis. The concordance index (C-index) was used to assess and compare the predictive performance of the ADCDRS across multiple datasets associated with these alternative signatures. Statistical comparisons were subsequently performed to validate the superiority of the ADCDRS over the other models.
Construction and Validation of a Nomogram Scoring System
The rms software package was used to develop a nomogram that combined clinically significant characteristics with ADCDRS scores to predict overall survival. The nomogram assigns points to each relevant clinical variable, sums these points, and calculates a total predictive score. Receiver operating characteristic (ROC) curves were generated to assess the accuracy of the nomogram in predicting 1-, 3-, and 5-year survival. Model calibration was also performed to compare the predicted survival probability at these time points with the observed results to assess the predictive reliability of the nomogram.
Tumor Microenvironment Assessment
Leveraging the CIBERSORT algorithm, this research estimated the extent to which 22 different types of immune cells had infiltrated the tumor microenvironment in HCC cases. Subsequently, this study investigated how the ADCDRS score related to this immune cell infiltration. Additionally, the ESTIMATE algorithm was employed to calculate stromal, immune, and ESTIMATE scores, so as to compare patients sorted into high-risk and low-risk ADCDRS groups. 23
Significance of ADCDRS in Drug Sensitivity
To assess tailored treatment approaches, this research employed the oncoPredict R package to forecast chemotherapy response in HCC patients grouped by ADCDRS risk scores. 24 By comparing the patient’s tumor gene expression pattern with established cancer cell line data, OncoPredict infers IC50, or the concentration that causes growth arrest by 50%. The Wilcoxon test was employed to evaluate the disparities in drug IC50 values between high-risk and low-risk patient groups. Statistical significance was defined as a P-value of less than .05.
Statistical Analysis
Statistical analyses were executed with R software (version 4.3.1). Clinical characteristics between the training and internal validation cohorts were assessed by carrying out the chi-square test. As a non-parametric method, the Wilcoxon rank-sum test was applied to evaluate variables with non-normal distributions. Differentially expressed genes (DEGs) were identified on the basis of false discovery rate (FDR)-adjusted P-values. The study evaluated the disparity in overall survival rates across various patient groups by employing the Kaplan–Meier technique and the log-rank test. Key predictors of prognosis were pinpointed through both single-variable and multiple-variable Cox regression. The effectiveness of the model was assessed by utilizing ROC curves and the corresponding AUC. Spearman’s rank correlation was utilized to delve into the connections between risk assessments and the presence of immune cells. The threshold for statistical significance was set at P < .05 unless stated otherwise. Subsequently, this research omitted any features with over 20% of missing data from our analysis. For variables that had less than 20% missing data, mean substitution was employed for continuous data and mode substitution was utilized for categorical data. The imputation process was conducted utilizing the “mice” package within the R programming environment. Our research finding conforms to the TRIPOD + AI statement (Supplemental File 1). 25
Results
Single-Cell Transcriptomic Characterization of ADCD in HCC
To explore the cellular heterogeneity of ADCD in HCC, this research integrated a GEO single-cell RNA sequencing dataset (GSE149614), comprising 184 753 cells from HCC patients. To mitigate potential batch effects across samples, the Harmony package was applied to correct and harmonize the expression matrices, effectively aligning transcriptomic data from different sources. Subsequently, the top 2000 highly variable genes were selected for downstream analysis. Using principal component analysis (PCA) followed by Uniform Manifold Approximation and Projection (UMAP), we performed dimensionality reduction and clustered cells based on a neighborhood graph with a resolution of 1.5, which revealed 7 distinct cell clusters.
On the basis of canonical marker genes, cell-type annotation identified 7 major cell types: monocytes/macrophages, fibroblasts, epithelial cells, endothelial cells, plasma cells, B cells, and NK/T cells. The bubble plot displayed signature genes for each cell group (Figure 2A). The UMAP plot illustrates the clustering of cells (Figure 2B). To systematically evaluate ADCD activity across different cell types, this research curated a 367-gene ADCD signature and calculated per-cell activity scores by adopting the “AddModuleScore” function from the Seurat package. Among all cell types, monocytes/macrophages exhibited the highest ADCD activity.
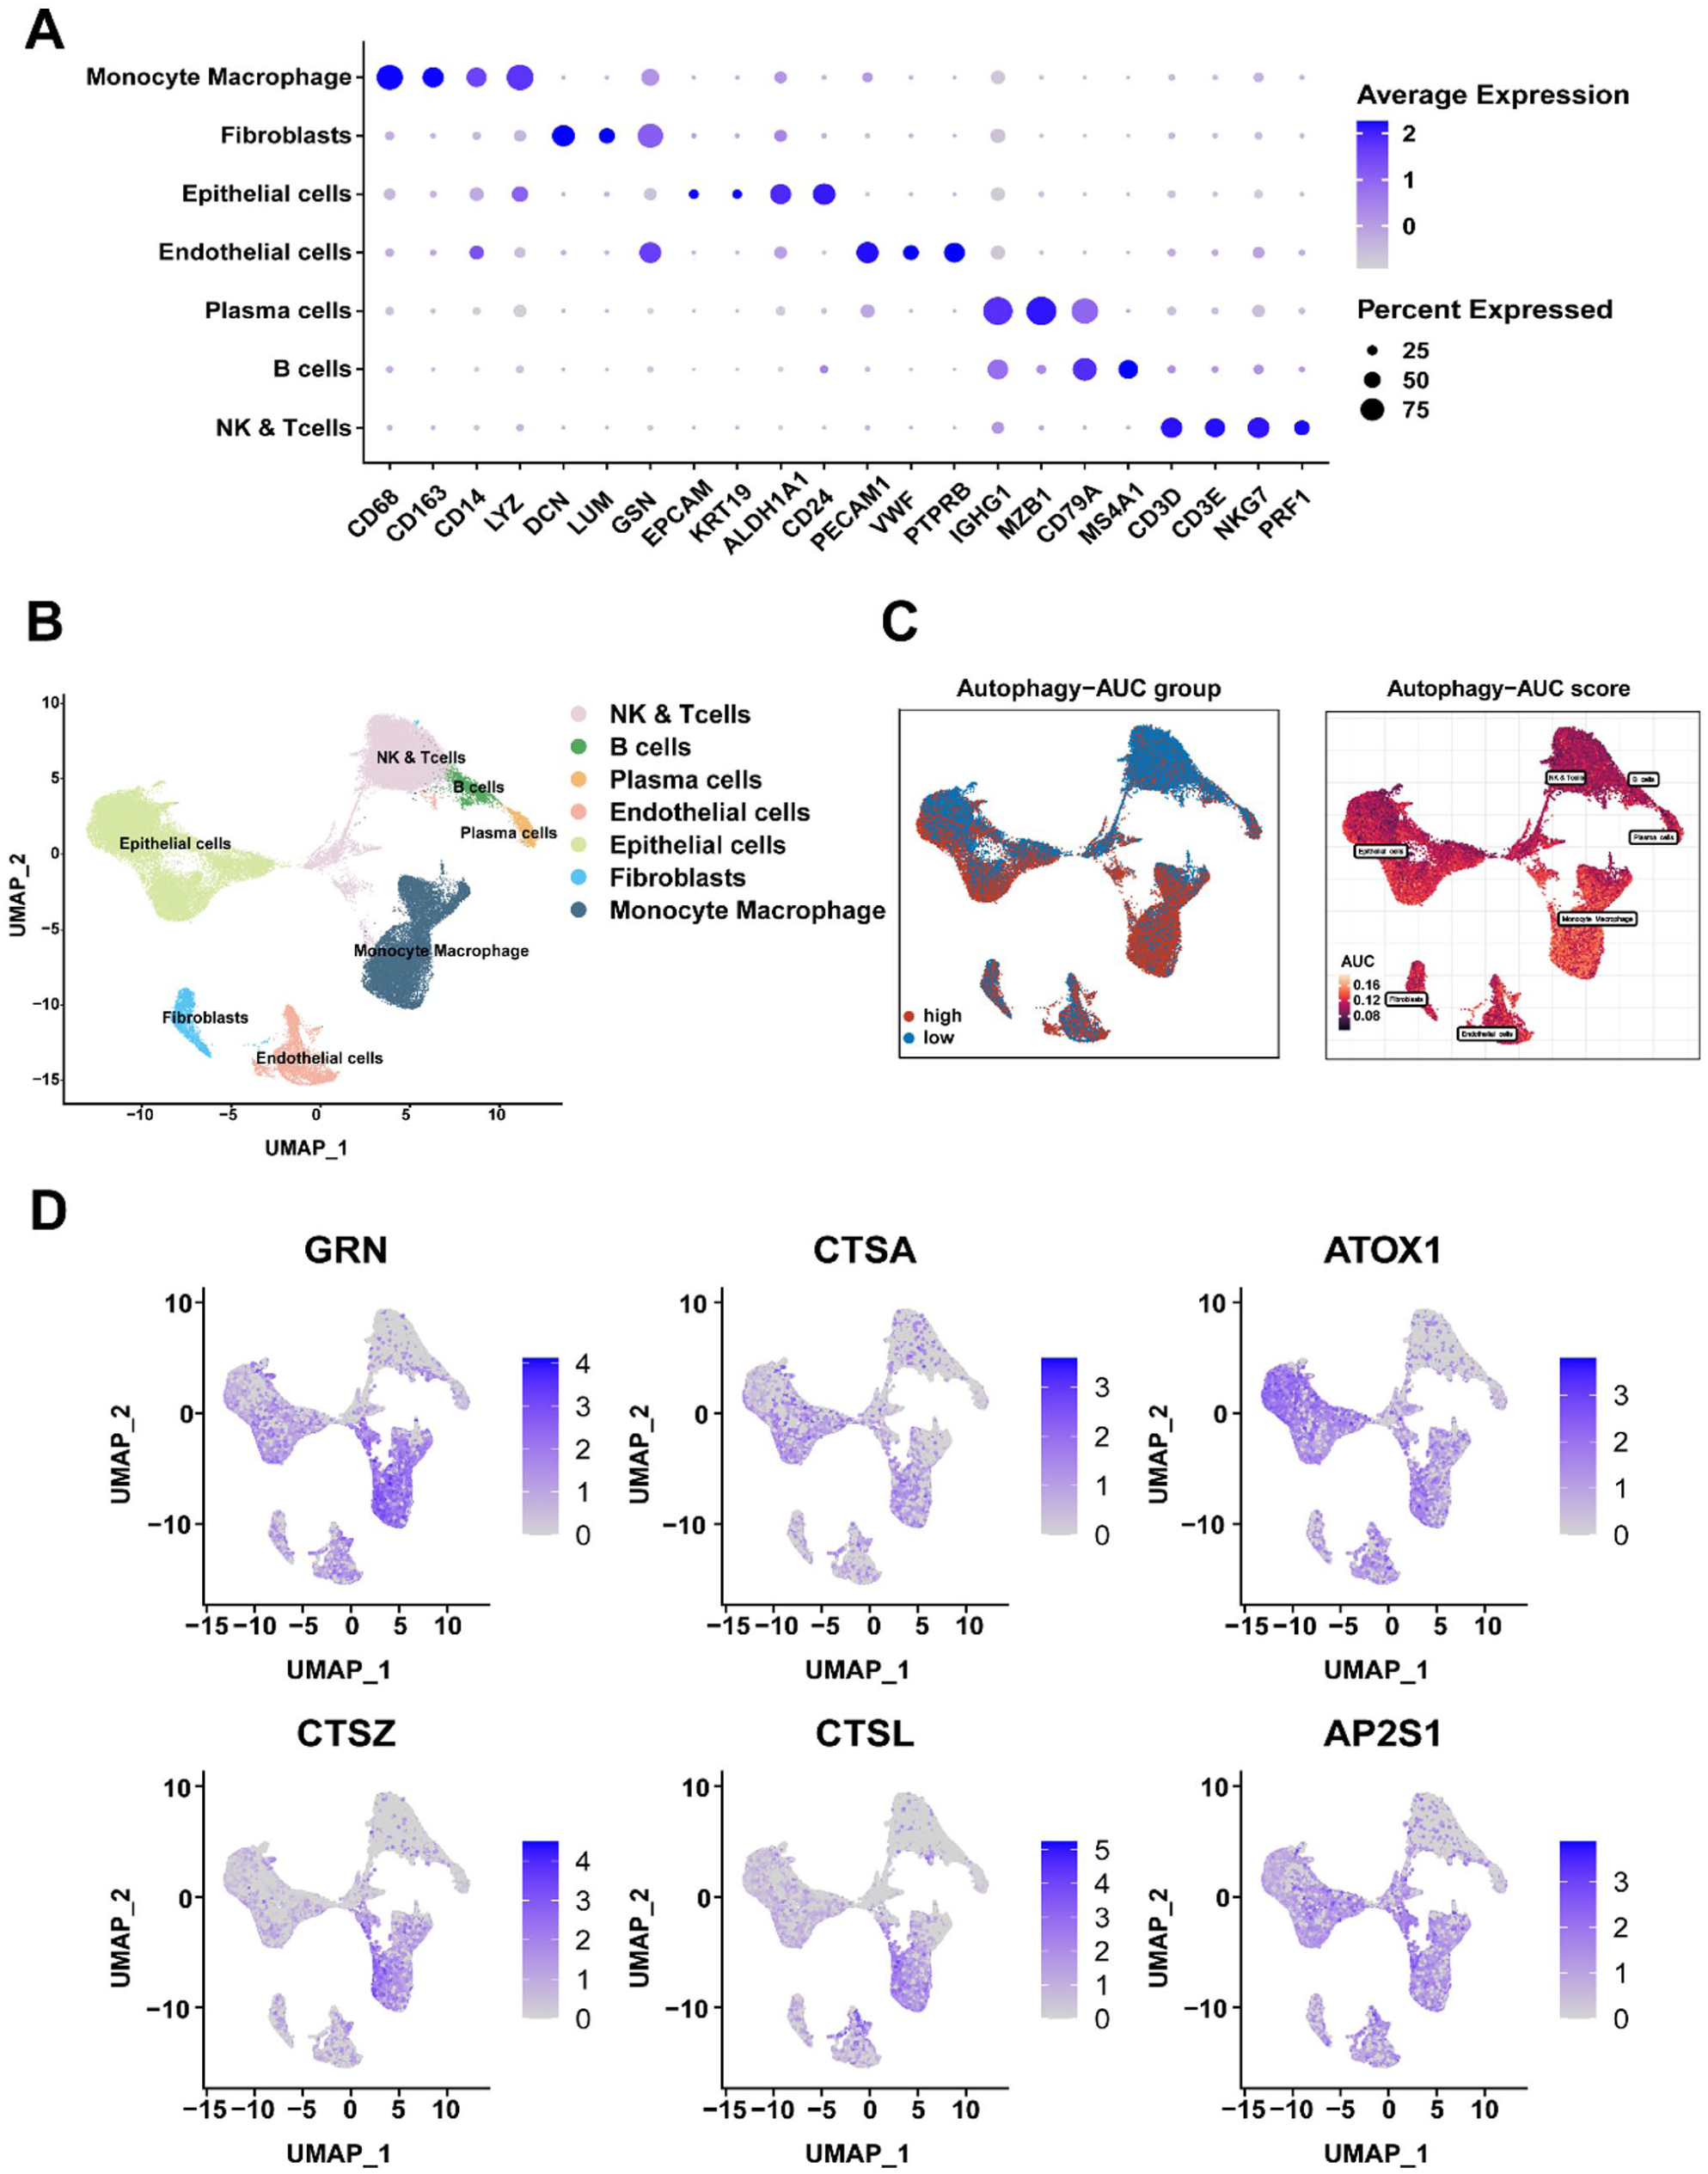
Characterization of ADCD in single-cell transcriptomes: (A) bubble plot revealing cell-type annotations rooted in canonical marker genes, (B) UMAP plot depicting the distribution of identified cell types, (C) distribution of ADCD activity scores among various cell populations, and (D) UMAP feature plots highlighting the expression of the top 6 ADCD-related differentially expressed genes (DEGs) at the single-cell level.
Cells were categorized into high- and low-activity groups. On this basis, differential expression analysis between these 2 groups identified 1044 ADCD-associated differentially expressed genes (DEGs), forming the basis for subsequent mechanistic investigation and functional validation (Figure 2C and Supplemental Table S2). Leveraging these DEGs, this research constructed a co-expression network at the single-cell level, with outliers removed to enhance network robustness. The top 6 hub genes within the network were visualized to highlight potential key regulators of ADCD activity (Figure 2D).
Identification of ADCD-Associated Modules and Core Genes in Bulk Transcriptome Data
To validate and expand upon findings from single-cell data, this research leveraged bulk RNA-seq data from the TCGA-LIHC cohort. ADCD activity scores were first computed for each tumor sample by carrying out single-sample gene set enrichment analysis (ssGSEA). This analysis was grounded in the 1044 DEGs derived from the single-cell analysis. These scores were subsequently used as phenotype traits in a weighted gene co-expression network analysis (WGCNA). This approach aimed to identify gene modules correlated with ADCD activity.
After hierarchical clustering and outlier exclusion, a soft-threshold power of β = 14 was chosen to construct a scale-free topology (Figure 3A). Nine distinct gene modules were identified in the resulting co-expression network (Figure 3B). Notably, the brown module exhibited the strongest and positive correlation with ADCD scores (Supplemental Table S3). Further analysis within the brown module demonstrated a significant and positive correlation between module membership and gene significance. This phenomenon indicates that genes in this module are highly functionally related to ADCD-related biological processes (Figure 3C).

Identification of ADCD-associated gene modules in bulk transcriptomes: (A) selection of the optimal soft-thresholding power in weighted gene co-expression network analysis (WGCNA), (B) module-trait relationship heatmap indicating a noticeable correlation between the MEbrown module and ADCD traits, (C) correlation between gene significance (GS) and module membership (MM) within the brown module, (D) principal component analysis (PCA) suggesting clear separation between tumor (red) and normal (blue) samples, (E) volcano plot displaying DEGs between tumor and normal tissues in TCGA-LIHC, and (F) Venn diagram illustrating the overlap between DEGs and genes in the MEbrown module.
As illustrated in a volcano plot and heatmap (Figure 3D and E; Supplemental Figure 1), differential gene expression analysis between HCC tumor and adjacent normal tissue samples revealed significant changes in gene expression. To identify core genes that are both differentially expressed and associated with ADCD, this research intersected the 183 genes in the brown module with DEGs identified from the TCGA-LIHC cohort (|log2fold change| > 0.5, FDR < 0.05), ultimately yielding 82 overlapping genes, which we designated as the ADCD core gene set (ADCDcore; Figure 3F; Supplemental Table S4). These genes exhibited consistent associations with ADCD at both the single-cell and bulk transcriptomic levels, thereby supporting their biological relevance.
Molecular Subtyping Rooted in ADCD-Related Prognostic Genes
To investigate the clinical relevance of ADCD-related transcriptional profiles in HCC, univariate Cox regression analysis was conducted on the 82 ADCDcore genes. This analysis identified 18 genes significantly associated with overall survival (OS), indicating their potential prognostic value and functional relevance in disease progression (Figure 4A).

Molecular subtyping rooted in ADCD-related prognostic genes: (A) forest plot of univariate Cox regression identifying 18 prognostic genes significantly associated with overall survival (P < .05), (B) consensus matrix heatmap indicating optimal clustering at k = 2, (C) Kaplan-Meier survival curves illustrating overall survival (OS) differences between these 2 subtypes, (D) PCA revealing transcriptomic separation between ADCD subtypes, and (E) gene expression comparison between Cluster C1 and C2 for the 18 prognostic genes.
To further explore the molecular heterogeneity of HCC driven by these ADCD-related prognostic genes, consensus clustering was performed on 311 HCC samples from the TCGA-LIHC cohort. This unsupervised clustering approach stratified patients into 2 robust molecular subtypes: Cluster 1 (C1, n = 171) and Cluster 2 (C2, n = 140), each characterized by unique biological features (Figure 4B; Supplemental Figure 2 and 3; Supplemental Table S5).
Survival analysis revealed that patients in C1 exhibited significantly worse overall survival compared to those in C2 (Figure 4C; Supplemental Table S6), suggesting that these ADCD-defined molecular subtypes possess conspicuous prognostic relevance. In addition, a comprehensive heatmap analysis illustrated the clinical features associated with each subtype (Supplemental Figure 4), highlighting differences in demographic and pathological variables.
Consistent with their prognostic divergence, gene expression profiles of ADCD-related genes differed markedly between these 2 clusters, which clearly reflected underlying variation in ADCD activity. Grounded in global transcriptomic profiles (Figure 4D), principal component analysis (PCA) further confirmed the separation of these 2 subtypes, thereby supporting the robustness of the classification. Notably, the expression levels of ADCD-related genes (ADCDRs) were significantly elevated in C1 compared to C2, which aligned with the higher ADCD activity previously observed in both single-cell and bulk datasets (Figure 4E).
Construction and Validation of the ADCD-Related Prognostic Model
Grounded in 82 module genes related to autophagy-dependent cell death (ADCD), this research constructed a prognostic model to develop a clinically applicable tool for risk stratification. A total of 311 participants were randomly assigned into a training cohort (n = 156) and a validation cohort (n = 155) in a 1:1 ratio by adopting the “caret” package in R. In the training cohort, Least Absolute Shrinkage and Selection Operator Cox (LASSO-Cox) regression analysis was performed to reduce model complexity and prevent overfitting. Through 10-fold cross-validation and minimizing the partial likelihood deviance, an optimal lambda (λ) value was selected, and a prognostic model comprising 9 genes was ultimately established (Figure 5A and B).

Construction, validation, and performance evaluation of the ADCD-related prognostic signature (ADCDRS): (A and B) LASSO regression plots illustrating optimal λ selection rooted in minimum partial likelihood deviance, (C and D) distribution of survival status and ADCDRS scores in the training and testing cohorts, and (E–L) Kaplan-Meier OS curves and ROC curves for the training set, testing set, and external validation sets (GSE14520 and GSE116174), demonstrating discrimination between high-risk and low-risk groups and predicting 1-, 2-, and 3-year OS. *P < .05, ***P < .001.
An ADCD-related risk score (ADCDRS) was subsequently calculated for each patient according to the following formula: ADCDRS = (0.50054 × RNF186) + (0.53862 × C1orf216) − (0.45116 × CASQ2) − (1.76380 × TNR) − (0.94524 × IL18RAP) + (0.58077 × HOXD9) + (0.44966 × CCR3) + (0.41379 × PLOD2) + (0.67781 × SSR3).
Rooted in the median risk score derived from the model, patients were stratified into high-risk and low-risk groups. The expression of the 9 model genes differed significantly between these 2 groups. Furthermore, their distribution corresponded well with the previously defined ADCD molecular subtypes, suggesting a close association between these stratification indicators. Specifically, high-risk scores were predominantly associated with the poor-prognosis C1 subtype, while low-risk scores were enriched in the favorable C2 subtype. These findings indicate a noticeable consistency between the ADCD molecular subtypes and the ADCD-related risk score (ADCDRS), reinforcing the biological and prognostic relevance of the model.
Performance Evaluation of the ADCDRS Model
To systematically evaluate the prognostic performance of the ADCDRS model, survival analyses were conducted in the training set, validation set, and the entire TCGA cohort. In all datasets, patients in the high-risk group demonstrated significantly reduced overall survival compared to those in the low-risk group (Figure 5C–F), thereby affirming the model’s predictive capacity.
Further characterization of the model genes revealed that RNF186, C1orf216, HOXD9, CCR3, PLOD2, and SSR3 were markedly up-regulated in the high-risk group, suggesting potential roles in promoting tumor progression or immune evasion. Conversely, CASQ2, TNR, and IL18RAP were more highly expressed in the low-risk group, consistent with a protective phenotype and their biological relevance to ADCD-related prognostic mechanisms (Supplemental Figure 5).
Time-dependent receiver operating characteristic (ROC) curve analysis was conducted to assess the predictive accuracy of the model. In the training cohort, the area under the ROC curve (AUC) values for 1-, 2-, and 3-year survival were 0.87, 0.86, and 0.82, respectively. In the validation cohort, the corresponding AUC values were 0.73, 0.69, and 0.68, respectively (Figure 5G and H), which suggested desirable generalizability and robustness across independent datasets.
To further validate the clinical utility of the ADCDRS model, its performance was assessed in 2 external GEO cohorts (GSE14520 and GSE116174). Consistent with TCGA results, the model effectively stratified patients into prognostically distinct subgroups. Under such circumstance, survival and ROC analyses confirmed its predictive efficacy across diverse populations (Figure 5I–L).
Pathway Enrichment Reveals Translational and Autophagic Dysregulation in ADCD High-Risk Subtypes
Through C-index evaluation, ADCDRS showed consistent and favorable prognostic performance compared to other previously reported gene feature models on multiple independent datasets, indicating its potential robustness and universality (Figure 6A–C).
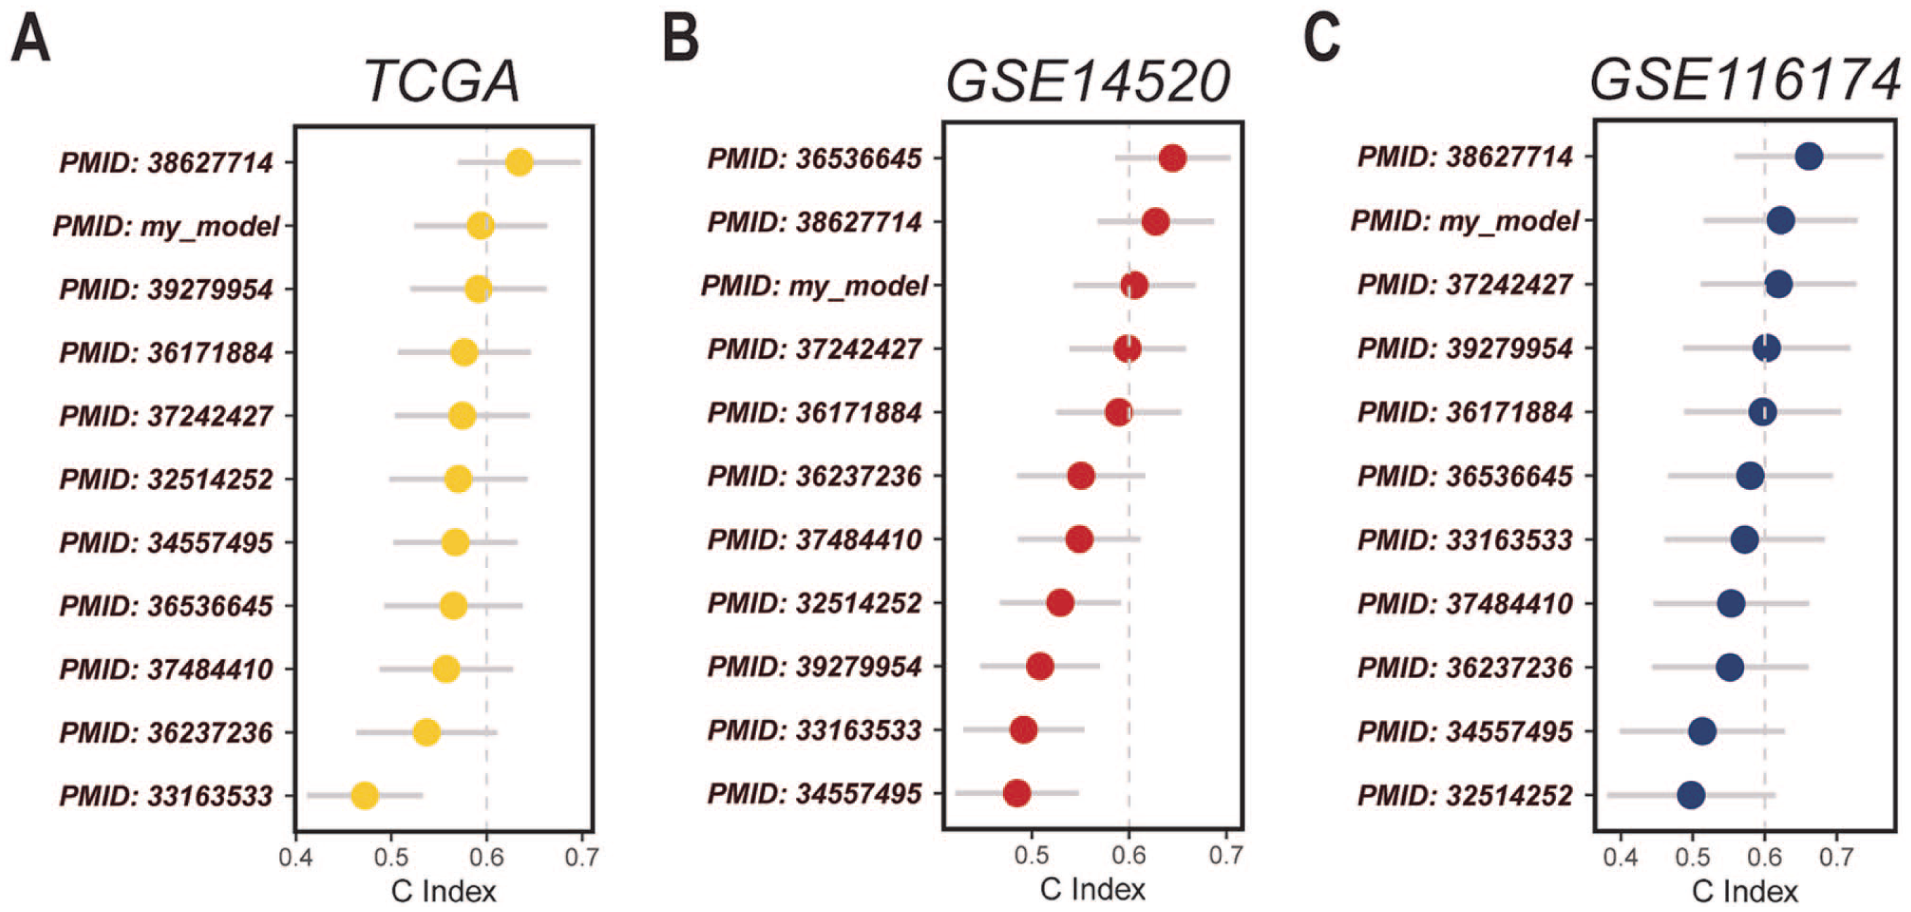
C-index–based comparison of the ADCDRS with previously reported prognostic gene signature models across TCGA and independent GEO cohorts: (A) TCGA cohort, (B) GSE14520 cohort, and (C) GSE116174 cohort.
To explore the underlying biological processes distinguishing between high- and low-risk groups defined by the ADCDRS model, this research conducted differential expression analysis, followed by Gene Ontology (GO) and Kyoto Encyclopedia of Genes and Genomes (KEGG) enrichment analyses.
GO enrichment analysis revealed that differentially expressed genes in the high-risk group were significantly associated with key biological processes, including ribosome biogenesis, ncRNA processing, RNA splicing, rRNA metabolic process, and chromosome segregation (Figure 7A). This unique enrichment suggests extensive dysregulation of RNA metabolism, genome stability, and translational control in the high-risk phenotype. Additionally, enrichment in DNA replication and chromosome organization pathways indicates heightened proliferative activity, which aligns with the aggressive clinical course observed in high-risk patients.

Functional enrichment, prognostic independence, and clinical utility of the ADCDRS model: (A) gene ontology (GO) enrichment analysis of DEGs between ADCD subtypes, (B) KEGG pathway enrichment analysis of the same DEGs, (C and D) forest plot from univariate and multivariate Cox regression analyses confirming ADCDRS as an independent prognostic factor, (E) violin plot of ADCDRS distribution across different ADCD gene expression subtypes, and (F) nomogram integrating clinical variables (age, gender, stage) and ADCDRS for individualized OS prediction. *P < .05; ***P < .001.
KEGG pathway analysis further demonstrated enrichment in pathways related to nucleocytoplasmic transport, cell cycle regulation, protein processing in the endoplasmic reticulum, ubiquitin-mediated proteolysis, and autophagy (Figure 7B). These findings underscore a critical involvement of proteostasis and intracellular trafficking mechanisms in the pathogenesis of ADCD-mediated tumor progression. The prominence of autophagy-related pathways supports the central role of ADCD in shaping tumor biology in HCC.
The top 20 enriched GO terms and KEGG pathways were visualized in bubble plots, highlighting distinct molecular programs operative within the ADCD risk subtypes.
Independent Prognostic Value of the ADCDRS Model
To determine whether the ADCDRS risk score provides independent prognostic information beyond conventional clinical parameters, both univariate and multivariate Cox regression analyses were performed by utilizing data from the TCGA-LIHC cohort (Supplemental Table S7).
Univariate analysis revealed that the ADCDRS risk score was significantly associated with overall survival (P < .01), along with the TNM stage (P < .01), whereas age and gender were not statistically significant predictors (Figure 7C). More importantly, multivariate analysis further confirmed that the ADCDRS score (P < .01) and TNM stage (P < .01) remained independent prognostic factors, suggesting that the ADCDRS model captures critical risk features beyond conventional clinical covariates (Figure 7D). These findings suggest that the ADCDRS model captures biologically meaningful and clinically relevant information not encompassed by traditional staging systems.
Afterward, a Sankey diagram was generated to visualize the interplay among gene expression subtypes, risk groups, and patient outcomes, illustrating the distributional relationships and highlighting the prognostic significance of ADCD-driven transcriptional variation (Supplemental Figure 6). In addition, comparison of risk scores across ADCD gene expression subtypes demonstrated statistically significant differences. This phenomenon further reinforced the link between molecular subtype and patient prognosis (Figure 7E).
Construction of a Nomogram and Development of an Individualized Survival Prediction Tool
To elevate the clinical applicability of the ADCDRS model, we developed a nomogram that integrates key clinical variables (age, sex, TNM stage) with the ADCDRS risk score. This was achieved using multivariate Cox regression implemented through the rms package in R. This tool enables the individualized prediction of 1-, 3-, and 5-year overall survival probabilities for HCC patients (Figure 7F).
Each component of the nomogram contributes a weighted score, thereby allowing for a total prognostic score that reflects individual patient risk. Calibration curve analysis demonstrated excellent uniformity between predicted and observed survival outcomes across multiple time points, indicating high model reliability and clinical utility (Supplemental Figure 7). This nomogram provides a practical and interpretable tool to support personalized risk assessment and therapeutic decision-making in the clinical management of HCC.
ADCDRS Model and Tumor Microenvironment Analysis
Given the established interplay between autophagy and immune responses, this research further investigated the relationship between ADCDRS-defined risk groups and the tumor immune microenvironment. Immune cell infiltration levels were estimated using the CIBERSORT algorithm. This method was applied to the TCGA-LIHC transcriptomic dataset.
To further clarify whether these immune phenotypes are direct consequences of ADCD regulation or instead correlate with ADCDRS stratification, this research leveraged our integrated single-cell RNA-seq dataset described above. The single-cell atlas showed that ADCD activity was predominantly enriched in monocytes/macrophages, key coordinators of antigen processing, cytokine production, and immunometabolic remodeling. By linking bulk-level ADCDRS to cell type–resolved ADCD programs, this research observed that ADCD-high myeloid cells exhibited higher expression of gene programs related to lysosomal activity, oxidative stress responses, and phagocytic remodeling, which have been proven to be correlated with shaping dendritic-cell maturation, T-cell priming, and neutrophil recruitment. Collectively, these findings suggest that although causality will require further experimental validation, the immune signatures observed between high- and low-risk groups may be biologically grounded in myeloid-associated ADCD programs within the tumor microenvironment. Thus, integrating single-cell data provides additional mechanistic context linking ADCDRS-defined risk groups to specific immune microenvironmental phenotypes.
Significant differences in immune cell composition were observed between the high- and low-risk groups (Figure 8B–H). Specifically, the high-risk group showed increased infiltration of activated mast cells and neutrophils, indicating the formation of an immunosuppressive TME potentially facilitating immune evasion and tumor progression. 26 In contrast, the low-risk group exhibited elevated levels of dendritic cells, resting mast cells, CD4+ T cells, and regulatory T cells (Tregs), suggesting an immune-infiltrated microenvironment with immunoregulatory features. 27

Association between ADCDRS scores and immune cell infiltration: (A) correlation matrix suggesting associations between model genes and various immune cell types and (B–H) scatter plots revealing the relationship between risk score and immune cell proportions in high-risk and low-risk groups.
Further analysis revealed that several core ADCD-related genes were highly expressed in macrophages, suggesting that ADCD activity may influence innate immune cell function. ADCD plays a dual role in tumor-immune dynamics. To be specific, it can not only promote pro-inflammatory anti-tumor responses, but also facilitate immune escape under immunosuppressive conditions. This highlights its complex impact on the tumor microenvironment.
In our ADCD-based risk model, dendritic cells (DCs) were markedly enriched in the low-risk group, whereas their infiltration was significantly reduced in the high-risk group. As the most potent antigen-presenting cells, DCs efficiently capture, process, and present tumor-associated antigens via major histocompatibility complex (MHC) molecules to naïve T cells, which immensely promoted the activation of cytotoxic CD8+ T lymphocytes and initiated specific antitumor immune responses. 28 Additionally, DCs secrete type I interferons (eg, IFN-α) and express costimulatory molecules such as CD80 and CD86, 29 which are essential for T cell priming and the formation of functional immune synapses. 30 Therefore, the increased abundance of DCs in the low-risk group may reflect a more immunocompetent tumor microenvironment. Moreover, it may also contribute to improved immune surveillance and favorable prognosis.
In contrast, the reduction of DCs in the high-risk group suggests a more immunosuppressive tumor context, which may result from tumor-derived inhibitory cytokines, metabolic dysregulation (eg, lactate accumulation), or impaired ADCD signaling.29,30 Such an immune-repressive milieu could compromise antigen presentation and hinder effective T cell activation, ultimately promoting immune evasion.
Correlation analysis between the 9 ADCD genes and immune cell subsets revealed significant associations with various immune populations, reinforcing their functional relevance (Figure 8A). Furthermore, ESTIMATE analysis showed that low-risk patients had significantly higher stromal, immune, and composite ESTIMATE scores, which demonstrated reduced tumor purity and intensified immune cell infiltration (Figure 9A).

Immune landscape and drug sensitivity analysis grounded in ADCDRS-defined risk groups: (A) correlation of ADCDRS scores with immune and stromal cell content in the tumor microenvironment and (B–G) Drug sensitivity analysis suggesting differential responses to Bortezomib, MK-1775, Gemcitabine, Vorinostat, Obatoclax Mesylate, and Selumetinib across high- and low-risk groups.
Drug Sensitivity Analysis
To assess the potential clinical implications of ADCD-driven molecular subtypes in guiding treatment strategies, this research evaluated drug sensitivity profiles by utilizing the “oncoPredict” R package. Predicted responses to commonly used and investigational agents were compared across ADCDRS-defined risk groups.
Distinct drug response patterns emerged between high- and low-risk groups. Specifically, Bortezomib, and MK-1775 were predicted to be more effective in low-risk patients, suggesting potential therapeutic benefit in this subgroup (Figure 9B and C). In contrast, Gemcitabine, Vorinostat, Obatoclax Mesylate, and Selumetinib exhibited higher efficacy in the high-risk group (Figure 9D–G), indicating that these agents may be more suitable for individuals suffering from aggressive ADCD-driven disease.
These results underscore the potential of the ADCDRS model not only as a prognostic tool but also as a predictive biomarker to guide personalized treatment selection. By linking transcriptional features with pharmacologic sensitivity, the model offers valuable insights for the development of risk-adapted therapeutic regimens in HCC. However, these drug sensitivity estimates remain computational in nature and should be interpreted with caution. Rather than providing definitive evidence of therapeutic efficacy, they serve as hypothesis-generating insights that require subsequent experimental and prospective clinical validation.
Discussion
As a highly heterogeneous primary malignancy, HCC poses considerable challenges in diagnosis, prognosis, and therapeutic stratification.1,5 Despite advances in systemic treatments, such as ICIs and TKIs, durable responses remain limited to a subset of patients.8,31 Conventional clinical parameters, including TNM staging and alpha-fetoprotein (AFP) levels, fail to capture the molecular diversity and immune complexity of HCC. 32 There is a pressing need for biologically driven risk assessment models reflecting tumor-intrinsic behavior and inter-patient variability.
This research concentrated on ADCD, a non-canonical form of programmed cell death distinct from classical apoptosis.11,33 Characterized by irreversible cellular demise resulting from sustained or excessive autophagic activation, ADCD leads to structural disintegration and functional collapse. 9 Although it was historically viewed as a secondary consequence of cellular stress, growing evidence supports a more active role for ADCD in tumor progression, immune evasion, and therapeutic response.12,34 Leveraging both single-cell and bulk transcriptomic data, this research not only proposed ADCD as a novel biological axis in HCC, but also constructed a robust prognostic model—the ADCDRS—to stratify patients according to molecular risk.
Unlike prior models that fix predominant attention on early autophagic machinery (eg, ATG family genes), 35 ADCDRS targets the transcriptional features of autophagic cell death execution. 11 The key genes incorporated in ADCDRS—such as RNF186, HOXD9, and PLOD2—are functionally linked to endoplasmic reticulum stress, epithelial-mesenchymal transition (EMT), and tumor stemness.36 -38 In contrast, protective genes including IL18RAP, CASQ2, and TNR are associated with immune activation, calcium homeostasis, and pro-death signaling pathways.39 -41 This functional dichotomy underscores the dualistic nature of ADCD as both a cytotoxic endpoint and a regulatory hub integrating metabolic stress and immune surveillance. 42
To support the biological rationale of ADCDRS, several constituent genes have demonstrated the mechanistic correlation between autophagy dysregulation, stress adaptation, and malignant progression. As an ER-resident E3 ligase, RNF186 modulates ER-stress signaling, unfolded protein response, and ER-phagy; its upregulation may heighten susceptibility to ER stress–induced autophagic overactivation, thereby promoting transition into ADCD. 43 As a homeobox transcription factor known to drive oncogenic transcriptional programs, HOXD9 plays a key role in tumor growth, invasion, and metastasis. 44 In HCC, although its specific role requires further investigation, it may influence the expression of autophagy-related genes through transcriptional regulation, thereby affecting tumor cells’ susceptibility to autophagic cell death signaling. PLOD2 facilitates extracellular matrix remodeling and hypoxia adaptation. Altogether, the above 2 processes can not only amplify autophagy to cytotoxic levels, but also promote ADCD under sustained microenvironmental stress. 45
Other than RNF186, HOXD9, and PLOD2, the remaining 6 genes in the ADCDRS may also be involved in autophagy-dependent cell death (ADCD) through immune-inflammation, proteostasis/ER stress, Ca 2 + signaling, and ECM-related pathways. As a component of the IL-18 receptor complex, IL18RAP is higher in the low-risk group, suggesting its role in immune activation and antigen presentation. 40 In contrast, CCR3, which is higher in the high-risk group, may be linked to immune remodeling associated with an immunosuppressive or immune-evasive tumor microenvironment. 46 SSR3, involved in protein translocation and ER stress, may influence autophagy through proteostasis disruption. 47 As a binding protein involved in intracellular calcium storage and buffering, CASQ2 may be related to autophagy regulation through the Ca2+ signaling pathway. For example, intracellular Ca2+ signaling plays a crucial role in regulating autophagy flux. 48 As an ECM protein, TNR is associated with tumor adaptation and immune responses through ECM-related autophagy regulation.49,50 C1orf216 (UPF0500) has limited functional annotation, and its role in ADCD requires further investigation. These genes provide a biologically plausible framework for ADCD, but their roles in immune phenotypes and drug sensitivity remain to be validated experimentally.
Notably, ADCDRS demonstrated significant correlation with immune infiltration, particularly with macrophages, CD4+ T cells, and neutrophils, suggesting that ADCD is embedded within the broader tumor-immune landscape. 51 This phenomenon not only aligns with the dual roles of autophagy in tumor immunity, but also highlights the potential crosstalk between ADCD and immunogenic cell death (ICD). 52 Genes such as RNF186 and IL18RAP, which are simultaneously involved in stress response and antigen presentation, further highlight this mechanistic interplay.37,40 This suggests that ADCD may modulate tumor immunogenicity and shape anti-tumor immunity, thereby opening avenues for combined ADCD–immunotherapy strategies.
To facilitate an integrated interpretation of our findings, this research presents a schematic model summarizing the proposed hypothesis and key observed outcomes associated with ADCDRS stratification (Figure 10). Characterized by relatively enhanced antigen presentation, dendritic-cell surveillance, and T-cell priming, the low-ADCDRS group is portrayed as a more immune-competent state in this framework. Conversely, the high-ADCDRS group is associated with a more immunosuppressive tumor microenvironment, potentially linked to ADCD-active programs within tumor-infiltrating myeloid populations and reduced antigen-presenting capacity. The schematic emphasizes that these immune differences are inferred from integrated bulk and single-cell observations. Therefore, they should be interpreted as hypothesis-generating. This conceptual contrast aligns with the observed prognostic separation between ADCDRS-defined risk groups. It also motivates future studies to investigate ADCD–immunity crosstalk and treatment stratification in prospective cohorts. Accordingly, Figure 10 visually synthesizes our central concept and highlights testable directions for future mechanistic validation.

Hypothesis-generating schematic of ADCDRS-associated immune states in HCC. Rooted in integrated bulk and single-cell analyses, low ADCDRS is depicted as a relatively immune-activated TME with enhanced antigen presentation and T-cell priming, whereas high ADCDRS is shown as an immunosuppressive-like TME with impaired antigen-presenting capacity, potentially linked to ADCD-active myeloid programs. This model is hypothesis-generating and requires future mechanistic and prospective validation.
From a prognostic standpoint, the ADCDRS exhibited superior predictive power compared to conventional staging systems. While the BCLC staging system has shown a C-index of 0.63 in advanced HCC, 53 ADCDRS achieved AUROC values exceeding 0.75, including antiviral therapy subgroups. Compared with other autophagy-based models, such as the 5-autophagy-related lncRNA signature (AUC = 0.751, C-index = 0.745) proposed by Deng et al., 54 and the autophagy-related gene pair (ARGP) model (AUC = 0.786–0.828) developed by Luo et al., 55 ADCDRS offers a conceptual advancement by anchoring prognosis in a mechanistically distinct and death-execution phenotype, rather than relying solely on statistical associations or interpretability.
Aside from prognostication, the ADCDRS also holds potential for informing therapeutic strategies. Drug sensitivity analysis indicated that, as defined by ADCDRS, high-risk patients may be more responsive to agents modulating autophagy or ER stress, such as Vorinostat and Obatoclax Mesylate, highlighting the feasibility of synthetic lethality strategies targeting the ADCD axis.56,57 Moreover, the ADCDRS demonstrated meaningful associations with immunotherapy response signatures, suggesting its utility in predicting immunotherapeutic sensitivity and guiding treatment selection. These findings collectively indicate that ADCDRS may support patient stratification, risk-adapted therapy, and biomarker-driven decision-making in clinical settings.
Nevertheless, several limitations merit consideration. First, our analyses were grounded in retrospective, publicly available databases; in future studies, prospective clinical validation is essential to confirm the utility of the ADCDRS in real-world settings. Second, while the included genes exhibit remarkable biological plausibility, their functional roles in HCC progression and immunomodulation require further mechanistic validation in vitro and in vivo. Third, drug sensitivity estimates are computational predictions and should be interpreted cautiously as hypothesis-generating rather than definitive evidence of therapeutic benefit.
In summary, this study positions ADCD as a novel prognostic and therapeutic axis in HCC. The ADCDRS model provides a biologically grounded and clinically applicable framework for patient stratification, capturing the intersection of autophagy, cell death execution, and immune dynamics. These findings not only improve our understanding of HCC pathobiology but also lay the foundation for future research targeting ADCD in combination with immunotherapies and cell death modulators. Such work ultimately advances precision oncology in HCC.
The ADCDRS signature may be advantageous for us to refine patient stratification, inform therapeutic decision-making, and complement existing prognostic biomarkers in HCC. Future studies integrating ADCD-related markers with clinical variables, immunotherapy response signatures, and proteomic profiles may further enhance its predictive robustness. Moreover, prospective clinical cohorts and experimental validation of ADCD-associated genes will be essential to elucidate their mechanistic functions and assess their translational utility.
Limitations
Although we performed external validation by utilizing GEO datasets, no prospective or real-world clinical cohort was available for further confirmation. This limitation has been acknowledged. On that account, future multi-center prospective studies will be required to validate the clinical utility of the ADCDRS.
Conclusion
In summary, our study provides a comprehensive characterization of ADCD in HCC at both single-cell and bulk transcriptomic levels. On top of that, this study developed and validated a robust prognostic model—the ADCDRS—comprising 9 key ADCD-related genes, which effectively stratifies patients grounded in survival risk and predicts response to chemotherapy and immunomodulatory agents.
Through an integrated nomogram, the ADCDRS model demonstrates remarkable prognostic performance and potential for clinical translation, which not only offers personalized survival predictions, but also guides individualized treatment strategies. Moreover, its association with distinct immune landscapes and drug sensitivity profiles underscores the clinical relevance of ADCD in shaping tumor biology and therapeutic outcomes.
Our findings highlight ADCD as a critical and under-explored dimension of tumor pathophysiology in HCC. It is particularly noteworthy that our findings also hold promising implications for the development of novel biomarkers and targeted therapies. This study lays the groundwork for future research into ADCD-targeted interventions, ultimately advancing the precision medicine paradigm in liver cancer management.
Supplemental Material
sj-docx-9-cix-10.1177_11769351261426577 – Supplemental material for A Prognostic 9-Gene Signature Linked to Autophagy-Dependent Cell Death in Hepatocellular Carcinoma
Supplemental material, sj-docx-9-cix-10.1177_11769351261426577 for A Prognostic 9-Gene Signature Linked to Autophagy-Dependent Cell Death in Hepatocellular Carcinoma by Jin Zhang, Linze Xu, Hao Wang, Dandan Wu, Huikai Li, Yueguo Li and Yang Liu in Cancer Informatics
Supplemental Material
sj-pdf-8-cix-10.1177_11769351261426577 – Supplemental material for A Prognostic 9-Gene Signature Linked to Autophagy-Dependent Cell Death in Hepatocellular Carcinoma
Supplemental material, sj-pdf-8-cix-10.1177_11769351261426577 for A Prognostic 9-Gene Signature Linked to Autophagy-Dependent Cell Death in Hepatocellular Carcinoma by Jin Zhang, Linze Xu, Hao Wang, Dandan Wu, Huikai Li, Yueguo Li and Yang Liu in Cancer Informatics
Supplemental Material
sj-xlsx-1-cix-10.1177_11769351261426577 – Supplemental material for A Prognostic 9-Gene Signature Linked to Autophagy-Dependent Cell Death in Hepatocellular Carcinoma
Supplemental material, sj-xlsx-1-cix-10.1177_11769351261426577 for A Prognostic 9-Gene Signature Linked to Autophagy-Dependent Cell Death in Hepatocellular Carcinoma by Jin Zhang, Linze Xu, Hao Wang, Dandan Wu, Huikai Li, Yueguo Li and Yang Liu in Cancer Informatics
Supplemental Material
sj-xlsx-2-cix-10.1177_11769351261426577 – Supplemental material for A Prognostic 9-Gene Signature Linked to Autophagy-Dependent Cell Death in Hepatocellular Carcinoma
Supplemental material, sj-xlsx-2-cix-10.1177_11769351261426577 for A Prognostic 9-Gene Signature Linked to Autophagy-Dependent Cell Death in Hepatocellular Carcinoma by Jin Zhang, Linze Xu, Hao Wang, Dandan Wu, Huikai Li, Yueguo Li and Yang Liu in Cancer Informatics
Supplemental Material
sj-xlsx-3-cix-10.1177_11769351261426577 – Supplemental material for A Prognostic 9-Gene Signature Linked to Autophagy-Dependent Cell Death in Hepatocellular Carcinoma
Supplemental material, sj-xlsx-3-cix-10.1177_11769351261426577 for A Prognostic 9-Gene Signature Linked to Autophagy-Dependent Cell Death in Hepatocellular Carcinoma by Jin Zhang, Linze Xu, Hao Wang, Dandan Wu, Huikai Li, Yueguo Li and Yang Liu in Cancer Informatics
Supplemental Material
sj-xlsx-4-cix-10.1177_11769351261426577 – Supplemental material for A Prognostic 9-Gene Signature Linked to Autophagy-Dependent Cell Death in Hepatocellular Carcinoma
Supplemental material, sj-xlsx-4-cix-10.1177_11769351261426577 for A Prognostic 9-Gene Signature Linked to Autophagy-Dependent Cell Death in Hepatocellular Carcinoma by Jin Zhang, Linze Xu, Hao Wang, Dandan Wu, Huikai Li, Yueguo Li and Yang Liu in Cancer Informatics
Supplemental Material
sj-xlsx-5-cix-10.1177_11769351261426577 – Supplemental material for A Prognostic 9-Gene Signature Linked to Autophagy-Dependent Cell Death in Hepatocellular Carcinoma
Supplemental material, sj-xlsx-5-cix-10.1177_11769351261426577 for A Prognostic 9-Gene Signature Linked to Autophagy-Dependent Cell Death in Hepatocellular Carcinoma by Jin Zhang, Linze Xu, Hao Wang, Dandan Wu, Huikai Li, Yueguo Li and Yang Liu in Cancer Informatics
Supplemental Material
sj-xlsx-6-cix-10.1177_11769351261426577 – Supplemental material for A Prognostic 9-Gene Signature Linked to Autophagy-Dependent Cell Death in Hepatocellular Carcinoma
Supplemental material, sj-xlsx-6-cix-10.1177_11769351261426577 for A Prognostic 9-Gene Signature Linked to Autophagy-Dependent Cell Death in Hepatocellular Carcinoma by Jin Zhang, Linze Xu, Hao Wang, Dandan Wu, Huikai Li, Yueguo Li and Yang Liu in Cancer Informatics
Supplemental Material
sj-xlsx-7-cix-10.1177_11769351261426577 – Supplemental material for A Prognostic 9-Gene Signature Linked to Autophagy-Dependent Cell Death in Hepatocellular Carcinoma
Supplemental material, sj-xlsx-7-cix-10.1177_11769351261426577 for A Prognostic 9-Gene Signature Linked to Autophagy-Dependent Cell Death in Hepatocellular Carcinoma by Jin Zhang, Linze Xu, Hao Wang, Dandan Wu, Huikai Li, Yueguo Li and Yang Liu in Cancer Informatics
Footnotes
Acknowledgements
We would like to express our heartfelt gratitude to all members of Tianjin Medical University Cancer Hospital for their unwavering support in our follow-up work.
Abbreviations
Abbreviation Full Name
HCC Hepatocellular carcinoma
ADCD Autophagy-dependent cell death
LIHC Liver hepatocellular carcinoma
TCGA The Cancer Genome Atlas
GEO Gene Expression Omnibus
DEGs Differentially expressed genes
ADCDRS Autophagy-dependent cell death-related risk score
ssGSEA Single-sample gene set enrichment analysis
WGCNA Weighted gene co-expression network analysis
PCA Principal component analysis
UMAP Uniform Manifold Approximation and Projection
scRNA-seq Single-cell RNA sequencing
TME Tumor microenvironment
ATG Autophagy-related gene
DAMPs Damage-associated molecular patterns
ICIs Immune checkpoint inhibitors
TKIs Tyrosine kinase inhibitors
ORR Objective response rate
EMT Epithelial-mesenchymal transition
GSVA Gene set variation analysis
CIBERSORT Cell-type Identification By Estimating Relative Subsets Of RNA Transcripts
ESTIMATE Estimation of stromal and immune cells in tumors using expression data
GO Gene ontology
KEGG Kyoto Encyclopedia of Genes and Genomes
LASSO Least absolute shrinkage and selection operator
ROC Receiver operating characteristic curve
AUC Area under the curve
DCs Dendritic cells
Tregs Regulatory T cells
MHC Major histocompatibility complex
IC50 Half maximal inhibitory concentration
TPM Transcripts per million
TOM Topological overlap matrix
FDR False discovery rate
OS Overall survival
HBV Hepatitis B virus
HCV Hepatitis C virus
NAFLD Non-alcoholic fatty liver disease
BCLC Barcelona Clinic Liver Cancer
Ethical Considerations
This study analyzed publicly available datasets (TCGA and GEO) and did not involve new experiments on human or animal participants. As only previously published data were used, institutional review board approval was not required.
Consent to Participate
Informed consent was not required because this study used only publicly available and previously published datasets.
Author Contributions
Y.L. (Yang Liu) and J.Z. conceptualized and designed the study. J.Z. and L.X. performed data analysis, interpretation, and visualization. H.W. and D.W. contributed to data collection. J.Z. and L.X. drafted the manuscript. Y.L. (Yang Liu), H.L., and Y.L. (Yueguo Li) critically revised the manuscript for important intellectual content. All authors have read and approved the final submitted version of the manuscript.
Funding
The authors disclosed receipt of the following financial support for the research, authorship, and/or publication of this article: This study received financial support from the Scientific Research Plan Project initiated by the Tianjin Municipal Education Commission (No. 2022ZD066) and the Joint Funds of the Natural Science Foundation of Tianjin (No. 25JCLZJC00120).
Declaration of Conflicting Interests
The authors declared no potential conflicts of interest with respect to the research, authorship, and/or publication of this article.
Data Availability Statement
The raw datasets analyzed in this study can be accessed from TCGA and GEO. Processed data and analysis code are available from the corresponding author upon reasonable request.
Supplemental Material
Supplemental material for this article is available online.
References
Supplementary Material
Please find the following supplemental material available below.
For Open Access articles published under a Creative Commons License, all supplemental material carries the same license as the article it is associated with.
For non-Open Access articles published, all supplemental material carries a non-exclusive license, and permission requests for re-use of supplemental material or any part of supplemental material shall be sent directly to the copyright owner as specified in the copyright notice associated with the article.