
Abstract
Microarray data sets have been used for predicting cancer biomarkers. Yet, replication of the prediction has not been fully satisfied. Recently, new data sets called deep sequencing data sets have been generated, with an advantage of less noise in computational analysis. In this study, we analyzed the kidney miRNA and mRNA sequence data sets for predicting cancer markers using 5 different statistical feature selection methods. In the results, we obtained 3 mRNA- and 27 miRNA-based cancer biomarkers to compare with the normal samples. In addition, we clustered the kidney cancer subtypes using a nonnegative matrix factorization method and obtained significant results of survival analysis from the 2 separate groups including miRNA-342 and its target eukaryotic translation initiation factor 5A (EIF5A).
Introduction
Recently, next-generation sequencing data sets have been wildly used for genomic analysis1-4 because of technical advantage of free from the probe-specific hybridization of microarray. MicroRNA (miRNA) and mRNA sequencing data sets have been applied to various diseases including kidney renal cell carcinoma.5-7 Feature selection (FS) methods are essential for building a model such as classification and/or clustering to better predict biomarkers for cancer classifiers. Even though a number of previous studies have been attempted to suggest new FS methods, FS methods are still limited. In this study, we focused on FS methods to identify biomarkers using 5 different statistical methods: information gain,8,9 gain ratio,10,11 and symmetrical uncertainty, 12 Spearman rank correlation, and Pearson linear correlation. Information gain, gain ratio, and symmetrical uncertainty used the probability of the classes, whereas the Spearman rank correlation and linear correlation methods used expression values. Technically, each statistical method has its own unique advantage in predicting cancer biomarkers and a disadvantage of losing some critical information. To overcome the drawback of a single statistical method, we selected the overlapping biomarkers from 5 different statistical methods so that information obtained from gene expression was enhanced or enriched. In this study, mRNA/miRNA features were obtained to distinguish between tumors and normal specimens as well as between tumor clustering specimens.
Materials and Methods
Materials
We initially downloaded miRNA and mRNA of kidney cancer data sets from UCSC (https://genome-cancer.ucsc.edu/) in June 2017, uploaded in January 2015. The miRNA was generated from an illuminaHiSeq-miRNASeq platform, whereas the mRNA was generated from an illuminaHiSeq-RNASeqV2 platform: the former included 326 samples and 1046 genes, and the latter included 606 samples and 20 530 genes. The miRNA and mRNA sequencing data sets were matched by patient samples for both tumors and normal specimens. We obtained 71 normal and 255 tumor samples of both miRNA (with 202 genes) and mRNA (with 13 268 genes) after removing unreadable data sets.
Methods
In this study, we tested 5 different statistical methods to identify biomarkers for distinguishing tumors from normal specimens, information gain,8,9 gain ratio,10,11 symmetrical uncertainty, 12 Spearman rank correlation, and Pearson linear correlation from the R package, FSselector (https://cran.r-project.org/web/packages/FSelector/index.html).
Here, we briefly introduce the individual advantages of the 5 statistical methods. First, information gain is derived from the information content of a code
Information gain can also denote the difference between the entropy of 2 classes. Entropy,

where

Split information is calculated by:

Finally, gain ratio is written as:

The attribute with the maximum gain ratio is selected as the splitting attribute. As both information gain and gain ratio are used as univariate attributes, the advantage of the method is its short computational time with independent classifiers. In addition, correlation-based methods (such as Spearman rank and linear correlations) are used for multivariate attributes, with the computational time being slower than the information gain with dependent features. 10
The advantage of symmetric uncertainty (SU)
12
is the reduction in the number of comparisons because
The advantage of the Spearman rank correlation method is that it is a nonparametric (distribution-free) statistical method that measures the strength of association between variables. The Pearson correlation method is a parametric statistical model computed by covariance of the 2 variables divided by the product of their standard deviation. 15
As the normal sample size is much smaller than the tumor sample size, all computational processes are based on balanced sample sizes. In the processes, we randomly selected the tumor samples to match the normal samples and executed the 5 statistical methods 50 times. Consequently, we selected a total of 2500 features from each method.
Results
mRNA/miRNA features of tumor vs normal tissues
We compared tumor vs normal tissues and aggregated the genes selected more than 40 times out of 50 runs and discovered information from 4 out of the 5 methods in Table 1. In each method, the probability of a hypergeometric test was less than 5.7e−28.
Feature selection using 5 statistical methods.
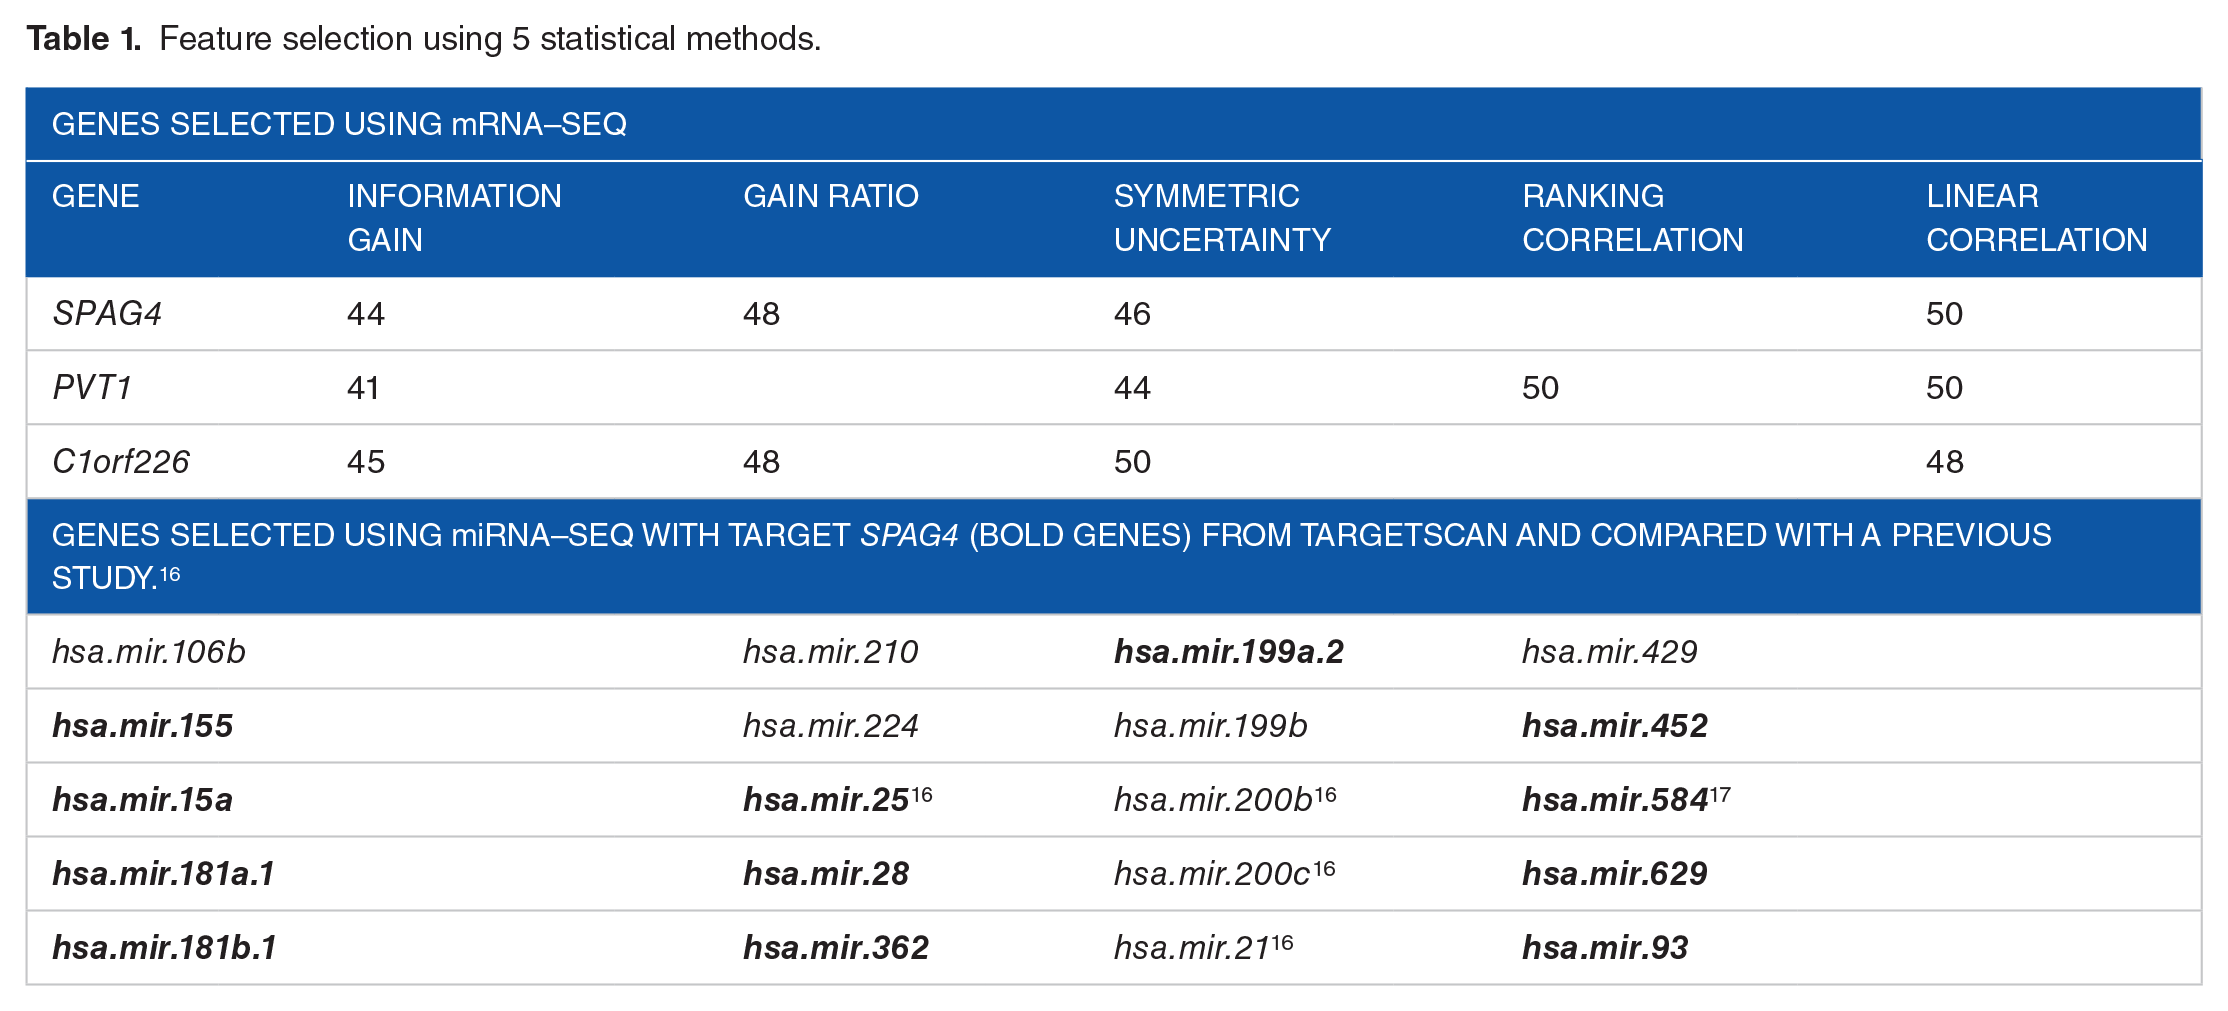
Human sperm–associated antigen 4 (SPAG4) was strongly suggested as a potential cancer marker.18,19 Knaup et al 19 discovered that SPAG4 was upregulated in human renal clear cells, and SPAG4 knockdown reduced the growth of renal tumors in vitro.
Recently, Cui et al 20 discovered that plasmacytoma variant translocation 1 (PVT1) was related to well-known cancer region 8q24. Many studies have revealed that non-protein coding RNA, which is roughly divided into 2 groups based on size, plays important roles in cancer. One involves the short noncoding group that consists of less than 200 nucleotides in length, whereas the long noncoding group is made up of more than 200 nucleotides. 21 As most studies have focused on short noncoding RNA, such as miRNA, 22 it is well understood compared with long noncoding genes. Therefore, our findings on the long noncoding gene PVT1 determined that it is a meaningful candidate oncogene. Chromosome 1 open reading frame 226 (C1orf226) is a protein-coding gene.
Tumor clustering
Analysis of mRNA tumor samples
Among the 255 tumor samples of mRNA-seq, we separated the samples using nonnegative matrix factorization (NMF) 23 methods between groups (k) k = 2 to k = 6. When k = 2, cophenetic coefficients are the most ideal, with a value of 0.92, in Figure 1. When k values are equal to 3, 4, 5, and 6, cophenetic coefficients are 0.77, 0.50, 0.57, and 0.56, respectively.

(A) Cophenetic coefficients of rank 2 to rank 6. (B) NMF clustering with k = 2. NMF indicates negative matrix factorization.
A total of 255 tumor samples were separated into 2 groups of 119, denoted as cluster 1, and 136, denoted as cluster 2. We selected features using those 2 separated tumor groups with 5 statistical methods. The selected features were UTP14C, USP8, and FBXL6, which were found from the 5 different methods with 40 appearances out of 50 runs in Table 2. Figure 2 shows USP8 expression levers between 2 classes, with t-test rejected the null hypothesis with P ≅ 2.08e−25.
Genes selected from 5 statistical methods using based on 2 groups.


Comparison of expression levels of USP8 between cluster 1 (red dots) and cluster 2 (blue dots).
Analysis of miRNA tumor samples
Among the 255 tumor samples of miRNA-seq, 8 had missing information. Therefore, we used a final total of 246 samples. We tested the NMF method from k = 2 to 6 for the cluster. The data were separated into 2 groups, because the highest cophenetic coefficient was obtained as 0.93 when k was equal to 2. When k values are equal to 3, 4, 5, and 6, cophenetic coefficients are 0.79, 0.68, 0.61, and 0.48, respectively. One group denoted as cluster 1 consisted of 124 samples, whereas the other group denoted as cluster 2 consisted of 122 samples. The Kaplan-Meier survival analysis 24 is shown in Figure 3 with significance (<<.001) using IBM SPSS Statistics 20.

NMF clustering with k = 2 to 6 (A-E) and (F) Kaplan-Meier survival analysis of tumor cluster used by miRNA-seq with k = 2. NMF indicates negative matrix factorization.
A total of 27 miRNA genes, presented in Table 3, were shown to be differentially expressed between the 2 clusters using the 5 statistical methods with 50 runs for each method. The selected genes were more robust than those of the single method because all the genes were selected in all iterations and methods.
Genes selected from cluster 1 vs cluster 2 used by miRNA-seq, and their target mRNAs were identified from TargetScan.
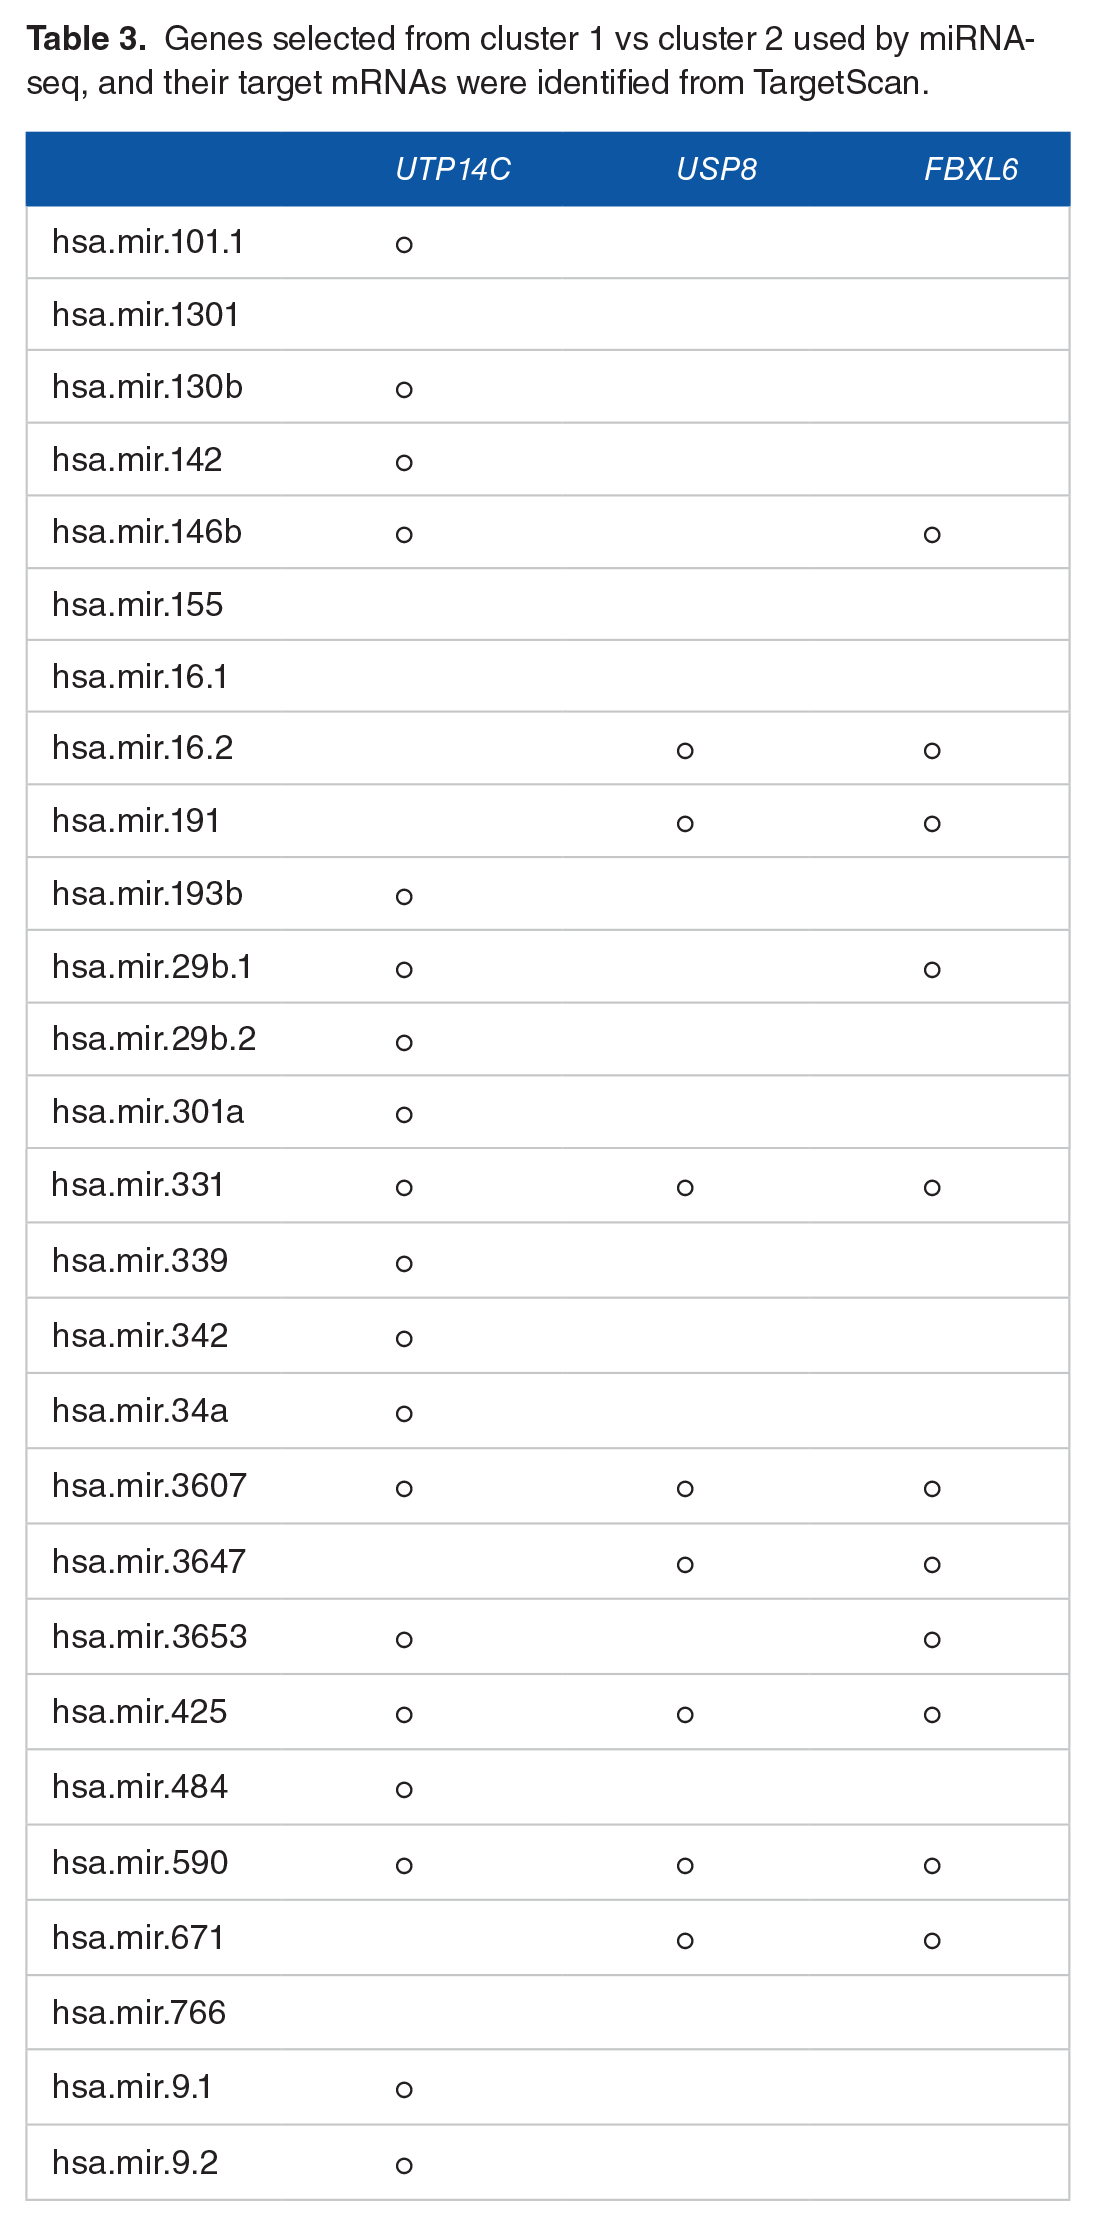
In addition, Table 3 includes miRNAs’ target mRNA genes that are demonstrated in Table 2 using TargetScan (http://www.targetscan.org).
Analysis using common samples of mRNA and miRNA
As the tumor samples contained different miRNA- and mRNA-seq-based clusters, we selected the common samples from each of the 2 groups in Figure 4 (67 and 76 common samples) to identify enhanced biomarkers.

Overlapping samples between miRNA and mRNA clusters.
Table 4 presents mRNA genes selected from more than 40 appearances out of 50 runs for all 5 statistical methods comparing cluster 1 with cluster 2. All 5 selected genes rejected the null hypothesis based on t-test with P-values, and presented in supporting file. We also selected 30 miRNA genes and described the target mRNA from TargetScan with values less than the Pearson coefficient. Interestingly, LIFR is underexpressed in cluster 1; otherwise, TAF10, NUDT1, B3GNTL1, and eukaryotic translation initiation factor 5A (EIF5A) are overexpressed in cluster 1.
Genes selected from common samples of both mRNA- and miRNA-seq data sets with Pearson correlation P-values (<−.2).

Abbreviation: eukaryotic translation initiation factor 5A.
Figure 5 shows Kaplan-Meier survival analysis, which interpreted that the mortality of patients in cluster 1 occurred at a much faster rate than patients in cluster 2. We calculated the Pearson correlation coefficient of selected miRNA and mRNA from cluster 1. We only considered correlation values less than −.2 because the miRNA inhibited its target mRNA, as presented in the Table 4.
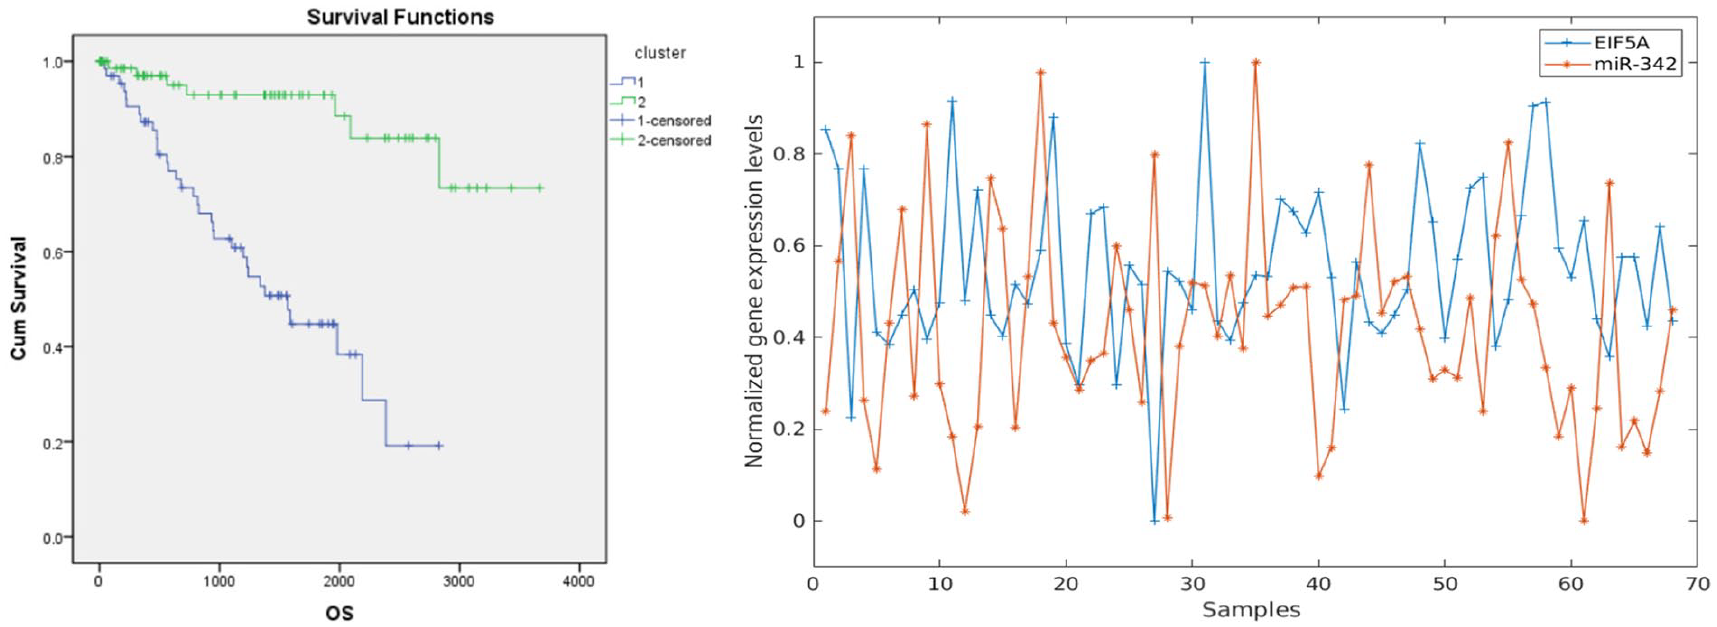
(A) Kaplan-Meier survival analysis used by common samples of both miRNA- and mRNA-seq. (B) Plot for inhibition between miRNA-342 and EIF5A (eukaryotic translation initiation factor 5A) used by cluster 1.
We uncovered pairs of miRNA and mRNA that had significantly different relations compared with the 2 clusters. We present a graph of hsa.mir.342 and its target gene EIF5A, discovered by calculating the Pearson correlation (−.3058) used by cluster 1 data sets.
Conclusions
In this study, we tested 5 different statistical methods for selecting enhanced significant cancer biomarkers using miRNA and mRNA sequence data sets of kidney cancer. We presented 3 mRNA and 27 miRNA markers for predicting cancer compared with the normal samples. In addition, we clustered the kidney tumors samples using miRNA and mRNA data sets independently and obtained 2 separate groups from both miRNAs and mRNAs. After matching the cluster samples, a total of 67 samples were contained in one group called cluster 1, and 76 samples were contained in cluster 2. According to the Kaplan-Meier analysis, the subtypes of kidney cancer were strongly related to mortality. We suggest the 5 strong candidate genes TAF10, NUDT1, B3GNTL1, LIFR, and EIF5A and 30 miRNAs that are differentially expressed between 2 subtypes in tumor samples related to mortality. Our enhanced methods discovered B3GNT1, whereas the rest of them were presented in https://www.proteinatlas.org. 25 In addition, we discovered 21 pairs of miRNAs and their target mRNAs including miR-342 and its target EIF5A.
Footnotes
Acknowledgements
The authors thank Dohyun Kim for performing the technical algorithm.
Funding:
The author(s) disclosed receipt of the following financial support for the research, authorship, and/or publication of this article: This work was supported by the National Research Foundation of Korea (NRF-2017R1A2B4010684) granted by the Ministry of Science and ICT.
Declaration of Conflicting Interests:
The author(s) declared no potential conflicts of interest with respect to the research, authorship, and/or publication of this article.
Author Contributions
SK designed and performed research, analyzed data, and wrote the paper.