
Abstract
Cellular glycosylation processes are vital to cell functioning. In malignant cells, they are profoundly altered. We used time-course gene expression data from the NCI-60 cancer cell lines treated with 11 antitumor agents to analyze expression changes of genes involved in glycosylation pathways, genes encoding glycosylation targets or regulators, and members of cancer pathways affected by glycosylation. We also identified glycosylation genes for which pretreatment expression levels or changes after treatment were correlated with drug sensitivity. Their products are involved in N-glycosylation and O-glycosylation, fucosylation, biosynthesis of poly-N-acetyllactosamine, removal of misfolded proteins, binding to hyaluronic acid and other glycans, and cell adhesion. Tumor cell sensitivity to multiple agents was correlated with transcriptional response of C1GALT1C1, FUCA1, SDC1, MUC1; members of the MGAT, GALNT, B4GALT, B3GNT, MAN, and EDEM families; and other genes. These genes may be considered as potential candidates for drug targeting in combination therapy to enhance treatment response.
Introduction
Glycosylation processes involve the addition of covalent bonds connecting glycans (oligosaccharides or polysaccharides) to a broad range of molecular targets.1–3 They are necessary for cell functioning, as they affect protein structure, function, and trafficking, cell membrane functions, and cell growth, proliferation, adhesion, and signaling. Most of the cellular proteins are glycoproteins, and many glycosylation enzymes may accept multiple substrates. Malignant cells exhibit many glycosylation changes, including alterations in glycan types, branching, and truncation, mislocalization of glycosylation components, abnormal expression of glycosylation targets, disruption of protein trafficking between the Golgi apparatus, the endoplasmatic reticulum (ER), and cell membranes, aberrant ligand binding and protein folding, and expression of aberrant epitopes.1–6 Glycosylation changes in cancer affect cell adhesion, metabolism, signaling, angiogenesis, interactions with tumor microenvironment, cancer progression, invasion, and metastasis.1,2,4 Glycosylation of target proteins and variation in glycosylation genes and their targets in malignant tumors have been reported to influence sensitivity to cancer drug treatment and to have clinical prognostic value.7–9 Due to their importance in cancer development, progression, dissemination, and treatment, glycosylation components are increasingly being targeted in cancer therapy.3,10
A number of studies have successfully used transcriptional profiling to monitor the activity of glycosylation-related genes.7,11–13 Given the clinical significance of glycosylation in cancer progression and treatment, it is important to learn how expression of glycosylation-related genes is altered by drug treatment and whether their transcript levels can be used as biomarkers of drug sensitivity. To achieve this goal, we examined transcriptional response of glycosylation-related genes in the NCI-60 cancer cell line panel 14 after treatment with 11 antitumor agents. We used data from the National Cancer Institute Transcriptional Pharmacodynamic Workbench (NCI-TPW), which provides gene expression information from a time-course study of cellular response to cancer treatment. We examined how each drug influenced expression of genes encoding glycosylation enzymes, protein targets, ligands, and regulators of glycosylation processes and components of cancer signaling pathways that affect glycosylation. We also identified genes for which pretreatment expression or transcriptional changes induced by treatment correlated with cancer drug sensitivity. Our objective was to examine glycosylation-related factors relevant to drug sensitivity and to identify relevant therapeutic targets that may improve the efficacy of cancer drug treatment in combination with established agents.
Methods
Expression data processing
We investigated the effects of drug treatment on expression of genes encoding enzymes involved in glycosylation of proteins and lipids, glycosylation enzyme trafficking, and targets, ligands, and regulators of glycosylation by analyzing expression data from time-course Affymetrix HG-U133A microarray experiments that involved the NCI-60 cancer cell line panel. 14 These data were obtained from NCI-TPW (A Monks, Y Zhao, C Hose, H Hamed, J Krushkal, J Fang, D Sonkin, EC Polley, M-C Li, E Harris, X Wu, J Connelly, A Rapisarda, BA Teicher, R Simon, and JH Doroshow, in preparation), which provides visual and analytic representation of transcriptional changes in the NCI-60 cell lines after treatment with 15 antitumor agents. It compares gene expression measures at 2, 6, and 24 hours after treatment of the 60 cell lines with low and high concentrations (a clinically achievable and an in vitro active concentrations) of each drug, to time-matched baseline control expression measures collected from cells treated with vehicle only. 15 The measurements for 22 227 probe sets were processed using background subtraction and Robust Multi-array Average array normalization. 16 The log2 expression values from different probe sets within a single gene from a single microarray were combined, resulting in 12 704 gene-averaged values (log2FC, ie, log2 of the posttreatment fold change of expression of each gene in each cell line). Posttreatment expression changes of 28 selected genes in the NCI-TPW data set were validated in a replicate study that used a Fluidigm BioMark qRT-PCR system after exposure to 6 agents in 24 to 60 cell lines for 24 hours.
For each antitumor agent, NCI-TPW provides a graphic chart of baseline gene-averaged expression values of each gene in each untreated cell line at 6 hours after the start of the experiment. The 6-hour time point was selected as being the most likely to provide biologically relevant representation of baseline gene expression during the experiment. Baseline gene expression measures of the 12 704 genes in the TP Workbench data set at 6 hours were consistent with similar measures at 2 and 24 hours, with the Pearson correlation coefficient of median log2-transformed baseline expression of individual genes across the agents ≥.86 when correlations at 6 vs 2 or 24 hours were averaged across the genes. Correlation coefficients for >90% of individual genes exceeded .5. The NCI-TPW provides the data showing expression changes of each gene in response to drug treatment, presented as log2FC, the difference between the log2 of the averaged gene expression value in a cell line treated with an agent and the log2 of the averaged expression value of that gene in the same cell line that was treated only with vehicle and collected at time-matched intervals at 2, 6, or 24 hours after treatment. The NCI-TPW also calculates correlation of these gene expression changes at 2, 6, and 24 hours with drug sensitivity (log10(GI50)). These data changes, identifying baseline levels of expression of glycosylation-related genes, in transcriptional gene response after drug treatment, and cell line sensitivity to the drugs, were used for the analysis in this report.
Identification of genes with concerted expression changes among the NCI-60 cell lines
We identified genes with concerted transcriptional changes using a previously described threshold of 15 cell lines with discordant direction of transcriptional change at any given time point and concentration. 15 A gene was considered to be upregulated or downregulated for those microarray experiments (specific to an antitumor agent, concentration, and posttreatment time), in which the expression of most of the cell lines changed in the same direction, based on a threshold of ≤15 cell lines with an expression change in the opposite direction. Our previous analysis of 5 agents from the NCI-TCW data set showed that this threshold provided an appropriate measure of concerted transcriptional changes, in concordance with transcriptional gene signatures derived from other independent resources such as the Connectivity Map (cmap) build 2 and the Library of Integrated Network-Based Cellular Signatures (LINCS) that used alternative methods of gene ranking based on the magnitude of cell line expression response to drug treatment.15,17,18
Analysis of correlation of cancer drug sensitivity with pretreatment gene expression levels and expression changes after treatment
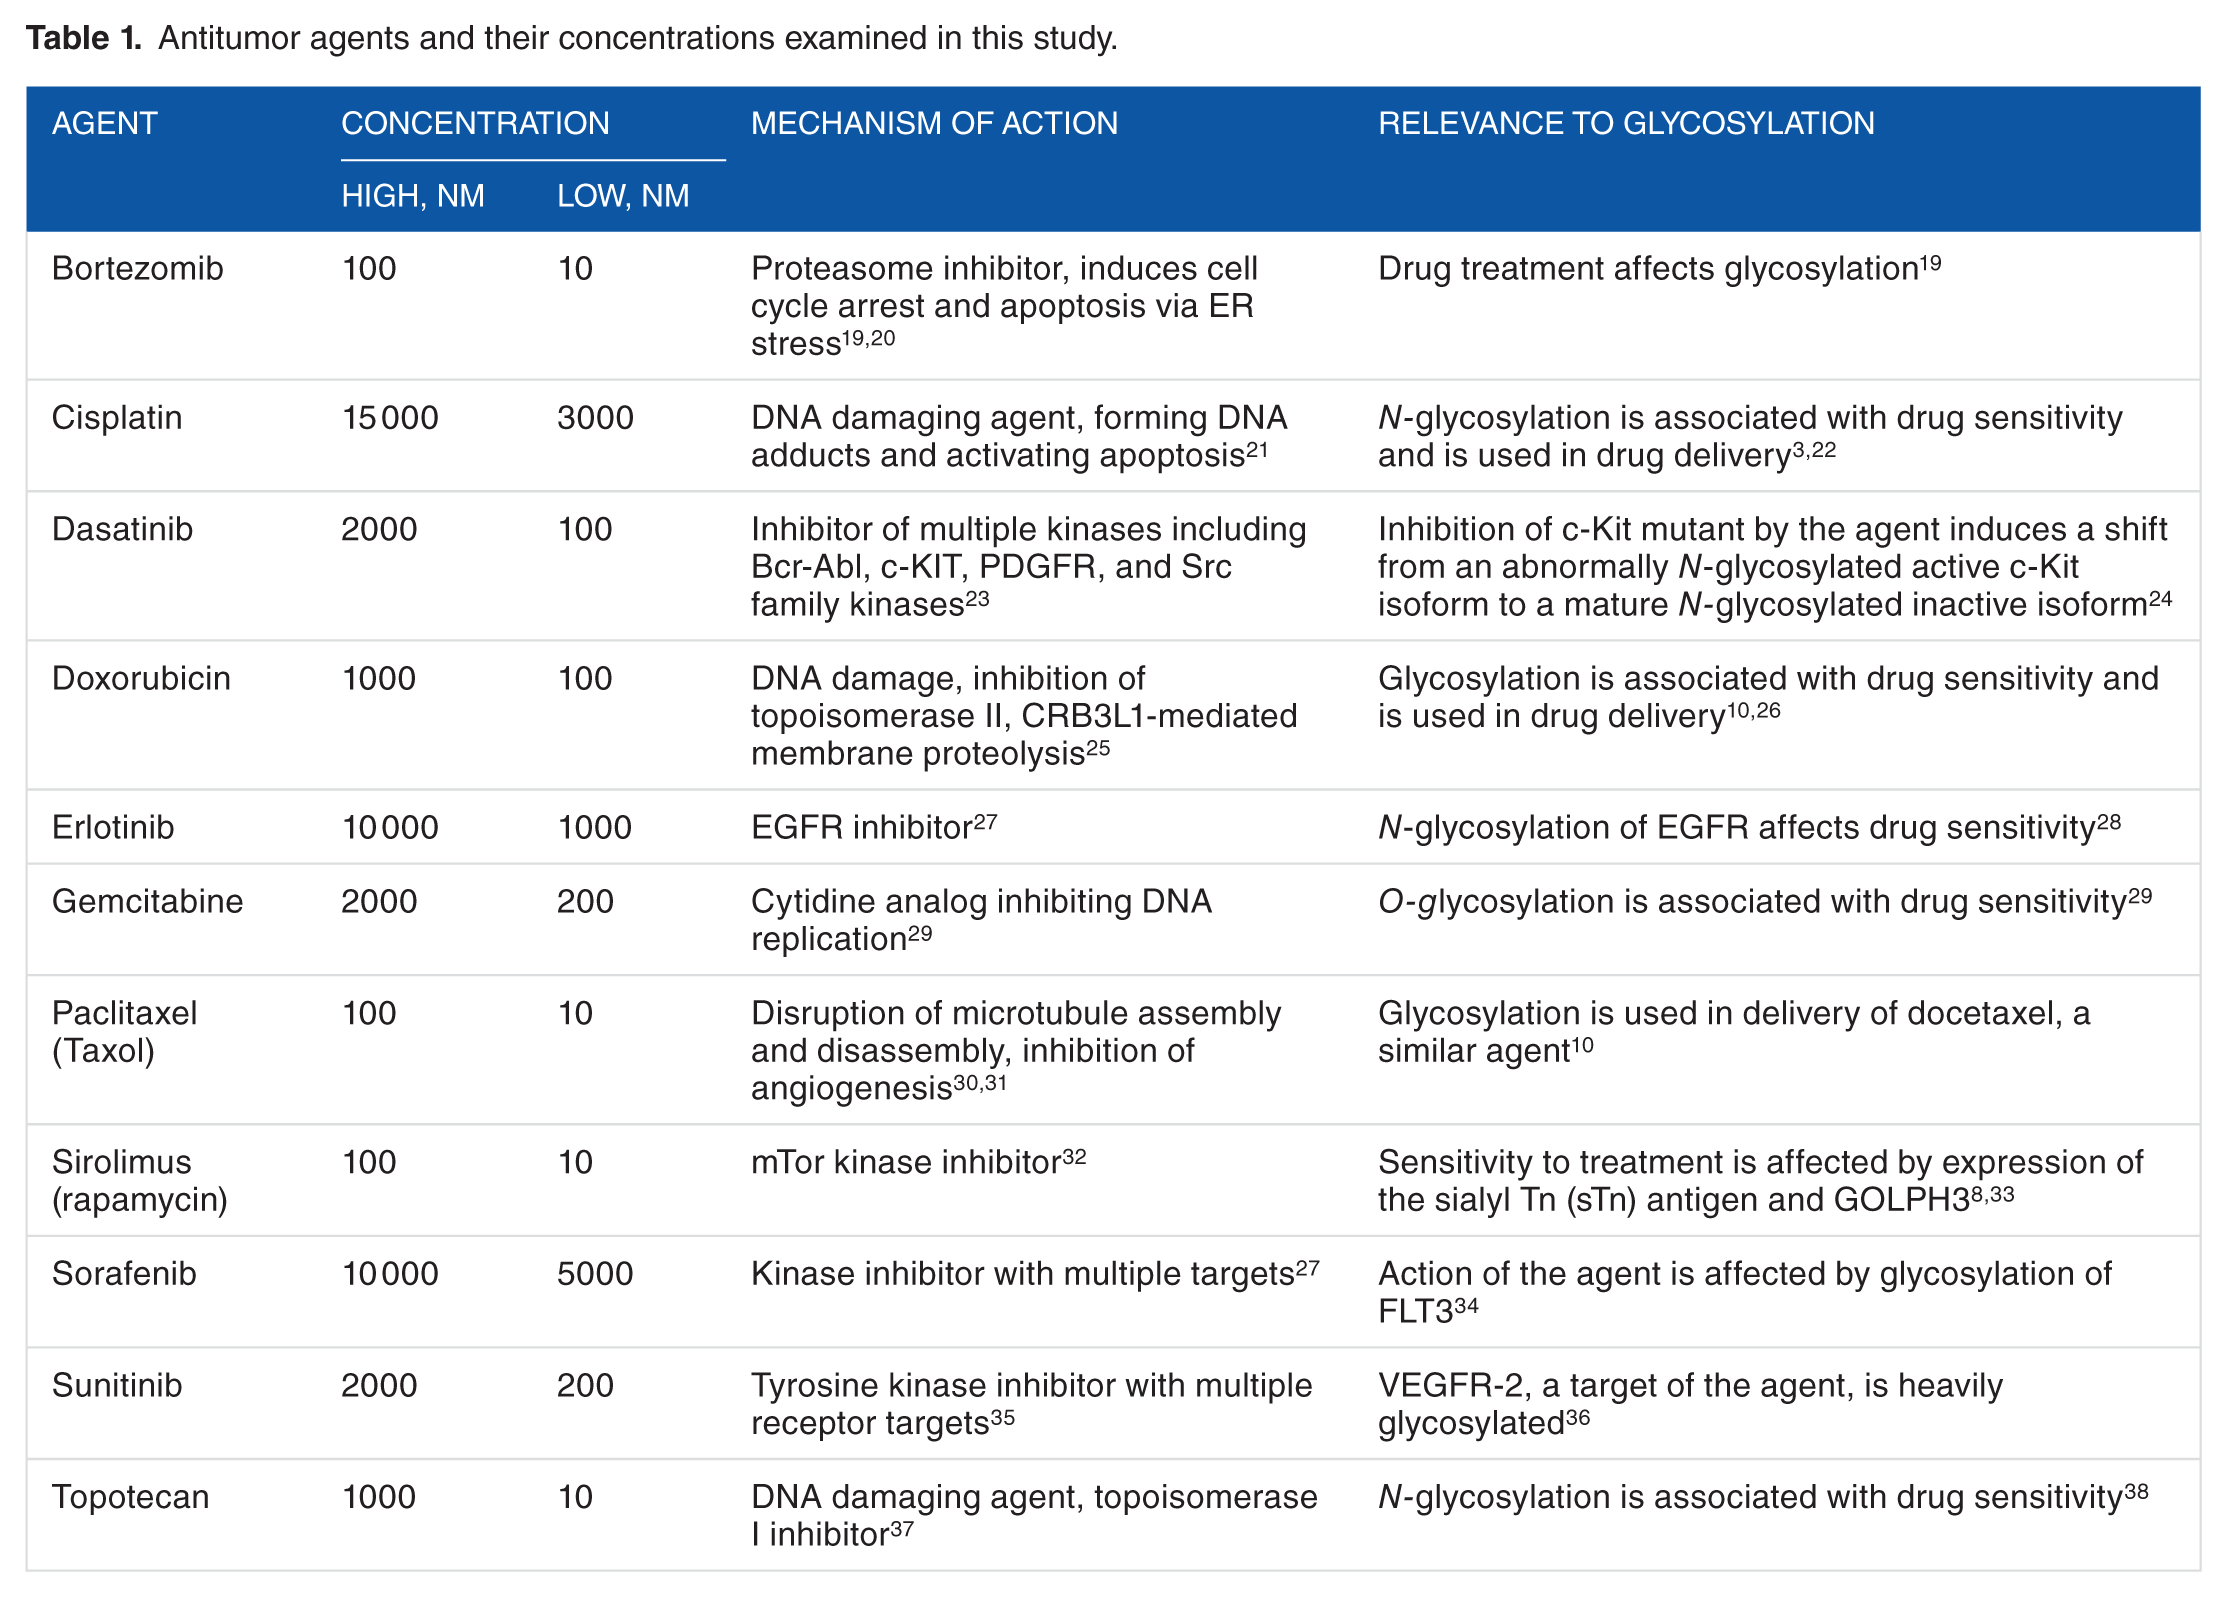
We analyzed transcriptional response to 11 cancer drugs with reported effects on glycosylation or those drugs for which glycosylation has been used in the delivery of those agents or their analogs. The list of agents and their respective low and high concentrations that were obtained from NCI-TPW are provided in Table 1. Posttreatment gene expression response was measured after 2-, 6-, and 24-hour exposure to each agent. Cell line drug sensitivity values in the NCI-TPW data set were presented as log10(GI50), to which we further refer as log(GI50), where GI50 is a drug concentration (μM) producing 50% growth inhibition. 14 The GI50 values were generated for each antitumor drug after a 48-hour exposure to the agent according to the NCI-60 drug screening protocols. For each cell line, the log(GI50) values for bortezomib in NCI-TPW were inferred from a single experiment for each screening concentration of that agent. The log(GI50) values for all other agents in NCI-TPW were computed as an average of 2 log(GI50) values derived from 2 replicate experiments for each cell line.
Antitumor agents and their concentrations examined in this study.
For each drug concentration (low and high) and each time point (2, 6, and 24 hours), we used NCI-TPW and R v.3.3.0 to examine Pearson correlation of drug sensitivity (log(GI50)) of the NCI-60 cell lines with gene expression changes (log2FC).
We also examined Pearson correlation of log(GI50) of each agent at 2, 6, and 24 hours after treatment with baseline gene expression in the untreated NCI-60 control cell lines. Baseline gene expression was computed as a median of log2-transformed expression values across 11 agents at 6 hours. Baseline gene expression at 6 hours was in strong agreement with baseline gene expression values at 2 and 24 hours. When comparing baseline expression of the 179 candidate genes, using median values across 11 agents analyzed in this study (Table 1), at 6-hour vs 2- or 24-hour time points, Pearson correlation coefficient, r, was >.995 for each of the 60 cell lines (with mean ± SD of r of .9977 ± .0007 for the 6-hour vs 2-hour comparison and .9953 ± .0022 for the 6-hour vs 24-hour comparison). Median baseline expression of individual glycosylation-related genes at 6 hours was also strongly correlated with 2- and 24-hour measurements, with mean ± SD of Pearson r equal to .9151 ± .1760 for the 6-hour vs 2-hour comparison and .9057 ± .1638 for the 6-hour vs 24-hour comparison among the 60 cell lines. Among the 179 candidate genes, 167 (93.3%) had r > .5 when comparing 6-hour vs 2-hour median expression values across the 11 agents, and 171 (95.5%) had r > .5 when comparing 6-hour vs 24-hour median expression values. These correlations demonstrate that 6-hour median measurements provided a reliable representation of gene expression in untreated cell lines.
Significance of correlation of drug sensitivity with gene expression changes or baseline gene expression was evaluated using the Benjamini-Hochberg correction for false discovery rate (FDR). 39 Two separate FDR P value adjustments were performed: one using all P values from correlation analyses of posttreatment transcriptional changes for 11 drugs, 3 time points, and 2 concentrations and another one using the P values from correlation of median baseline gene expression in nontreated controls with response to each of the 11 agents. All P values provided in this report have been FDR adjusted.
Selection of candidate genes encoding glycosylation enzymes, targets, ligands, and components of associated regulatory signaling pathways
We analyzed 179 genes encoding glycosylation enzymes, targets, and regulators (Supplementary Materials), for which expression information was available in the NCI-TPW. A detailed list of these genes is provided in Table 2. Our analysis included the genes from the Qiagen Human Glycosylation RT 2 Profiler PCR Array v. 4.0 (Qiagen, Valencia, CA, USA) and additional genes involved in protein and lipid glycosylation processes relevant to cancer, genes encoding glycosylation targets important to cancer, and components of cancer signaling pathways with reported interactions with glycosylation processes, including those targeted by the drug agents listed in Table 1.1–6,8,10,11,26,33,40–42 These candidate genes can be aggregated in several groups as described in Table 2, including categories from the Qiagen Human Glycosylation RT2 Profiler PCR Array and additional categories: (1) N-acetylgalactosaminyltransferases; (2) N-acetylglucosaminyltransferases; (3) galactosyltransferases; (4) glucosyltransferases; (5) mannosidases; (6) mannosyltransferases; (7) galactosidases, glucosidases, and hexosaminidases; (8) fucosidases and fucosyltransferases; (9) sialidases; (10) sialyltransferases; (11) components of mannose-6-phosphate synthesis and catabolism; (12) genes involved in polymerization, depolymerization, and modification of heparan sulfate chains; (13) other genes affecting biosynthesis, cleavage, or attachment of glycosylation products; (14) genes affecting trafficking of glycoproteins from ER and Golgi apparatus and/or Golgi architecture and functioning; (15) members of the mucin superfamily; (16) syndecans; (17) glypicans; (18) siglecs; (19) selectins; (20) selectin ligand carriers; (21) galectins; (22) cadherins; (23) matrix metalloproteinases; and (24) additional genes encoding glycosylation protein targets, components interacting with glycosylation processes and products, and/or components of molecular cancer pathways reported to regulate or to be affected by glycosylation, including those which may interfere with glycosylation response to drug agents listed in Table 1.
List of candidate genes analyzed in this study.

Abbreviations: AKT1, protein kinase B α; AKT2, protein kinase B β; B3GALT1, β-1,3-galactosyltransferase 1; B3GALT2, β-1,3-galactosyltransferase 2; B3GALT5, β-1,3-galactosyltransferase 5; B3GNT2, β-1,3-N-acetylglycosaminyltransferase 2; B3GNT3, β-1,3-N-acetylglycosaminyltransferase 3; B3GNT4, β-1,3-N-acetylglycosaminyltransferase 4; B4GALT1 (GalTI), β-1,4-N-acetylgalactosaminyltransferase 1; B4GALT2, β-1,4-galactosyltransferase 2; B4GALT3, β-1,4-galactosyltransferase 3; B4GALT4, β-1,4-galactosyltransferase 4; B4GALT5, β-1,4-galactosyltransferase 5; B4GALT6, β-1,4-galactosyltransferase 6; BSG (CD147), basigin; C1GALT1, core 1 synthase, glycoprotein-N-acetylgalactosamine 3-β-galactosyltransferase 1 or T-synthase; C1GALT1C1 (COSMC or C1GALT1L1), C1GALT1-specific chaperone 1; CD24, CD24 antigen; CD44, CD44 antigen; CDH1, E-cadherin; CDH2; N-cadherin; COPA (COPI), coatomer protein complex, subunit α; EDEM1, ER degradation–enhancing α-mannosidase–like protein 1; EDEM2, ER degradation–enhancing α-mannosidase–like protein 2; EDEM3, ER degradation–enhancing α-mannosidase–like protein 3; EGFR, epidermal growth factor receptor; EIF4E, eukaryotic translation initiation factor 4E; EPHB1 (EPH-B1), ephin receptor; ER, endoplasmic reticulum; ERBB2, Erb-B2 receptor tyrosine kinase 2; ERBB3, Erb-B2 receptor tyrosine kinase 3; EXT1, exostosin glycosyltransferase 1; EXT2, exostosin glycosyltransferase 2; FES, feline sarcoma proto-oncogene, tyrosine kinase; FGF2, fibroblast growth factor 2; FGF18, fibroblast growth factor 18; FGF23, fibroblast growth factor 23; FLT1 (VEGFR-1), Fms-related tyrosine kinase 1; FLT3, Fms-related tyrosine kinase 3; FLT4 (VEGFR-3), Fms-related tyrosine kinase 4; FUCA1, fucosidase, α-
Results
Concerted transcriptional response to treatment
Abnormal cancer glycosylation processes encompass aberrant N-glycosylation and O-glycosylation, altered sialylation, fucosylation, biosynthesis and binding of glycoproteins, glycosaminoglycans and glycolipids, and aberrant expression, trafficking and binding of glycoconjugates.1,5,42 Transcription of many genes involved in these processes was affected by drug treatment in a concerted manner (Supplementary Table 1). Although some aberrant glycosylation mechanisms may be specific to individual cancer types,1,3,10 we observed concerted changes in expression of many glycosylation genes, their ligands, and targets across different cancers. Below, we discuss selected gene categories for which expression measures were correlated with drug sensitivity.
Correlation of cancer drug sensitivity with baseline gene expression
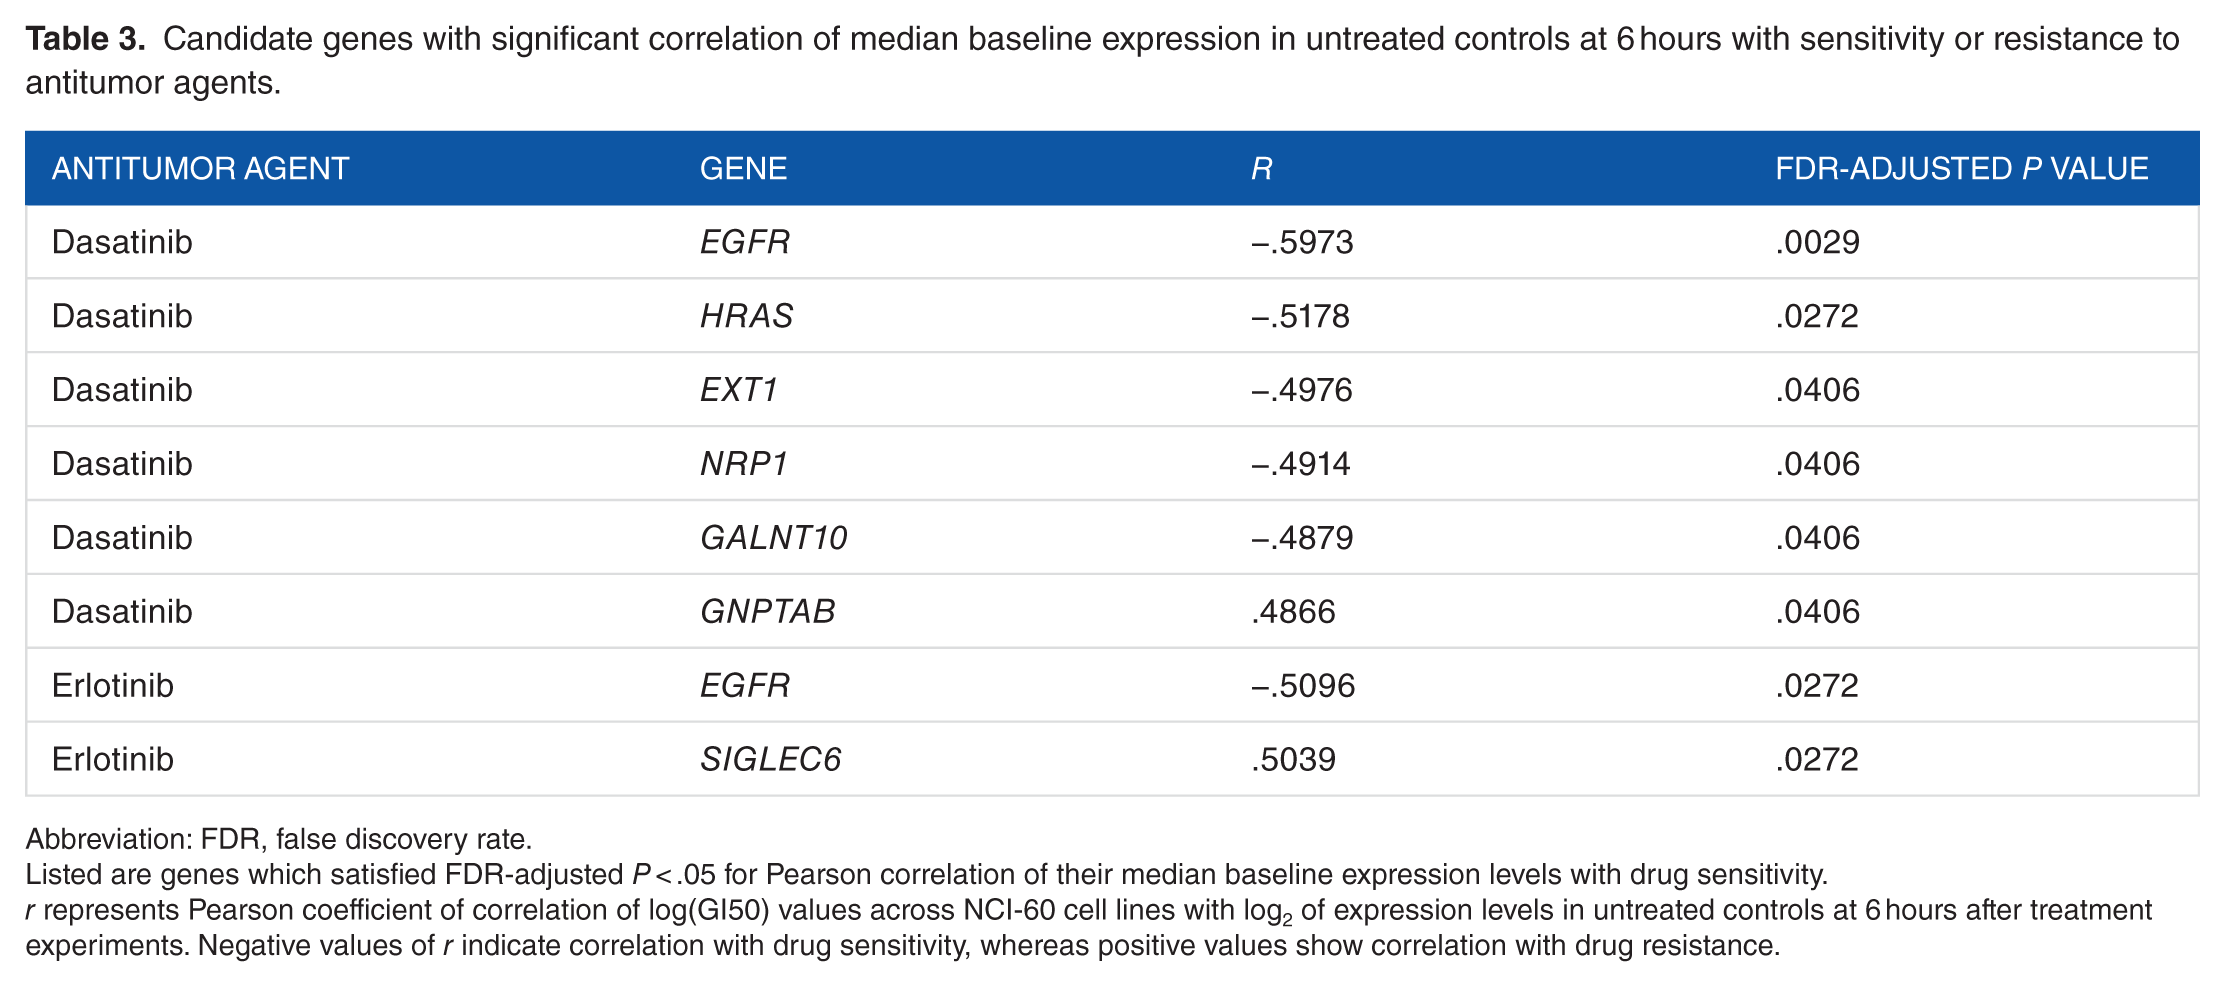
Table 3 provides a list of glycosylation-related genes where baseline expression in untreated cell lines was significantly correlated with log(GI50). These correlations are either positive, indicating correlation of higher gene expression levels with drug resistance, or negative, indicating correlation with drug sensitivity.
Candidate genes with significant correlation of median baseline expression in untreated controls at 6 hours with sensitivity or resistance to antitumor agents.
Abbreviation: FDR, false discovery rate.
Listed are genes which satisfied FDR-adjusted P < .05 for Pearson correlation of their median baseline expression levels with drug sensitivity.
r represents Pearson coefficient of correlation of log(GI50) values across NCI-60 cell lines with log2 of expression levels in untreated controls at 6 hours after treatment experiments. Negative values of r indicate correlation with drug sensitivity, whereas positive values show correlation with drug resistance.
Significant correlations were observed for kinase inhibitors (KIs) dasatinib and erlotinib. Expression of glycosylation targets EGFR and SIGLEC6 was significantly correlated with log(GI50) of erlotinib. This tyrosine KI targets the epidermal growth factor receptor (EGFR), with the extent of inhibition affected by EGFR glycosylation. 28 In our data set, higher baseline EGFR expression levels correlated with increased sensitivity to erlotinib, in agreement with an earlier study which reported that increased EGFR expression was a strong determinant of sensitivity to erlotinib in the combined data set of NCI-60 cell lines from different cancer types 43 and with reports that higher EGFR protein levels increased sensitivity to gefitinib, a similar agent. 44 However, conclusions from other clinical studies of erlotinib and gefitinib about the effect of EGFR expression have been controversial. 45 In addition, NCI-60 cell lines derived from colon cancer and cancer of the central nervous system have been reported to be resistant to erlotinib despite high levels of EGFR expression. 43 After treatment with erlotinib, expression of EGFR did not change in a concerted manner; however, its log2FC was correlated with sensitivity to that agent at 6 hours after treatment with the high concentration (r = −.4705, P = .0155; Supplementary Tables 1 and 2). This suggests the importance of both EGFR baseline expression and the magnitude of its transcriptional response to erlotinib. In addition, the role of somatic mutations in EGFR, in particular, in-frame deletions in exon 19 and specific point mutations, such as L858R and T790M, in non–small-cell lung cancer, as well as the effect of increased gene copy number in response to erlotinib, has been well documented.45–47 Although most commonly reported EGFR mutations have not been found in the NCI-60 cell lines, 2 cell lines (SK-MEL-28 and RPMI-8226) carry amino acid substitutions in the tyrosine kinase domain region of EGFR, 48 but neither cell line was sensitive to erlotinib in our study. Inhibition of N-glycosylation of EGFR has been reported to increase sensitivity of non–small cancer cells to erlotinib, and at least some of that effect did not depend on EGFR mutation status alone. 28 Further studies are needed that would use a variety of cancer models with diverse clinically relevant mutation changes to better understand the combined effects of EGFR gene expression, activating mutations, and glycosylation status of the EGFR protein in cancer cell response to erlotinib.
Higher levels of SIGLEC6 expression were correlated with increased resistance to erlotinib. The product of this gene, sialic acid immunoglobulin-like lectin-6, is a transmembrane receptor which is capable of binding leptin and sialyl Tn (sTn). 49 Its expression and interaction with leptin promote cell proliferation and invasion and prevent apoptosis. 50 Although no direct mechanism of SIGLEC6 involvement in response to erlotinib has yet been suggested, earlier studies reported transactivation of EGFR, the target of erlotinib, by leptin, and a significant reduction in leptin-induced breast cancer cell invasion and migration in response to erlotinib treatment.51,52 Therefore, the involvement of leptin in erlotinib response and the cross talk between leptin and EGFR may possibly explain a potential mechanism of association of SIGLEC6 expression with erlotinib resistance.
Baseline expression of multiple genes was correlated with sensitivity to dasatinib, a Bcr-Abl inhibitor (Table 3). They included EGFR, EXT1 (exostosin 1), NRP1 (neuropilin 1), GNPTAB involved in mannose-6-phosphate synthesis, GALNT10 (ppGalNAcT1, N-acetylgalactosaminyltransferase), and the HRAS oncogene which participates in the regulation of glycosylation.2,5 Correlation of higher levels of baseline expression of EGFR and EXT1 with increased sensitivity to dasatinib was reported previously. 53 EXT1 catalyzes chain elongation during heparan sulfate biosynthesis. 54 Although EGFR was downregulated by dasatinib (Supplementary Table 1), its protein downregulation affects dasatinib sensitivity via lysosomal degradation, 55 and therefore, the role of EGFR in dasatinib sensitivity may be affected by processes other than glycosylation.
Correlation of sensitivity to anticancer agents with transcriptional response
Similar to the highest number of correlations with baseline gene expression (Table 3), dasatinib sensitivity was also affected by many strong correlations of posttreatment expression changes of glycosylation genes, regulators, and targets (Supplementary Tables 2 and 3). Sensitivity to dasatinib was also correlated with expression changes of multiple growth factors and components of signaling pathways associated with glycosylation.2,3,5,41 Significant correlations of transcriptional changes of multiple glycosylation-related genes or targets were also observed for bortezomib, cisplatin, doxorubicin, erlotinib, gemcitabine, sorafenib, sunitinib, and topotecan, whereas correlations with expression changes of signaling components were observed for cisplatin, doxorubicin, erlotinib, gemcitabine, paclitaxel, sunitinib, sirolimus, and topotecan. Although drug treatment induced concerted expression changes in many glycosylation-related genes (Supplementary Table 1), additional information is needed to determine whether the concerted response of signaling components may be related to glycosylation or is induced by other mechanisms. For example, FGF18, the product of which binds heparan sulfate and may affect EXT1 function, 3 was the only gene for which expression changes were significantly associated with sensitivity to paclitaxel, and only changes in expression of PTEN were significantly associated with log(GI50) of sirolimus (Supplementary Table 3). Expression changes of none of the other candidate genes were significantly correlated with sensitivity to paclitaxel or sirolimus (Supplementary Tables 2 and 3). PTEN is involved in the PI3K/Akt/mTOR pathway response to sirolimus. It has been linked to the O-glycosylation pathway and the sTn antigen status in bladder cancer. 8 However, many such regulations occur at the protein level. Only a few PI3K/Akt/mTOR pathway components had concerted expression response to sirolimus, the mTOR pathway inhibitor, and no concerted transcriptional changes were observed for the mTOR gene, the product of which is targeted by sirolimus 8 (Supplementary Table 1). Therefore, although some aspects of biological activation or regulatory roles of the signaling components listed in Supplementary Table 3 have been associated with glycans, in some cases, transcriptional information alone may be insufficient to determine whether their concerted transcriptional response or association with cell sensitivity to antitumor agents may be related to glycosylation.
C1GALT1C1, C1GALT1, GALNT family, and GALNT trafficking components
Among the genes that had concerted expression changes after treatment with multiple agents was C1GALT1C1 (COSMC). At different time points, but most commonly at 24 hours, it was downregulated in most of the NCI-60 cell lines by cisplatin, gemcitabine (Figure 1A and B), bortezomib (Figure 1C and D), doxorubicin, and sorafenib and upregulated by dasatinib (Figure 1E) and sirolimus (Supplementary Table 1). Its expression changes were significantly correlated with sensitivity to bortezomib, cisplatin, dasatinib, and gemcitabine (Supplementary Table 2). C1GALT1C1 encodes the T-synthase C1GALT1-specific chaperone 1, which is required for maturation and function of the galactosyltransferase C1GALT1 that elongates O-glycans. C1GALT1C1 is commonly downregulated in tumors. Its absence or loss of activity result in production of truncated O-glycans through the synthesis of the Thomsen-Friedenreich (T) antigen, leading to the formation and overexpression of the STn antigen, decreased apoptosis, and increased cell migration and survival.1,3,42,56,57 Consistent with the protective role of C1GALT1C1, our results (Figure 1; Supplementary Tables 1 and 2) indicate that where its expression was increased in response to dasatinib, upregulation of C1GALT1C1 was significantly negatively correlated with log(GI50). We also observed downregulation of C1GALT1C1 by bortezomib, cisplatin, and gemcitabine being positively associated with log(GI50). These results suggest that those cell lines that had a stronger C1GALT1C1 expression increase or a lower magnitude of its expression decrease after treatment were generally more sensitive to these agents, indicating a treatment benefit from higher levels of C1GALT1C1 expression, which may be a context and drug mechanism dependent.

Transcriptional changes of the C1GALT1C1 gene in the NCI-60 cell lines at 2 (left panel), 6 (middle panel), and 24 hours (right panel) after treatment with the (A) high and (B) low concentrations of gemcitabine, (C) high and (D) low concentrations of bortezomib, and (E) low concentration of dasatinib. Horizontal right bars indicate elevated gene expression, whereas left bars indicate a decreased expression relative to cell lines untreated by the drug. Colors represent cancer tissue types (breast, central nervous system [CNS], colon, leukemia, lung, melanoma, ovarian, prostate, and renal cancers). The scale on the bottom represents log2 difference between expression values of treated and untreated cell lines (log2FC). The scale for each microarray experiment is specific to that experiment. The list and order of cell lines shown in the figure are provided in Supplementary Table 4.
Expression of multiple N-acetylgalactosaminyltransferase (GALNT) genes was also changed in a concerted manner after drug treatment (Supplementary Table 1). Their products, GalNAc transferases, have distinct but overlapping substrate specificities. 42 During biosynthesis of O-glycans, they initiate the O-glycosylation pathway and mediate binding of GalNAc to serine or threonine residues during the biochemical steps that precede the action of the T-synthase C1GALT1 and its chaperone C1GALT1C1.12,42 Consistent with their different roles and specificities, the direction of expression change in response to treatment was specific to each GALNT gene and drug agent. Many GALNT genes were downregulated by the proteasome inhibitor bortezomib; DNA-damaging agents (DDAs), cisplatin, gemcitabine, and topotecan; and a KI, sorafenib. A notable exception was GALNT12, which was downregulated by bortezomib but upregulated by gemcitabine, topotecan, sorafenib, and dasatinib.
The transcriptional response of many GALNT genes was significantly correlated with sensitivity to several antitumor agents (Supplementary Table 2). Among DDAs, expression changes of GALNT1, GALNT2, GALNT7, GALNT12, and GALNT14 were correlated with log(GI50) of cisplatin. That agent induced downregulation of all GALNT genes other than GALNT12 (Supplementary Table 1), with stronger downregulation associated with increased sensitivity. GALNT14, which catalyzes the initial step of mucin-type O-glycosylation, is overexpressed in many cancers and is important for invasion and migration of breast cancer cells. 58 GALNT1 is important for bladder cancer growth via its contribution to aberrant glycosylation of integrin α3. 59 The transcriptional response of the GALNT1 and GALNT11 genes was significantly correlated with sensitivity to gemcitabine, which induced concerted downregulation of GALNT11.
Among KIs, GALNT10 was downregulated by dasatinib, and the extent of its expression change was significantly associated with log(GI50) (Supplementary Tables 1 and 2). As discussed above, GALNT10 expression in untreated cell lines was also significantly correlated with cell sensitivity to dasatinib, with higher baseline expression levels of GALNT10 associated with increased sensitivity (Table 3). GALNT11 was upregulated by dasatinib, which was correlated with resistance to that agent. In response to erlotinib, expression changes of GALNT1, GALNT10, and GALNT11 were significantly correlated with sensitivity to that agent, and GALNT1 and GALNT11 were downregulated. GALNT10 expression response was correlated with sensitivity to sorafenib, whereas transcriptional changes of GALNT1 and GALNT12 were significantly correlated with sensitivity to sunitinib. These results suggest the importance of transcriptional responses of N-acetylgalactosaminyltransferase genes after treatment with DDAs and KIs. With an exception of GALNT11 response to erlotinib and GALNT1 response to sunitinib, in general, these data suggested the benefit of reducing the levels of GALNT expression after drug treatment. Underscoring the complexity of GALNT effects in clinical treatment, an increased expression of GALNT1, GALNT8, and GALNT14 in patients with breast carcinoma was associated with shorter, and that of GALNT11 with longer overall patient survival. 12
GALNT expression needs to be considered in the context of other components of the O-glycosylation pathway, genes encoding the trafficking machinery that shuttles GALNTs from the Golgi apparatus to the ER, and signaling components such as Src which activate the relocation of GALNTs to the ER. 42 An earlier analysis 12 found a prognostic effect of combining expression measures of the T-synthase gene, C1GALT1, with those of GALNT1, GALNT8, or GALNT11. In contrast to its chaperone C1GALT1C1, neither baseline expression nor expression changes of C1GALT1 were correlated with chemosensitivity to any of the 11 agents. C1GALT1 was downregulated in a concerted manner by bortezomib, dasatinib, sorafenib, sunitinib, and topotecan, and upregulated by gemcitabine (Supplementary Table 1). Its expression response to doxorubicin was mixed, with concerted downregulation at 2 hours which was followed by upregulation at 24 hours after treatment with the high concentration of that agent.
Among components of the GALNT shuttling machinery, 42 expression changes of the KDEL receptor genes KDELR1 and KDELR3 were significantly correlated with sensitivity to dasatinib. KDELR3 was upregulated by dasatinib (Supplementary Tables 1 and 2). Changes in expression of KDELR1 and KDELR2 were correlated with log(IC50) of gemcitabine, with KDELR1 downregulated by that agent at 24 hours and KDELR2 upregulated at 6 hours. All 3 KDELR genes had a concerted transcriptional response to multiple antitumor agents. Although no correlation with drug sensitivity was observed for COPA, the product of which is also involved in GALNT trafficking from Golgi to the ER, 42 this gene was upregulated in a concerted manner by bortezomib, dasatinib, doxorubicin, sirolimus, and sorafenib.
The higher expression levels of SRC, which activates the regulatory switch for trafficking of GALNTs to the ER, were significantly correlated with resistance to gemcitabine (Supplementary Table 3). No concerted SRC expression changes were observed after treatment with gemcitabine; however, this gene was upregulated by bortezomib and cisplatin (Supplementary Table 1). Interestingly, dasatinib, an Src inhibitor, 23 did not induce a concerted transcriptional response of SRC, suggesting a complex regulation of O-glycosylation components in response to drug treatment.
FUCA1
Among the genes involved in glycan biosynthesis, glycosylation targets, or ligand binding, upregulation of the α-

Transcriptional changes (log2FC) of the FUCA1 gene at 2 (left panel), 6 (middle panel), and 24 hours (right panel) after treatment with (A) high and (B) low concentrations of dasatinib, (C) high concentration of doxorubicin, and (D) high concentration of sunitinib. Additional information about data presentation is provided in the legend to Figure 1. The list and order of cell lines shown in the figure are provided in Supplementary Table 4. CNS indicates central nervous system.
MGAT family
Expression changes of several MGAT genes, which encode N-acetylglucosaminyltransferases that participate in N-glycosylation, were correlated with log(GI50) of several antitumor agents. MGAT5 was downregulated by cisplatin, doxorubicin, sorafenib, sunitinib, and topotecan, and its log2FC was correlated with sensitivity to cisplatin (Supplementary Tables 1 and 2). The product of this gene, GNTV, is an N-acetylglucosaminyltransferase which plays a very important role in malignancy by mediating aberrant elongation of branched N-glycans.1,60 MGAT5 gene expression is regulated via the Ras/MAPK/Ets-1 pathway, with involvement of Src, Ras, and ErbB2.2,60,61 In our data set, after treatment with cisplatin, the SRC gene was upregulated, whereas the expression of HRAS and ERBB2 did not change in a concerted manner, and expression changes of neither of these 3 genes were correlated with log(IC50) of cisplatin (Supplementary Tables 1 and 3). This indicates that additional factors may affect MGAT5 downregulation by cisplatin. MGAT1, MGAT2, and MGAT4B were downregulated by another DDA, gemcitabine, with stronger downregulation associated with increased sensitivity to that agent (Supplementary Tables 1 and 2). In contrast, MGAT4B was upregulated by dasatinib, a KI, and the extent of its upregulation was associated with increased sensitivity to that agent.
Mannosidases and EDEM family
Expression changes of several other N-glycosylation pathway genes that encode mannosidases and ER degradation mannosidase–like (EDEM) proteins correlated with sensitivity to KIs dasatinib, erlotinib, and sunitinib (Supplementary Tables 1 and 2). α- and β-mannosidases participate in trimming mannose residues during N-glycosylation, whereas EDEMs are ER stress-induced proteins which participate in the degradation of misfolded N-glycoproteins. 61 β-mannosidases are overexpressed in esophageal cancer, and α-mannosidase II has been a target of cancer therapy aiming to prevent the addition of the β1-6 branch to N-glycans. 5 EDEM2, MAN1A1, MAN1B1, MAN2B1, and MANBA were upregulated by dasatinib, which was correlated with sensitivity to that agent, consistent with an earlier report that increased MAN1A1 expression predicted improved breast cancer prognosis. 7 Expression changes of EDEM1, EDEM2, MAN1B1, and MAN2B1 were correlated with sensitivity to erlotinib, with EDEM2 upregulated by erlotinib at 24 hours after treatment. Expression changes of MANBA were correlated with log(GI50) of sunitinib.
B4GALT and B3GNT families
We observed a concerted response and correlation of several glycosyltransferase genes from the B4GALT family of the of β-1,4-N-acetylgalactosami-nyltransferases and B3GNT family of the β-1,3-N-acetylglycosaminyltransferases with sensitivity to erlotinib, a KI, and to DDAs, cisplatin, doxorubicin, and gemcitabine (Supplementary Tables 1 and 2). Their products participate in the biosynthesis of poly-N-acetyllactosamine (polyLacNAc), which is incorporated in N- and O-glycans, affecting cancer cell differentiation, apoptosis, and metastasis. The activity of the B4GALT family has an effect on cell adhesion, signal transduction, and apoptosis, and its members B4GALT1 and B4GALT5 are involved in multidrug resistance of leukemia to adriamycin, paclitaxel, and vincristine.62,63 With an exception of bortezomib, B4GALT5 had a concerted transcriptional response to all other agents examined in this study. Most of the cancer drugs induced downregulation of B4GALT5, and the extent of its downregulation by cisplatin was correlated with sensitivity to that agent. Changes in expression of B3GNT3, B4GALT1, and B4GALT5 were correlated with sensitivity to gemcitabine, which induced concerted downregulation of B4GALT5. B4GALT2 was downregulated by doxorubicin, which was significantly correlated with log(GI50). B3GNT2 and B4GALT5 were both downregulated by erlotinib, and their expression changes were associated with the opposite directions of significant correlations with log(GI50) of erlotinib (Supplementary Tables 1 and 2). Concerted transcriptional response of B4GALT and B3GNT family members to different antitumor agents and significant correlations of their expression changes with log(GI50) underscore the importance of these genes in cancer cell response to drug treatment.
Syndecans
Expression changes of other important genes were also significantly correlated with drug sensitivity (Supplementary Table 2). For example, downregulation of SDC1 (CD138) encoding heparan sulfate proteoglycan syndecan 1 was correlated with sensitivity to dasatinib, whereas changes in expression of the syndecan 4 gene, SDC4, were correlated with log(GI50) of erlotinib. SDC1 was downregulated in a concerted manner by both dasatinib and erlotinib, whereas SDC4 was downregulated only by dasatinib. Notably, although association of baseline expression levels of SDC1 and SDC4 with any agent did not reach statistical significance, we also observed a moderate association of pretreatment expression levels of SDC1 with log(IC50) of dasatinib (r = −.450, FDR-adjusted P = .0767) and those of SDC4 with erlotinib (r = −.434, P = .0826; data not shown). Earlier reports described an association of increased protein levels of SDC1 and SDC4 with malignancy, tumor growth, invasiveness, angiogenesis, and metastasis.3,5 However, the role of syndecans is complex. Higher SDC1 and SDC4 protein expression levels have been associated with a worse breast cancer prognosis, and several measures of SDC1 gene and protein expression have been predictive of negative outcomes in a variety of solid and hematological tumors.64–66 However, in some studies of the head and neck carcinomas, oral squamous carcinomas, and gastric cancer, the loss of SDC1 was associated with worse clinical outcomes.65,66 SDC1 has multiple important roles in its anchored form on cell surface, shed form or when bound to extracellular matrix, in the nucleus, and in the biogenesis of exosomes.66,67 Higher plasma levels of shed SDC1 protein in colorectal patients has been linked to increased resistance to several cancer drugs including 5-fluorouracil, oxaliplatin, irinotecan, cisplatin, and paclitaxel. 68 However, levels of shed SDC1 protein are regulated by several mechanisms at the protein level rather than at the transcriptional level. 67 Accordingly, we did not observe any significant associations of baseline expression or posttreatment expression changes of SDC1 or SDC4 genes with sensitivity to DDAs examined in our study (cisplatin, doxorubicin, gemcitabine, and topotecan). Transcriptional upregulation of SDC1 and SDC4 genes in response to DDAs (Supplementary Table 1) is consistent with earlier reports of increased levels of SDC1 in response to ionizing radiation in the malignant breast stromal fibroblasts and diminished SDC1 gene expression in multiple myeloma cells that had decreased DNA damage response.69,70
MUC1
MUC1, a cell surface glycoprotein that has been considered as a potential cancer biomarker and a therapeutic target, aberrantly expresses modified sialylated O-glycans in tumors, which promotes cell invasion.3,6 The MUC1 gene was upregulated by dasatinib and topotecan and downregulated by sorafenib (Supplementary Table 1). Its expression changes at 24 hours were significantly correlated with sensitivity to erlotinib, gemcitabine, and topotecan (Supplementary Figure 1 and Supplementary Table 2).
CD44
Transcriptional response of CD44 to erlotinib was associated with sensitivity to that agent at 24 hours after treatment. Its product, a transmembrane glycoprotein, is a main receptor for hyaluronic acid and a receptor for growth factors and cytokines. It is involved in tumor cell proliferation, differentiation, signaling, invasion, and binding to extracellular matrix and fibronectin.1,3 Although CD44 did not satisfy the criterion for concerted changes after treatment with erlotinib, it was downregulated in most of the cell lines at 6 hours at high concentration and at 24 hours at both concentrations (data not shown), in agreement with previously reported posttreatment reduction in CD44 protein levels. 71 Association of CD44 transcriptional response to erlotinib with sensitivity to that agent is consistent with an interaction between CD44 and EGFR, the target of erlotinib. 71 In agreement with our results, high levels of CD44 gene expression have been associated with reduced progression-free survival in patients with HER2-overexpressing breast cancer. 71
HBEGF
HBEGF, which encodes the heparin-binding epidermal growth factor (HB-EGF), showed a concerted expression response to all 11 agents (Supplementary Table 1). Its log2FC was significantly correlated with sensitivity to KIs, dasatinib and erlotinib, and to DDAs, cisplatin and gemcitabine. It remains to be elucidated whether this effect involves interactions between HB-EGF and heparan sulfate and/or is mediated by the endosulfatase SULF1 and by glypican-1, both of which affect HB-EGF activity. 1
Lack of association between transcriptional response of KIT and dasatinib sensitivity
Dasatinib, which can inhibit both catalytic and regulatory mutants of the c-Kit receptor tyrosine kinase, has been reported to induce a shift in glycosylation patterns of c-Kit and in c-Kit distribution within the cell. Treatment with dasatinib reduces the presence of high-mannose-type N-glycosylated active c-Kit mutant isoforms and increases the presence of its mature, fully N-glycosylated inactive isoforms that are exported from the cell or are stabilized to the cell surface, whereas protein expression of c-Kit also increases (Table 3). 24 Despite these protein changes of c-Kit, we did not observe a concerted transcriptional response of its gene, KIT, to dasatinib, or any correlation of KIT expression with dasatinib sensitivity (the absolute value of correlation coefficient |r| < .2, FDR-adjusted P > .74; Supplementary Tables 1 and 3), suggesting that cellular glycosylation response to dasatinib involving c-Kit may not involve transcriptional regulation.
Discussion
Glycosylation of proteins, lipids, or other glycans occurs posttranscriptionally. However, many glycosylation-related genes examined in our study showed concerted expression changes in response to treatment by a variety of drug agents (Supplementary Table 1). Such concerted changes across different cancer categories are remarkable given the tissue specificity of certain glycosylation modifications. 1 Further studies are needed that would use large numbers of specimens derived from individual cancer categories to examine how transcriptional response of glycosylation genes may affect sensitivity to different agents in specific tumor types and subtypes, defined based on histologic, clinical, and molecular classifications. In addition, future studies will need to examine how the concerted transcriptional changes in components of glycosylation pathways may be manifested at the proteomic and posttranslational levels, and how involvement of components of glycosylation pathways may attenuate or enhance drug sensitivity that is affected by mutational background of cancer cells. Concerted transcriptional changes of the genes involved in glycosylation pathways after drug treatment suggest that their expression response measures may serve as useful biomarkers for treatment monitoring that may augment currently available serological measures of glycoprotein abundance.1,13
Understanding the relevance of glycosylation changes to cancer treatment is a highly important goal. At present time, the knowledge about the response of multiple glycosylation pathway components to cancer therapy remains fragmented. In this report, we present an analysis of a unique data set that involved longitudinal profiling of transcriptional response of genes encoding a variety of glycosylation components after treatment with multiple cancer drugs. We provide a detailed catalog of expression response of glycosylation genes, regulators, ligands, and targets in response to cancer drug therapy. We also identified multiple important glycosylation-related genes for which baseline expression or posttreatment expression changes were significantly correlated with drug sensitivity or drug resistance. Due to their influence on response of tumor cells to treatment, these genes may be examined as potential targets for increasing or decreasing their levels using drug combination strategies, to enhance existing therapies by targeting glycosylation pathways.
Footnotes
Acknowledgements
The authors thank the anonymous reviewers for their helpful comments that improved the manuscript. They are grateful to Drs Eric Polley (Mayo Clinic), Jiawen Fang, Joanna Shih, and Hossein Hamed (Biometric Research Program, National Cancer Institute) for helpful discussions.
Funding:
The author(s) disclosed receipt of the following financial support for the research, authorship, and/or publication of this article: This project has been funded in part with federal funds from the National Cancer Institute, National Institutes of Health, under (contract no. HHSN261200800001E). The content of this publication does not necessarily reflect the views or policies of the Department of Health and Human Services nor does mention of trade names, commercial products, or organizations imply endorsement by the US Government. This research was supported (in part) by the Developmental Therapeutics Program in the Division of Cancer Treatment and Diagnosis of the National Cancer Institute.
Declaration of conflicting interests:
The author(s) declared no potential conflicts of interest with respect to the research, authorship, and/or publication of this article.
Author Contributions
RS and JK conceived the study. JK conducted the bioinformatic analysis of gene expression data and their correlation with drug sensitivity and drafted the manuscript. YZ developed the NCI-TPW tool, generated computer-processed gene expression and drug response data sets for this study, and participated in manuscript editing. AM oversaw the collection of experimental data including cell culture growth, gene expression measures, and drug response measures. CH participated in experimental data generation including cell culture growth, gene expression analysis, and collection of drug response measures. JHD participated in the design of the experimental study, oversaw the study completion and coordination, and participated in clinical interpretation of the study results and in manuscript editing. RS oversaw the design and computational development of the NCI-TPW tool and statistical and computational data analysis, participated in the interpretation of the results, and edited the manuscript. All authors read and approved the final manuscript.
References
Supplementary Material
Please find the following supplemental material available below.
For Open Access articles published under a Creative Commons License, all supplemental material carries the same license as the article it is associated with.
For non-Open Access articles published, all supplemental material carries a non-exclusive license, and permission requests for re-use of supplemental material or any part of supplemental material shall be sent directly to the copyright owner as specified in the copyright notice associated with the article.