
Abstract
A common task in bioinformatics is to compare DNA sequences to identify similarities between organisms at the sequence level. An approach to such comparison is the dot-plots, a 2-dimensional graphical representation to analyze DNA or protein alignments. Dot-plots alignment software existed before the sequencing revolution, and now there is an ongoing limitation when dealing with large-size sequences, resulting in very long execution times. High-Performance Computing (HPC) techniques have been successfully used in many applications to reduce computing times, but so far, very few applications for graphical sequence alignment using HPC have been reported. Here, we present G-SAIP (Graphical Sequence Alignment in Parallel), a software capable of spawning multiple distributed processes on CPUs, over a supercomputing infrastructure to speed up the execution time for dot-plot generation up to 1.68× compared with other current fastest tools, improve the efficiency for comparative structural genomic analysis, phylogenetics because the benefits of pairwise alignments for comparison between genomes, repetitive structure identification, and assembly quality checking.
Introduction
Bioinformatics is a multi-disciplinary area supporting the discovery of biological information utilizing computational approaches. 1 This research field is at the intersection of several sciences like biology, computer sciences, and mathematics, intending to analyze and classify biological data. 2 One of the most common bioinformatics tasks, relevant in metagenomics and phylogenetic analysis, 3 is the sequence alignment,4,5 which consists of comparing 2 (pairwise) 6 or more (multiple) 7 nucleotides or proteins sequences against a reference.
One of the most utilized alignment types is the graphical sequence alignment,8,9 which provides visualization of rearrangements, insertions, deletions, and other structures found in DNA or protein sequences. Graphical alignments are commonly represented in a dot matrix called dot-plots. 10 Dot-plots are rectangular matrixes where columns and rows represent the residues to be aligned; at each cell, a dot is painted with a grayscale intensity proportional to the degree of similarity of the sequences at that point. 11
There are several published software packages able to generate dot-plots. Dotter 9 is one of the most popular graphical pairwise sequence aligners, using dynamic programming 12 and well suited for small DNA or protein sequences (few 1000 of nucleotides). 13 Other available software programs are Dotlet 14 , which runs on a web server; JDotter 13 is a version of Dotter running on a remote java platform, Tuple_plot 15 which proposed a different way to calculate the dot-plot and can reduce the noise for large sequences (>10 kB) and Gepard 16 using a heuristic suffix array method 17 to generate dot-plots of small and large sequences but with a high noise level. The SFILE 18 library was designed to deal with big-data sequences, enhancing out-of-core management and using a k-mer value identification to reduce computational space. More recently, novel software has been published as Flexidot, 19 which generates high-quality dot-plots for small repetitive sequences, and finally D-genies, 20 a standalone and web application that uses the minimap2 21 output to calculate the alignment for chromosomes and genomes, D-genies also use MashMap, 22 an approximate algorithm for computing local alignment boundaries between long DNA sequences using k-mers and taking advantage of HPC strategies and mapping genome assembly or long reads to other reference sequences. However, despite significant progress in using large sequences datasets, the quality and the execution times of dot-plots still represent a challenge.
Advances in next-generation sequencing technologies and associated low costs have allowed an exponential increase in available genetic information, 23 known as the sequencing revolution.24-27 As a result, the challenges have shifted from sequencing organisms to analyzing their genomes in a post-genomic era.28,29 This shift required a new generation of algorithms considering the use of parallel, distributed, and other high-performance computing (HPC) techniques to accelerate the genome data analyses. 30
Developments in HPC, supercomputing and parallel programming have improved the execution time in several areas,31-34 due to parallel programming can launch processes over heterogeneous architectures such as CPU, GPU, or CPU + GPU using libraries for programming in a fast and flexible way, even with shared or unshared memory. 35 In bioinformatics, these techniques allow accelerating the analysis of genetic information. 36 Different bioinformatics applications use parallel programming approaches.37-40 These applications focus on multiple sequences alignments41-45 and non-graphic paired alignment of protein nucleotides,46-50 including repetitive structures. 51 However, graphic aligners that use parallel strategies are not available.
In this work, we reported G-SAIP (Graphical Sequence Alignment in Parallel), a tool that can be easily integrated into a pipeline and HPC-based strategy that follows the Flynn 52 taxonomy SIMD (simple instruction multiple data). G-SAIP, taking advantage of MashMap, performs graphical pairwise sequence alignment (1 channel and 8 bits image) at the genomic level on CPU architectures over multiple nodes speeding up execution times through parallel programming in order to provide tools for analyzing a massive amount of data produced by large scales genomic projects such as the 10K plant genomes 53 and the Earth BioGenome. 54 In contrast with other programs, G-SAIP prioritizes process parallelization over programs like gepard to generate dot-plots, as well as uses the principles of sequence mapping to score similarities with programs like minimap2 and MashMap which perform file alignments as results and use multi-threaded processes in their execution. This tool can also be used for quality verification of genome reference-based assemblies.
Materials and Methods
G-SAIP implementation
G-SAIP was developed using Python 3.8 55 and with parallel computing support using mpi4py. 56 It is a DNA graphical aligner that takes advantage of MashMap 57 for sequence alignment due to its speed, and requires input parameters as the reference and query sequences in FASTA format that must be declared in the command line execution to calculate the dot-plot. Also, users can define optional parameters like MashMap Segment similarity, identity percentage for filtering, k-mer size, and G-SAIP output image attributes like image width, height, and word size to enhance the resulting quality.

Equation 1. Calculated window size by G-SAIP, where Total_sequence_length is the complete size of residues from larger sequence and 1024 is the maximum size of the result image.
To generate the dot-plot, G-SAIP receives the nucleotide FASTA files for reference and query sequences; these files can contain 1 or more sequences. Hence the algorithm joins each file into a unique sequence to facilitate the execution. Thus, the largest sequence file is split into subsequences of length calculated by equation (1), ensuring that each pixel of the default output image size represents the minimum number of nucleotides and keeps the significant information. Then, G-SAIP uses MashMap to calculate the score of each region; the score value is extracted from the result file and mapped from 0% to 100% (identity) to pixel intensity 0 to 255. Next, G-SAIP generates the dot-plot matrix, which is scaled to height and width defined by the user (by default is 1024 pixels and 1024 pixels). The software preserves the intensities extracted from MashMap but, if the user wants to reduce the image noise, G-SAIP has a filter tool that reduces to zero the intensities under a given threshold and assigns the maximum intensity to pixels above the threshold. Another option available is to generate a dot-plot with 3 colors. The user is asked for 2 values between 0 and 100; the dots are red-colored for scores under the minimum value. For scores above the maximum number, dots are colored green, and scores between those ranges are orange painted. Finally, the image is saved in SVG, PNG, or PDF format as a specified format by the user (by default, PNG is used), and the algorithm removes temporary files used during the execution.
G-SAIP parallel strategy
G-SAIP uses mpi4py, a Python implementation of Message Passing Interface (MPI), 58 specifically for Open MPI. 59 This library allows graphical alignment to be performed parallel over multiple CPU cores belonging to a single node or distributed nodes in an HPC cluster. The software takes all subsequences to calculate the number of sequences that each processor will process. Then, the master process creates 1 file per worker node (with the subsequences that it will use) and sends this file as the same as the shorter-joined sequence to worker processes. Finally, each process runs MashMap with its individual sequences file, shorter-joined sequence, and user parameters. By default, G-SAIP defines MashMap parameters like segment length, k-mer size, identity percentage, and filter mode as 5000, 16, 95, and None. In this way, the algorithm takes advantage of this HPC strategy to do several alignments simultaneously.
The output file generated by MashMap is processed to extract alignment scores, which are used to generate and fill the N × M matrix, where N is the subsequence length, and M is the shortest sequence length. Finally, when each process is done, the master process takes all matrixes generated and creates the final dot-plot matrix. Figure 1 resumes the parallel strategy applied by G-SAIP for dot-plot calculation.

G-SAIP parallel strategy diagram. Sub-sequence file corresponds to a file containing sub-sequences for the largest FASTA file (can be the reference or the query file). One-sequence file corresponds to the other file (the shorter).
In addition, G-SAIP has a specific module to make dot-plots to compare the quality of an assembly with a reference genome. Ragtag 60 is used for contigs and scaffold orders compared with a reference file. This process is executed before the execution of MashMap for alignment to determine the correct quality of an assembly file.
Availability of G-SAIP
The G-SAIP source code is open source and can be found in https://github.com/simonorozcoarias/G-SAIP. Installation instructions, how to run, sample data, and results are also available there.
Computational resources
All experiments were executed using a server with a 64-core Intel (R) Xeon(R) CPU E5-2683, with 2.1 GHz, 256 GB of RAM and the CentOS7 operating system, managed by Slurm. 61
Performance tests
G-SAIP was tested for 2 perspectives to generate self-plots (a dot-plot with the same query and subject sequence) of genomes with different sizes (Table 1). First, the software was executed with different CPU numbers (2, 4, 8, 16, 32, 56, and 62) in a single node, and each execution was performed 10 times to examine the acceleration and speed provided by G-SAIP. Amdahl’s law considers the elapsed execution time sequentially and the execution time for the code parallel section to speed up the calculation. In addition, the execution time of the overall execution was recorded to explore the time added by sequential code.
Performance test sequence dataset.

On the other hand, Homo sapiens X chromosomes self-plot was generated with G-SAIP to compare the execution time differences between G-SAIP and other graphical sequence aligners: Gepard, Dotter, D-GENIES, and the MashMap Perl script to make dot-plots.
Assembly quality test
G-SAIP was used to determine the assembly quality of 2 organisms from raw sequence reads datasets. First, we used a WGS (whole genome sequencing) Illumina paired-end sequence reads of Arabidopsis thaliana available in NCBI SRA 65 repository under SRR10178322 accession number, with 16 Gb of size per file. The second dataset used was a WGS Illumina paired-end sequence reads of Drosophila melanogaster with 4 Gb of size per file 65 and accessible in SRA repository with SRR10735526 accession number.
Thus, both raw sequence reads were analyzed using FASTQC 66 and Trimmomatic 67 to improve the quality of the reads. Then, each dataset was assembled with MEGAHIT, 68 Velvet, 69 ABySS, 70 and MaSuRCA 71 assemblers keeping a minimum contig length of 500 bp and k-mer values of 31, 51, 71, and 91. So, assemblies were checked with BUSCO 72 and QUAST 73 to calculate the N50 value and other significant metrics to define the best assembly. Finally, G-SAIP was executed with a quality module activated in order to execute ragtag for assembly ordering and compare each assembly with references genomes of Arabidopsis thaliana 74 (116 Mb) and Drosophila melanogaster 75 (139 Mb) to find out a relation between G-SAIP dot-plot and variables extracted with BUSCO and QUAST.
Comparative genomic test
Finally, to define the G-SAIP usefulness to perform a comparative analysis of sequences, the X chromosome of the Homo sapiens genome was compared against other X chromosomes of mammals listed in Table 2 because this chromosome is the most conserved during the species evolution. 76 All chromosomes were joined in a unique file for better visualization, and then a G-SAIP self-plot was generated.
Comparative genomic datasets test.

Scalability test
For this test, G-SAIP was executed with 62 CPUs distributed over 1, 2, 3, 4, 5, and 6 nodes with distributed memory, using Triticum turgidum genome and running the algorithm 10 times for each number of nodes in order to determine if G-SAIP can run in several nodes without a significant reduction of performance compared to its execution on a single node. Finally, a strong and weak scaling test was performed to verify the software scalability.
For the strong scaling, we follow the Amdahl’s law 83 that can be formulated as follows:
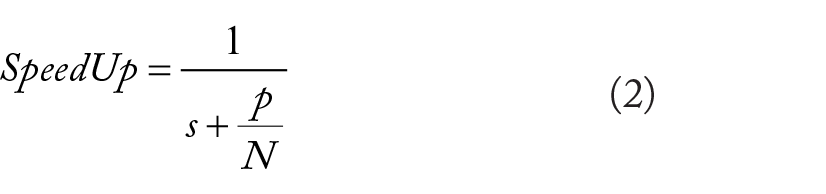
Equation 2. Amdahl’s law formula for strong scaling
Where s is the serial time execution of G-SAIP, p is the proportion of execution times and N is the number of processors. In weak scaling, Gustafson’s law 84 provides the formula for scaled speedup:

Equation 3. Gustafson’s law formula for weak scaling
Where s, p, and N have the same meaning as in Amdahl’s law.
Results
Performance test
G-SAIP was executed with a specific window size for each genome size according to equation (1), and MashMap segment length of 50 000 for Homo sapiens and Triticum turgidum genomes, and 500 000 for Pinus taeda, because of its exceptionally large genome size. G-SAIP averaged execution times of genomes in Table 1 with 2, 4, 8, 16, 32, 56, and 62 cores are plotted in Figure 2a, obtaining a reduction in times from twelve (12) to seven (7) minutes for Homo sapiens, from ~1.2 hours to 23 minutes for Triticum turgidum and up to 50 minutes for Pinus taeda. Also, speed-up was calculated by taking the time with 2 cores as the nominal time due to G-SAIP using 1 working process as a master process, achieving a speed up even of 3.0× (Triticum turgidum) compared with nominal time. The speed-up of G-SAIP with each genome was calculated by dividing averaged times for 2 CPUs between the averaged time obtained with each other CPUs; these values are drawn in Figure 2b. We timed only the code section, which is executed in parallel (shown in Figure 1.)

G-SAIP parallel execution time for each genome tested: (a) execution times and (b) speed-up graphic.
For G-SAIP execution time comparison against Dotter, Gepard, D-GENIES, and MashMap dot-plot tool, a joined file with X chromosomes of Table 2 was used to generate self-plots with these graphical aligners. Table 3 demonstrates the overall execution time registered of each software and speed-up of G-SAIP against each other software; these times show performance up to 1.68× from G-SAIP concerning to current software tested. All software was executed in the same computational architecture using 62 CPUs. G-SAIP was executed with 62 CPUs, a window calculated with (1) and MashMap segment length of 50 000; Dotter execution time, with default parameters, is the estimated given by the software because of the considerable time. D-Genies was installed in standalone mode, changing in the configurations files the number of CPUs to execute this software from 8 to 62, using a maximum of RAM memory up to 80 GB, changing the maximum file of the input files, and using also MashMap to calculate the alignment, other parameters were set by default for D-GENIES. Gepard dot-plot matrix was calculated with EDNA substitution matrix, and MashMap dot-plot tool was executed with output for Homo sapiens with segment similarity of 50 000. All experiments can be consulted G-SAIP repo under the folder Test.
Execution times comparison.
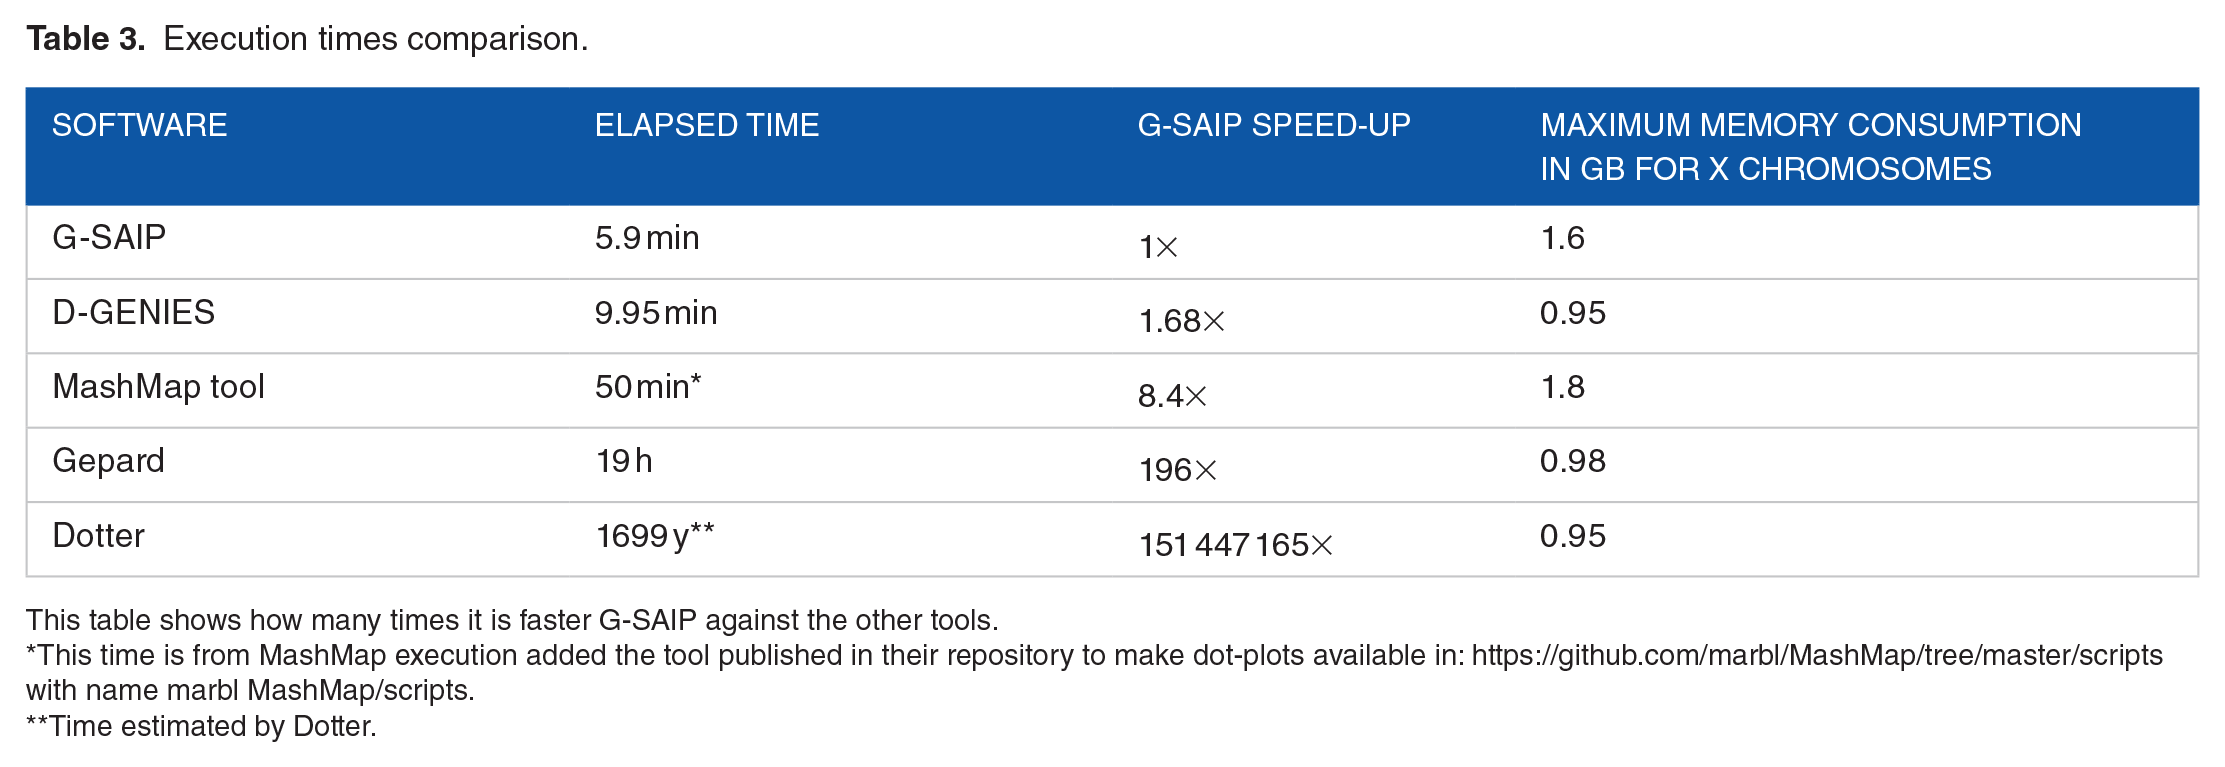
This table shows how many times it is faster G-SAIP against the other tools.
This time is from MashMap execution added the tool published in their repository to make dot-plots available in: https://github.com/marbl/MashMap/tree/master/scripts with name marbl MashMap/scripts.
Time estimated by Dotter.
Assembly quality test
Read sequencing data of Arabidopsis thaliana and Drosophila melanogaster was analyzed with FASTQC to examine the sequences quality and adapter’s presence. Then, Trimmomatic was executed to cut sequences with substandard quality. Next, FASTQC was re-executed for new sequences to visualize the new quality. Secondly, VELVET, MEGAHIT, ABySS, and MaSuRCA were executed using the trimmed data and k-mer values of 13, 51, 71, and 91. All completed assemblies had a minimum contig length of 800 bp. These assemblies’ results were the input of QUAST to evaluate and compare the best assembly.
Moreover, BUSCO was executed for Arabidopsis and Drosophila genomes to complement the QUAST results. QUAST results for each assembly with its N50 value are in Figure S1. Figure S2 shows BUSCO results for all assemblies.
Finally, each assembly was compared with its respective reference genome (Arabidopsis thaliana or Drosophila melanogaster) using G-SAIP with a window size of 113 000 for Arabidopsis and 135 000 for Drosophila, the rest of the parameters were assigned by default, and quality assembly parameter was set to true for ragtag execution before dot-plot calculation. Figure 3a and c showed the highest quality assembly dot-plot for Arabidopsis and Drosophila, respectively, against the reference genome, and Figure 3b and d displayed lower quality assembly dot-plot for each organism against the reference. In addition, the N50 value and the complete and single-copy BUSCO’s percentage were added to each image to analyze them in the discussion section. All details about this section are in supplementary data, and all dot-plots are in the same document from Supplemental Figures S3 to S30.

G-SAIP assemblies versus reference genome dot-plots: (a) MaSuRCA assembly for Arabidopsis, (b) Velvet k-mer 31 assembly for Arabidopsis, (c) MaSuRCA assembly for Drosophila, and (d) Velvet k-mer 91 assembly for Drosophila.
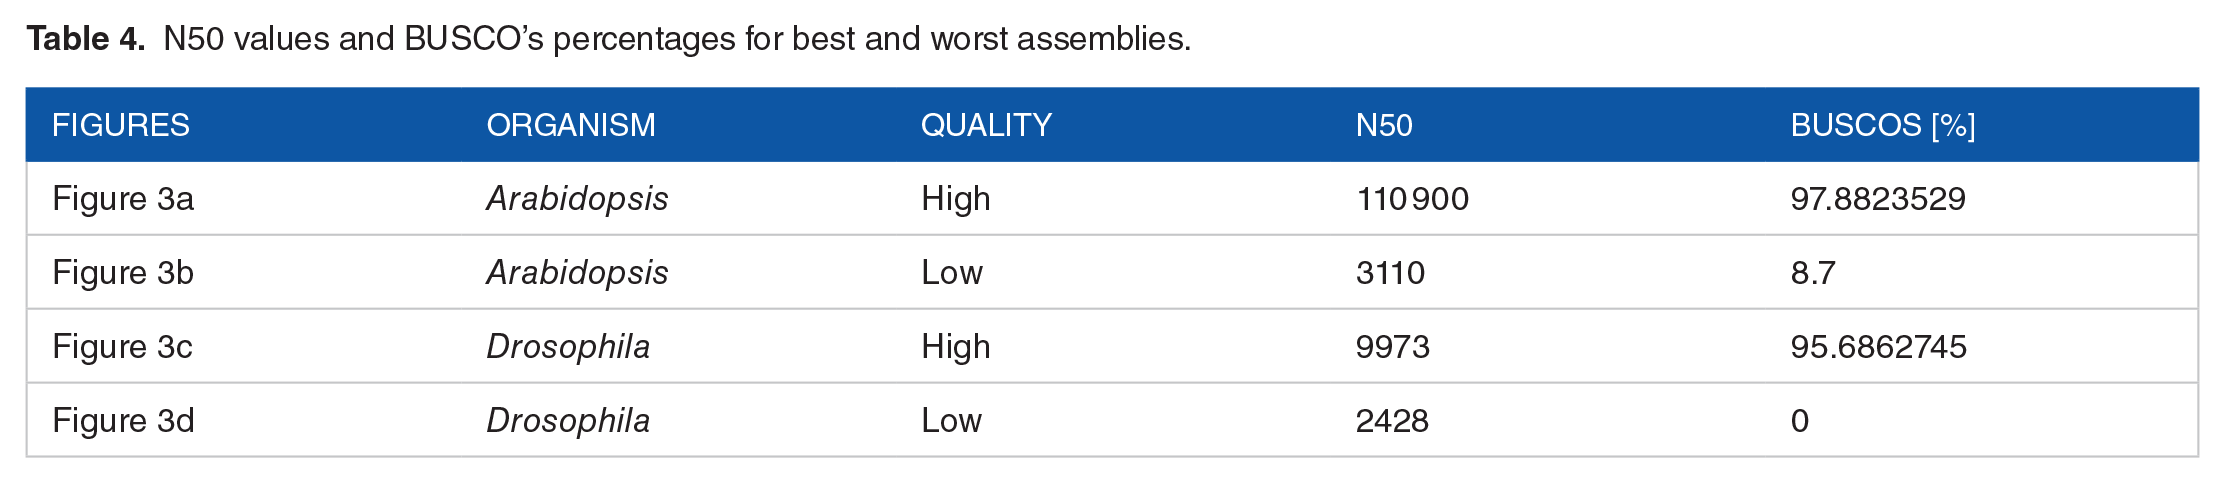
In Table 4 are lists values of N50 and complete and single copy BUSCO’s percentage for dot-plots in Figure 3.
N50 values and BUSCO’s percentages for best and worst assemblies.
Comparative genomic tests
In this experiment, G-SAIP generated a self-plot with X chromosomes in Table 2. Thus, all X chromosomes were pre-joined in a single FASTA file to generate a unique dot-plot with all comparisons. In this case, G-SAIP was executed with a window size of 160 000 because this is the window for the shortest chromosome to analyze. Also, MashMap segment length was set at 5000, 90% identity percentage was chosen, and k-mer size of 16 to enhance the dot-plot quality. In addition, for better visualization, the draw sequences limits were set to true to draw lines at the end of sequences. Figure 4 demonstrates the dot-plot for the X chromosomes comparison. G-SAIP generated this image in 5.9 minutes (358 seconds) for 860 Mbp compared with GEPARD which performed this alignment in 19.3 hours.

Dot-plots for X mammals’ chromosomes.
Scalability test
G-SAIP was executed with the Triticum turgidum genome using 62 CPUs distributed in a different number of nodes. Each run had a memory consumption of <32 Gb. We ran each test 10 times to do a box-plot graph. Figure 5 shows that G-SAIP execution times are similar between each computing node with few differences according to the number of nodes.

Boxplot of G-SAIP execution times over several nodes with 62 CPUs. This experiment was tested in computing cluster that has its queue with SCLURM scheduler.
This experiment shows that are no significant time differences changing the number of computing nodes parameter, the performance of the time is associated with the process saturation in the cluster where the experiment was executed. In addition, weak and strong scaling experiment Formulas (2) and (3) were applied to execution times for different cores over the same node in the cluster. Results are painted in Figure 6. In GitHub repository are all scripts and result files executed for this article in “test” folder.

Scaling test for each organism. Strong scaling test with Amdahl’s law with light width and bold line for weak scaling test with Gustafson’s law.
Discussion
Over the last years, software that performs graphical sequence aligners have proposed different approaches to generate dot-plots, such as DOTTER, which has high performance for short sequences using dynamic programming, software with heuristics methods to calculate dot-plot as GEPARD or r2cat, 80 and recently published as Flexidot or D-GENIES. Nevertheless, this software presents some issues with big size sequences (greater than 3 Gb); some of them are no longer available, or the languages they were developed are depreciated. Software like D-GENIES report execution times shorter than G-SAIP, but we present a software that is easily integrated into pipelines, also, G-SAIP is easier configurable than D-GENIES which is a web application useful for making dot-plots within an interactive interface, and the default parameters like maximum RAM memory, maximum file size are not intuitive modifiable. In addition, the application of HPC has demonstrated high performances for several bioinformatics tasks such as multiple sequence alignment,41-45 sequence mapping,45-48,81 analyzing transposable elements,82-84 and identification of transposon insertion polymorphisms, 83 among others. Nevertheless, HPC software has not been deployed for graphical alignment. In this way, this software will be helpful to process big data supported by the availability of clusters around the world 18 and the number of massive sequencing projects.
However, G-SAIP reduces the execution time for dot-plot calculation, generating dot-plots in times under 30 minutes for sequence size of <3 GB and speeding up the algorithm up to 3× times faster, increasing the number of CPUs. In the same way, G-SAIP can generate dot-plots of sequence greater than 3 GB in size, even Pinus taeda genome (21 GB) in a few hours in contrast with other software that does not support large files. Also, G-SAIP executes graphical aligners with chromosome sequences even 196× times faster than Gepard with detail in the output image because this tool does not apply any parallel strategy to calculate the graphical alignment.
A demonstrated application of dot-plots is to check assembly quality based on a genome reference. 85 For this reason, G-SAIP is also a helpful tool showing through dot-plots the similarity of respective assemblies against the reference genome using ragtag 59 tool to make a previous ordering with the reference and complementing results given by other metrics such as BUSCO and N50 score. For example, in Figure 3a a diagonal line across the image is drawn, which shows that the Arabidopsis reference genome and the MaSuRCA 71 assembly are close similar, squared regions marked in some points of the images are telomeres and centromeres of chromosomes, these regions are difficult to assemble and are masked by N. This similarity between no recognized regions in assembly and reference genomes are translated in black marked zones in dot-plot and are related to higher values of N50 and percentage of complete and single-copy BUSCOs. In contrast, Figure 3d is no diagonal lines in the image; this denotes that the assembly had very short contigs, and it was not possible to rebuild any part of the genome in relation to N50 value and percentage of BUSCOs that has low values for this assembly.
Moreover, comparative genomic analysis tools are essential to characterize genomes and sequences, focusing on variations between genomes of 2 or more individuals. 86 However, visualizing this data is not easy, and it would be even more complex with large sequences because the standard tools to make comparative genomic generate text files as results. 87 A first approximation for dot-plot usage in comparative genomics with software like DOTTER restricted the size of sequences and execution times required for these tasks. In this way, G-SAIP offers the possibility of handling large sequences (up to 21 GB) and executing fast graphical alignment with high quality (in order of minutes or few hours) even in multiples nodes with distributed memory and few latencies compared to 1 node execution. Furthermore, this tool provides a new way to visualize the similarity between sequences, allowing tuning option as similarity percentage to show repetitive sections, deletions, insertion, and rearrangement given by speciation events and delivering a result more comprehensively for researchers.
Conclusions
Currently, there is a necessity for tools to process large-scale genomic data sets in short periods. HPC clusters are growing worldwide in computational capacity offering the opportunity to researchers to process bigger and more complex information. G-SAIP is a novel graphical sequence aligner able to produce dot-plots at a genomic scale, using the computational resources available in HPC clusters and the data produced by massive sequencing projects.53,54 Due to the parallel strategy used by the software and the scalability provided by HPC techniques, G-SAIP can accelerate the graphical alignments up to 1.68× times than other current software tested. This tool provides the opportunity to analyze, at a genomic scale, complete genomes with sizes up to 21 GB (Pinus taeda), facilitating processes such as assembly quality checking, comparative genomics, and identification of structures in DNA as transposable elements and other repetitive sequences.
Supplemental Material
sj-docx-1-evb-10.1177_11769343221150585 – Supplemental material for G-SAIP: Graphical Sequence Alignment Through Parallel Programming in the Post-Genomic Era
Supplemental material, sj-docx-1-evb-10.1177_11769343221150585 for G-SAIP: Graphical Sequence Alignment Through Parallel Programming in the Post-Genomic Era by Johan S. Piña, Simon Orozco-Arias, Nicolas Tobón-Orozco, Leonardo Camargo-Forero, Reinel Tabares-Soto and Romain Guyot in Evolutionary Bioinformatics
Footnotes
Funding:
The author(s) disclosed receipt of the following financial support for the research, authorship, and/or publication of this article: Simon Orozco-Arias is supported by a Ph.D. grant from the Ministry of Science, Technology and Innovation (Minciencias) of Colombia, Grant Call 785/2017. JSP, SOA, NTO, RTS and RG were supported by Universidad Autónoma de Manizales, Manizales, Colombia under project 752-115, and Universidad de Caldas under project 0319120. This work was supported by Minciencias-Ecos Nord No. C21MA01 and 285-2021 and STICAMSUD 21-STIC-13.
Declaration of Conflicting Interests:
The author(s) declared no potential conflicts of interest with respect to the research, authorship, and/or publication of this article.
Author Contributions
The authors confirm contribution to the paper as follows:
Johan S. Piña conceived and designed the software, performed the experiments, analyzed the data, prepared figures and/or tables, authored or reviewed drafts of the article, and approved the final draft.
Simon Orozco-Arias conceived and designed the software, performed the experiments, analyzed the data, prepared figures and/or tables, authored or reviewed drafts of the article, and approved the final draft.
Nicolas Tobón-Orozco analyzed the data, prepared figures and/or tables, and approved the final draft.
Leonardo Camargo-Forero contributed to the design of the parallel architecture for the software.
Reinel Tabares-Soto analyzed the data, authored or reviewed drafts of the article, and approved the final draft.
Romain Guyot conceived and designed the experiments, authored or reviewed drafts of the article, and approved the final draft.
Supplemental material
Supplemental material for this article is available online.
References
Supplementary Material
Please find the following supplemental material available below.
For Open Access articles published under a Creative Commons License, all supplemental material carries the same license as the article it is associated with.
For non-Open Access articles published, all supplemental material carries a non-exclusive license, and permission requests for re-use of supplemental material or any part of supplemental material shall be sent directly to the copyright owner as specified in the copyright notice associated with the article.