
Abstract
Hepatocellular carcinoma (HCC) is the most common primary malignancy of the liver. Although the RNA modification N6-methyladenine (m6A) has been reported to be involved in HCC carcinogenesis, early diagnostic markers and promising personalized therapeutic targets are still lacking. In this study, we identified that 19 m6A regulators and 34 co-expressed lncRNAs were significantly upregulated in HCC samples; based on these factors, we established a prognostic signal of HCC associated with 9 lncRNAs and 19 m6A regulators using LASSO Cox regression analysis. Kaplan-Meier survival estimate revealed correlations between the risk scores and patients’ OS in the training and validation dataset. The ROC curve demonstrated that the risk score-based curve has satisfactory prediction efficiency for both training and validation datasets. Multivariate Cox’s proportional hazard regression analysis indicated that the risk score was an independent risk factor within the training and validation dataset. In addition, the risk score could distinguish HCC patients from normal non-cancerous samples and HCC samples of different pathological grades. Eventually, 232 mRNAs were co-expressed with these 9 lncRNAs according to GSE101685 and GSE112790; these mRNAs were enriched in cell cycle and cell metabolic activities, drug metabolism, liver disease-related pathways, and some important cancer related pathways such as p53, MAPK, Wnt, RAS and so forth. The expression of the 9 lncRNAs was significantly higher in HCC samples than that in the neighboring non-cancerous samples. Altogether, by using the Consensus Clustering, PCA, ESTIMATE algorithm, LASSO regression model, Kaplan-Meier survival assessment, ROC curve analysis, and multivariate Cox’s proportional hazard regression model analysis, we established a prognostic marker consisting of 9 m6A regulator-related lncRNAs that markers may have prognostic and diagnostic potential for HCC.
Keywords
Introduction
Hepatocellular carcinoma (HCC) is the most common primary malignancy of the liver. Most patients with HCC have a history of alcohol abuse or hepatitis B or C virus (HBV or HCV) infection.1,2 Despite the great advances in chemo- and radio-therapies these years, the prognosis of hepatocellular carcinoma remains poor. There is an urgent need to develop novel early diagnostic markers and promising personalized therapeutic targets.
The RNA modification of N6-methyladenine (m6A) is a type of specific RNA modification that are reversible and dynamic; m6A modification occurs on various RNAs, such as mRNAs, tRNAs, snRNAs, and long non-coding RNAs (lncRNAs). 3 Therefore, it is a major kind of RNA modification. m6A-related proteins can be classified into 3 categories based on their functions: methyltransferases (METTL3, METTL14, and KIAA1429, “writers”), demethylases (ALKBH5 and FTO, “erasers”), and m6A-binding proteins/effectors (YTHDF1, YTHDF2, and YTHDF3, “readers”).4,5 Dysregulation of the m6A gene may play an important role in oncogenes expression, indicating that the m6A gene is involved in the tumorigenesis of HCC.6-8 Increasing evidence suggests that m6A modification is involved in various aspects of malignant behaviors, including proliferation, differentiation, invasion, and metastasis.9,10 Notably, the crucial role of lncRNA in HCC initiation and development has been widely recognized.11,12 Although the important role of m6A regulators in HCC has been reported, the interaction between m6A genes and lncRNAs remains unclear. This study aimed to develop a model consisting of m6A-related genes and co-expressed lncRNAs to predict the prognosis of HCC.
Traditional prognostic predictors of HCC are primarily associated with tumor size, clinical staging, alpha-fetoprotein (AFP) and pathological manifestations.13-15 Although several studies have proposed various prognostic models based on differentially expressed genes (DEGs) between HCC and non-cancerous samples, the sensitivity and specificity of these predictive models remain unsatisfactory. With the developments of gene microarray and high-throughput sequencing technologies, it has been confirmed that prognosis-related mRNA signatures are strongly associated with the overall survival of HCC patients. For example, the Least Absolute Shrinkage and Selection Operator (LASSO) is a regression algorithm for high-dimensional data to select the most prominent predictive features in the training dataset. 16
The purpose of this study was to develop a novel model for predicting the prognosis of HCC. The Genomic Data Commons (GDC) data portal from The Cancer Genome Atlas Liver Hepatocellular Carcinoma (TCGA-LIHC) has been used as the training set and the TCGA-LIHC dataset as the validation set. A dataset from the International Cancer Genome Consortium (ICGC) was collected and applied for correlation analysis. We analyzed the differential lncRNAs expression between normal and cancer tissues that might co-express with the m6A regulators—based on the m6A genes and co-expressed lncRNAs. The model improves the accuracy and efficiency of predicting HCC prognosis based on m6A genes and co-expression of lncRNAs.
Materials and Methods
Data source
We collected Genomic Data Commons (GDC) Data Portal from The Cancer Genome Atlas Liver Hepatocellular Carcinoma (TCGA-LIHC) as the training set (n = 370) and TCGA-LIHC dataset as the validation set (n = 367). From the International Cancer Genome Consortium (ICGC; n = 232), collected and used for correlation analysis. Samples with clinical information and expression profile data were used for analysis.
The selection of m6A regulators
Through literature review, we compiled a list of 19 m6A regulators from recently published literature, including 7 writers (METTL3, METTL14, WTAP, RBM15, RBM15B, ZC3H13, KIAA1429), 10 readers (IGF2BP1, IGF2BP2, IGF2BP3, YTHDC1, YTHDC2, HNRNPC, HNRNPA2B1, EIF3A, YTHDF2, YTHDF3), and 2 erasers (FTO and ALKBH5).
Correlation analysis by Pearson’s correlation analysis
According to the TCGA-LIHC-GDC dataset, we performed Pearson correlation analysis (|r|>0.6, P < .001) to identify lncRNAs that were co-expressed with the above m6a regulators. Based on these co-expressed lncRNAs, we used consensus clustering and principal component analysis (PCA) to classify HCC patients into 2 clusters: Cluster1 (n = 223) and Cluster2 (n = 147). The survival probabilities of the 2 groups were subsequently analyzed using the Kaplan-Meier survival estimation method. The survival probabilities of the 2 groups were subsequently analyzed using the Kaplan-Meier survival estimation method, and the tumor purity of HCC patients was evaluated with the ESTIMATE algorithm.
Identification of prognostic signature
The LASSO algorithm was performed to determine the coefficients of the 9 lncRNAs. Risk scores for each patient’s prognostic signature were calculated using the LASSO package of R language. The formula was: risk score = gene1 expression × β1gene1 + gene2 expression × β2gene2 + gene3 expression × β3gene3.17,18 For the present study, the formula is: Exp (LINC00294) × 1.7054152936917113 + Exp (SPATA13) × 0.5343857464082967 + Exp (SNHG20) × −0.9134898623900841 + Exp (AC024560.3) × 2.7394360120552985 + Exp (AC027601.1) × 9.081174156665293 + Exp (LINC00205) × −0.27010300079236227 + Exp (AC092171.4) × −4.0458719898852875 + Exp (SNHG1) × −3.3499074391566745 + Exp (LINC00630) × 2.8716984583245337. The cases in both training and validation dataset were divided into high-risk and low-risk groups based on the median risk score. The difference in OS between the high-risk and low-risk groups was calculated using the Kaplan-Meier method with a 2-sided log-rank test. The 5-year receiver-operating characteristic (ROC) curve was constructed using the survival ROC package in R to analyze the predictive accuracy.
Univariate and multivariate Cox regression analyses were used to identify clinical risk parameters associated with survival to establish genome-clinicopathologic nomograms. Markers based on the 9-lncRNA characteristic risk scores and risk parameters were used to develop genome-clinicopathological nomograms.
Genomic-clinicopathologic nomogram
The performance of bootstrap method of calibration and discriminatory model was performed by 1000-iterations of resampling. The consistency index (C index) was calculated to assess discrimination, which is the ability of the model to distinguish between surviving and non-surviving patients. The nomogram calibration curve for 5-year OS was subsequently plotted to estimate the accuracy of the actual observed rate versus the predicted survival probability.
Clinical sample collection
Clinical sample collection following our previous study. 19 Samples were collected from patients who had never received any treatment before sampling and who had completed prior written informed consent, according to the approval of the Third Xiangya Hospital’s Research Ethics Committee. The HCC tissues (n = 20) were taken from individuals diagnosed histopathologically. Simultaneously, adjacent paired non-cancerous samples were collected. All HCC patients had no other viral diseases, such as hepatitis or the Human Immunodeficiency Virus (HIV). Additionally, none of these individuals had any other forms of liver disease. 20 Until they were applied in subsequent experiments, all samples were kept at −80°C.
qRT-PCR
Total RNA isolation was performed using TRIzol (Invitrogen) according to our previously described study. 19 Reverse transcription of total RNA (1 μg) to cDNA was performed using the High-Capacity RNA-to-cDNA Reverse Transcription Kit (Applied Biosystems, Thermo Fisher Scientific). The expression levels of 9 lncRNAs were detected using an ABI 7500 Fast real-time PCR (Applied Biosystems), Using GAPDH as an internal reference gene, the 2−ΔΔCt technique was used to calculate the relative mRNA expression. The primer sequence was listed in Table S1.
Statistical analyses
All statistical analysis was performed using SPSS (version 22.0) and R (version 3.5.1; https://www.r-project.org/). Statistically significant was considered when P < .05. Missing clinical data was removed from the list; if the value of any parameter was missing, the entire sample was deleted from the analysis.
Missing clinical data was removed from the list; if the value of any parameter was missing, the entire sample was deleted from the analysis. The OS was defined as the time interval from the date of diagnosis to death. Means of continuous variables were compared by t-test. Survival analysis was performed using the Kaplan-Meier method for the high-risk and low-risk groups, using the R-language 2-sided log-rank test.
Results
LncRNAs co-expressed with m6A regulators
To identify lncRNAs that might be correlated with the above m6A regulators, we performed Pearson’s correlation analysis to identify co-expressed lncRNAs based on the TCGA-LIHC-GDC dataset. The results revealed that 34 lncRNAs were co-expressed with the 19 m6A regulators (|r|>0.6, P < .001) (Figure 1A and B). TCGA-LIHC-GDC data indicated that the expression levels of the 19 m6A regulators and the 34 co-expressed lncRNAs were increased within cancerous samples than in normal healthy samples (Figure 1C and D).

Selecting lncRNAs that were co-expressed with m6A core regulators (A and B) r values and P values of lncRNAs co-expressed with m6A core regulators based on data from TCGA-LIHC-GDC. Correlations with |r|>0.6, P < .001. (C and D) expression levels of selected lncRNAs and m6A core regulators in tumor and non-cancerous control samples based on TCGA-LIHC-GDC data.
Sample selection and hierarchical clustering
Based on 34 lncRNA expression profiles, we used Consensus Cluster to classify the HCC patients in the TCGA-LIHC-GDC dataset and found that HCC samples could be classified into 2 clusters: Cluster1 (n = 223) and Cluster2 (n = 147) (Figure 2A and B). The classification performance of the consensus clusters was further confirmed by principal component analysis (PCA) (Figure 2C). Then, the Kaplan-Meier survival estimate demonstrated a significantly worse prognosis for Cluster2 (P < .001; Figure 2D). Subsequently, the ESTIMATE algorithm was used to calculate the matrix score, immune infiltration score, and tumor purity for both HCC samples. We discovered that Cluster2 exhibited higher malignancy (lower stromal score, lower immune infiltration score, and higher tumor purity; Figure 2E-G), indicating that HCC samples in Cluster2 had higher tumor specificity. Therefore, we selected the cases in Cluster2 (n = 147) for subsequent analysis.

Sample selection (A-C) Cumulative distribution function curve, consensus clustering, and principal component analysis (PCA) were performed to analyze TCGA-LIHC-GDC cases; cases could be divided into cluster1 and cluster2. (D) Kaplan-Meier survival estimation was applied to perform survival analysis for cases in cluster1 and cluster2. (E and G) Stromal score, immune score, and tumor purity of cases in cluster1 and cluster2 were calculated by the ESTIMATE algorithm.
Establishment of risk signature by LASSO algorithm and prognostic potential of m6A regulator-correlated lncRNAs
To predict the prognosis based on the 34 lncRNAs co-expressed with m6A RNA methylated regulators, we employed LASSO Cox regression analysis to establish a risk score model using 147 samples from Cluster2. Risk profiles for 9-genes were established based on the minimal criterion, and risk coefficients were derived using the LASSO algorithm; this coefficient was then used to evaluate the risk score for each case in Cluster2 (Figure 3A and B). The 9 lncRNAs were: LINC00294, SPATA13, SNHG20, AC024560.3, AC027601.1, LINC00205, AC092171.4, SNHG1, and LINC00630. According to the regression coefficient, the risk score for each case was calculated using the above formula.

LncRNA risk model established using the Least Absolute Shrinkage and Selection Operator (LASSO) algorithm: (A) coefficients calculated using LASSO multiple Cox regression and (B) the LncRNA risk model consists of 9 lncRNAs.
Cases with TCGA-LIHC-GDC, TCGA-LIHC, and ICGC cluster2 were divided into high- and low-risk groups according to the median risk score. Thereafter, we evaluated the potential of the 9-gene signature in terms of prognosis and risk score. Firstly, we used Kaplan-Meier survival estimates to assess the correlation between risk scores and overall patient survival (OS). As shown in Figure 4A to D, the case prognosis of the training dataset TCGA-LIHC-GDC and validation dataset TCGA-LIHC can be distinguished by the risk score; Figure 4E and F showed that the case prognosis of the validation dataset ICGC, although not significant, can also be distinguished by the risk score. Similarly, it can be seen from Figure 4G and H that the prognosis of cases can be distinguished using the risk score according to GSE15654; the prognosis of cases could also be distinguished by the risk score, although not significantly, according to the GSE76427 score. In other words, the risk score was shown to be tightly linked to HCC patients’ OS.
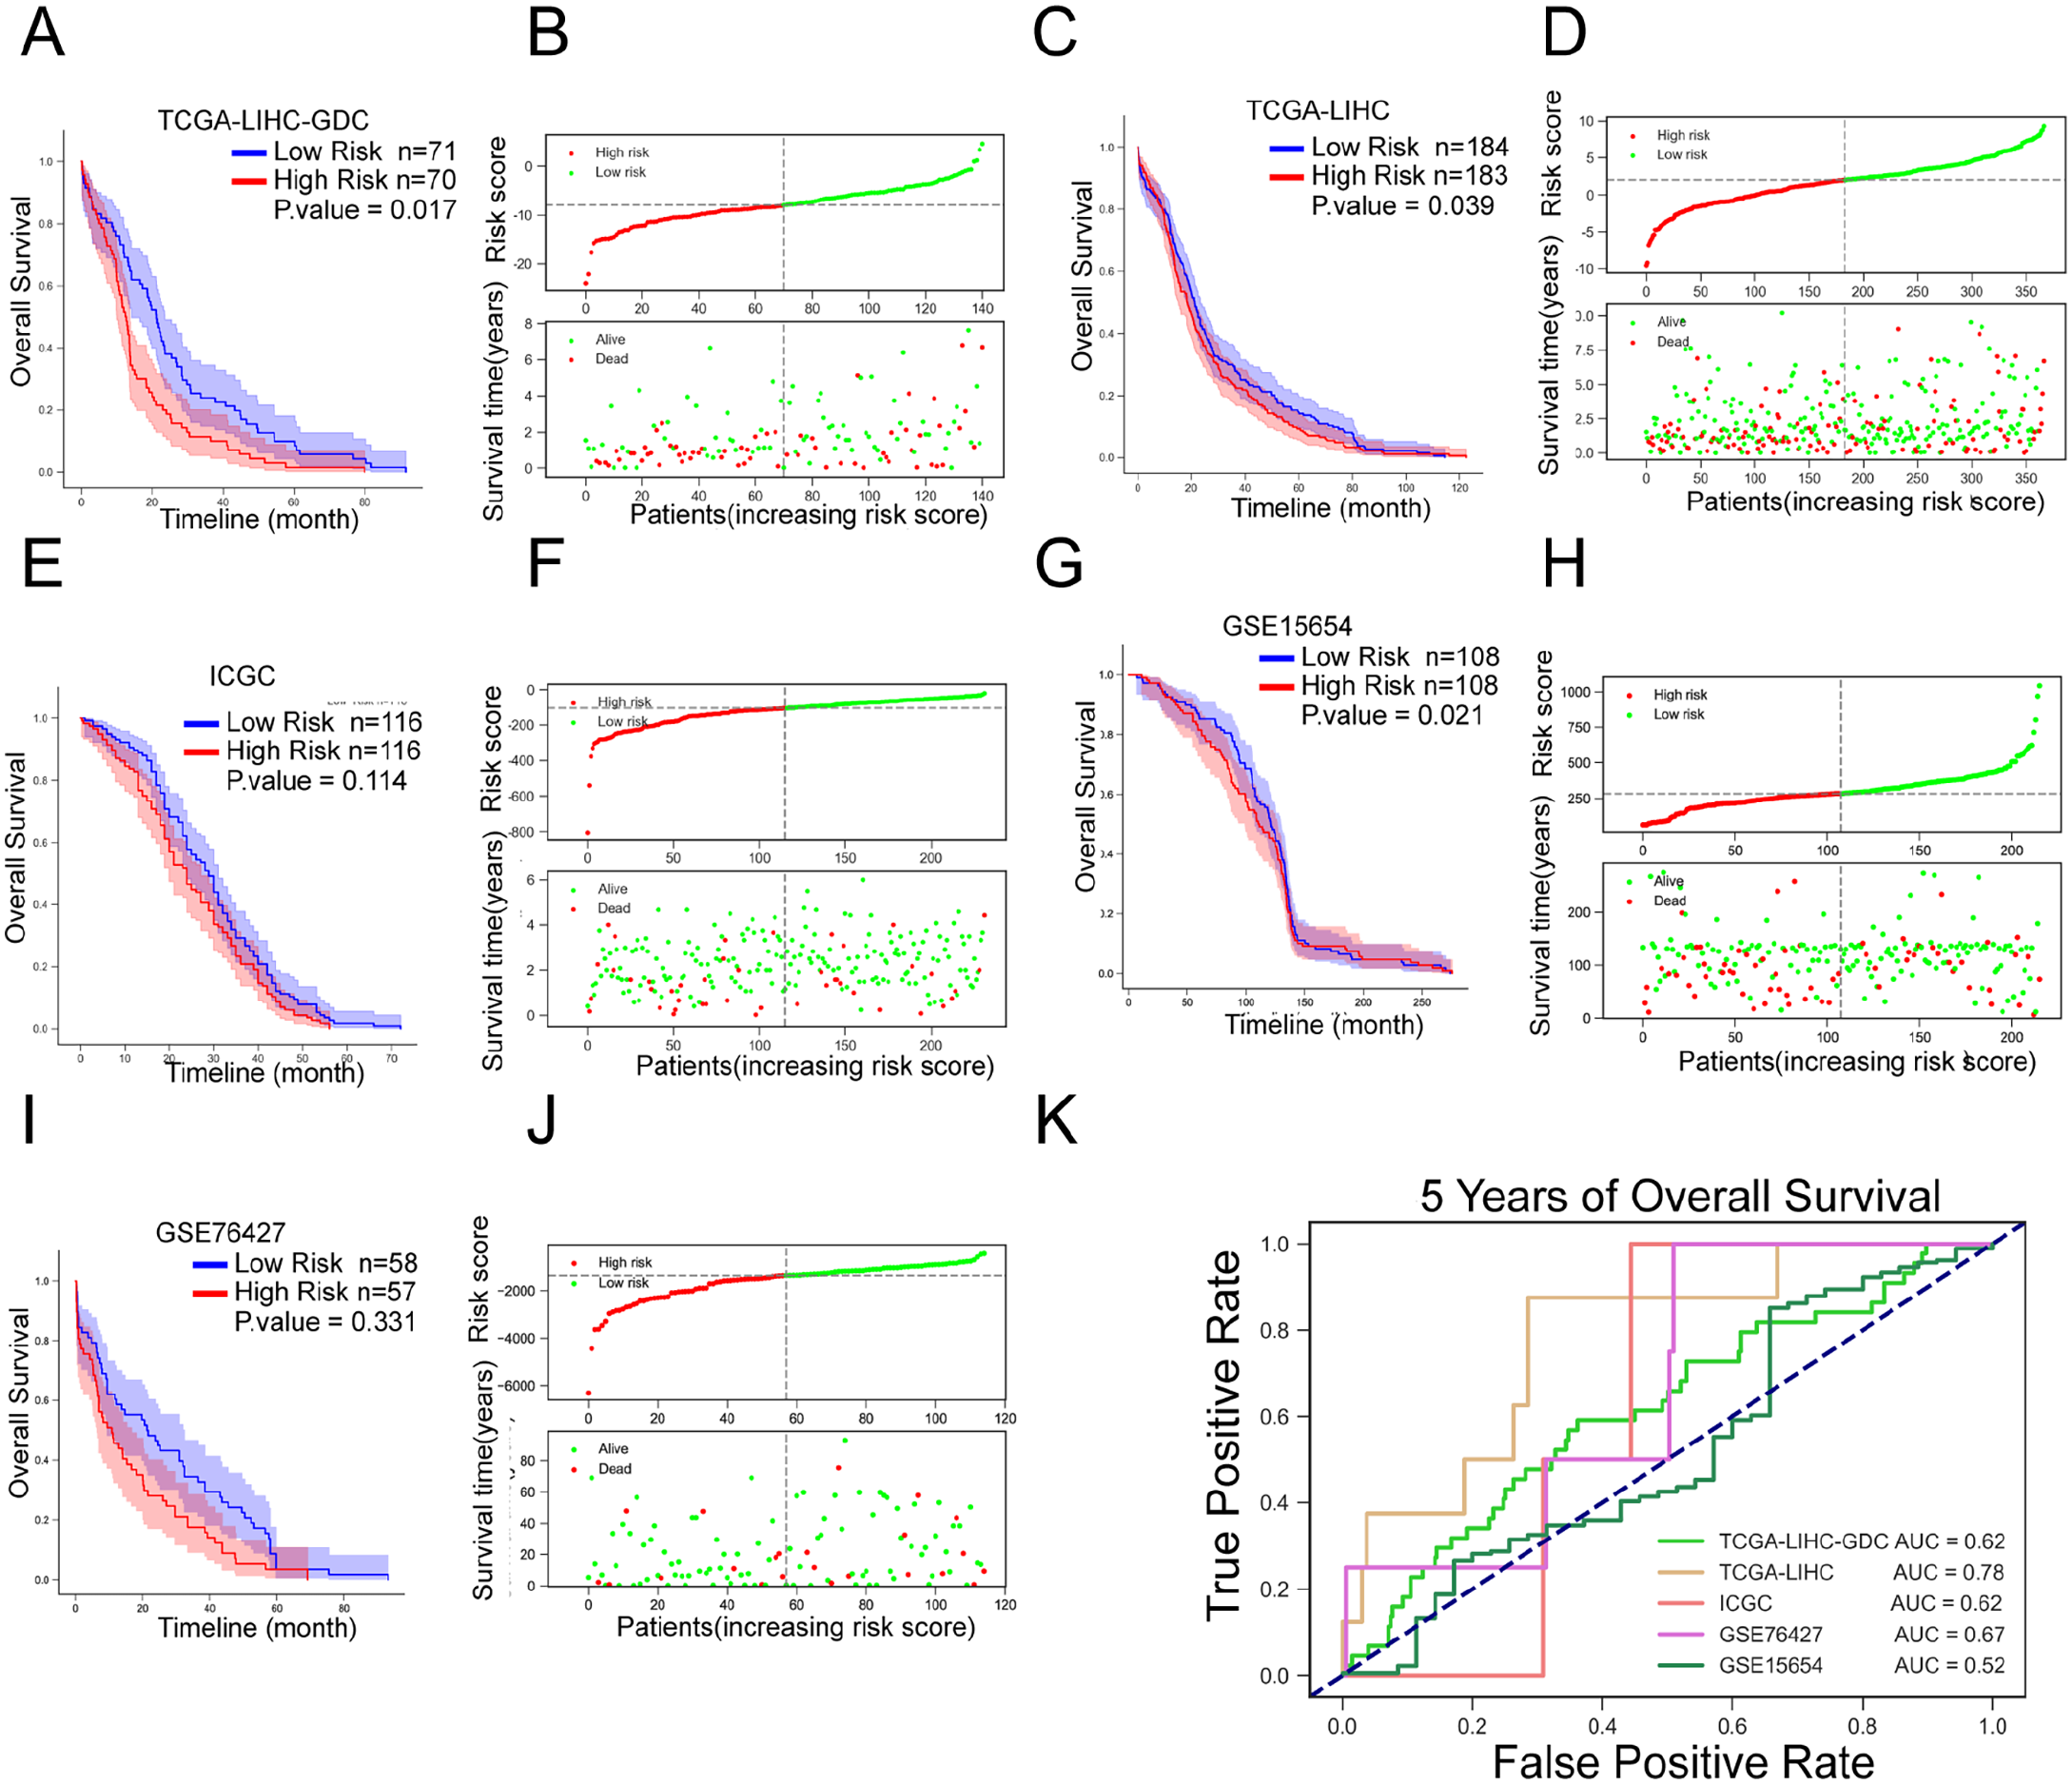
Validation of the prognostic value of the lncRNA risk model (A and B) Risk scores of TCGA-LIHC-GDC cases were calculated using the above formula. The median risk score was used as the threshold to divide the cases into 2 groups; the correlation between the overall patient survival and the risk score was analyzed. (C and D) Risk scores in TCGA-LIHC cases were calculated using the above formula. Cases were divided into 2 groups using the median value of the risk score as a cut-off; the correlation between the overall patient survival and the risk score was analyzed. (E and F) Risk scores of ICGC cases were calculated using the above formula. The median risk score was used as the threshold to divide the cases into 2 groups; the correlation between overall patient survival and the risk score was analyzed. (G and H) Risk scores of GSE15654 cases were calculated using the above formula. Cases were divided into 2 groups using the median risk score as the threshold; the correlation between overall patient survival and risk score was analyzed. (I and J) Risk scores of GSE76427 cases were calculated using the above formula. Cases were divided into 2 groups using the median risk score as the threshold; the correlation between overall patient survival and risk score was analyzed. (K) Receiver operating characteristic (ROC) curves showed the predictive efficiency of the risk score model based on TCGA-LIHC-GDC, TCGA-LIHC, ICGC, GSE15654, and GSE76427 cases in 5-year overall survival.
Secondly, we employed the receiver operating characteristic (ROC) curve 21 to test the predictive efficiency of the survival model. Figure 4G showed that the area under the curves (AUC) for OS from the training dataset TCGA-LIHC-GDC and validation dataset TCGA-LIHC and ICGC were 0.78 (5 years), 0.62 (5 years), and 0.62 (5 years). The OS curves for GSE76427 and GSE15654 were 0.67 and 0.52, respectively. As revealed by the ROC curve, the risk score-based curve showed satisfactory predictive efficiency.
Thirdly, a multivariate Cox’s proportional hazard regression model was used to analyze the clinical characteristics of high-risk and low-risk groups. Figure 5 indicated that stage (P = 0.012, HR = 0.503; 95%CI = 0.295-0.86) and the risk score (P = 0.0242, HR = 1.891; 95%CI = 1.087-3.29) predicted patients’ OS according to training dataset TCGA-LIHC-GDC. As shown in Figure 6, according to validation dataset TCGA-LIHC, stage (P < .001, HR = 0.390; 95%CI = 0.269-0.567) and the risk score (P = 0.0098, HR = 1.638; 95%CI = 1.126-2.383) predicted patients’ OS.

Cox multivariate analyses of clinicopathological variables, including age, gender, stage, and the risk score, and overall survival based on TCGA-LIHC-GDC.

Cox multivariate analyses of clinicopathological variables, including age, gender, stage, and the risk score, and overall survival based on TCGA-LIHC.
The diagnostic potential of the risk score
After confirming the prognostic potential of the risk score of the 9-lncRNA signaling in the prognosis of HCC patients, we next investigated whether the risk score could distinguish cluster2 from cluster1 and HCC patients from normal controls. We separated cases in TCGA-LIHC-GDC according to the patients’ risk score, using the median value of risk score as cut-off, and the high- and low-risk score groups overlapped with the cluster1 and cluster2 (Figure 7A). Moreover, the risk score could also distinguish HCC patients from normal controls (Figure 7B and D) and HCC cases in different pathological grades (Figure 7C and E), according to the training dataset TCGA-LIHC-GDC and validation dataset TCGA-LIHC.

The diagnostic potential of the risk score: (A) risk scores of cluster1 and cluster2 cases based on TCGA-LIHC-GDC, (B) risk scores of normal and HCC cases based on TCGA-LIHC, (C) risk scores of HCC cases in different grades based on TCGA-LIHC, (D) risk scores of normal and HCC cases based on TCGA-LIHC-GDC, and (E) risk scores of HCC cases in different grades based on TCGA-LIHC-GDC.
Signaling pathway and functional enrichment annotation of risk factors (9 lncRNAs)
We employed independent datasets GSE101685 and GSE112790 to analyze genetic differences between HCC and normal tissues (|FC|>1, FDR < 0.05), and Pearson correlation analysis (|r|>0.6, P < .001) to identify mRNA co-expressed with risk factors (9 lncRNAs). We obtained 232 differential mRNAs co-expressed with risk factors, including 18 downregulated genes and 214 upregulated genes (Figure 8A and B). The lncRNAs and these co-expressed mRNAs formed an interaction network (Figure 8C); among the 9 lncRNAs, interacting networks of 7 lncRNAs’ co-expressed mRNAs were obtained.
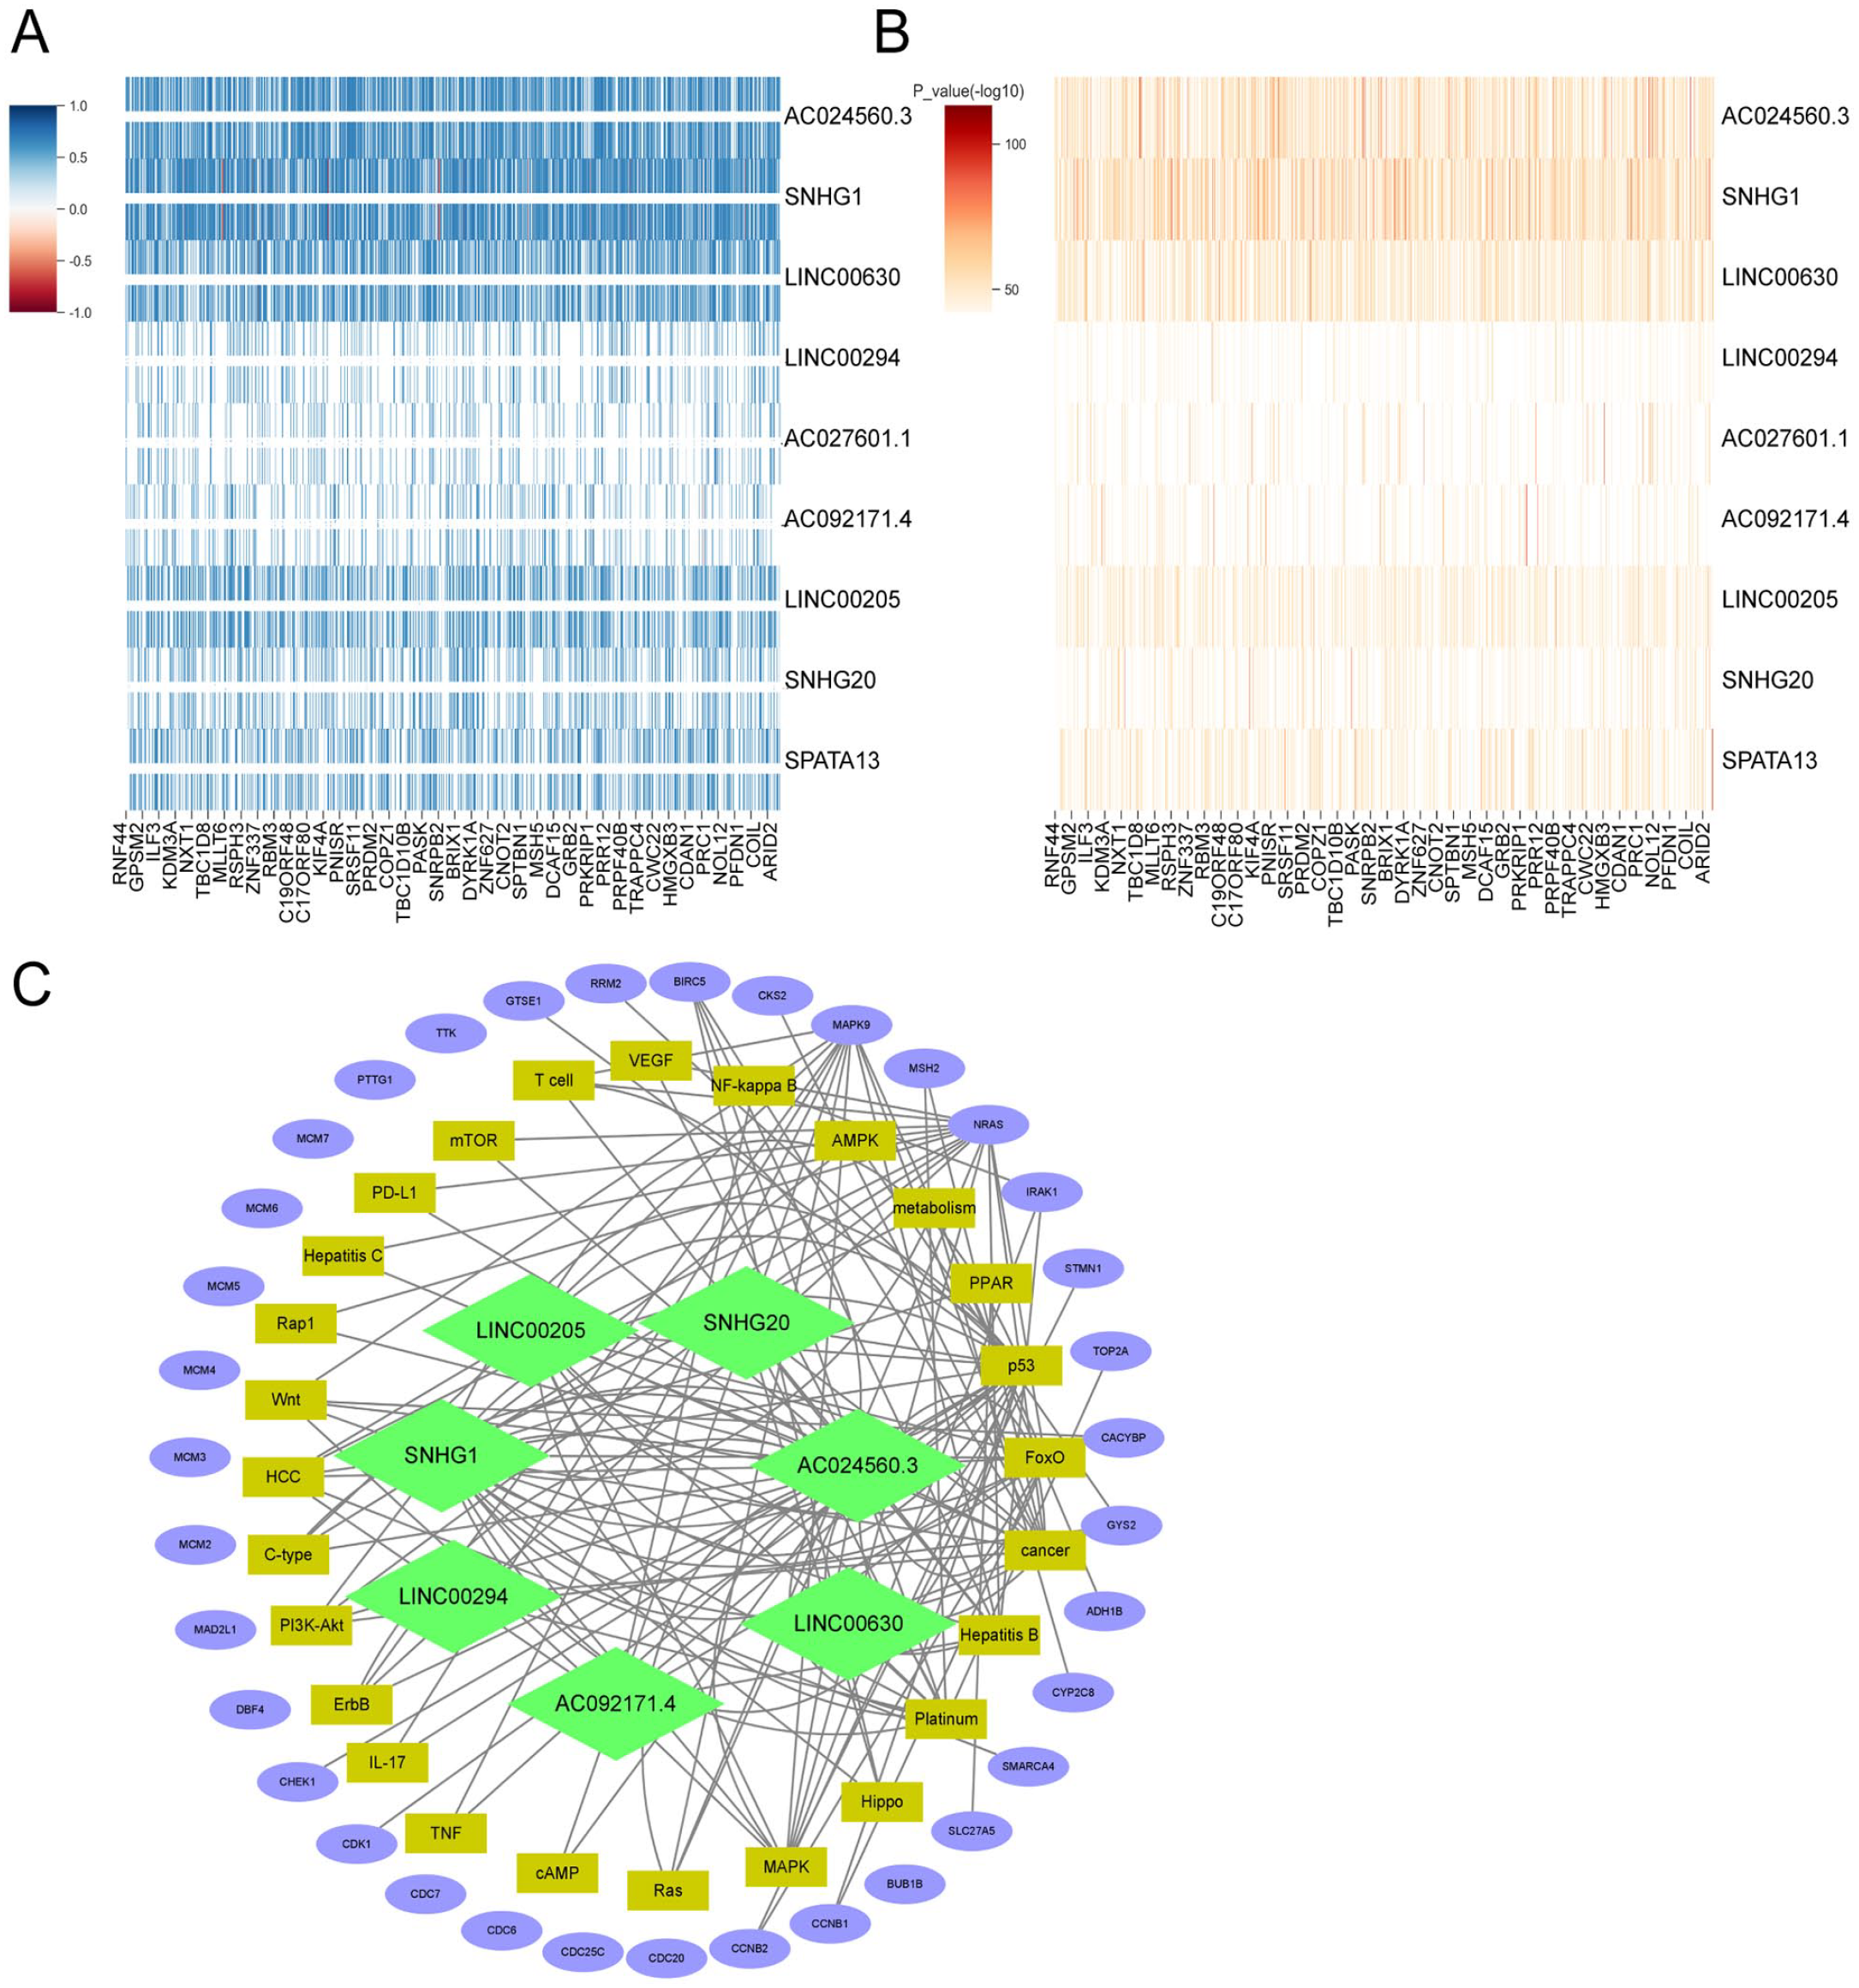
Interaction network of lncRNAs and co-expressed mRNAs (A and B) Differential genes between HCC and normal tissues (|FC|>1, FDR < 0.05) were analyzed and differentially-expressed genes co-expressed with the 9 lncRNAs were identified by Pearson’s correlation analysis (|r|>.6, P < .001). A total of 232 differential mRNAs co-expressed with 7 risk factors. (C) The lncRNAs and these co-expressed mRNAs formed an interacting network.
Then, we analyzed the functions of these mRNAs by Gene Ontology (GO), Kyoto Encyclopedia of Genes and Genomes (KEGG), and Protein-Protein interaction (PPI) analyses. By PPI analysis, these 232 mRNAs formed 7 interaction modules (Figure 9A). GO functional annotation revealed that these 232 mRNAs are mainly associated with cell cycle and cell metabolic activities such as mitosis, DNA replication, cytokinesis, DNA metabolism, protein degradation, and biological activities regulating TP53 transcription and transferase activity (Figure 9B to E). KEGG signaling enrichment annotation showed that the 232 mRNAs are mainly enriched in the cell cycle, drug metabolism, cancer, platinum resistance, PD-L1 and other pathways, as well as hepatocellular carcinoma, hepatitis B, hepatitis C, and other liver disease-related pathways and some important signal pathways such as p53, MAPK, Wnt, RAS, and so forth (Figure 10A and B).

Protein-Protein Interaction analysis and GO functional enrichment annotation (A) Protein-Protein interaction (PPI) analyses were performed to analyze the interaction protein network of the above mRNAs. (B-E) Gene Ontology (GO) functional annotation was performed to analyze the functions of the above mRNAs.

KEGG signaling enrichment annotation was performed to analyze the enriched signaling pathways of aforementioned mRNAs. (A) Hepatocellular carcinoma and (B) Cell cycle.
Moreover, clinical samples (tumor and non-cancerous samples) were collected and the expression levels of 9 lncRNAs species were examined in clinical samples. Consistent with online datasets, the expression of all 9 lncRNAs were significantly higher in HCC samples than in adjacent non-cancerous samples (Figure 11), suggesting that these lncRNAs might play a key role in the carcinogenesis of HCC.

The expression of the 9 lncRNAs was determined in HCC and adjacent non-cancerous samples using qRT-PCR.
Discussion
In the current study, we identified that 19 m6A regulators and 34 co-expressed lncRNAs were significantly upregulated in HCC samples. Based on these factors, we used LASSO Cox regression analysis to establish a 9-gene signature for HCC prognosis including 9 lncRNAs correlated with 19 m6A regulators. Kaplan-Meier survival estimate revealed correlations between the risk score and patients’ OS in both the training and validation dataset. The ROC curve demonstrated that the risk score-based curve had satisfactory prediction efficiency for both the training and validation dataset. Multivariate Cox’s proportional hazard regression analysis indicated that the risk score could be regarded as an independent risk factor in both training and validation dataset. In addition, risk scores could distinguish HCC patients from normal non-cancerous samples and HCC samples of different pathological grades. Eventually, 232mRNAs were co-expressed with these 9 lncRNAs according to GSE101685 and GSE112790. These mRNAs were enriched for cell cycle and cellular metabolic activities, drug metabolism, liver disease-related pathways, and some important signal pathways such as p53, MAPK, Wnt, RAS, and other signal pathways. The expression of these 9 lncRNAs was significantly higher in HCC samples than that in adjacent non-cancerous samples.
Regulation of m6A RNA modification has been associated with tumor differentiation, occurrence, 29 proliferative ability, 30 invasive ability, 29 and metastasis 31 based on the available studies. The m6A RNA modification serves as oncogenes and antioncogenes in malignancies. Huang et al and colleagues analyzed HCC cases in the TCGA datasets, and found that the expression levels of m6A RNA methylation-related regulators in hepatocellular carcinoma changed significantly in tumor tissue samples, suggesting a potential role for m6A modifications in HCC. 22 By combining gene expressions, binding targets, and binding motifs of many RNA binding proteins (RBPs) with a co-methylation network constructed using large-scale m6A methylomes across various cellular states. An et al 23 developed a computational framework to identify trans-regulators factors of m6A systematically. By using the framework to analyze publicly accessible m6A-seq data from 25 different cell lines, it was possible to identify 32 high-confidence m6A regulators with a respectable experimental validation rate. In this study, we analyzed TCGA-LIHC-GDC data and found that the expression levels of the 19 m6A regulators and the 34 co-expressed lncRNAs were significantly higher in cancer samples than that in normal healthy samples. Consensus Clustering, PCA, Kaplan-Meier survival estimation, and ESTIMATE algorithm were analyzed for 147 cases in Cluster2 of TCGA-LIHC-GDC. LASSO regression is suitable for data analysis and model construction with a large number of independent variables but a limited sample size. 24 Then, a 9-lncRNA signature consists of LINC00294, SPATA13, SNHG20, AC024560.3, AC027601.1, LINC00205, AC092171.4, SNHG1, and LINC00630 was established by LASSO Cox regression analysis.
These lncRNAs have been reported to be associated with multiple cancer types. LINC00294 could negatively modulate cell proliferation in glioma. 25 SNHG20 expression was increased in multiple cancers, suggesting an effect of SNHG20 on cancer development and progression. 26 In HCC tissue samples, LINC00205 expression was significantly increased and LINC00205 enhanced the proliferation, migration and invasion of HCC cells. 27 AC092171.4 sponges miR-1271 and upregulate GRB2 to promote HCC development. 28 SNHG1 activated the Akt pathway to play a role in sorafenib resistance in HCC cells. 29 LINC00630 regulated BEX1 gene methylation to promote radiation resistance in colorectal cancer cells. 30 Considering the previous and present findings, these m6A regulator-related lncRNAs might act as prognostic and/or diagnostic markers of HCC.
To further investigate the role of the 9-lncRNA in the clinicopathological characteristics and prognosis of HCC, the matching clinical data of samples from the training dataset TCGA-LIHC-GDC and the validation dataset TCGA-LIHC were evaluated. The sample was divided into 2 subgroups based on median risk score, the Kaplan-Meier survival estimate indicated a strong association between the risk score and patients’ OS. The ROC curve revealed that the risk score-based curves had better predictive efficiency, and multivariate Cox’s proportional risk regression analysis showed risk scores as independent risk factors. More importantly, the prognostic nomograms established based on risk score also demonstrated the strong association between the risk score and OS in HCC patients.
What’s more, the risk score based on these 9-lncRNA signatures could distinguish cluster2 samples from cluster1 samples, HCC sample from non-cancerous samples, and HCC samples in different pathological grades, suggesting that the 9-lncRNA signature also have diagnostic potential. For further understanding of the potential roles of these lncRNAs in the signature, we also performed GO, KEGG, and PPI analyses. Consistent with previously-reported functions of these lncRNAs in glioma, 25 HCC,27-29 and colorectal cancer, 30 these lncRNAs might be associated with cell cycle and cellular metabolic activities, drug metabolism, liver disease-related pathways, and some important signaling pathways such as p53, MAPK, Wnt, RAS through co-expressed mRNAs.
Regulation of m6A-modified RNA changes, base pairing, and RNA-protein interactions, which affect RNA export, translocation, translation and degradation. 31 Therefore, m6A modulators have been reported as potential therapeutic agents.32-34 In HCC, upregulation of METTL3 was significantly correlated with high levels of m6A, which targeted the tumor suppressor SOCS2 and consequently promoted carcinogenesis. In addition, the YTHDF2 reader detects an excess of m6A in SOCS2, which accelerated the decay of the tumor suppressor and triggered HCC. 35 Therefore, the METTL3 inhibitor with a lower m6A level upregulates tumor suppressor expression and prevents t HCC progression. The WTAP, another key component of m6A methylation, is significantly upregulated in HCC and promotes the development of hepatocellular carcinoma. WTAP-guided m6A modification promotes HCC progression through the HuR-ETS1-p21/p27 axis. 36 Therefore, inhibiting WTAP might be a potent strategy for HCC treatment. Considering the aberrant expression levels of the 9 lncRNAs identified in this study, the associated m6A regulators might be potential therapeutic targets.
In conclusion, by using the Consensus Clustering, PCA, ESTIMATE algorithm, LASSO regression model, Kaplan-Meier survival assessment, ROC curve analysis, and multivariate Cox’s proportional hazard regression model analysis, we established a prognostic marker consisting of 9 lncRNAs that might have prognostic and diagnostic potential for HCC.
Supplemental Material
sj-docx-1-evb-10.1177_11769343221142013 – Supplemental material for The Prognostic Value of a lncRNA Risk Model Consists of 9 m6A Regulator-Related lncRNAs in Hepatocellular Carcinoma (HCC)
Supplemental material, sj-docx-1-evb-10.1177_11769343221142013 for The Prognostic Value of a lncRNA Risk Model Consists of 9 m6A Regulator-Related lncRNAs in Hepatocellular Carcinoma (HCC) by Zhen Deng, Jiaxing Hou, Hongbo Xu, Zhao Lei, Zhiqiang Li, Hongwei Zhu, Xiao Yu, Zhi Yang, Xiaoxin Jin and Jichun Sun in Evolutionary Bioinformatics
Footnotes
Funding:
The author(s) disclosed receipt of the following financial support for the research, authorship, and/or publication of this article: This study was supported by the National Natural Science Foundation of China (81803085) and the Natural Science Foundation of Hunan Province (2019JJ40414, 2018JJ2612, and 2020JJ4919).
Declaration of Conflicting Interests:
The author(s) declared no potential conflicts of interest with respect to the research, authorship, and/or publication of this article.
Authors’ Contributions
ZD performed the experiments and wrote the paper. HX, ZL, and ZL coordinated the study. HZ, XY, and ZY collected the samples and assisted with the experiments. XJ and JS conceived the study, designed the experiments, and revised the paper. All the authors have read and approved the final manuscript.
Data Availability
The data that support the findings of this study are available from the corresponding author upon reasonable request.
Supplemental Material
Supplemental material for this article is available online.
References
Supplementary Material
Please find the following supplemental material available below.
For Open Access articles published under a Creative Commons License, all supplemental material carries the same license as the article it is associated with.
For non-Open Access articles published, all supplemental material carries a non-exclusive license, and permission requests for re-use of supplemental material or any part of supplemental material shall be sent directly to the copyright owner as specified in the copyright notice associated with the article.