
Abstract
Background:
Zika virus, which is widely spread and infects humans through the bites of Aedes albopictus and Aedes aegypti female mosquitoes, represents a serious global health issue.
Objective:
The objective of the present study is to computationally characterize Zika virus polyproteins (UniProt Name: PRO_0000443018 [residues 1-3423], PRO_0000445659 [residues 1-3423] and PRO_0000435828 [residues 1-3419]) and their envelope proteins using their physico-chemical properties.
Methods:
To achieve this, the Polarity Index Method (PIM) profile and the Protein Intrinsic Disorder Predisposition (PIDP) profile of 3 main groups of proteins were evaluated: structural proteins extracted from specific Databases, Zika virus polyproteins, and their envelope proteins (E) extracted from UniProt Database. Once the PIM profile of the Zika virus envelope proteins (E) was obtained and since the Zika virus polyproteins were also identified with this profile, the proteins defined as “reviewed proteins” extracted from the UniProt Database were searched for the similar PIM profile. Finally, the difference between the PIM profiles of the Zika virus polyproteins and their envelope proteins (E) was tested using 2 non-parametric statistical tests.
Results:
It was found and tested that the PIM profile is an efficient discriminant that allows obtaining a “computational fingerprint” of each Zika virus polyprotein from its envelope protein (E).
Conclusion:
PIM profile represents a computational tool, which can be used to effectively discover Zika virus polyproteins from Databases, from their envelope proteins (E) sequences.
Keywords
Introduction
The Zika virus, a (+, ss) RNA arbovirus in the Flaviviridae family is a re-emerging human pathogen, first isolated in 1947 from a febrile macaque, and the first human infections were detected in Nigeria, Uganda, and the United Republic of Tanzania in the early 1950s. Its main vectors are the Aedes aegypti and Aedes albopictus species of diurnal biting female mosquitoes. Its geographical expansion began in 2007. 1 After the 2015 Zika pandemic, it remains present in a quarter of the world countries, particularly in the regions bound by the Tropics of Cancer and Capricorn. Modes of infection include, along with the mosquito’s bite, sexual transmission, blood transfusion, and vertical transmission to the fetus during pregnancy. In most cases, human infection is characterized by an incubation period of 3 to 14 days, and either lack of symptoms (50%-80%) or mild symptomatology (20%-50%) such as non-purulent conjunctivitis, fever, headache, malaise, muscle and joint pain, and rash, that usually last for 2 to 7 days. Although Zika virus shows broad cellular tropism, the major feature of the clinical manifestations is the severe central nervous system complications that result from post-infectious immune response and/or direct viral neurotropism, which include acute myelitis, Guillain-Barré syndrome and meningoencephalitis, ocular involvement with acute unilateral maculopathy, uveitis, iridocyclitis, and chorioretinitis. Other complications include thrombocytopenic purpura and transient myocarditis. Zika infection (symptomatic and asymptomatic) during pregnancy affects about 20%-30% of fetuses and newborns and can produce fetal loss (4%-7%) and congenital Zika syndrome (5%-14%), which includes fetal brain disruption sequence (microcephaly 4%-6%) with brain and ocular abnormalities, congenital contractures, seizures, and pyramidal and extrapyramidal abnormalities. Nine percent of asymptomatic newborns will develop at least one neurodevelopmental abnormality before they reach 2 years of age.2,3 Microcephaly, which is an especially dangerous outcome of Zika infection in pregnancy, is common in Brazil. 4 Recently, it has been shown that Zika virus infection causes neuronal progenitor cell pyroptosis, mediated by activation of caspase-1 and gasdermin, and that caspase-1 deletion or inhibition reduces inflammatory response and pyroptosis and attenuates neuropathy and brain atrophy.5,6 It was also pointed out that mutations in these polyproteins preceding the 2015 epidemic enhanced virulence and fitness for the transmission. 6
The open reading frame (ORF) of Zika virus codes for a single 3423-residue long polyprotein that is posttranslationally cleaved into 3 structural proteins: Capsid (C, residues 1-122) containing an ER anchor, removed in mature form of C by serine protease NS3, Precursor membrane (prM) protein (residues 123-290), which is further divided into peptide pr (residues 123-215) and small envelope protein M (residues 216-290), an envelope protein E (residues 291-790), and 7 non-structural proteins: NS1 (residues 791-1142), NS2A (residues 1143-1368), serine protease subunit NS2B (residues 1369-1498), serine protease NS3 (residues 1499-2115), NS4A (residues 2116-2242), peptide 2k (residues 2243-2265), NS4B (residues 2266-2516), and RNA-directed RNA polymerase NS5 (residues 2517-3419). Hereinafter, the term polyproteins will be used for the proteins expressed by the complete Zika virus polyproteins, to differentiate them from Zika virus envelope proteins (E).
To verify if mutations in these polyproteins have some specific features, in the present work, we conducted a computational analysis of 3 Zika virus polyproteins (UniProt ID: PRO_0000443018 [residues 1-3423], PRO_0000445659 [residues 1-3423], and PRO_0000435828 [residues 1-3419]) to elucidate their major physico-chemical properties. There are only a small (but important) number of bioinformatics approaches, among them are Lee et al, 7 Sourisseau et al, 8 and Chellasamy and Devarajan 9 that allow efficient identification of this group of Zika virus polyproteins based on the linear representation (sequence) of their envelope proteins (E). That is why we consider our computational approach useful and we have taken advantage of a set of in-house algorithms that can infer protein structure-function relationships based solely on the linear representation of a query protein. To do that, we use the Polarity Index Method (PIM) system10,11 to calculate the PIM profile of each Zika virus envelope protein (E), and simultaneously we use a set of predictors of intrinsic disorder to generate the disorder predisposition profiles12,13 of these same protein groups (the corresponding programs are defined in the Materials and Methods section). A new parameter is introduced, which is the average of those previous parameters, enabling better discrimination and clarification among the different protein groups studied. The results generated for those 3 Zika virus envelope proteins (E) suggest that it is possible to detect every Zika virus polyprotein studied here from their envelope proteins (E) and that the PIM profile constitutes a “computational fingerprint” of those Zika polyproteins group.
Materials and Methods
This bioinformatics work focused on the Zika virus envelope proteins (E): PRO_0000443024 [residues 291-794], PRO_0000445665 [residues 291-794] and PRO_0000435834 [residues 291-790], extracted from sequences of Zika virus genome polyprotein from 3 UniProt curated isolates, PRO_0000443018 [residues 1-3423] (ZIKV/Human/FrenchPolynesia/10087PF2013 ZIKV), PRO_0000445659 [residues 1-3423] (isolate from ZIKV/Human/Cambodia/FSS13025/2010 ZIKV), and PRO_0000435828 [residues 1-3419] Zika virus (ZIKV). Two profiles were generated for these proteins, the PIM profile and the PIDP profile. The profiles are determined with different computational architectures, taking into account the type of amino acid in the protein sequence. The “PIM profile” was calculated based on the regularities of the 16 possible polarity/charge interactions (2.1 PIM profile section). The protein intrinsic disorder predisposition (PIDP) of the protein was calculated with another set of programs, considering the distribution of amino acids in the sequence to calculate the intrinsic disorder propensity (2.2 PIDP). Those protein groups (Tables 1 and 2) were studied with both profiles and the procedure is described in the next sections giving one example.
Structural protein sets.

Summary of structural protein sets formed with non-overexpressed proteins (2.1 PIM profile section). PIM format: numeric substitution of each amino acid residue from the sequence according to its polarity/charge [P+, P−, N, NP]. Source: Locate the search array in the UniProt browser Database or review the reference.
Zika virus proteins.

Summary of Zika virus polyproteins and their envelope proteins (E) located in UniProt Database (2.1 PIM profile section).
PIM profile
The metric of the PIM system is named PIM profile. The acronym stands for Polarity Index Method (PIM)10-12; this is an automatic set of programs and Linux scripts that evaluates the 16 polarity/charge interactions identified when reading the sequence of the protein pairs of residues (amino acid by amino acid), from left to right or from the amino-terminus to the carboxy-terminus. The PIM system has 3 steps (Table 3, A-C steps).
PIM profile example.

A-Step: Number of incidences (in pairs of amino acids) found in the peptide [LKCNKLVPLF]. B-Step: Weighting the incidence matrix. C-Step: Comparison of asample peptide and the btarget peptide by position (green color). Note that these values are arbitrary and have only been used to exemplify the comparison mechanism. Similarity(✕): The position matches in the matrices. (✕): The position does not match in the matrices (2.1 PIM profile section). In this example, the similarity of aZika with the btarget peptide occurs in positions: 11, and 12, then 2/16 = 13%. Note [A-Step and B-step]: Pos 16 (1) means that at position 16 of matrix A is found the highest frequency and it is placed in the first position of the vector. Pos 1 (16) means that at position 1 of matrix A is the lowest frequency and it is placed at position 1 of the vector. In the case of 2 or more equal frequency values, the matrix is read from bottom to top and from right to left. Target [i,j]: The PIM profile of the set of proteins presented here is only for illustration, it does
The following 3 steps and the procedure example are taken and adapted from Polanco et al 12
A. Firstly, the sequence is converted to the numeric polarity/charge-related annotations {P+, P−, N, NP}. According to this criterion, P+ (polar, positively charged) are amino acids H, His; K, Lys; R, Arg; P− (polar, negatively charged) are amino acids D, Asp; E, Glu; N (polar, neutral) are amino acids C, Cys; G, Gly; N, Asn; Q, Gln; S, Ser; T, Thr; Y, Tyr, and NP (non-polar) are amino acids A, Ala; F, Phe; I, Ile; L, Leu; M, Met; P, Pro; V, Val; W, Trp. Then, the sequence is expressed in PIM format, and the incidences of these pairs are recorded in a 4 × 4 algebraic matrix named incidence matrix. The rows (i) and columns (j) represent the 4 PIM groups.
B. Secondly, the incidence matrix is normalized to 1.
C. Finally a 16-element vector is created, placing the 16 positions of the incidence matrix in increasing or decreasing order, from left to right. This vector will be the “bioinformatic marker” of the group of proteins evaluated.
To exemplify this procedure, (Table 3, A-C Steps) let us take the peptide (Cytotoxin NN-32, UniProt ID B3EWR3) [L K C N K L V P L F] (10 residues). Its equivalence, according to the 4 groups of polarity/charge-related annotations is [4 1 3 3 1 4 4 4 4 4]. In numeric pairs, read from left to right, there are 9 pairs [41, 13, 33, 31, 14, 44, 44, 44, 44] (see incidence matrix Table 3, A-Step). Once we have the matrix, it is normalized to 1 (Table 3, B-Step). Then, the 16 polarity/charge-related annotations are represented as a vector (Table 3, C-Step). The elements of the vector are placed in decreasing order, that is the first position of matrix A is for the element with the highest number of incidences (or frequency), the second position is for the element with the next higher number of incidences, and the procedure continues until all the elements of the vector are allocated. Note that the vector is ordered with the elements of matrix A, from the highest to the lowest frequency. Once the PIM profile of each target protein has been determined, the PIM system calculates the PIM profile that characterizes the whole target protein set (Table 3, C-Step), analyzing the coincidences (or regularities), at each PIM profile position.
The comparison of the PIM profile of a protein with the target protein, which is the configuration searched (Table 3, C-Step), is done with the 16 elements of the vector. In our example, there are 2 matches among the 16 possible coincidences (Table 3, C-step, columns 11 and 12). This results in that our protein is not similar to the target protein. In general, if 2 proteins have an equal PIM profile, 16 out of 16, then they must share the same preponderant protein function and/or the same structure.
Since the PIM system is an unsupervised algorithm, it automatically maximizes the difference between the target set with the other protein sets, removing the smallest number of proteins from the target set.
The order of the 16 polarity/charge annotations; that is, [P+, P+], [P+, P−], . . . [NP, NP], as well as the reading by pair of amino acids in the sequence, or reading by the triplets and not by pair of amino acids the sequence is irrelevant, as what this methodology underlies is the use of only the polarity/charge annotations to determine the preponderant function of the sequences.
PIDP profile
Several specific sequence features can be utilized for the efficient discrimination of the Intrinsically Disordered Proteins (IDPs) and IDP regions (IDPRs) from the ordered proteins and domains. Some of these features include biases in amino acid locations, where IDPs/IDPRs are automatically enriched in some specific disorder-promoting amino acid, such as A, E, G, K, P, Q, and S, being automatically short of several types of amino acid, known as order-promoting residues (C, F, I, L, N, V, and W, Y),.10-12,16-18 These remarkable sequence differences are used by computational programs to identify the IDPD of specific proteins.19,20
The characteristics of the intrinsic disorder distribution in the sequences of Zika virus envelope proteins (E) were studied by a per-residue disorder predictor, PONDR VSL2. 21 This tool is commonly used in the analysis of disorder predisposition of proteins and systematically shows good performance in various comparative analyses, including the recently conducted Critical Assessment of Protein Intrinsic Disorder Prediction (CAIDP) experiment, where it was recognized as #3 predictor of 43 evaluated methods {PMID: 33875885}. In our study, protein residues and regions were classified as disordered or flexible if their predicted disorder scores were above 0.5, or ranged between 0.15 and 0.5, respectively.
Test files
The proteins were classified into 2 main groups according to their association to humans: 4 structural sets (Table 1), and 3 Zika virus polyproteins: PRO_0000443018 [residues 1-3423] (POL-P), PRO_0000445659 [residues 1-3423] (CAM-P), and PRO_0000435828 [residues 1-3419] (Q32-P), obtained by the different isolates of Zika virus, ZIKV/Human/FrenchPolynesia/10087PF/2013, ZIKV/Human/Cambodia/FSS13025/
2010 and the African-origin (Table 2), and their envelope proteins (E): PRO_0000443024 [residues 291-794] (POL-E), PRO_0000445665 [residues 291-794] (CAM-E), and PRO_0000435834 [residues 291-790] (Q32-E) (Table 2).
In addition,3 polyproteins sets were formed POL-B, CAM-B, Q32-B which contain all the proteins similar to POL-P, CAM-P, and Q32-P, that were detected by the BLAST software in the UniProt Database.
The 4 structural sets (Table 1; rows UNF, PAR, CPP, and NCP), unfolded and partially folded proteins were taken from Oldfield et al ’s work 14 and the cell-penetrating peptides and non-cell-penetrating peptides were taken from CPPSite Database. 15 These structural proteins have different properties in their degree of disorder, action, or penetrating pathway. There were also 565 254 proteins defined as “reviewed proteins” (November 10, 2021) taken from UniProt Database (Table 1; row UNI).
In turn, ZIKA virus polyproteins and their corresponding envelope proteins (E), had been arranged in 2 sets, ZIKA-E set formed by the envelope proteins (E): POL-E, CAM-E, and Q32-E, and ZIKA-P set formed by the polyproteins: POL-P, CAM-P, and Q32-P (Table 2).
Test procedure
All the sequences in the test sets of the plan were verified for non-duplication, both in FASTA format 22 and in numerical format (2.1 PIM profile section); if they were duplicated, only one entry was taken (Tables 1 and 2) in order to avoid any effect on the discriminative capacity of the systems used in this work (2.1 PIM profile section, 2.2 PIDP profile sections). After the previous inspection, the PIM profile (2.1 PIM profile section) of each sequence from the protein groups mentioned above were calculated (Tables 1 and 2).
First of all, the set of envelope proteins (E) named ZIKA-E and the set of polyproteins named ZIKA-P (Table 2) were plotted as fitted curves (Figure 1). Later the 3 Zika virus polyproteins (POL-P, CAM-P, Q32-P) and their envelope proteins (E) (POL-E, CAM-E, Q32-E) were plotted as fitted curves (Figures 1A and 2A) and each curve was compared and verified to find possible coincidences at the maximum, minimum, and inflection points. The zoom from the region [P−,P+] to [N, P−] was divided into 2 Zika virus polyproteins and their envelope proteins (E) were plotted as fitted curves (Figures 1B and 2B) and histograms (Figure 3A and B), and the PIM profile of each protein was calculated and compared with that of the studied groups (Table 4).

Relative frequency distribution of ZIKA-P and ZIKA-E sets, represented by “fitted curves.” Graphs were produced using EXCEL software. The X-axis represents the 16 PIM interactions. Ellipse mark: It denotes the maximum difference between curves. (A) Relative frequency distribution of POL-E, CAM-E, and Q32-E envelope proteins (E) represented by “fitted curves.” Graphs were produced using EXCEL software. The X-axis represents the 16 PIM interactions. Ellipse mark: It denotes the maximum difference between curves. Note that the POL-E and CAM-E curves only differ by one amino acid so their curves overlap (Table 2). (B) Zoom over (A) the X-axis represents the PIM region from [P−, P+] to [N, P−] (3. Results section) of POL-E, CAM-E, and Q32-E envelope proteins (E). Note that the POL-E and CAM-E curves only differ by one amino acid so their curves overlap (Table 2).

(A) Relative frequency distribution of POL-P, CAM-P, and Q32-P polyproteins represented by “fitted curves.” Graphs were produced using EXCEL software. The X-axis represents the 16 PIM interactions. Note that the POL-P and CAM-P curves only differ by one amino acid so their curves overlap (Table 2). (B) Zoom over (A) the X-axis represents the PIM region from [P−, P+] to [N, P−] (3. Results section) of POL-P, CAM-P, and Q32-P polyproteins. Note that the POL-P and CAM-P curves only differ by one amino acid so their curves overlap (Table 2).
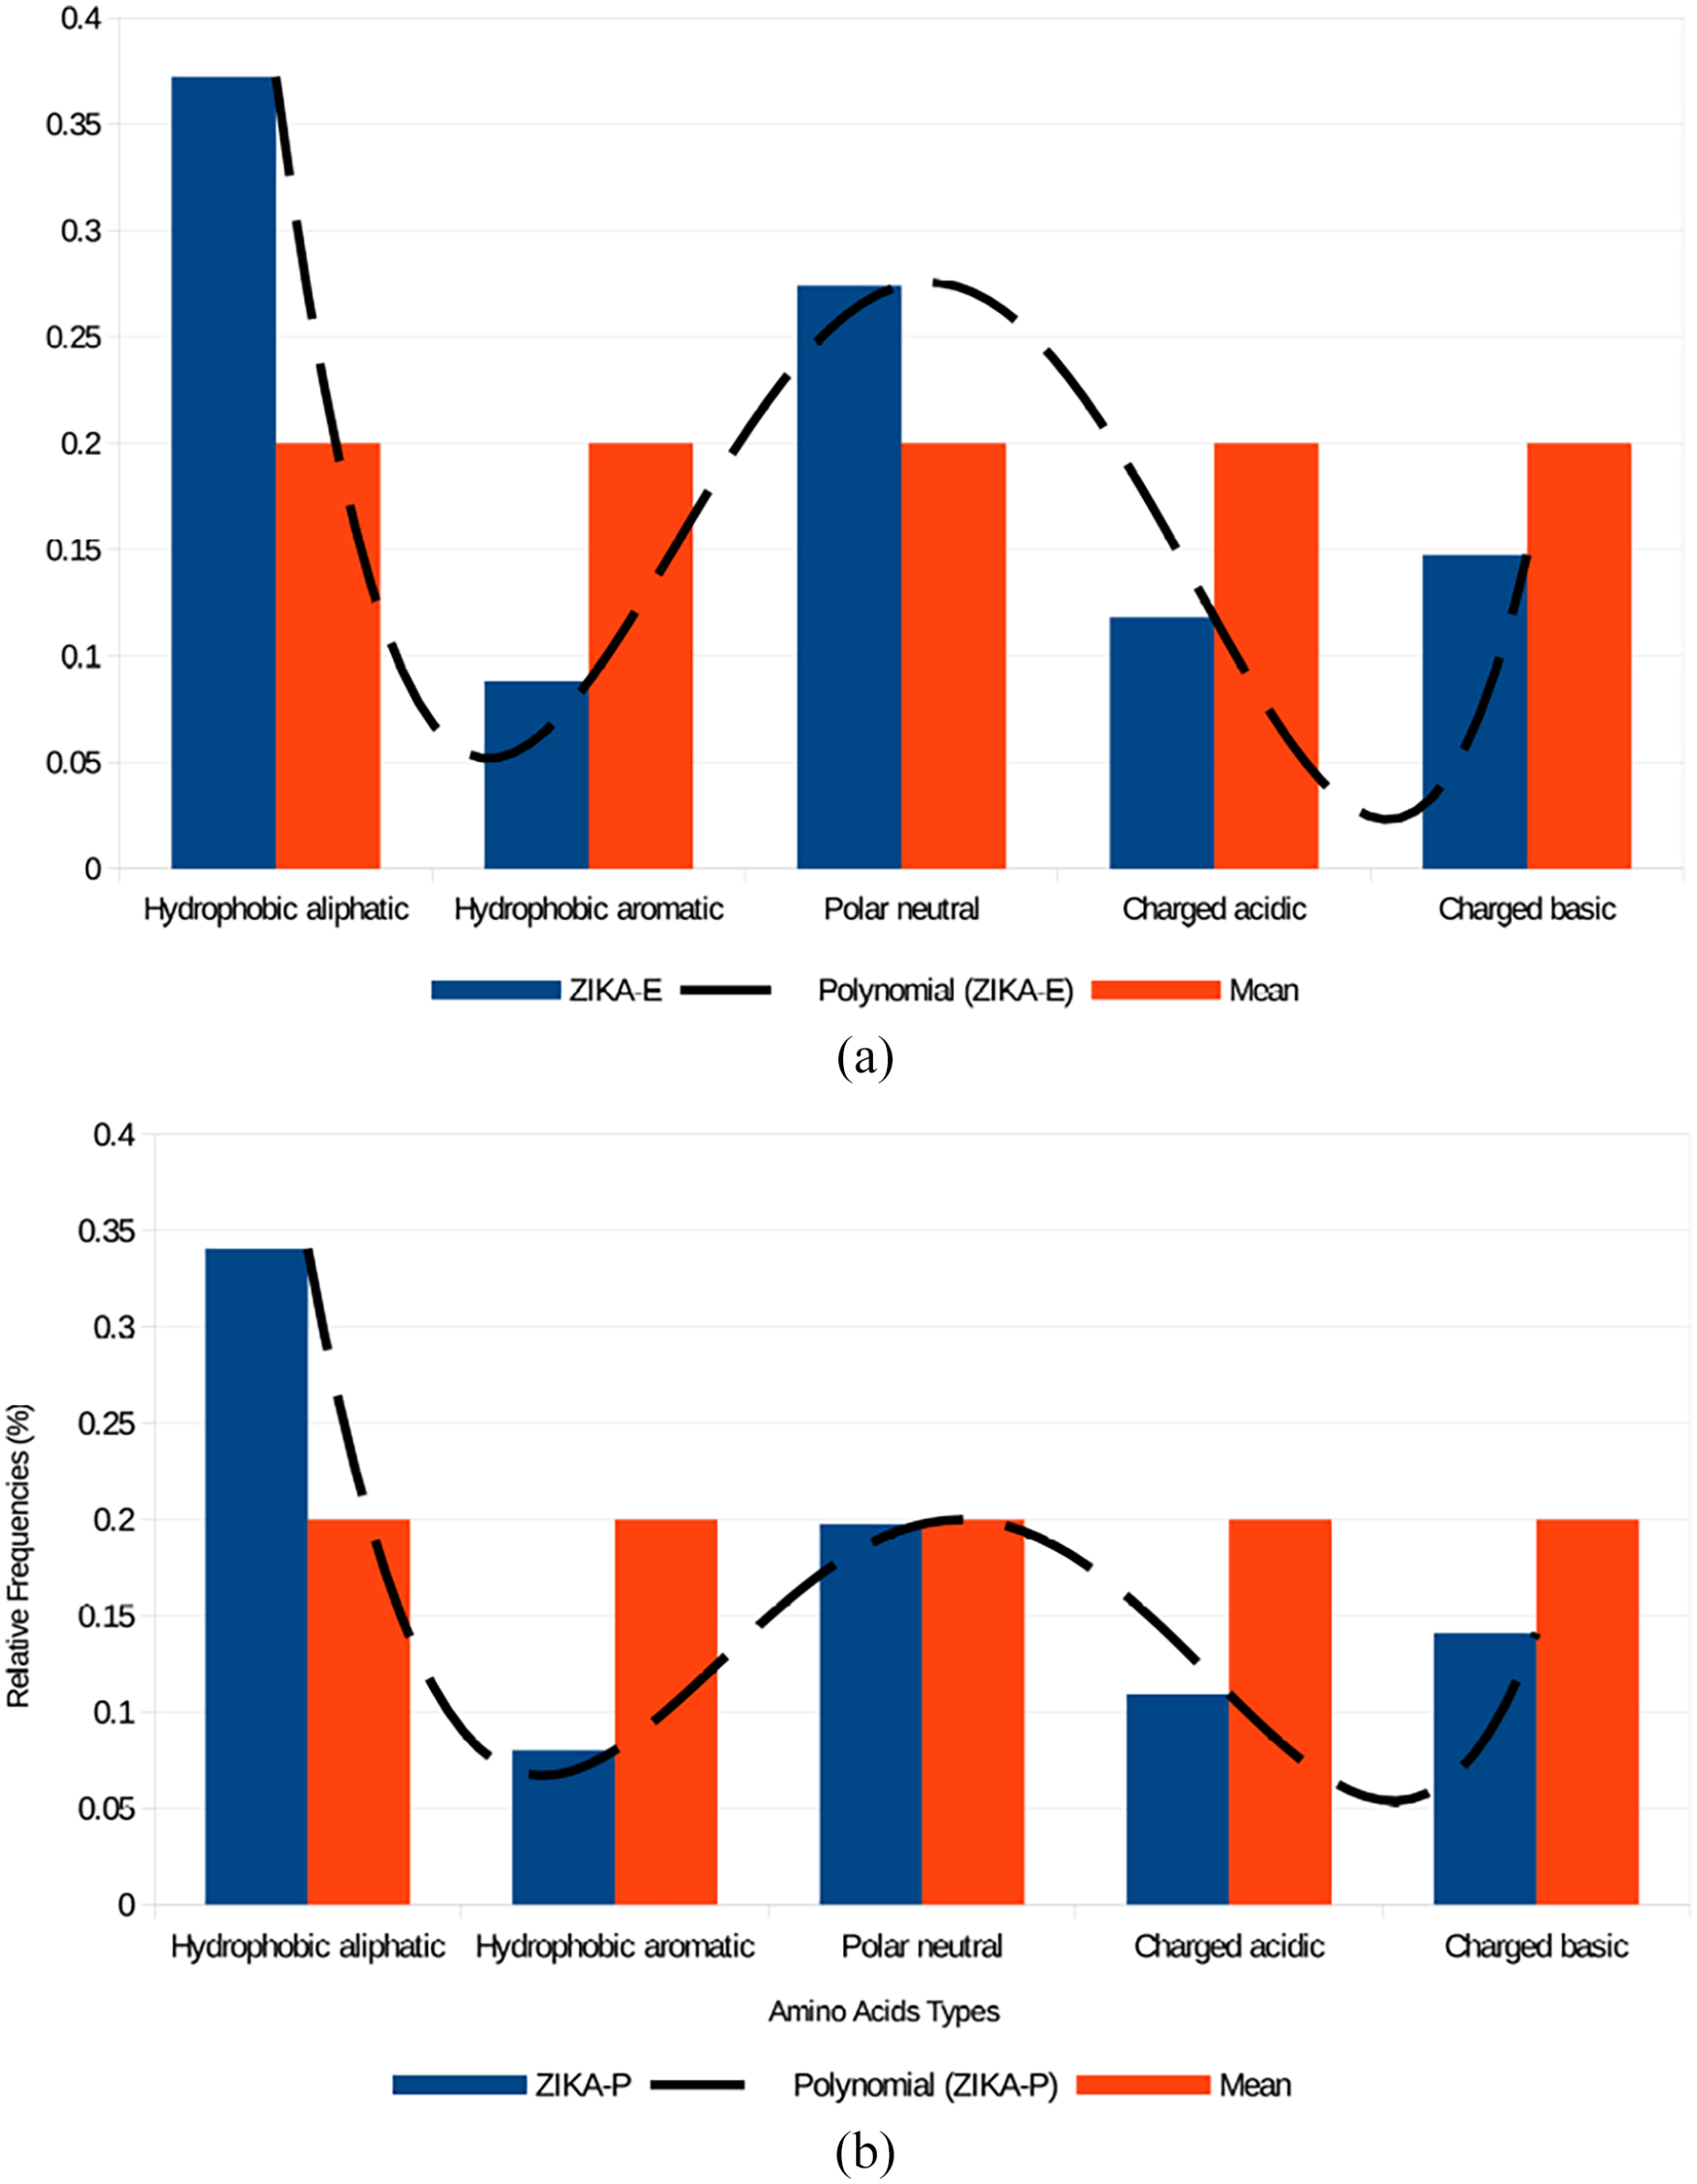
(A) Relative frequencies distribution of different amino acid types that are present in ZIKA-E set, represented as histograms, and its graph of the polynomial approximation of degree eight. Note that we use a different classification for amino acids: hydrophobic aliphatic, hydrophobic aromatic, polar neutral, charged acid, and charged basic. Mean: It is the mean value between the maximum value (0.4) and minimum value (0.0) on the Y axis, that is, 0.4/2 = 0.2. (B) Relative frequencies distribution of different amino acid types that are present in ZIKA-P set, represented as histograms, and its graph of the polynomial approximation of degree eight. Note that we use a different classification for amino acids: hydrophobic aliphatic, hydrophobic aromatic, polar neutral, charged acid, and charged basic. Mean: It is the mean value between the maximum value (0.4) and minimum value (0.0) on the Y axis, that is, 0.4/2 = 0.2.
Zika virus polyproteins in comparison with other protein groups.

Similarity (in percentage) of Zika virus polyproteins and the described protein groups, found when calibrating the PIM system with specific protein groups (column), compared to other protein groups (rows) (2.4 Test procedure section). For a detailed explanation of the construction of the POL-B, CAM-B, and Q32-B groups see (Table 2). Bold numbers corresponds to the high percentage values.
It was found that only a small number of proteins (Table 5) from the UniProt Database have their envelope proteins (E) registered separately in the same Database, then a set of programs called the DIVIDED program (2.6 DIVIDED program section) was built to sub-divide each “reviewed protein” in “sub-proteins” of the same length as their envelope proteins (E). This sub-division was done by going from left to right for each of the 562 603 proteins defined as “reviewed proteins” from the Uniprot Database, with the same length window as the Zika virus envelope proteins (E).
Similar proteins found in UniProt Database.

Incidences of Zika virus polyproteins and their (E) envelope proteins (rows) found in the 562 603 “reviewed proteins” from the UniProt Database (2.4 Test procedure section). Note that no proteins similar to the envelope proteins POLE, CAM-E, and Q 32-E were found in the database; in contrast the polyproteins POL-P, CAM-P, and Q32-P have a large number of matches. One possible reason for this is that different experimental groups find different functions for the same protein.
With this system it was possible to calculate the PIM profile of the envelope protein (E) of a polyprotein and search it in the polyprotein itself to identify this PIM profile.
Finally, the PIM profile of the Zika virus polyproteins with high discriminative capacity was compared with the PIM profile of each of the sub-proteins located in the 562 603 proteins, defined as “reviewed proteins” from UniProt Database (Table 5), in order that the number of sub-proteins with identical profile to these viral groups could be detected.
An analysis of the chemical characteristics of the residues found in the Zika virus polyproteins and their envelope proteins (E) was carried out separately (Figure 3A and B).
Afterward, they were submitted to the intrinsic disorder analysis (2.2 PIDP profile section), to get the PIDP profiles (Figure 4A and B) and identify the Zika virus polyproteins and their envelope proteins (E) that have a highly discriminant polarity/charge, so that the groups whose PIM profile did not show a high discriminative capacity were disregarded.

(A) Intrinsic disorder propensity of3 Zika virus envelope proteins (E) (Table 2). It can be observed that these proteins have noticeable variability in their PIDP profiles (2.2 PIDP profile section) (Plot A). This is further illustrated by the “difference disorder spectra,” where the disorder profile of the envelope protein (E) from the CAM-E variant is subtracted from the profiles of the POL-E and Q32-E variants (Plot B). Note that multiple sequence alignment (Plot C) shows that these envelope proteins (E) have a high sequence identity. This figure is available in the Supplemental Materials section. (B) Intrinsic disorder propensity of 3 Zika virus polyproteins (Table 2). It can be observed that these proteins have noticeable variability in their PIDP profiles (2.2 PIDP profile section) (Plot D). This is further illustrated by the “difference disorder spectra,” where the disorder profile of the polyprotein from the CAM-P variant (UniProt ID: A0A024B7W1) is subtracted from the profiles of the POL-P (UniProt ID: A0A142I5B9) and Q32-P variants (UniProt ID: Q32ZE1) (Plot E). Note that multiple sequence alignment showed that these proteins have a high sequence identity. In fact, their pairwise sequence identity ranged from 99.65% to 96.49%.
Statistical test
The Kolmogorov two-sided test, 23 and Analysis of Variance (ANOVA) test with SPSS package were used (with alpha = 95%, and alpha = 99% respectively) were carried out for the 2 Zika virus polyprotein group and their corresponding envelopes. The scores in the EXCEL file can be seen in the Supplemental Materials section.
DIVIDED program
The set of programs named DIVIDED program, referred in (2.4 Test procedure section), is a system written in FORTRAN 77 and Linux scripts that automatically identifies the length of the envelope protein (E) and subdivides the polyprotein studied in a “window” of the same length than the envelope protein (E), reading it from left to right; then, it is moved to the right of the “window” to create another protein.
Since this work uses 3 envelope proteins (E), but 2 of them POL-E and CAM-E have the same length, the system was used twice to generate both “windows.” The DIVIDED program was only applied to the 562,603 polyproteins defined as “reviewed proteins” from UniProt Database (Table 5), and since the number of sub-proteins generated by the DIVIDED program is large, clustering techniques were used. The computational program can be seen in the Supplemental Materials section.
The DIVIDED program is useful, as not all the proteins registered in UniProt Database have their envelope proteins registered separately. For the 3 Zika virus polyproteins (Table 2) their envelope proteins (E) were available.
Secondary structure
The following protein analysis algorithms were run on 3 meta-domains (each one composed of several domains, spanning 1141 amino acids, due to algorithmic complexity constraints) comprising the full protein sequence of Zika (properly called a poly-protein).
Prediction of secondary structure via the PSIPRED algorithm
PSIPRED is a simple and accurate secondary structure prediction method, incorporating 2 feed-forward neural networks which perform an analysis on output obtained from PSI-BLAST (Position Specific Iterated - BLAST). Using a very stringent cross validation method to evaluate the method’s performance, PSIPRED 3.2 achieves an average Q3 score of 81.6%. 24
Domain recognition via the pDOMTHREADER algorithm
pDomTHREADER is an accurate and sensitive superfamily discriminater, combining information from both sequence and structure to produce highly accurate domain alignments. The method employs the same underlying threading algorithm as pGenTHREADER; however, it aligns sequences to a domain-based template library rather than a chain-based template library. The use of smaller regions of structure for templates means that different features of the alignments are required for optimal scoring. The final prediction score results from an SVM trained on a combination of 5 different feature inputs: template coverage, alignment score, template length, solvation and pairwise potentials. Compared with other superfamily discrimination methods using Hidden Markov Models and PSI-BLAST profile alignments, we found that pDomTHREADER provided higher coverage on the CATH S35 superfamilies. Additionally, pDomTHREADER produced more accurate alignments that can be used to better predict domain boundaries. 25
Domain boundary prediction using the DomPred method
DomPred is a protein structural domain boundary predictor. The DomPred process runs 2 independent protein domain predictors; DomPred and DOMSSEA. The DomPred process begins by using PSI-BLAST to match a database of Pfam-A domains to the query sequence. Where no clear domains can be matched it then proceeds to search the nrdb90 sequence database with PSI-BLAST. The final prediction is produced by analyzing the locations of all the N and C boundaries for each hit. For the DOMSSEA process, predicted secondary structure patterns in the query sequence are matched to a library of SCOP domain secondary structure patterns. 25
Fold recognition using the pGEN-Threader and the GEN-Threader algorithms
This method is a state of the art method for fold recognition and identification of distant homologs. It is based on the original GenTHREADER method, but makes use of profile-profile alignments and predicted secondary structure (using PSIPRED) as inputs. This increases both the sensitivity of the method and enhances the accuracy of alignments, but also makes it much slower than the normal GenTHREADER method as PSI-BLAST needs to be run on the target sequence before the search can begin.25,26
Transmembrane helix contact prediction via the MEMPACK and the MEMSAT-SVM algorithms
MEMPACK is a membrane helix packing predictor. The process leverages MEMSAT-SVM predictions to predict possible inter-helix interactions. In the final step, a helix packing is produced that orients the helices such that the greatest number of predicted interactions face one another.27,28
Results
Both profiles (the PIM and intrinsic disorder predisposition) were measured for the same protein groups (Tables 1 and 2), and the results are presented below separately.
PIM profile
It can be observed that the sequences POL-E y CAM-E, differ in the position of one amino acid (Methionine in POL-E sequence, and Valine in CAM-E sequence). However, when both sequences are translated into the polarity/charge notation (2.1 PIM profile section), both notations are identical as these amino acids belong to the same polar group. Something similar happens when the Q32-E sequence is compared with the POL-E, at first hand their similarity is 30.2%. However, when the Q32-E sequence is translated into its PIM profile notation, there is a similarity of 71.2%. This means that when comparing 2 amino acid sequences one can see differences while looking at each position and each amino acid found there. However, if both sequences are converted to their polarity/charge profile (where only the 4 polarity-related annotations {P+, P−, N, or NP} appear) the sequence similarity increases.
From the analysis of PIM profile notation (2.1 PIM profile section) of ZIKA-P and ZIKA-E sequences (2.3 Test files section), it is observed (Figure 1) that they are different in their polar interactions [P−, P−], [P−, NP], and [N, N].
When comparing the relative frequency distribution charts (as fitted curves); that is, the PIM profile of envelope proteins (E) POL-E, CAM-E, and Q32-E (Figure 1A) there are only differences in the range from [P−, P+] to [N, P−], and when zooming this range (Figure 1B), 2 inflection points are observed [P−, P−] and [P−, NP]. On the other hand, when comparing the PIM profiles of proteins POL-P, CAM-P, and Q32-P (Figure 2A) there is no change in any of their polar interactions; even when zooming the range from [P−, P+] to [N, P−] (Figure 2B) there is no difference. This can be seen when changing to a histogram graph since in the envelope proteins POL-E, CAM-E, and Q32-E (Figure 5A; chart b) there is only one difference in [P−, N] and no difference in the polyproteins POL-P, CAM-P, and Q32-P (Figure 5B). In Figure 5A and B the control parameter means the ratio 1/16 = 0.0625, and it was used to observe the difference between the mean value and the bias for each polar interaction.

(A) Relative frequency distribution POL-E, CAM-E, and Q32-E envelope proteins (E) represented as histograms and divided into 4 interaction groups. Graphs were produced by EXCEL software. Control: (green color) each interval represents 1 of 16 PIM interactions, which is equal to 0.0625, and it was used to observe the difference between the mean value and the bias for each polar interaction. Ellipse mark: It denotes the maximum difference between bars. (B) Relative frequency distribution of POL-P, CAM-P, and Q32-P polyproteins represented as histograms and divided into 4 interaction groups. Graphs were produced by EXCEL software. Control: (green color) each interval represents 1 of 16 PIM interactions, which is equal to 0.0625, and it was used to observe the difference between the mean value and the bias for each polar interaction. Note that there are no differences between bars.
Figure 3A and B shows an evident difference between the Zika virus envelope proteins (E) (Figure 5A) and their polyproteins (Figure 5B) compared to the overall mean amino acid frequencies, i.e. the average of the Zika-P polyprotein group formed by POL-P, CAM-P, and Q32-P sequences, concerning the abundances of hydrophobic aliphatic versus hydrophobic aromatic residues. Hydrophobic aliphatic residues are more abundant in the ZIKA-E group formed by POL-E, CAM-E, and Q32E sequences, while the hydrophobic aromatic amino acids are underrepresented. In the case of the polar neutral, charged acidic, and charged basic amino acid types, the differences are less pronounced.
In addition, the next results were observed when the PIM system was calibrated with structural and Zika virus polyprotein set and compared with the other corresponding protein groups (Table 4). The PIM profile of the structural protein group PAR matches with the Zika virus polyproteins and their envelope proteins (E), but it barely matches the similar proteins of the Zika virus envelope proteins (E) identified by BLAST (POL-B, CAM-B, and Q32-B). The PIM profile of the sequences POL-P, CAM-P, Q32-P, POL-E, CAM-E, Q32-E, the ZIKA-P, and ZIKA-E groups are highly discriminant when compared with all the other protein groups and the structural proteins groups (Table 4). Finally, Table 5 shows that the POL-P, CAM-P, Q32-P, POL-E, CAM-E, Q32-E protein sets have a high similarity with those defined as “reviewed proteins” from the UniProt Database.
Table 5 shows a very small number of matches between the sequences POL-E, CAM-E, and Q32-E, whose PIM profile entirely matches some proteins that do not express Zika and a high number of proteins that match the PIM profile of the sequences POL-P, CAM-P, and Q32-P. Particularly, the representative groups of envelope proteins (E), that is POL-E, CAM-E, Q32-E, and ZIKA-E, did not have a high similarity since when uploading the proteins to UniProt it is not required to register the components of the protein separately.
However, when the sub-proteins were generated with the DIVIDED program (2.6 DIVIDED program section) for each protein in the UniProt database (The DIVIDED program analyzed only the 275 000 000 subproteins, because the number of proteins registered in that database is approximately 550 000 and if we consider that each protein is divided into 500 sub-proteins, the result is (550 000 × 500 = 275 000 000), and when the PIM profile was determined for each one of them, it was observed that the PIM system identified each Zika virus envelope protein (E) contained in the Zika virus polyproteins, as well as in other proteins of the same Database (Table 6), and that the number of matches was significantly high.
Sub-proteins found in UniProt Database.

Sub-proteins with PIM profile similar to each envelope protein (E) extracted from UniProt database created using (2.6 DIVIDED program section).
PIDP profile
Data on the analysis of the intrinsic disorder predisposition of Zika virus envelope proteins (E) are summarized in Figure 4A; chart A, which represents the PIDP profiles generated for these proteins by PONDR VSL2. In addition, Figure 4A; charts B and C show “difference disorder spectra” where the disorder profile of the envelope protein from the CAM-E variant is subtracted from the profiles of the POL-E and Q32-E variants. In such representation, one can easily see local regions with disorder predispositions affected by mutations, where positive and negative peaks correspond to regions with the increased and decreased disorder propensity. This analysis revealed that the local disorder predisposition of POL-E and especially Q32-E is noticeably affected by mutations. This is an interesting observation, as based on the Clustal2.1-based multiple sequence analysis, these proteins show high sequence identity that is ranging from 99.8% to 97.2% (see Figure 4A; chart C). Therefore, this analysis revealed that despite high sequence identity, mutations might introduce noticeable perturbations in disorder predisposition of Zika envelope proteins (E).
These observations are paralleled by Figure 4B showing disorder profiles for Zika polyproteins (Figure 4B; chart D) and their corresponding “difference disorder spectra” (Figure 4B; chart E). Once again, Figure 4B shows that local disorder predispositions of Zika polyprotein are affected by mutations found in the different variants of this virus despite the fact that their pairwise sequence identity ranged from 99.65% to 96.49%.
Statistical test
A one-way ANOVA analysis revealed that there was no statistically significant difference in polarity/charge profile between Zika polyproteins sequences group and its envelope protein group (between groups of 2) = [F 12.538]). The same result was observed with the Kolmogorov test [Due D-Obs = 0.00920228718665161 > D-Theo = 0.000225818905241633, then Accept Ht with alpha = 0.05].
Secondary structure
Zika polyprotein displays a complex secondary structure landscape comprising a relatively large number of domains (relative to the actual size of the polyprotein). Figure 6 shows 19 DomPred predicted domains distributed as follows. Figure 6A shows the first 8 domains whose DPS boundaries are predicted at amino acid locations 121, 210, 293, 403, 587, 691 and 803. Figure 6B presents 4 additional domains with boundaries located at amino acid sites 1658, 1971, 2126 (marked at sites 517, 830 and 985 [+1141] in plot 8B). Figure 6; chart C displays the last 7 domains with boundaries at amino acid sites 2578, 2744, 2975, 3066, 3201 and 3331 (marked at sites 517, 830 and 985 [+2282] in plot 8C). Figure 6; charts 6D-6F provide further structural details of the domains at the single amino acid level. Further detail of how these domains support an intricate physiological structure with large extracellular domains associated with a quite intricate membrane-pore-lining structure is shown in Supplemental Materials of Figure 7; charts A-I. Figure 7 in charts A-C displays PSIPred structural predictions for each of the 3 meta-domains down at the single amino acid level. It can be observed how there is a large complexity in the distribution of helices, coils and strands setting the foundations for the membrane interacting extracellular domains (Figure 7; charts D-F). A graphical depiction of the membrane pore-lining structure is shown in (Figure 7; charts G-I). Calculation tables for all results in Figures 6 and 7 are provided in the Supplemental Materials section.

The full Zika virus polyprotein is segmented into 3 equal-sized meta-domains (each one comprising 1141 consecutive amino acid residues). Charts (A-C) display the DomPred domain prediction plots for each of the meta-domains respectively. Charts (D-F) present the structural domain distributions at the single amino acid level. This figure is available in the Supplemental Materials section.

Charts (A-C) present PsiPred structural predictions at the single amino acid level for the 3 Zika virus meta-domains, respectively. Charts (D and E) present MEMSAT_SVM structural predictions of membrane pore lining structures for the same 3 meta-domains, respectively. Charts (G-I) present a cartoon view of the membrane pore lining structure for the same 3 meta-domains. This figure is available in the Supplemental Materials section.
Discussion
We have developed this section by themes to focus on each of the different aspects of this work.
PIM profile
Figure 1 represents the minor changes between the PIM profiles of Zika virus polyproteins and their corresponding envelopes. As mentioned in (3.1 PIM profile section) the changes occur mainly in 3 PIM interactions; however, an inflection point occurs in the [P−, N]] for the Zika envelope (E) proteins group (ZIKA-E), which is not observed for the Zika virus polyprotein group (ZIKA-P). This is a greater change between both groups, which in our experience would indicate that the ZIKA-E group must necessarily be in the interior (particularly close to its center) 23 of the polyprotein sequence.
Chemical analysis
The differences between the hydrophobic aliphatic versus hydrophobic aromatic residue abundances in the Zika virus envelope protein (E) groups (Figure 3A), and their corresponding proteins (Figure 3B) can be associated with protein folding, stability, molecular recognition, and self-assembly processes. In particular, for the Zika virus proteins, the stabilizing interactions through aromatic stacking seem to play a minor role in the water-excluding effect, while the higher abundance of the hydrophobic aliphatic residues suggests a different function of hydrophobic interactions in the construction of the tertiary protein structures.
PIDP profile
Intrinsic disorder analysis revealed that mutations found in different variants of this virus cause noticeable changes in the local disorder predispositions of the envelope (E) protein and polyprotein. These differences are clearly seen in the overlaid disorder profiles, and their visibility can be further enhanced using “difference disorder spectra” approach by subtracting one profile from another. In such presentation, positive/negative peaks correspond to regions whose disorder predisposition increased/decreased as a result of mutations.
Secondary structure
Secondary structure calculations as presented in Figure 6 and the Supplemental Materials of Figure 7 unveil an intricate folding structure that is behind the distinctive domains. The ability to form these structures (able to span over multiple extracellular and membrane-associated domains) are indeed quite relevant for the functional internalization and other biologically relevant features of the Zika virus polyprotein. This is one further example of the unique character of this viral polyprotein. In addition to the features already discussed, it is noteworthy that in view of the pervasiveness of the sequence fingerprint, most computational predictions of protein structures resulted of high confidence. Such well-behaved structural predictions can be potentially associated to evolutionary convergence of the protein domains.
PIM possible uses
The computational differentiation of proteins from unsupervised algorithms can be used in future wireless microchips to determine, in real-time, the sequences in the organism. These methods can be used to determine the identity or the main function of the proteins. At present, it is possible to use them for work on public databases to find new protein functions for the already classified proteins, or to analyze the evolution of the “fingerprint” of proteins.
Conclusions
A PIM system is a computational tool that makes it possible to differentiate the Zika virus polyproteins from their sequences, in the groups extracted from different Databases, and this differentiation is made up from their envelope proteins (E) and their sequences level. In addition, it was possible to observe a conspicuous regularity in the phase-portrait of the envelope proteins (E), which has already been observed by this team, that keeps a strong similarity with the identification of the preponderant function of protein sets.
Supplemental Material
sj-zip-1-evb-10.1177_11769343221130730 – Supplemental material for Bioinformatics-based Characterization of the Sequence Variability of Zika Virus Polyprotein and Envelope Protein (E)
Supplemental material, sj-zip-1-evb-10.1177_11769343221130730 for Bioinformatics-based Characterization of the Sequence Variability of Zika Virus Polyprotein and Envelope Protein (E) by Carlos Polanco, Vladimir N Uversky, Alberto Huberman, Gilberto Vargas-Alarcón, Jorge Alberto Castañón González, Thomas Buhse, Enrique Hernández Lemus, Martha Rios Castro, Erika Jeannette López Oliva and Sergio Enrique Solís Nájera in Evolutionary Bioinformatics
Supplemental Material
sj-zip-2-evb-10.1177_11769343221130730 – Supplemental material for Bioinformatics-based Characterization of the Sequence Variability of Zika Virus Polyprotein and Envelope Protein (E)
Supplemental material, sj-zip-2-evb-10.1177_11769343221130730 for Bioinformatics-based Characterization of the Sequence Variability of Zika Virus Polyprotein and Envelope Protein (E) by Carlos Polanco, Vladimir N Uversky, Alberto Huberman, Gilberto Vargas-Alarcón, Jorge Alberto Castañón González, Thomas Buhse, Enrique Hernández Lemus, Martha Rios Castro, Erika Jeannette López Oliva and Sergio Enrique Solís Nájera in Evolutionary Bioinformatics
Footnotes
Acknowledgements
The authors thank Concepción Celis Juárez and Lynda Anderson-Coe for proof-reading. The authors acknowledge additional support from the National Institute of Genomic Medicine.
Funding:
The author(s) disclosed receipt of the following financial support for the research, authorship, and/or publication of this article: from the National Institute of Genomic Medicine.
Declaration of Conflicting Interests:
The author(s) declared no potential conflicts of interest with respect to the research, authorship, and/or publication of this article.
Authors’ Contributions
Theoretical conceptualization, and design: CP. Computational performance: CP, VNU, EJLO, SESM, and EHL. Statistic analysis: CP, and MRC. Data analysis: CP, AH, VNU, TB, GVA, and MRC. Discussion: CP, AH, VNU, GVA, TB, and JACG.
Availability of Data and Materials
Copyright & Trademark. All rights reserved (México), 2018: Polarity Index Method (PIM), and PONDR (U.S.A), 2007. Software & Hardware. Hardware: The computational platform used to process the information was a HP Workstation z400—CMT—4 x Intel Xeon E3-1270/3.4 GHz (Quad-Core)—RAM 8/4 GB—SSD 1 x 160 GB—DVD SuperMulti—Quadro 2000—Gigabit LAN, 64-bits. Cache Memory 8 MB. Cache Per Processor 8 MB. RAM 8/4. Operating system: Linux Fedora 35. Software: PONDR VSL2, DisProt, IUPred2a, and Polarity Index Method (PIM).
Ethical Approval and Consent to Participate
Not applicable, because all authors do not report on or involve the use of any animal or human data or tissue.
Consent for Publication
All authors declare that we have read the submitted manuscript, and that we agree to its publication.
Supplemental Material
The test files and programs used were supplied as support of the manuscript to the journal in the Supplementary Materials section, also but they can be requested from the corresponding author (
References
Supplementary Material
Please find the following supplemental material available below.
For Open Access articles published under a Creative Commons License, all supplemental material carries the same license as the article it is associated with.
For non-Open Access articles published, all supplemental material carries a non-exclusive license, and permission requests for re-use of supplemental material or any part of supplemental material shall be sent directly to the copyright owner as specified in the copyright notice associated with the article.