
Abstract
With an aging population that continues to grow, health care technology plays an increasingly active role, especially for chronic disease management. In the health care market, cloud platform technology is becoming popular, as both patients and physicians demand cost efficiency, easy access to information, and security. Especially for asthma and chronic obstructive pulmonary disease (COPD) patients, it is recommended that pulmonary function test (PFT) be performed on a daily basis. However, it is difficult for patients to frequently visit a hospital to perform the PFT. In this study, we present an application and cloud platform for remote PFT monitoring that can be directly measured by smartphone microphone with no external devices. In addition, we adopted the IBM Watson Internet-of-Things (IoT) platform for PFT monitoring, using a smartphone’s built-in microphone with a high-resolution time-frequency representation. We successfully demonstrated real-time PFT monitoring using the cloud platform. The PFT parameters of FEV1/FVC (%) could be remotely monitored when a subject performed the PFT test. As a pilot study, we tested 13 healthy subjects, and found that the absolute error mean was 4.12 and the standard deviation was 3.45 on all 13 subjects. With the developed applications on the cloud platform, patients can freely measure the PFT parameters without restriction on time and space, and a physician can monitor the patients’ status in real time. We hope that the PFT monitoring platform will work as a means for early detection and treatment of patients with pulmonary diseases, especially those having asthma and COPD.
Keywords
Introduction
Cloud computing offers scalability, flexibility, agility, and ubiquity in terms of data acquisition, storage, communication, and analysis. It provides on-demand computing resources and remote service applications by connecting them to a user’s computer, both of which are available over the Internet. The capabilities of computing resources and service software over the Internet can meet the consumer’s interest with respect to wellness, especially in the case of population aging.1-4 Nowadays, the health care market is shifting its focus from volume-based to value-based services, which reward the providers on the basis of care, cost-effectiveness, and clinical case outcomes. In addition, a consumer voluntarily uses a smartphone and a wearable device for tracking his or her own vital signals in real time. Such an active participation in health management drives the requirement for a health care provider that offers more convenient access and interaction, which has resulted in a requirement for cloud computing.
Till date, several health care services based on cloud computing have been considered. Health care services are mainly categorized into health management, care management, diagnostic support, image handling, medical practitioner assistance, patient connectivity, medical information distribution, clinical research, and case management services. Recently, a cloud platform for elderly fall detection using an embedded tri-axial accelerometer and a global positioning system (GPS) was proposed. 5 The platform provides features such as push notifications for fall alarms and real-time maps for tracking locations and obtaining phone numbers of hospitals that are near by. Tsoi et al 6 proposed a cloud platform for managing blood pressure (BP), wherein each user’s BP was uploaded on a daily basis. The remote platform of the cloud provides efficient analytical performance for large volumes of data with a high velocity of data creation in a population-based study. Al Mamun et al 7 proposed a cloud platform for supporting Parkinson patients by monitoring the patients to enable health care services, especially in a low-resource setting. Xia et al 8 developed a cloud platform for electrocardiogram (ECG) monitoring by connecting clients to mobile devices or Web browsers. It demonstrated how ECG data that were obtained from a mobile phone at a certain frequency were uploaded and analyzed in the Web server. In addition, a variety of cloud-platform-based health care services have been presented in literature.9-17
In this article, we present a cloud platform for a remote pulmonary function test (PFT), wherein the measurements are directly obtained using a smartphone microphone. The PFT is clinically used for evaluating lung functionality and thus used for diagnosing lung diseases such as asthma, allergies, chronic bronchitis, respiratory infections, lung fibrosis, bronchiectasis, and chronic obstructive pulmonary disease (COPD). It is used to evaluate lung functionality by investigating how well the lungs take in and release air. For the PFT, a spirometer is the main component that is used as a medical device, the measurements of which are used to obtain a time-volume curve and a volume-flow loop.18,19 From the measurements, the forced vital capacity (FVC), forced expiratory volume in 1 s (FEV1), FEV1/FVC ratio, peak expiratory flow (PEF), forced expiratory flow at 25%, 50%, or 75% of the FVC (FEF25, FEF50, and FEF75), and forced expiratory flow between 25% and 75% (FEF25%-75%) can be quantized.20-22 As smartphone technology has the capacity for users to communicate with a health care provider, smartphone-based home spirometry has the potential for providing early diagnosis of lung disease for those who may have breathing problems on a day-to-day basis.22-27 We recently reported the feasibility of smartphone-based spirometry, but it required a mouthpiece adapter to maintain lip postures and to fix the distance between the lips and the microphone. 28 In this article, we presented IBM Watson Internet-of-Things (IoT) platform-based remote PFT monitoring, the measurements for which were obtained using a smartphone microphone with no external devices. The contribution of this study is to present IoT-platform-based remote and real-time PFT monitoring. In this platform, we also presented the smartphone application for the FEV1/FVC estimator by means of a high-resolution time-frequency representation. All signal acquisition and processing were directly in the smartphone device via a built-in microphone. The computed FEV1/FVC ratio is then transferred, stored, and displayed in a cloud application based on the IBM Watson IoT platform. Using the developed platform, patients can freely measure PFT parameters without any restriction on time, and a physician can monitor the patients’ status and provide feedback to patients in real time.
Cloud-Platform-Based PFT Monitoring Using Smartphone
PFT using a smartphone built-in microphone
To realize the PFT using a smartphone’s built-in microphone, we first recorded forced exhalation sounds x(t) using the microphone and analyzed the sounds obtained using the variable frequency complex demodulation (VFCDM) method, which has provided greater resolution than any other time-frequency representation methods, such as the smoothed pseudo Wigner-Ville (SPWV), short-time Fourier transform (STFT), and wavelet transform (WT) methods.29-32 Indeed, the VFCDM showed better results than WT and STFT in the previous study.
28
A x(t) can be represented using an instantaneous amplitude A(t), center frequency

On multiplying equation (1) by

where the first term

Furthermore, if the modulating frequency

On multiplying equation (4) by

As in equation (3), with the LPF having the cut-off frequency of
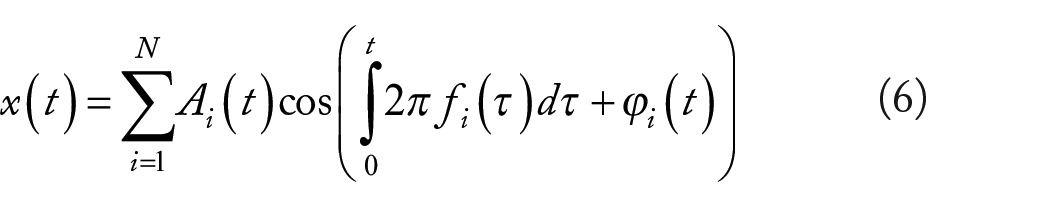
We can re-formulate x(t) in equation (4), decomposing it into the sinusoidal modulations as shown in equation (6)
We then applied Hilbert transform H(•) as follows
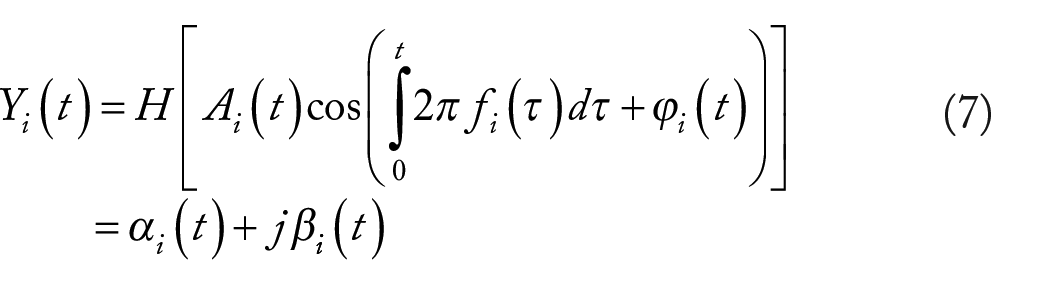
The resultant analytic signal


Thus, the combined use of the Hilbert transform and the multiplication by
In the resultant time-frequency representation, we found the maximum frequency in each time samples. Finally, we plotted the maximum powers versus the accumulated maximum power, and the accumulated power versus the time samples, which correspond to the volume-flow curve and time-volume curve, respectively.
Figure 1 shows an example of the main procedure for obtaining the volume-flow curve and time-volume curve from the measured signal. Figure 1(A) shows the original audio signal measured using a smartphone’s built-in microphone, which provides a sampling rate of 44 100 Hz. We downsampled the signal to 2450 Hz, and filtered the signal using the seventh-order elliptic LPF with a cut-off frequency of 800 Hz. Figure 1(B) shows the resultant VFCDM-based time-frequency representation with the bandwidth normalized frequency of 0.03 Hz, and filter length of 64. Figure 1(C) and (D) shows the maximum powers versus the accumulated maximum power, and the accumulated power versus time, respectively. These figures correspond to the volume-flow and time-volume curves that are used for measuring the FVC, FEV1, FEV1/FVC ratio, and PEF as shown in Figure 1(E) and (F). More specifically, the maximum power and the accumulated maximum power in Figure 1(C) correspond to the flow rate and the total volume in Figure 1(E), respectively. The accumulated maximum power and time in Figure 1(D) correspond to the total volume and time in Figure 1(F), respectively.

Main procedure for obtaining volume-flow curve and time-volume curve from a healthy subject: (A) measured signal obtained using a smartphone’s built-in microphone; (B) resultant time-frequency representation obtained using VFCDM; (C) maximum power versus accumulated maximum obtained using VFCDM; (D) accumulated power versus time obtained using VFCDM; (E) clinical volume-flow curve (V is volume and F is flow rate); and (F) clinical time-volume curve (T is time and V is volume).
Cloud platform for remote PFT monitoring
In the smartphone’s built-in microphone-based PFT, each subject may exhale at different angles with respect to the built-in microphone or at different distance from the microphone. According to each measurement condition, the parameters FVC, FEV1, and PEF could be incorrectly estimated. On the contrary, the ratio FEV1/FVC is independent of the measurement condition, and thus, it is currently a stable and accurate parameter that a physician can evaluate for diagnosing lung diseases. The FEV1/FVC ratio has been clinically accepted, especially for assessing airway obstruction. The American Thoracic Society (ATS) defined airway obstruction using the ratio lower than 0.75 in 1987, 23 followed by the British Thoracic Society (BTS) with 0.70 in 1997, 33 the National Institute for Health and Clinical Excellence (NICE) with 0.75 in 2004, 24 the ATS and the European Respiratory Society (ERS) with 0.75 in 2007, 25 and the Global Initiative for Chronic Obstructive Lung Disease (GOLD) with 0.75 in 2007. 24 Thus, in this article, we limited our scope to consider the ratio FEV1/FVC.
For remote PFT monitoring, we sent only the value of the ratio FEV1/FVC to the cloud platform. To realize remote PFT monitoring, we adopted the IBM Watson IoT platform, which is a fully managed, cloud-hosted service that simplifies the management of data obtained from IoT devices. 34 The platform also provides natural language processing, machine learning, and image and text analytics. The application that makes use of the Bluemix IoT service generally comprises device-side programming, application-side programming, and a Bluemix IoT service configuration such as device and application registration, as illustrated in Figure 2. Note that the Bluemix is an implementation of IBM’s open cloud architecture that enables us to rapidly create, deploy, and manage cloud applications. The IBM Watson IoT platform is the platform that the Bluemix offers.
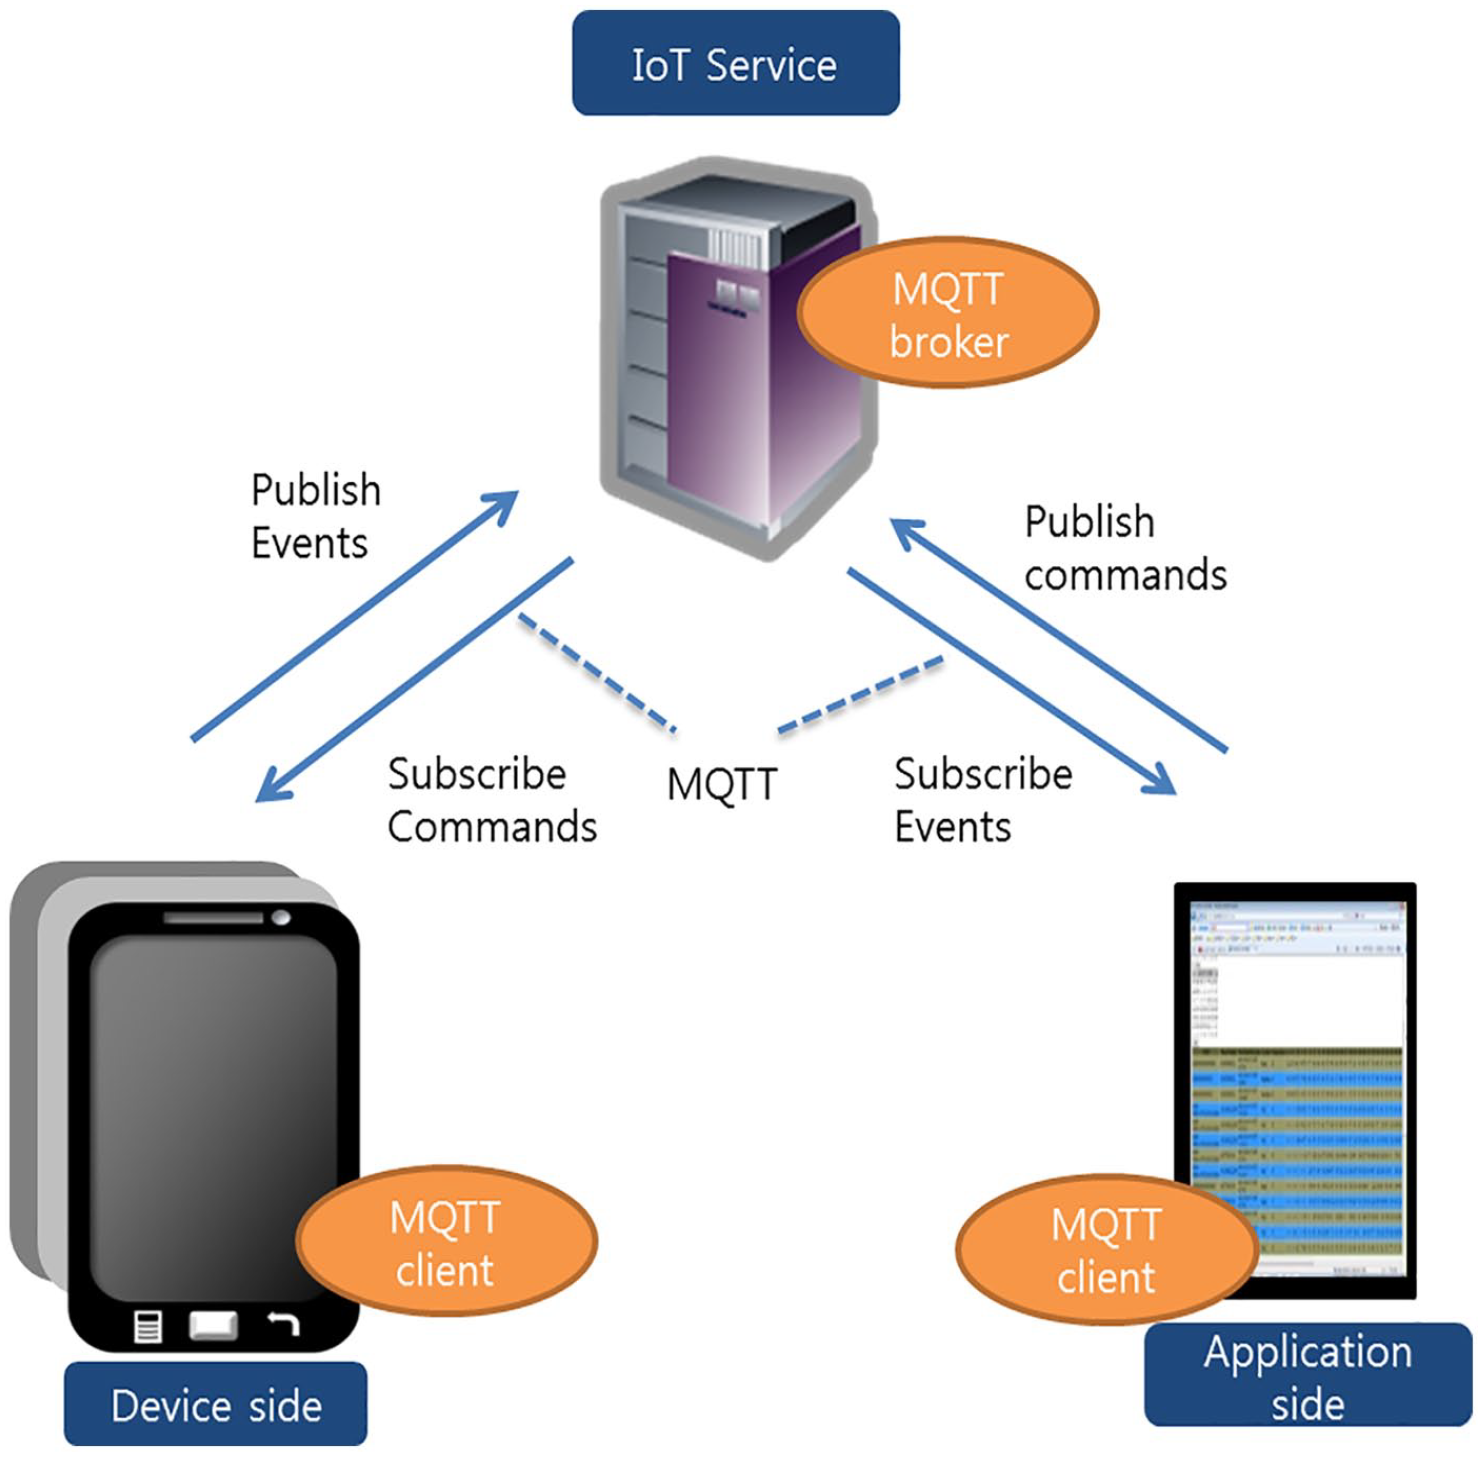
Overview of application using Bluemix IoT service.
In the IoT service configuration, we first created an app on the dashboard and added the IoT service. Subsequently, we registered 13 recruited subjects with their smartphones as devices and also registered the application for remote monitoring. On the device-side, we programmed using the Java (Android phone) and Objective-C (iPhone) programming languages for the IoT service connection, which facilitates the publishing of the estimated FEV1/FVC value (events) for the IoT service and enables users to subscribe for the PFT-request from a physician (commands) using the IoT service. In the application-side programming, we programmed a Node-RED for the IoT service connection, which enables the users to subscribe for the estimated FEV1/FVC value (events) from the IoT service and publish a PFT-request with a physician (commands) to the IoT service. It should be note that Node-RED is a visual tool that facilitates the easy writing and processing of IoT messages, and is built on Node.js. Figure 3 shows the remote monitoring application nodes developed using Node-RED. In the upper part (smartphone device), the inject node “Send FEV1/FVC Data” sends the estimated FEV1/FVC value into the flow when a user completes the PFT test using a smartphone. Subsequently, the function node “Assign Device ID” identifies the device identification (ID) number, and the output node “Send to IoT Service” sends the estimated FEV1/FVC value with the assigned device ID to the remote monitoring application. In the lower part (remote monitoring application), the inject node “Set Up Measurement Interval according to Each Subject” sets up the PFT measurement interval according to each subject that is recommended by a physician. Subsequently, the function node “Identify Device for Notification” identifies the PFT-request time for each device, and the output node “Push Notification” sends the notification to each device (Figure 3).

Remote monitoring application nodes enabling to subscribe the estimated FEV1/FVC value (events) and publish PFT-request (commands) developed on Node-RED.
In addition, when the smartphone (device) subscribes for the PFT-request (commands) or the application subscribes for the estimated FEV1/FVC value (events), message queue telemetry transport (MQTT) was used. Message queue telemetry transport is an ISO standard publish-subscribe-based “lightweight” messaging protocol for use on top of the transmission control protocol/internet protocol (TCP/IP). It is designed for creating connections with remote locations where the network bandwidth is limited. The Bluemix IoT service acts as the MQTT broker, which is responsible for distributing messages to the connected smartphones (devices) and the remote monitoring application.
Experimental Results
Experimental protocol
To measure the audio signal, we used an Android Galaxy S6 (Samsung, Seoul, South Korea), or an iPhone 6S (Apple, Cupertino, CA), and recorded each subject forced exhalation sounds, which were sampled at 44 100 Hz.
The subjects were required to breathe in their full lung capacity and then forcefully exhale as much air from the lungs as possible toward the smartphone’s built-in microphone as shown in Figure 4. The distance between the microphone and lips was 10 cm. The test was performed on 13 healthy subjects in an open-space environment at Wonkwang University Hospital. This study was approved by the institutional review and board of Wonkwang University Hospital. All participants provided written informed consent. The measured signals were down-sampled to 2450 Hz, and a seventh-order elliptic LPF with a cut-off frequency of 800 Hz applied to filter out the background noise. The tests were performed with three trials, and each trial result was sent to the IBM Watson IoT platform. To validate the results, the participants also performed the trial test with clinical equipment as a reference. The clinical data were obtained using Vmax software version IVS-0101-21-2B (manufactured by CareFusion Corporation, San Diego, CA, USA), which provided the FEV1/FVC ratio.

Data acquisition using a smartphone via a built-in microphone.
PFT results in smartphone application from smartphone microphone
Figure 5 shows the Android phone application developed using the Java programming language. Note that we also developed the iPhone application developed using the Objective-C programming language. Figure 5(A) shows the screen snapshot for the measurement initialization. Once clicking the red button at the bottom, the recording is started. Each subject breathes in his or her full lung capacity and then forcefully exhales as much air from the lungs as possible toward the smartphone’s built-in microphone. By clicking the red button again, the recording is completed as shown in Figure 5(B). After the recording is obtained, the volume-flow curve is displayed with the estimated FVC, FEV1, PEF, and FEV1/FVC as shown in Figure 5(C). Each subject performed the recording with three trials by clicking the trial buttons (i.e. Trial 1, Trial 2, and Trial 3). Among the quantized four parameters, we sent only the FEV1/FVC ratio value to IBM Watson IoT platform. A health care provider or a physician monitors the ratio values and provides feedbacks regarding the measurement interval. In the future work, we will perform the clinical study and verify the whole system including the feedback.

Developed smartphone application: (A) measurement initialization, (B) recording the forceful exhalation, and (C) resultant volume-flow curve and estimated FVC, FEV1, PEF, and FEV1/FVC.
Remote PFT monitoring results
Figure 6 shows the monitoring of our developed remote PFT parameter FEV1/FVC obtained from one of the subjects based on the use of the IBM Watson IoT platform. The subject performed three trials with the PFT using smartphone microphone and sent the resultant data to the IoT service. Figure 6(A) to (C) show three consecutively measured FEV1/FVC multiplied by 100 as percentages. The results indicate that the FEV1/FVC (%) could be remotely monitored when a subject performed the PFT via smartphone built-in microphone.

Our developed remote PFT parameter monitoring based on the IBM Watson IoT platform: (A) first trial result, (B) second trial result, and (C) third trial result.
For 13 subjects with the registered 13 smartphones, we could monitor the FEV1/FVC values in 13 visualized windows. Comparing with the reference percentage of FEV1/FVC (%) obtained from the clinical equipment, we found that the absolute error mean was 4.12 and the standard deviation was 3.45 on all 13 subjects. In our developed platform, all the signal processing was performed in the smartphone device. In more complicated network system with numerous users and health care providers, the signal processing performed in smartphone will reduce the computation burden from cloud.
Conclusions
In this study, we presented IBM Watson IoT-platform-based remote PFT monitoring, the measurements of which were directly obtained using a smartphone’s built-in microphone with no external devices. With the developed applications on the cloud platform, patients can freely measure the PFT parameters without any restriction on time and space, and a physician can monitor the patients’ status in real time. In addition, based on the real-time monitoring, a physician can provide feedbacks to a patient regarding the necessary management steps and treatment. We believe that continuous monitoring facilitates the early detection of pulmonary disease by providing both physicians and patients with real-time PFT parameters. In the cloud computing environment we developed, we used only the FEV1/FVC ratio, which is a stable and accurate value in any measurement environment. In other words, each subject may exhale at different angles toward the built-in microphone or with different distance between the lips and the microphone. Thus, according to each measurement condition, the other parameters of FVC, FEV1, and PEF could be incorrectly estimated. Thus, in future research, the effect of the measurement condition should be thoroughly investigated, and the parameters FVC, FEV1, and PEF should be available in the application for a more accurate diagnosis. Furthermore, since our developed platform and system provides a health care provider with only the remote monitoring, the future research should consider the alarm and feedback system. Then, we expect that the accumulated data will drive big data analytics, which will provide us with a better understanding of pulmonary disease based on an analysis of the patterns and trends recorded.
Footnotes
Funding:
The author(s) disclosed receipt of the following financial support for the research, authorship, and/or publication of this article: This research was partly supported by the Korea Institute for Advancement of Technology (KIAT) grant funded by the Korea Government (MOTIE) (grant no. N0001791; HRD Program for ICT Convergence Smart Rehabilitation Industrial Education Program) and the Soonchunhyang University Research Fund.
Declaration of conflicting interests:
The author(s) declared no potential conflicts of interest with respect to the research, authorship, and/or publication of this article.
Author Contributions
JL and YN conceptualized the study, curated data and wrote the manuscript. HC and CJ developed software and analyzed the experiments. AKL validated the methodology and result analysis. All authors read and approved the final manuscript.