
Abstract
Background:
Mortality after total hip arthroplasty (THA) is a rare but devastating complication. This meta-analysis aimed to: (1) determine the mortality rates at 30 days, 90 days, 1 year, 5 years and 10 years after THA; (2) identify risk factors and causes of mortality after THA.
Methods:
Pubmed, MEDLINE, Cochrane, EBSCO Host, and Google Scholar databases were queried for studies reporting mortality rates after primary elective, unilateral THA. Inverse-proportion models were constructed to quantify the incidence of all-cause mortality at 30 days, 90 days, 1 year, 5 years and 10 years after THA. Random-effects multiple regression was performed to investigate the potential effect modifiers of age (at time of THA), body mass index, and gender.
Results:
A total of 53 studies (3,297,363 patients) were included. The overall mortality rate was 3.9%. The 30-day mortality was 0.49% (95% CI; 0.23–0.84). Mortality at 90 days was 0.47% (95% CI, 0.38–0.57). Mortality increased exponentially between 90 days and 5 years, with a 1-year mortality rate of 1.90% (95% CI, 1.22–2.73) and a 5-year mortality rate of 9.85% (95% CI, 5.53–15.22). At 10-year follow-up, the mortality rate was 16.43% (95% CI, 1.17–22.48). Increasing comorbidity indices, socioeconomic disadvantage, age, anaemia, and smoking were found to be risk factors for mortality. The most commonly reported causes of death were ischaemic heart disease, malignancy, and pulmonary disease.
Conclusions:
All-cause mortality remains low after contemporary THA. However, 1 out of 10 patients and 1 out of 6 patients were deceased after 5 years and 10 years of THA, respectively. As expected, age, but not BMI or gender, was significantly associated with mortality.
Introduction
Total hip arthroplasty (THA) has been consistently shown to improve the quality of life of patients with debilitating end-stage hip osteoarthritis with an average increase in quality adjusted life-years of 0.25 and an overall lifetime increase of 2.35.1,2 Specifically, THA provides improvements in joint mobility, pain relief, functional outcomes, and patient satisfaction.3,4 In the United States alone, over 370,000 THAs are performed annually and by current projections, annual volume is estimated to reach 635,000 THAs by 2030. 5 Nevertheless, THA remains a major surgical procedure that carries a real, inherent, risk of death. Considering the number of THAs performed worldwide is expected to increase with time, the mortality burden among THA recipients is considerable.
Mortality following THA is a devastating complication of an elective procedure. Therefore, multiple studies have focused on monitoring mortality among THA recipients at different time points. For example, nationwide databases that capture an immense study population, have been used to study short-term mortality rates among THA recipients.6,7 However, these databases generally lack long-term mortality data. Furthermore, while many studies have reported long-term mortality rates for THA recipients, they have generally been limited to single institutions, specific sub-populations, temporal constraints, small sample sizes, or single geographic locations.8,9 As a result of these study limitations, the overall generalisability of outcomes has been limited. Additionally, a meta-analysis by Berstock et al. 10 estimated short-term mortality rates after THA but did not report long-term mortality rates which is of limited use for prediction of mortality past 90 days.
Estimating all-cause mortality and the risk of death following THA is critical to enhance patient care algorithms and to provide reliable expectations concerning patient survival at various time-points after THA. Furthermore, long-term mortality assessment may help elucidate the potential benefits of THA to overall patient health. Therefore, this study aimed to: (1) estimate mortality rates at 30 days, 90 days, 1 year, 5 years and 10 years after THA; and (2) identify risk factors and causes of mortality after THA.
Materials and methods
Data source and literature search
The present study was performed in accordance with the Preferred Reporting Items for Systematic Reviews and Meta-Analysis (PRISMA) guidelines. 5 databases (Cochrane, PubMed, MEDLINE, EBSCO Host, and Google Scholar) were searched by 2 independent reviewers (OT and XP) for the key terms of “total hip” or “total hip arthroplasty” and “mortality” in the period between 01 January 2011 and 30 October 2021. The search results were then imported into Rayyan, which is a free application used in systematic reviews that allows for enhanced filtering and screening by reviewers. The methodology for this study was registered prospectively in PROSPERO (CRD42022332321).
Screening and eligibility criteria
The studies were assessed for eligibility by 2 independent reviewers at 3 separate stages, including title, abstract, and full-text review respectively. Full-text, English language studies published between January 2011 and October 2021 that reported all-cause mortality after primary, unilateral, elective THA were included. Studies were excluded if: (1) study population <90 patients; (2) studied non-elective THA (i.e., femoral neck fractures, other trauma); (3) reported only inpatient mortality; (4) had no mortality events; (5) evaluated specific causes of death (i.e., pulmonary embolism or myocardial infarction mortality only); and (6) evaluated surgical subpopulations with no control population (i.e., simultaneous bilateral THA, revision surgeries). Discrepancies were solved via consensus with the senior author (NP). The references for all included studies were evaluated for additional studies.
Data collection and risk of bias assessment
The following variables were collected from the included studies: authors, title, publication year, journal of publication, number of patients, average age at time of THA, comorbidity index, mortality rate, mortality interval(s), study design, country, years of data, and data source. In order to appraise the risk of bias, the Risk of Bias in Non-Randomized Studies-of-Interventions (ROBINS-I) tool was utilised. The manuscripts included were reviewed independently by the 2 authors with any discrepancy resolved through consensus with the senior author (NP). The majority of the included articles had an overall low risk of bias, while a minority of them had moderate risk or higher as shown in the stop-light representation included (Figure 1).
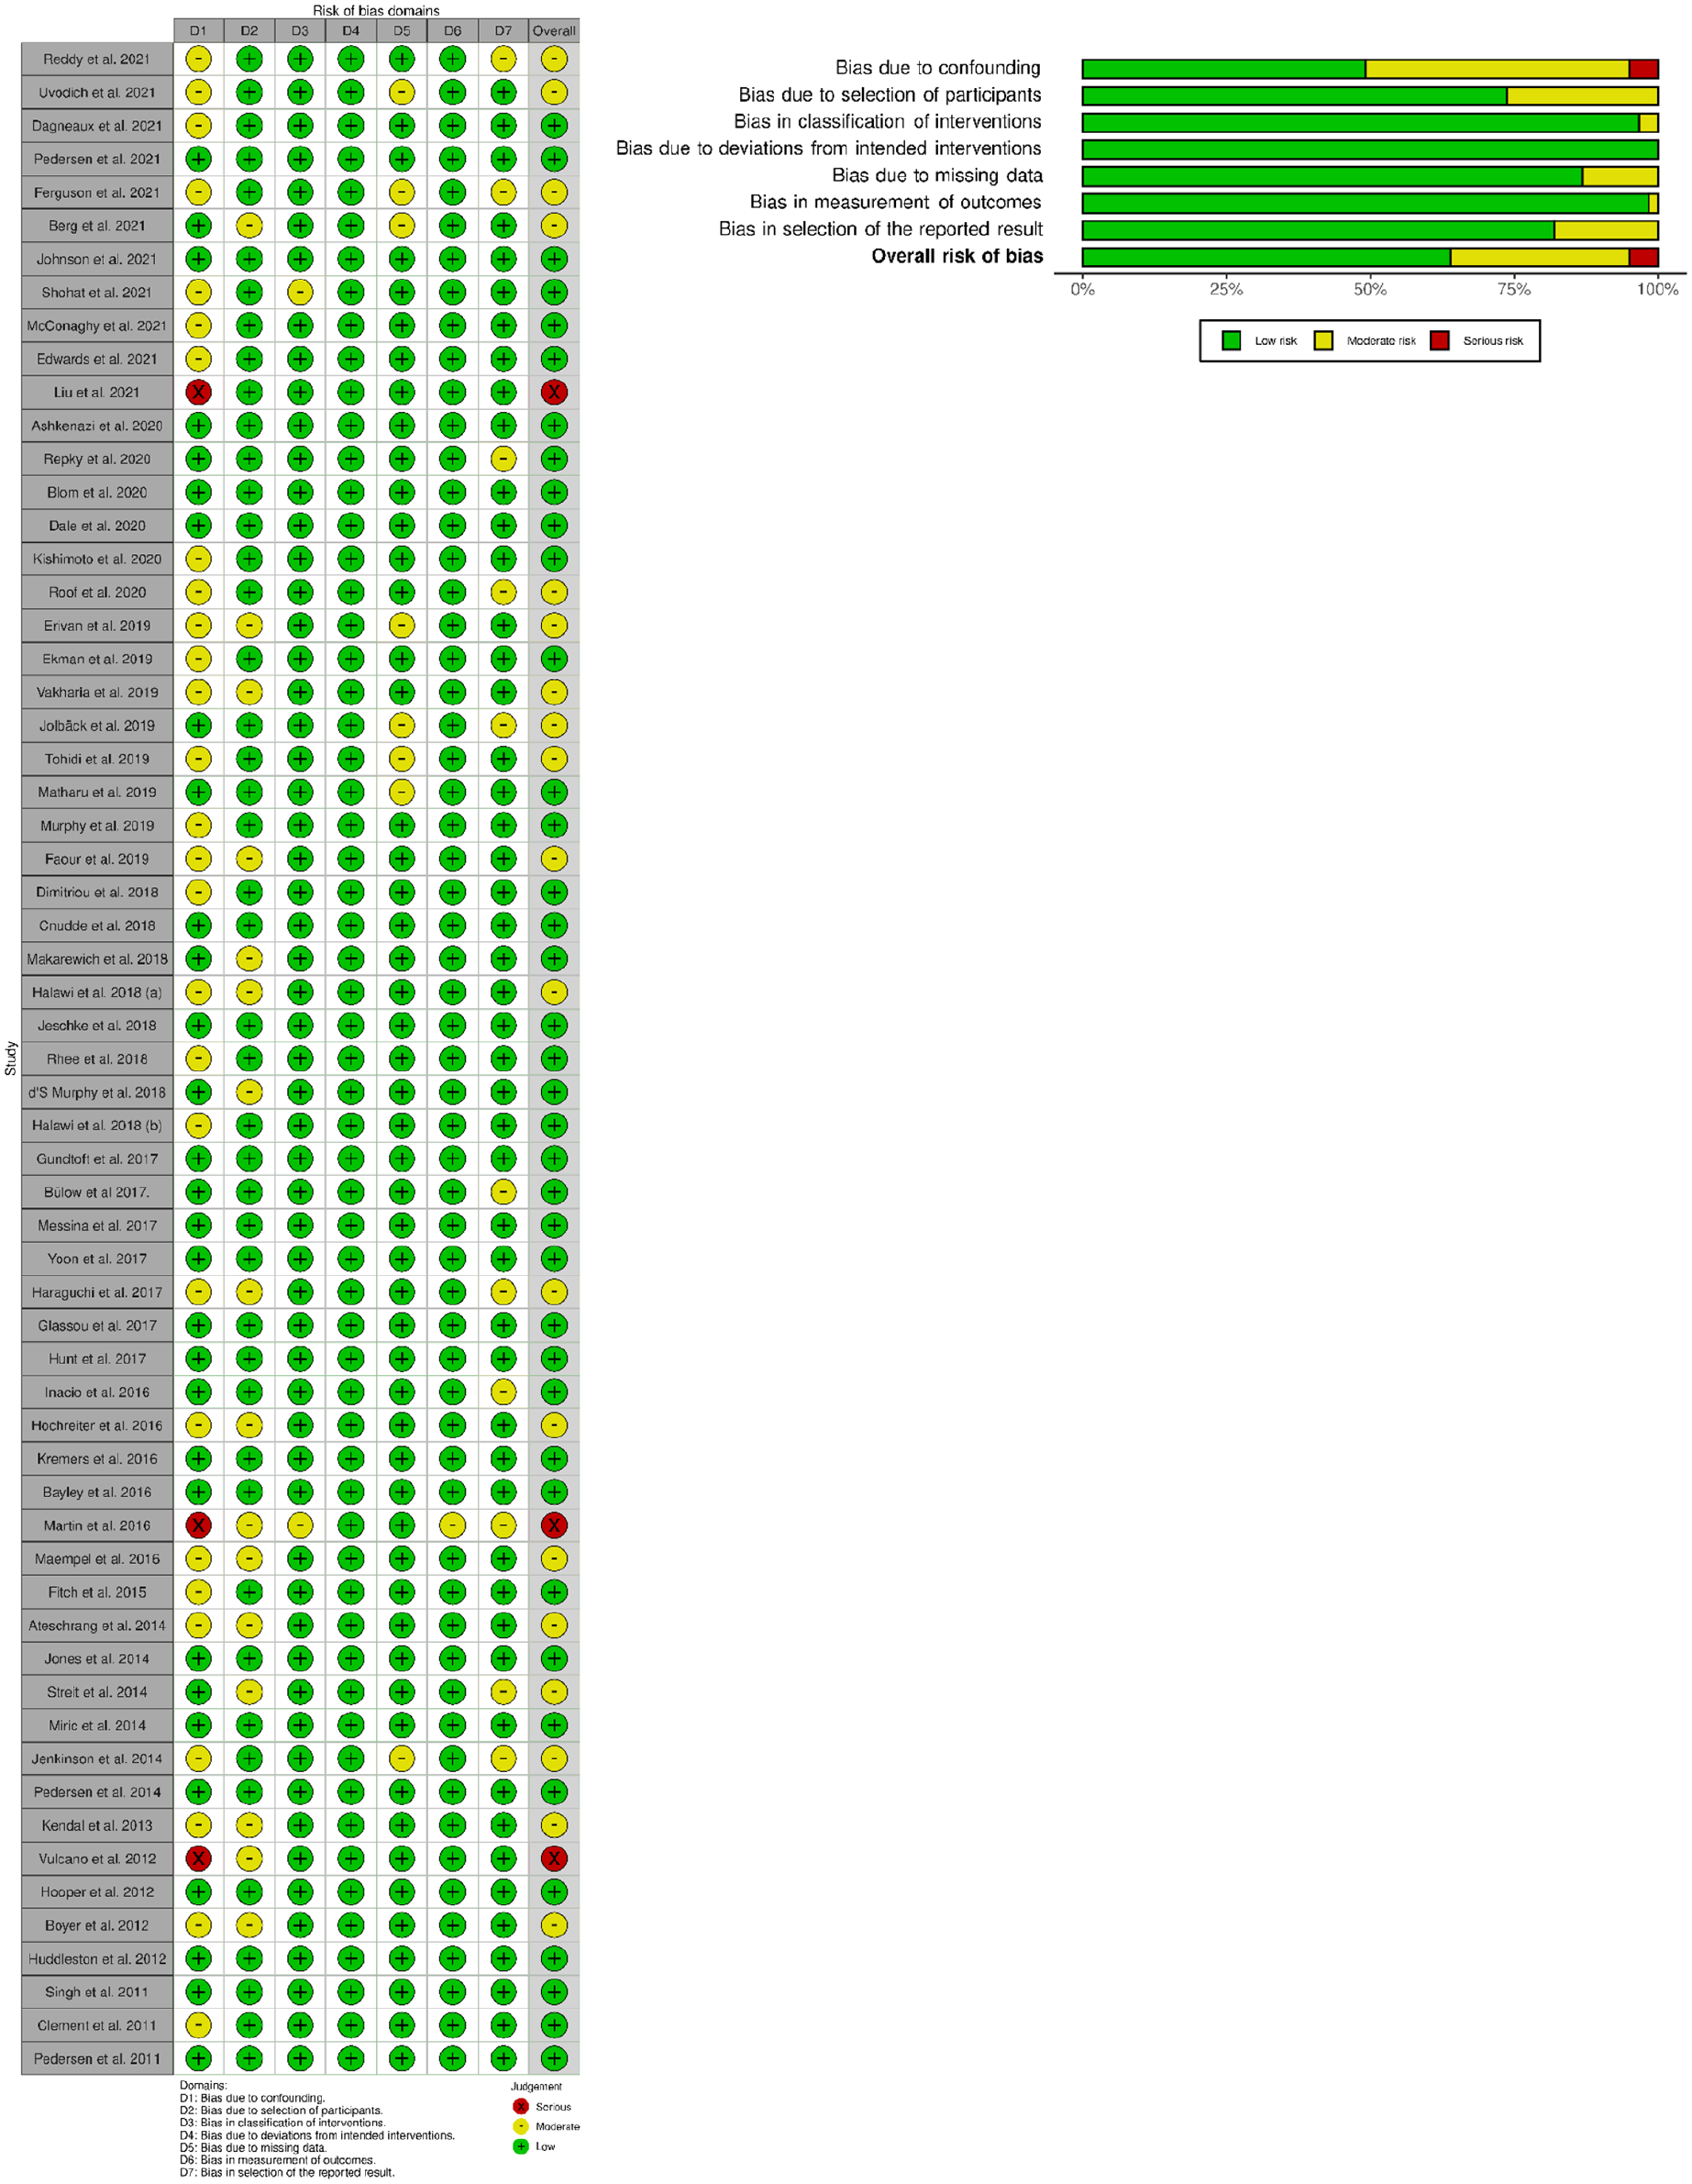
ROBINS I – Risk of Bias in Non-Randomized Studies of Interventions scores.
Statistical analysis
In order to determine pooled mortality rates, a meta-analysis of proportions was performed. To compensate for the heterogeneity of the data as well as the rarity of mortality, inverse-variance proportion models using Freeman-Tukey Double-Arscine Transformations were constructed to quantify the incidence of mortality normalized per 100 cases at each time-point after THA. At time-points with complete data, random-effects multiple meta-regression was performed to investigate the potential effect modifiers of age, body mass index (BMI), and gender on mortality. The mortality rates at each time-point were weighed according to the number of patients per study and presented in forest plots with mortality presented as events per 100 patients with 95% confidence intervals (CI). The study heterogeneity was assessed according to the Cochrane Handbook for Systematic Reviews. 11 Bubble plots were generated where meta-regression was possible to graphically depict the magnitude of the treatment effect of age, BMI, and gender on mortality.
Results
The literature searches initially yielded 2022 articles of which 178 were duplicates. Upon review of titles and abstracts, 1592 entries were excluded, and 252 articles underwent full text review. 53 articles met the inclusion and exclusion criteria (Figure 2). Review of references yielded no additional articles eligible for inclusion.
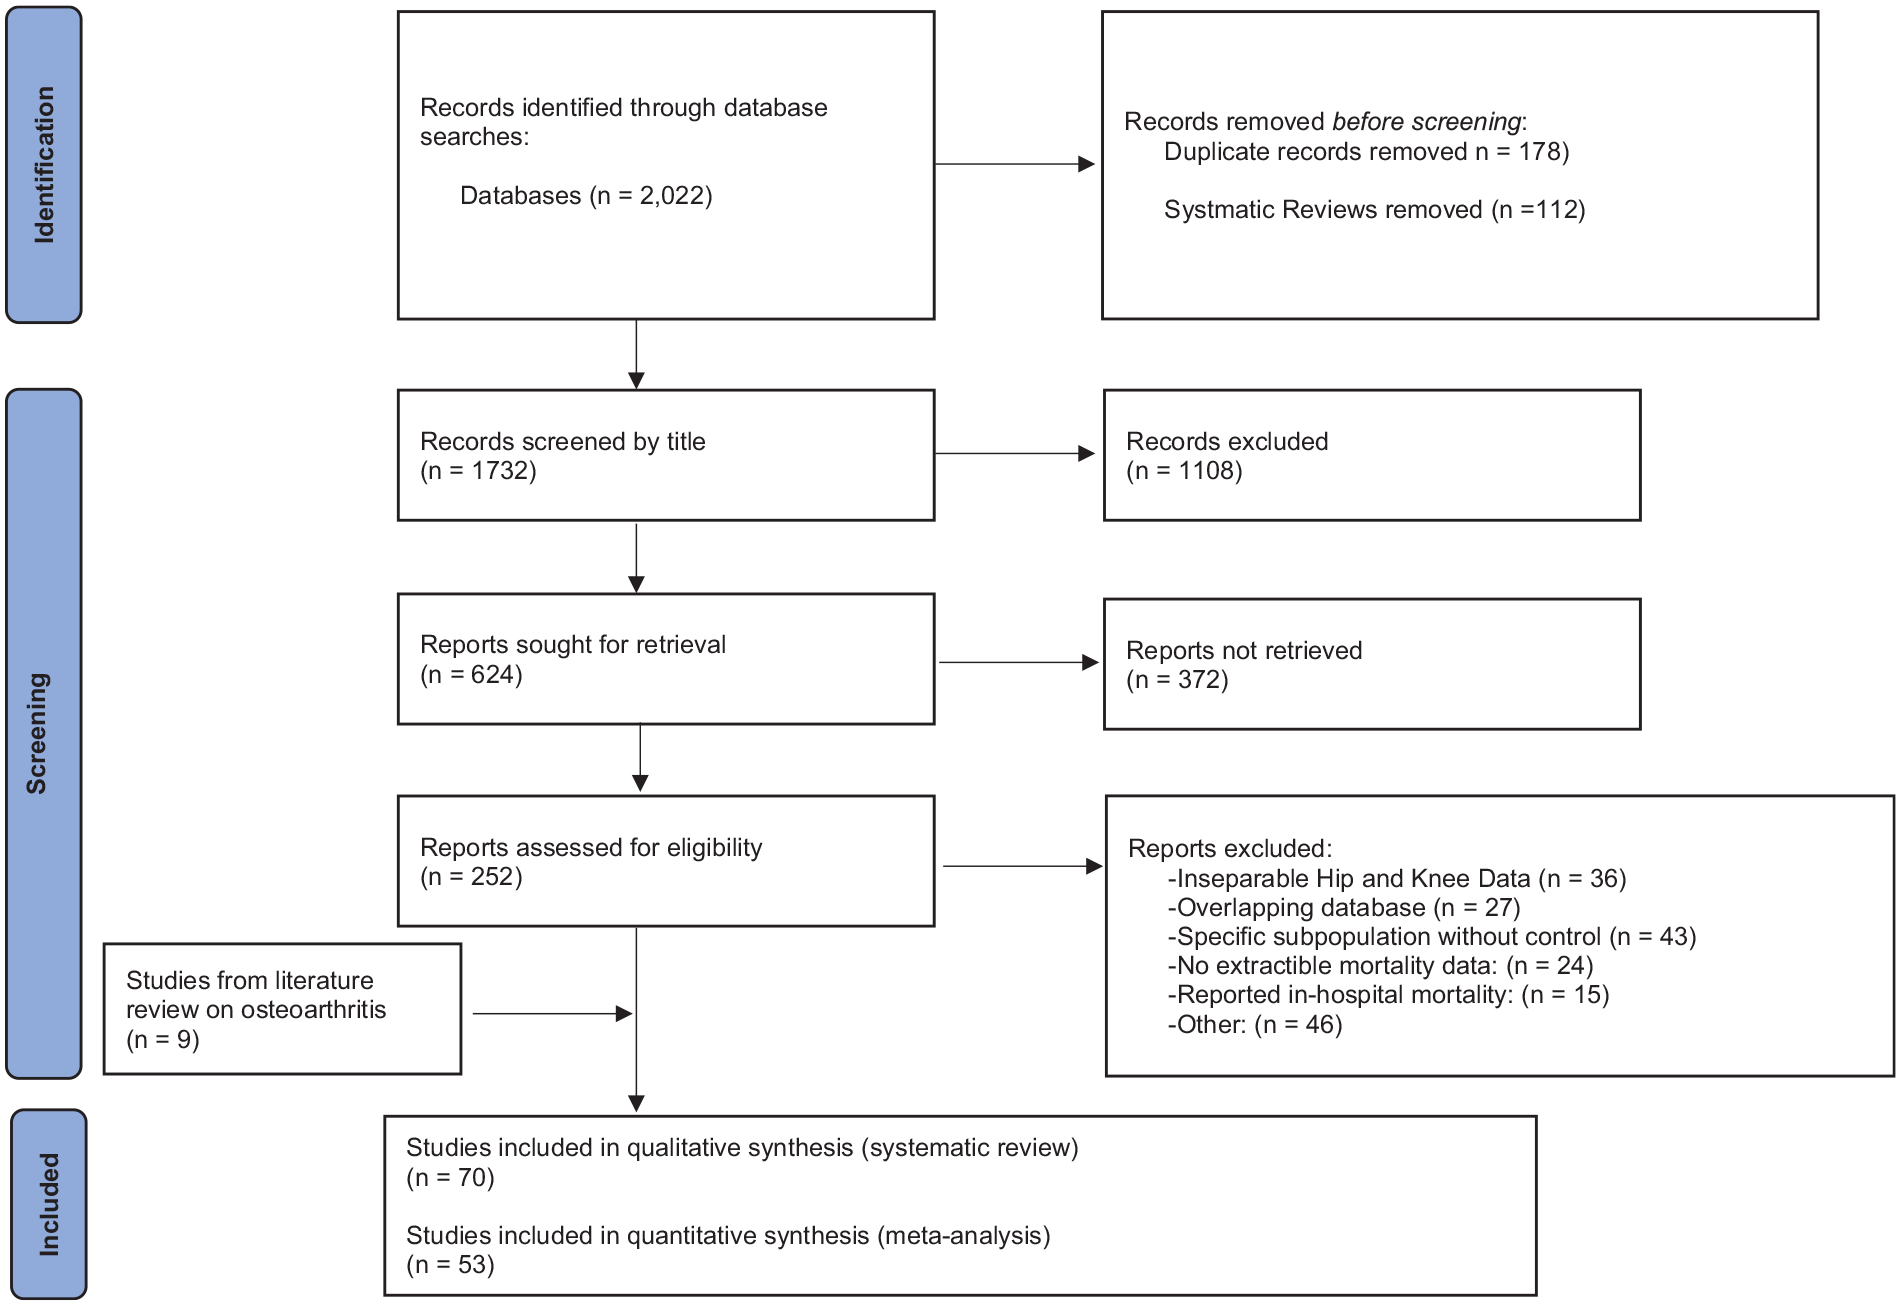
PRISMA- Preferred Reporting Items of Systematic Reviews and Meta-Analysis (PRISMA) chart.
Included studies
53 manuscripts reporting on a total of 3,297,363 patients were included in the quantitative analysis. The studies reported mortality on 18 countries on 4 different continents. Of these, 15 reported the 30-day mortality rates for 827,850 patients (mean age = 65.1 ± 7.1 years) during the period 1997–2016 (Supplemental material: Appendix A, Table A.1); 30 studies reported the 90-day mortality rates for 2,534,641 patients (mean age = 65.8 ± 7.9 years) during the period 1995–2018 (Supplemental material: Appendix A, Table A.2); 18 studies reported the 1-year mortality rates for 997,195 patients (mean age = 65.7 ± 8.3 years) during the period 1995–2018 (Supplemental material: Appendix A, Table A.3); 6 studies reported 5-year mortality rates for 516,084 patients (mean age = 65.7 ± 8.3 years) during the period 1998–2012 (Supplemental material: Appendix A, Table A.4), 12 studies reported 10-year mortality rates for 764,927 patients (mean age = 66.5 ± 8.4 years) during the period 1995–2018 (Supplemental material: Appendix A, Table A.5).
The overall mortality rate among 3,297,363 patients was 3.9%.
30-day mortality
The pooled 30-day mortality rate was 0.49% (95% CI, 0.23–0.84) (Figure 3). Upon meta-regression, age, BMI, and gender were not associated with higher mortality.
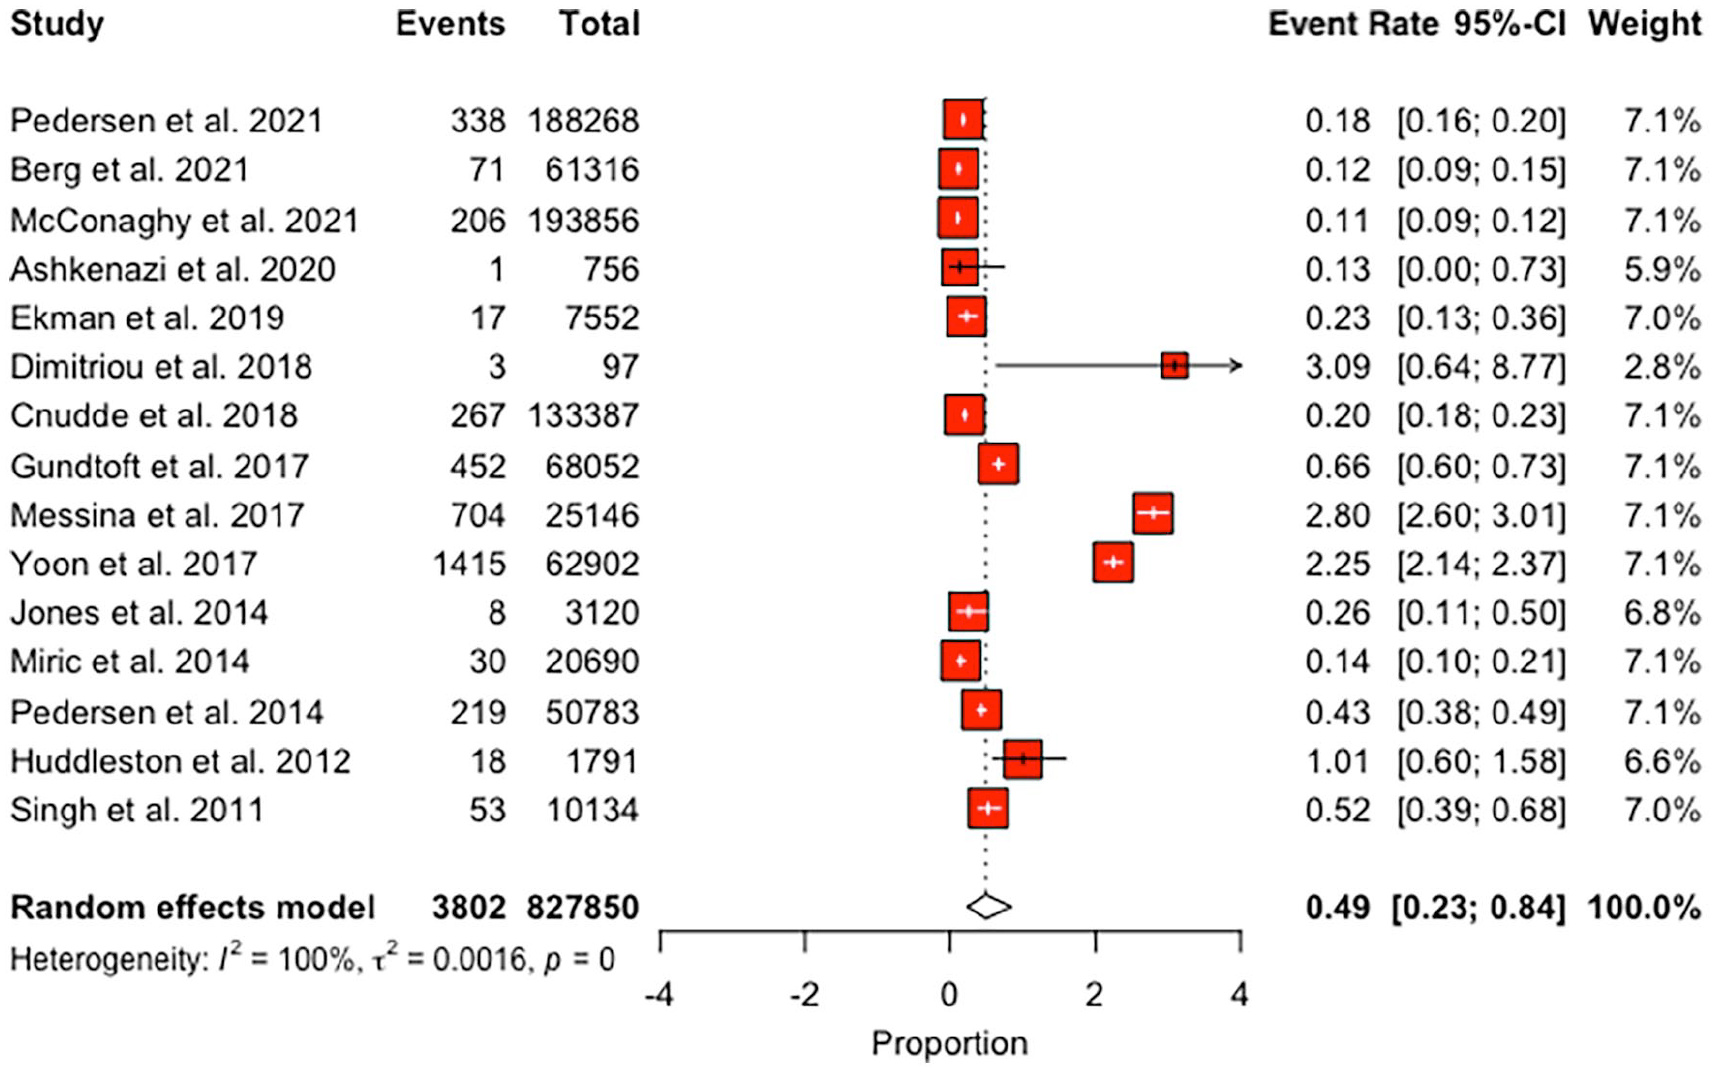
Forest plot for mortality at the 30-day time point.
90-day mortality
The pooled 90-day mortality rate was 0.47% (95% CI, 0.38–0.57) (Figure 4). Upon meta-regression, for every 1-year increment in patient age, the mortality effect size increased by 0.007 (95% CI, 0.002–0.01; p < 0.001) (Figure 5(a)). BMI and gender were not associated with higher mortality.
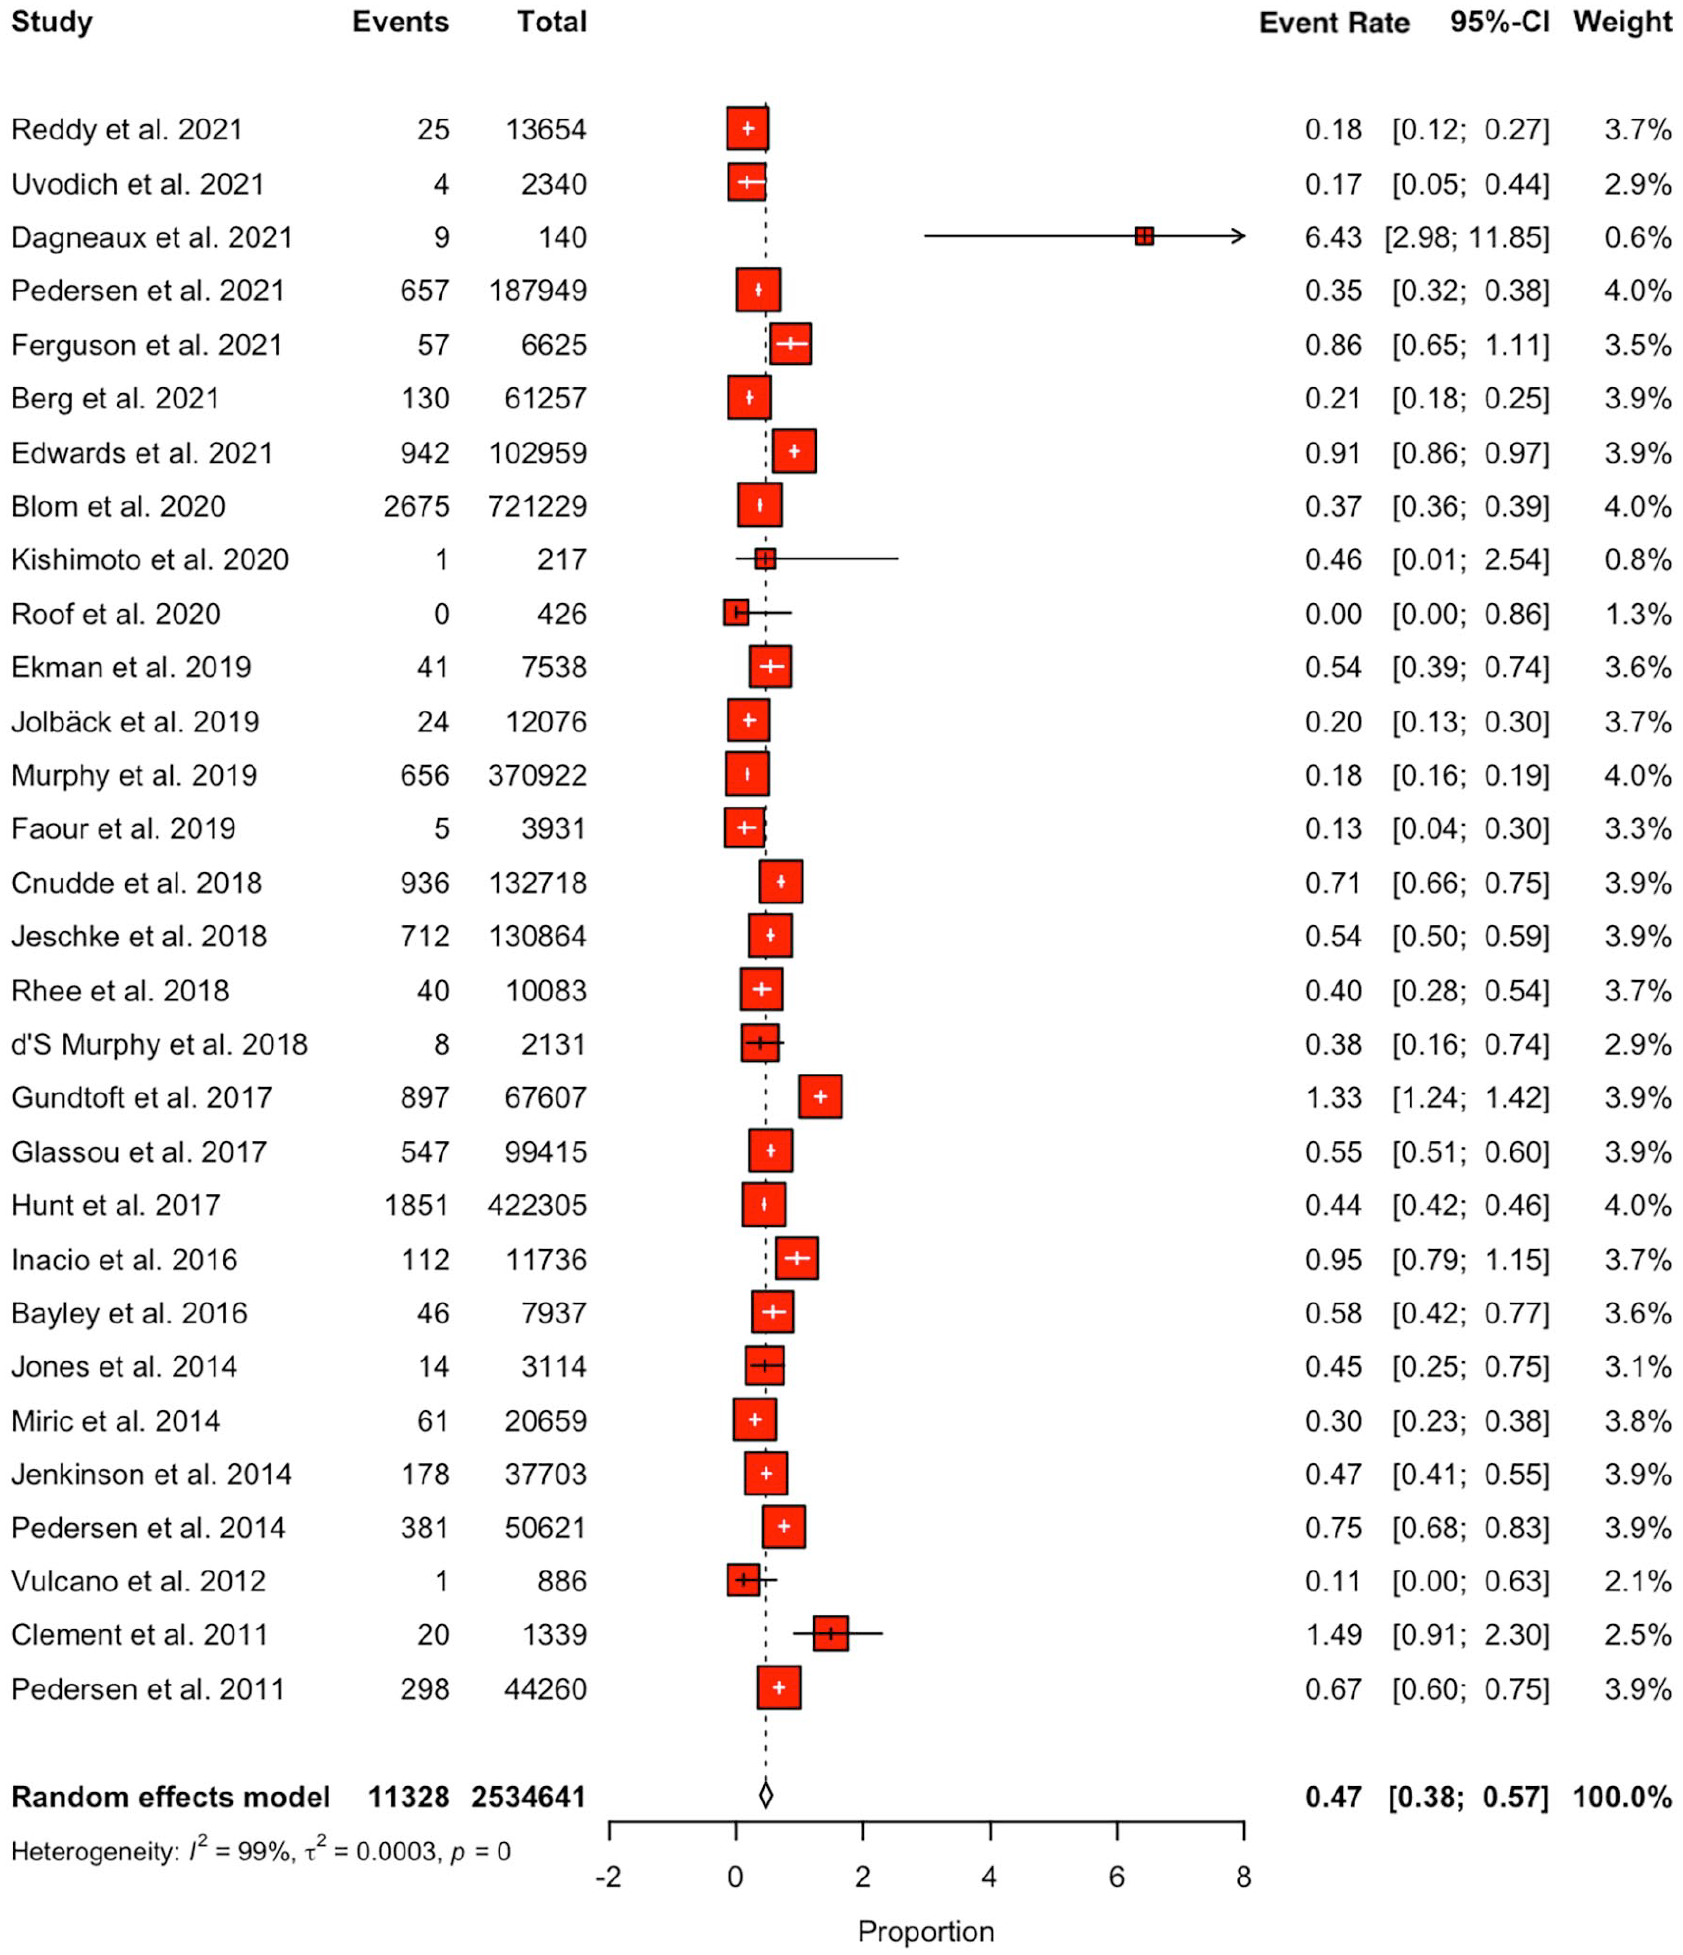
Forest plot for mortality at the 90-day time point.
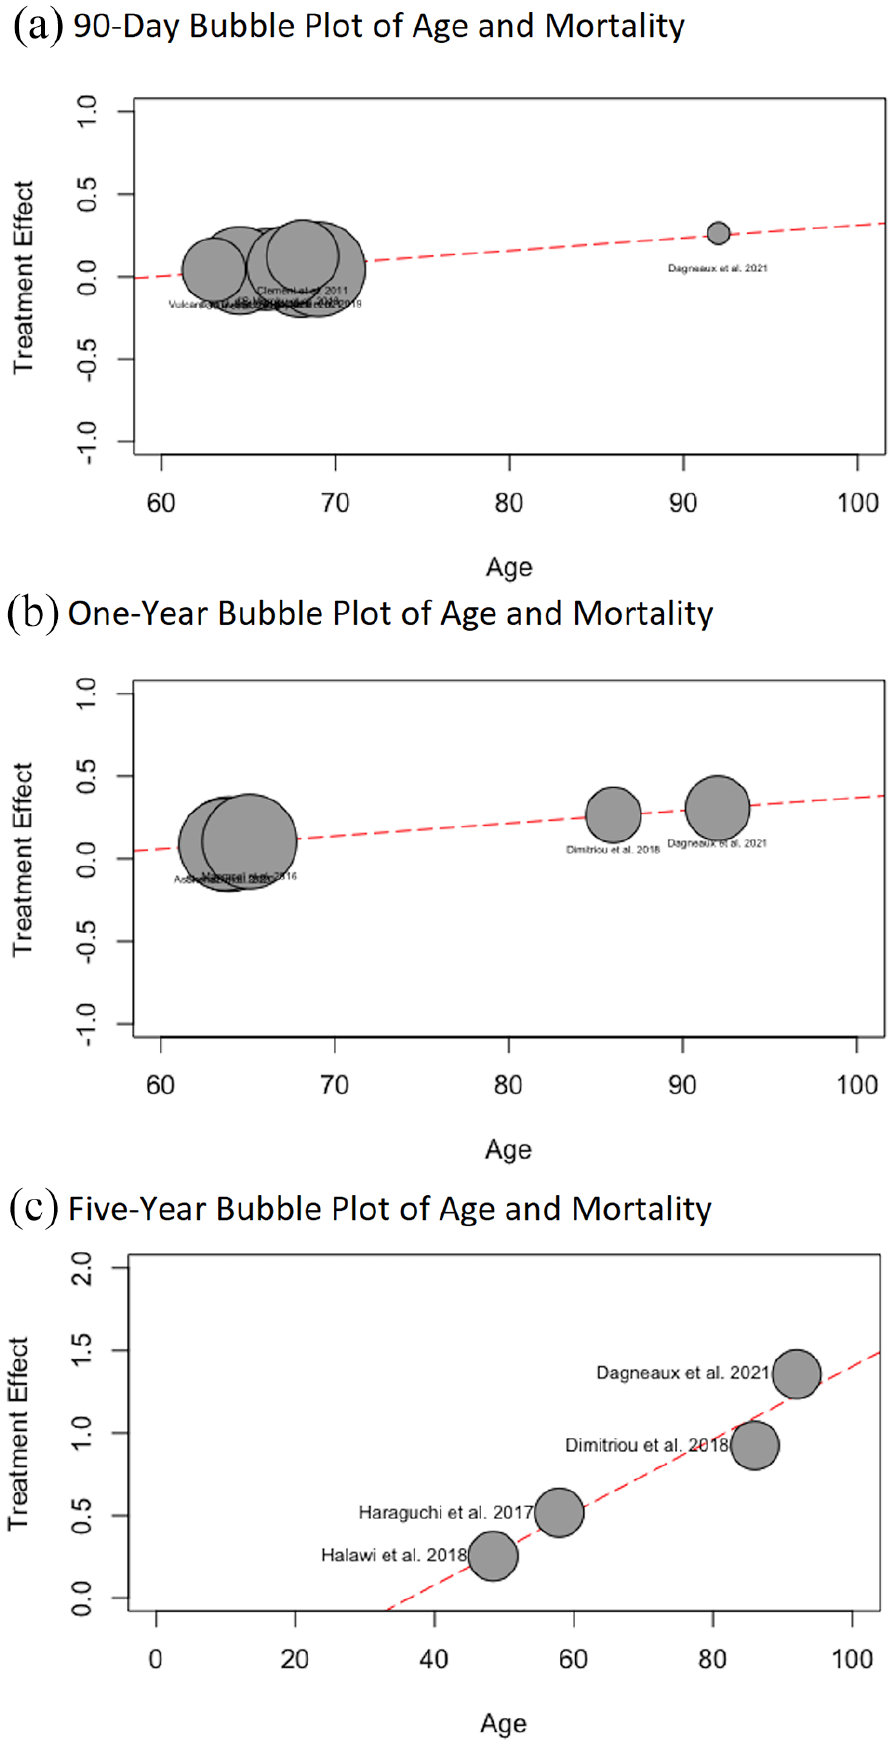
(a) Bubble plot for the 90-day time point in regard to treatment effect for each study on the y-axis and the age on the x-axis. The size of the plotting symbol is inversely proportional to the variance of the estimated treatment effect (i.e., larger size circles indicate less variance), (b) bubble plot for the 1-year time point in regard to treatment effect for each study on the y-axis and the age on the x-axis. The size of the plotting symbol is inversely proportional to the variance of the estimated treatment effect (i.e., larger size circles indicate less variance), and (c) bubble plot for the 5-year time point in regard to treatment effect for each study on the y-axis and the age on the x-axis. The size of the plotting symbol is inversely proportional to the variance of the estimated treatment effect (i.e., larger size circles indicate less variance.
1-year mortality
The pooled 1-year mortality rate was 1.90% (95% CI, 1.22–2.73) (Figure 6(a)). Upon meta-regression, for every 1-year increment in patient age, the mortality effect size increased by 0.008 (95% CI, 0.005–0.01; p < 0.001) (Figure 5(b)). BMI and gender were not associated with higher mortality.
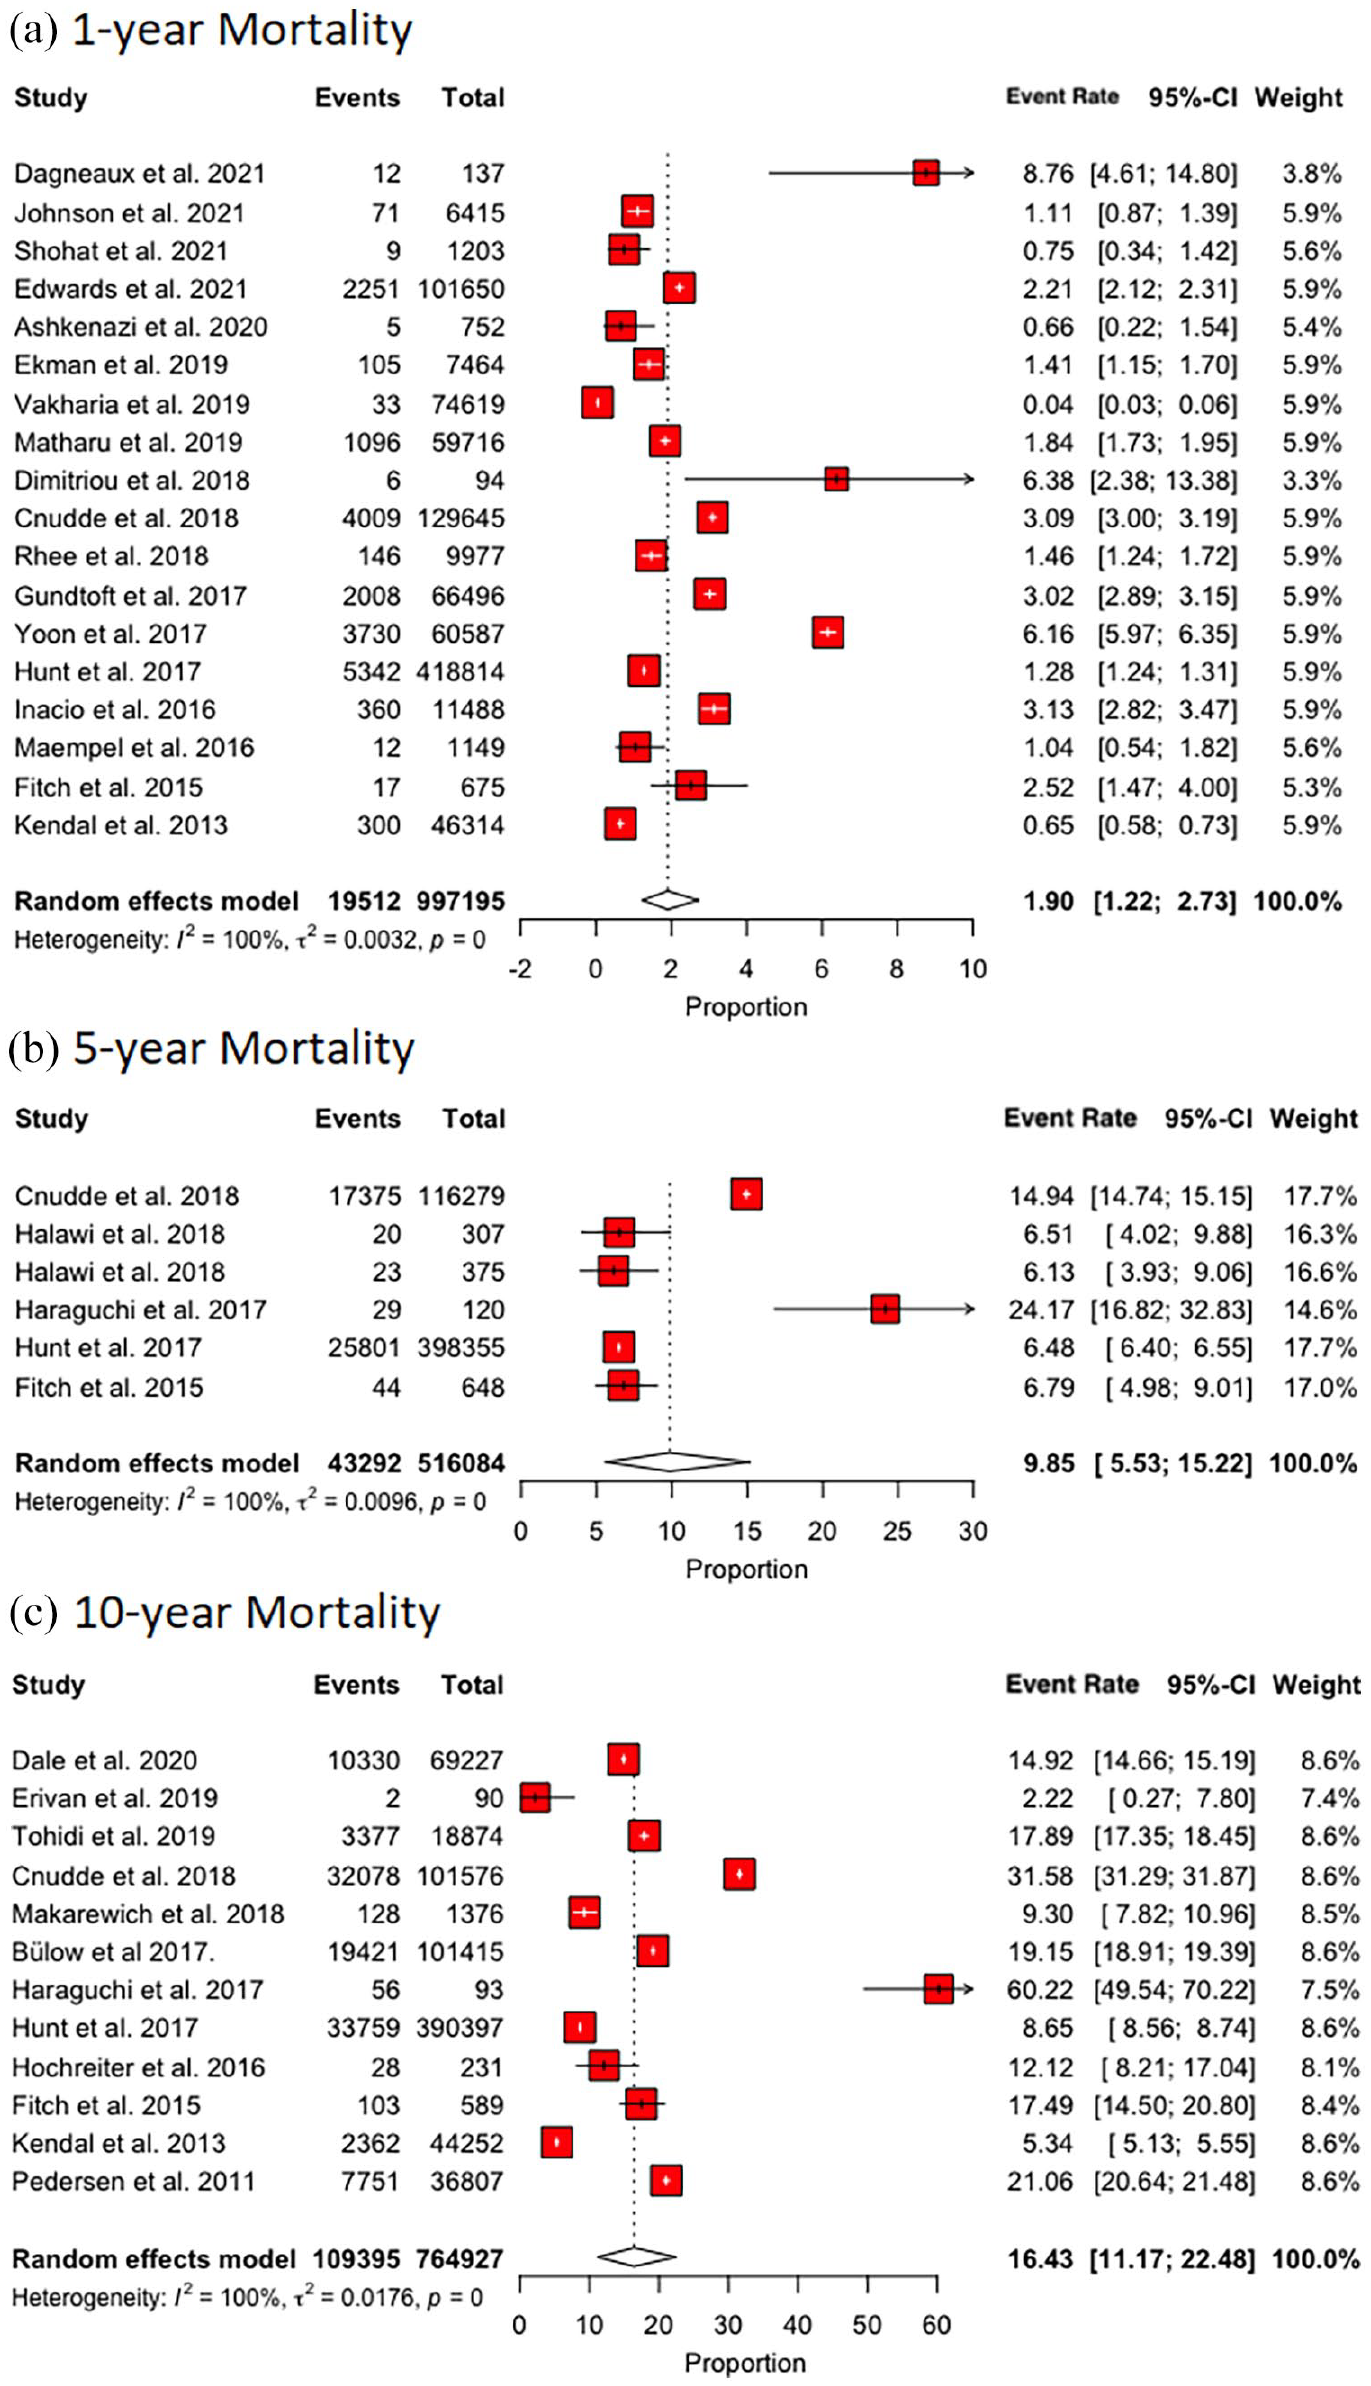
(a) Forest plot for mortality at the 1-year time point, (b) forest plot for mortality at the 5-year time point, and (c) forest plot for mortality at the 10-year time point.
5-year mortality
The pooled 5-year mortality rate was 9.85% (95% CI, 5.53–15.22) (Figure 6(b)). Upon meta-regression, for every 1-year increment in patient age, the mortality effect size increased by 0.02 (95% CI, 0.01–0.03; p < 0.001) (Figure 5(c)). BMI and gender were not associated with higher mortality.
10-year mortality
The pooled 10-year mortality rate was 16.43% (95% CI, 11.17–22.48) (Figure 6(c)). Upon meta-regression, age, BMI, and gender were not associated with higher mortality.
Risk factors for mortality
Among the included studies, 27 examined risk factors and causes of mortality. 7 studies examined the effects of comorbidity indices (e.g., American Society of Anesthesiologists [ASA] classification, Charlson Comorbidity Index [CCI], Elixhauser Risk Scores) and frailty on mortality.12–19 In a prospective cohort, Johnson et al. 12 found that ASA score (hazard ratio [HR] 2.04; 95% CI, 1.55–2.70), CCI [HR = 1.26, 95% CI, 1.15–1.37) and frailty (HR 1.12; 95% CI,1.07–1.17) were associated with higher mortality. 12 McConaghy et al. 13 in a retrospective cohort found increasing mortality rates with increasing ASA score (ASA 1 = 0%, ASA 2 = 0.035%, ASA 3 = 0.174%, and ASA 4 = 1.08%]. These results were collaborated by Dale et al. 14 (ASA 1 = 8%, ASA 2 = 12%, ASA 3 = 29%, ASA 4 = 56%). Messina et al. 15 found a higher risk of mortality in older patients (age 65–74 years, odds ratio [OR] 2.89; 95% CI, 1.19–6.95). Similarly, Bülow et al. 16 suggested that a higher Elixhauser Index was associated with higher mortality (HR 1.5; 95% CI, 1.5–1.5) at 5 years. Glassou et al. 17 reported an increased risk for patients with increasing CCI scores (relative risk [RR] 1.9 [95% CI, 1.6–2.4], 1.9 [95% CI, 1.5–2.5], and 3.3 [95% CI, 2.6–4.2] for low, medium, and high CCI respectively). Inacio et al. 18 reported an increased risk of mortality with increased Elixhauser (OR 1.13; 95% CI, 1.10–1.16) and Charlson (OR 1.42; 95% CI, 1.31–1.55) indices. Hooper et al. 19 reported increasing mortality with increasing ASA score [ASA 1 = 0.12%, ASA 2 = 0.54%, ASA 3 = 2.05, and ASA 4 = 10.06%]. Socioeconomic disadvantage has been associated with higher mortality rates after THA.20–22 Rhee et al. 23 reported increased risk for mortality with blood transfusions (OR 2.6; 95% CI, 1.3–5.3), myocardial infarction (OR 7.9; 95% CI, 2.6–24.3), congestive heart failure (OR 4.1; 95% CI, 1.7–10.0–, dementia (OR 4.4; 95% CI, 1.1–17.5), and metastatic disease (OR 34.4; 95% CI, 9.4–126.1].
Obesity has been associated with mixed results in regard to mortality after THA.
In a retrospective cohort, Tohidi et al. 24 reported an increased risk (RR 1.38 [95% CI, 1.18–1.62]) for mortality in patients with a BMI > 45 kg/m2 when compared to patients with a BMI < 45 kg/m2. Similarly, Huddleston et al. 25 reported an increased risk of mortality in obese patients (OR 1.20; 95% CI, 1.02–1.42). Jeschke et al. 26 reported an increased risk of mortality (OR 1.8; 95% CI, 1.3–2.6) in patients with BMI > 40 kg/m2 when compared to patients with BMI < 30 kg/m2. In a retrospective cohort, Woo et al. 27 found an increased association between mortality and obesity (HR 2.023; 95% CI, 1.008–4.059]. In contrast, Halawi et al. 28 reported a univariate relationship between lower BMI and mortality (p = 0.006). This finding was collaborated by Bülow et al. 16 in a retrospective cohort, who reported a HR of 0.7 (95% CI, 0.5–0.9) between obesity and mortality between 0 and 5 years. Lastly, Büchele et al. 29 found no relationship between BMI and mortality with a HR of 1.06 (95% CI, 0.96–1.17). Jeschke et al. 26 similarly found no relationship between BMI and mortality with BMI 30–34 kg/m2 having an OR of 0.9 (95% CI, 0.6–1.2) and BMI 35–39 kg/m2 having an OR of 1.0 (95% CI, 0.7–1.4) when compared to patients with a BMI < 30 kg/m2.
Smoking has been commonly associated with higher rates of death among THA patients. Büchele et al. 29 found smoking to be a risk factor for mortality with smokers having a HR of 1.56 (95% CI, 1.12–2.17) when compared to non-smokers. This was collaborated by Matharu et al. 30 with non-smokers having a mortality HR of 0.37 (95% CI, 0.29–0.49] when compared to smokers.
In addition, increasing patient age was reported to be a risk factor for short- and long-term mortality.13,14,23,31 In a retrospective cohort, Rhee et al. 23 found a OR of 9.3 (95% CI, 2.0–43.3) in patients >80 years when compared to those <60 years. McConaghy et al. 13 supported this with mortality rates of 0.352%, 0.071%, 0.052% for patients between 80–89, 60–69 and 50–59 years old respectively.
Preoperative anaemia was determined to be a risk factor for mortality with mild anaemia (e.g., haematocrit between 27 and 36%) associated with 2.06 (95% CI, 1.45–2.93) higher odds of death when compared to patients without anaemia in a retrospective cohort by Grosso et al. 32
3 studies reported that higher surgeon and hospital THA volume were associated with lower mortality rates at 30 days, 90 days and 1 year after THA.33–35
Causes of mortality following THA
The most commonly reported causes of death during the perioperative period (e.g., within 90 days after THA) were myocardial infarction/ischaemic heart disease, vascular complications, pulmonary disease, multiorgan failure, malignancy, cerebrovascular disease, and gastrointestinal diseases.36–39 Hunt et al., 37 found an standardised mortality ratio (SMR) of 0.61 (95% CI, 0.60–0.62) in the first 10 years postoperatively. In regard to the temporal mortality rates after THA, they found an SMR of 0.66 (95% CI, 0.63–0.69) in the perioperative period (e.g., within 90 days) and an SMR of 0.42 (95% CI, 0.41–0.44) in the first year after the operation.
Discussion
The present study is the first meta-analysis to report long-term mortality estimates for patients up to 10 years after primary THA. Our pooled analysis of 53 studies with mortality data from 18 countries and up to 3.2 million patients found that the estimated mortality rate was 0.49% at 30 days, 0.47% at 90 days, 1.90% at 1 year, 9.85% at 5 years, and 16.43% at 10 years. Upon meta-regression, age but not BMI or gender, was associated with increased treatment effect size. The most common causes of death at all time points were due to myocardial infarctions/ischaemic heart disease, malignancy, cerebrovascular disease, gastrointestinal diseases, pulmonary disease, and multi-organ failure. Various factors such as smoking, increasing age, higher comorbidity burden, higher socioeconomic disadvantage, preoperative anaemia, and low hospital and surgeon THA volume were consistently associated with increasing risk of mortality. However, mixed effects were observed concerning the impact of BMI on the risk of death after THA.
Overall, a low risk of mortality during the perioperative period (30 day mortality rate 0.49%) was observed. Similar to our findings, a previous meta-analysis by Berstock et al. 10 estimated mortality rates of 0.30% at 30 days and 0.65% at 90 days after THA. Interestingly, we found a slightly higher mortality rate at 30 days followed by a consequent decrease at 90 days, which has not been reported before. Our 30-day mortality data was derived from 15 studies conducted across numerous countries worldwide, of which 6 had a median data year ⩾2010. In comparison, Berstock et al. 10 did not include studies in their analysis with a median data year ⩾2010 and had a different geographic coverage (sourcing data from US, UK, Finland, Norway, and Australia only). Furthermore, we suspect that the contemporary adoption of fast-track and enhanced recovery protocols, improved surgical approaches, 40 and patient optimisation for surgery may explain the decrease in 90-day mortality rates. 41
It is important to identify and address modifiable risk factors to optimise patient care and enhance outcomes in THA. While elevated BMI has been commonly associated with the risk of complications following THA, we did not observe any associations between BMI and the risk of death in our meta-regression analysis. However, there is no consensus in the literature regarding BMI and mortality, with most studies reporting conflicting results. As the number of obese and morbidly obese patients undergoing THA continues to increase along with continuing rates of infections and mortality, the burden on the healthcare system remains elevated. 42 Future studies are needed to elucidate modifiable risk factors associated with mortality among THA patients.
We conducted a separate literature review to summarise expected long-term survival for patients with symptomatic hip osteoarthritis (OA) and compare them with our estimated 10-year mortality rates for THA patients (Supplemental material: Appendix B, Table B.1). 7 out of the 9 examined studies found symptomatic hip OA was associated with higher odds of mortality compared to the general population. Higher mortality rates among patients with hip OA may be explained by decreased mobility and frequency of exercise, which then can lead to worsening or development of hypertension, obesity, diabetes, and cardiovascular disease.43–45 We reported a 10-year mortality rate of 16.43% for THA patients, when compared qualitatively to symptomatic hip OA patients by Turkiewicz et al. 46 (27.6%), Veronese et al. 47 (23.9%), Cacciatore et al. 48 (55.8%), and Cleveland et al. 49 (30.9%). Poor mobility has been commonly associated with worse cardiovascular health. 45 Therefore, the higher mortality observed among osteoarthritic patients suggests that THA could have a protective effect on mortality due to associated improvements in mobility and quality of life,1,2 or may potentially be due to an underlying selection bias for healthy candidates. 50
The present study should be interpreted in context with its limitations. The heterogeneity in our data was high, likely due to the inclusion of international studies. While in our pooled analysis, the mortality rates for 30-day, 90-day, and 1-year periods were mostly homogenous, there was significant variability among studies at 5 and 10 years. Another limitation is that despite the overall risk of bias assessment for the included studies being low overall, individual patient population representation may be limited due to the retrospective design of most studies. Nevertheless, the average effect of this phenomenon was likely to be compensated for through the pooled data meta-analysis and the extensive sample size. However, even with our limitations, we believe we have ascertained and presented the THA postoperative mortality rates up to 10 years after the index surgery which could be utilised as a reference for physicians and patients alike.
Conclusion
Overall pooled 30-day, 90-day, 1-year, 5-year, and 10-year mortality rates after THA were 0.49%, 0.47%, 1.90%, 9.85, and 16.43% respectively. The postoperative risk of mortality after primary elective THA remains low worldwide and has continued to decrease. Compared to symptomatic hip-osteoarthritis patients reported in literature, THA patients exhibited lower mortality rates, which may support the value of THA. As expected, age, but not BMI or gender was significantly associated with treatment effect size, with older age partially explaining higher mortality rates.
Supplemental Material
sj-pdf-1-hpi-10.1177_11207000231151235 – Supplemental material for 30-day to 10-year mortality rates following total hip arthroplasty: a meta-analysis of the last decade (2011–2021)
Supplemental material, sj-pdf-1-hpi-10.1177_11207000231151235 for 30-day to 10-year mortality rates following total hip arthroplasty: a meta-analysis of the last decade (2011–2021) by Oguz Turan, Xuankang Pan, Kyle N Kunze, Pedro J Rullan, Ahmed K Emara, Robert M Molloy and Nicolas S Piuzzi in HIP International
Supplemental Material
sj-pdf-2-hpi-10.1177_11207000231151235 – Supplemental material for 30-day to 10-year mortality rates following total hip arthroplasty: a meta-analysis of the last decade (2011–2021)
Supplemental material, sj-pdf-2-hpi-10.1177_11207000231151235 for 30-day to 10-year mortality rates following total hip arthroplasty: a meta-analysis of the last decade (2011–2021) by Oguz Turan, Xuankang Pan, Kyle N Kunze, Pedro J Rullan, Ahmed K Emara, Robert M Molloy and Nicolas S Piuzzi in HIP International
Footnotes
Declaration of conflicting interests
The author(s) declared the following potential conflicts of interest with respect to the research, authorship, and/or publication of this article: RM: paid speaker at Stryker; paid consultant at Stryker; Research support from: Stryker, Zimmer.
NS: paid consultant for Stryker; Research support from: RegenLab, Zimmer, Signature Orthopaedics, Osteal Therapeutics.
All other authors declare that there is no conflict of interest.
Funding
The author(s) received no financial support for the research, authorship, and/or publication of this article.
Supplemental material
Supplemental material for this article is available online.
References
Supplementary Material
Please find the following supplemental material available below.
For Open Access articles published under a Creative Commons License, all supplemental material carries the same license as the article it is associated with.
For non-Open Access articles published, all supplemental material carries a non-exclusive license, and permission requests for re-use of supplemental material or any part of supplemental material shall be sent directly to the copyright owner as specified in the copyright notice associated with the article.