
Abstract
Background/Objective:
Advice given to patients on driving resumption after total hip arthroplasty (THA) is inconsistent. Due to a lack of clear guidelines, surgeons’ recommendations range between 4–8 weeks after surgery to resume driving. Delays in driving return can have detrimental social and economic impact. However, it is important to ensure patients only resume driving once safe. This study presents a systematic review and meta-analysis of driving simulation studies after THA to establish when patients can safely return to driving postoperatively.
Methods:
A systematic review and meta-analysis using PRISMA guidelines was undertaken. Titles and abstracts were screened for inclusion, data was extracted, and studies assessed for bias risk. Review Manager, was used for statistical analysis. Values for brake reaction time (BRT) were included for meta-analysis.
Results:
14 articles met the inclusion criteria. Of these, 7 measured BRT and were included in the meta-analysis. Pooled means of both right and left THA showed BRT around or above preoperative baseline at 1 week, 2 weeks and 3 weeks, and below baseline at 6 weeks, 12 weeks, 32 weeks and 52 weeks. Of these, the pooled means at 6, 32, and 52 weeks were significant (p < 0.05).
Studies not meeting meta-analysis inclusion criteria were included in a qualitative analysis, examining self-reported postoperative driving return times which ranged from 6 days to over a year or in rare cases, never. Majority of patients (n = 960) self-reported driving return within approximately 6 weeks (pooling of mean values 32.9 days).
Conclusions:
The mean return to driving time recommended in the literature was 4.5 weeks. Based upon BRT meta-analysis, a return to baseline braking performance was noted at 6 weeks postoperatively. However, driving is a complex skill, and patient recommendation should be individualised based on factors such as vehicle transmission type, THA technique, surgical side, medication and comorbidities.
Introduction
Total hip arthroplasty (THA) is a widely performed procedure. According to the CDC’s National Center for Health Statistics, a total of 326,100 hip replacements were performed in the US in 2010. 1 Furthermore, the rate of THAs was observed to significantly increase for each age group between 2000 and 2010 and with the demographic trend of an aging Western society, this increased demand is expected to continue in the coming years. 1
Current data on return to driving post-THA is dis-persed and conflicting.2–4 Studies vary significantly in the recommendations made and outcomes analysed. Some suggest that patients are ready to drive as early as 2 days after surgery while others recommend waiting at least 6 weeks.5–7 They also range from examining changes in brake response time to inspecting self-reported return to driving time.5,8,9 The American Medical Association recommends that individuals should not drive for at least 4 weeks following a right THA. 10 In contrast, the American Academy of Orthopaedic Surgeons generalises that patients should wait until they are no longer taking opioid pain medications and their strength and reflexes have returned to a normal state. 11 Both of these differ from the driver fitness medical guidelines published by the American Association of Motor Vehicle Administrators in 2009. In the publication, AAMVA examines primary literature on the topic and assesses recovery rate, return to function and improvement in driving reaction time following hip surgery. 12 They determine that the evidence is too inconclusive to suggest a specific driver licensing action. 12
In order to drive safely, an individual must be able to brake in an emergency situation, within an optimum time and using an appropriate force. Therefore, many studies have evaluated patients’ driving abilities post-THA by comparing postoperative and preoperative brake response times.5–7 BRTs are measured using driving simulators and represent the total time required to press the brake pedal upon the presentation of a stimulus. Some researchers have taken a different approach and inquired about post-THA driving practices via a questionnaire.8,9 By measuring variables such as confidence in driving and number of automobile accidents experienced at various time points postoperatively, they determined when patients should return to driving. Furthermore, the American Occupational Therapy Association (AOTA) recommends a comprehensive clinical evaluation of a patient’s driving abilities that includes a driving simulation; however, this is not the current standard of care nor feasible at all orthopaedic practices. 13
In recent years, there has been an increase in the use of minimally invasive techniques when performing THAs, 2 which not only reduce the size of the incision but also the damage of muscle tissue. Advances in pain management and early mobilisation have also accelerated the patient rehabilitation process. With such improvements, it is possible that patients may now be able to return to driving sooner than before. Additionally, the findings of previous systematic reviews and meta-analyses are variable.14–16 Therefore, a thorough examination of the new literature in the field and an update to previous meta-analyses and reviews is required in order to gain a better understanding of when patients can return to driving.5,8,9,14–19
The purpose of this study was to provide an up-to-date systematic review and meta-analysis of published evidence on when patients return to driving post THA; BRT evidence and subsequent recommendations on return to driving, braking performance following THA as measured by BRT, and recommended return to driving.
Methods
Search strategy and criteria
The protocol for this systematic review and meta-analysis was created prior to data extraction and based on the Preferred Reporting Items for Systematic reviews and Meta-Analysis (PRISMA) guidelines. 20 A list of keywords and MeSH terms was compiled based upon a review of relevant papers and PubMed searching. Medline, EMBASE, and Cochrane Central Register of Controlled Trials (CENTRAL) databases were searched according to the strategies detailed in Appendix 1.
Study selection
Inclusion criteria were established following the Population Intervention Comparison Outcomes (PICO) approach: Population: Adults (over 18) undergoing hip arthroplasty who were able to drive (in possession of a driver’s license). Intervention: Total hip arthroplasty. Comparator: preoperative baseline or control cohort. Outcomes: The primary outcome measured was the total brake response time. Secondary outcomes were reaction time (RT), movement time (MT), and braking force (BF).
All studies published prior to 1 July 2020 inclusive were considered for eligibility. No language restrictions were applied. Titles and abstracts were screened for relevance prior to full inspection. The references of all included studies were reviewed to locate any articles that may have been missed in the database search. Duplicate articles between the databases were removed and the full texts of all studies meeting the inclusion criteria were obtained.
Data collection
Data was extracted and collated using a standardised spreadsheet. The following data were recorded: (1) demographics: age, gender, laterality of procedure, and use of analgesia; (2) study characteristics: study design, THA technique(s) utilised, number of subjects, outcomes, simulator design (manufacturer), and testing intervals.
Assessment of methodological quality
Articles selected for the meta-analysis were critically appraised and examined for bias using the Critical Appraisal Skills Programme (CASP) checklist. 21 Each study was graded for low, medium or high risk for bias.
Methodological quality of the included studies was assessed using the Methodological Index for Non-Randomized Studies (MINORS) index. 22 The MINORS index produces a score between 0–24 with a score of 0 (not reported), 1 (reported but inadequate) or 2 (reported and adequate) being given for 12 separate factors. 22 The score is designed to assess the methodological quality of non-randomised surgical studies, whether comparative or non-comparative: the ideal score being 16 for non-comparative studies and 24 for comparative studies. 22 The level of evidence was graded using the OCEBM scale for levels of evidence. 23
The overall quality of the evidence in the meta-analyses was assessed using the Grading of Recommendations, Assessment, Development and Evaluation (GRADE) system. 24 Recommendations were classified as either High, Moderate, Low, or Very Low (High = we are very confident that the effect in the study reflects the actual effect, Moderate = we are quite confident that the effect in the study is close to the true effect, but it is also possible it is substantially different, Low = the true effect may differ significantly from the estimate, Very Low = the true effect is likely to differ significantly from the estimate). This approach involved grading the evidence based on criteria for study design, quality, inconsistency, directness, imprecision, and publication bias as listed below:
Study design: Randomised trial = high (2), Observational study = low (1), Any other evidence = very low (0)
Study quality: Based on lowest MINORS score across included studies where high (3) = >12, moderate (2) = 9–12, low (1) = 5–8, very low (0) = <5
Inconsistency: Inconsistency of results assessment based on I2 value (downgraded if I2 > 50% indicating high heterogeneity; and there was no plausible explanation to explain the inconsistency of results)
Indirectness: Indirectness of results (no downgrade (−1) applied as all studies measured BRT using a simulator setup)
Imprecision: Imprecision of results (downgrade (−1) applied if 95% CI does not exclude baseline e.g. −ve value to +ve value)
Publication bias: Publication bias was assumed to be suspected (−1) owing to the majority of studies being small. None of the studies were blinded and most studies did not compare to an unaffected cohort.
Statistical analysis
A meta-analysis was conducted using the statistical software Review Manager Version 5.4 (Cochrane, London, UK). The standard mean difference between preoperative and postoperative BRTs was examined at postoperative time points from 1 to 52 weeks, taking into account procedure laterality. Due to a lack of pre-operative values for right THA in Neumann et al., 25 the postoperative BRT was compared to the control group in the statistical analysis. Where standard deviations (SDs) were not provided in the published manuscript,5,26 the methods described in the Cochrane Handbook were used to calculate them based upon the provided standard errors and p-values. 27 MacDonald and Owen 26 had 1 subject undergo a bilateral THA, therefore, 1 was added to the number of people undergoing right THA and left THA to obtain the n-values. 26
Due to differences in study populations, methodology and outcome measures, heterogeneity amongst studies was considered likely and as such, a random-effects model was used. The consistency of results across the pooled studies was estimated using the I2 statistic. I2 values represent the percentage of variation in our meta-analysis caused by heterogeneity rather than by chance and were interpreted as follows: <30% = low heterogeneity and >75% = high heterogeneity. In all analyses, a p < 0.05 was considered statistically significant.
Results
Search results
The PRISMA flowchart is shown in Figure 1. 22 Medline articles were narrowed to nine, 22 EMBASE articles were narrowed to 11, and 34 CENTRAL articles were narrowed to one upon a title and abstract screen for relevance. Review of the references yielded 11 studies. One of these was excluded upon a title and abstract screen. The removal of duplicates between the databases resulted in a total of 22 articles. The full texts of all 22 studies meeting the inclusion criteria were obtained. The articles were further categorised into 15 primary literature articles and 7 reviews and meta-analyses. 8 studies met the inclusion criteria for meta-analysis, however one was excluded because the results did not provide sufficient statistical information to calculate or estimate SD. 28
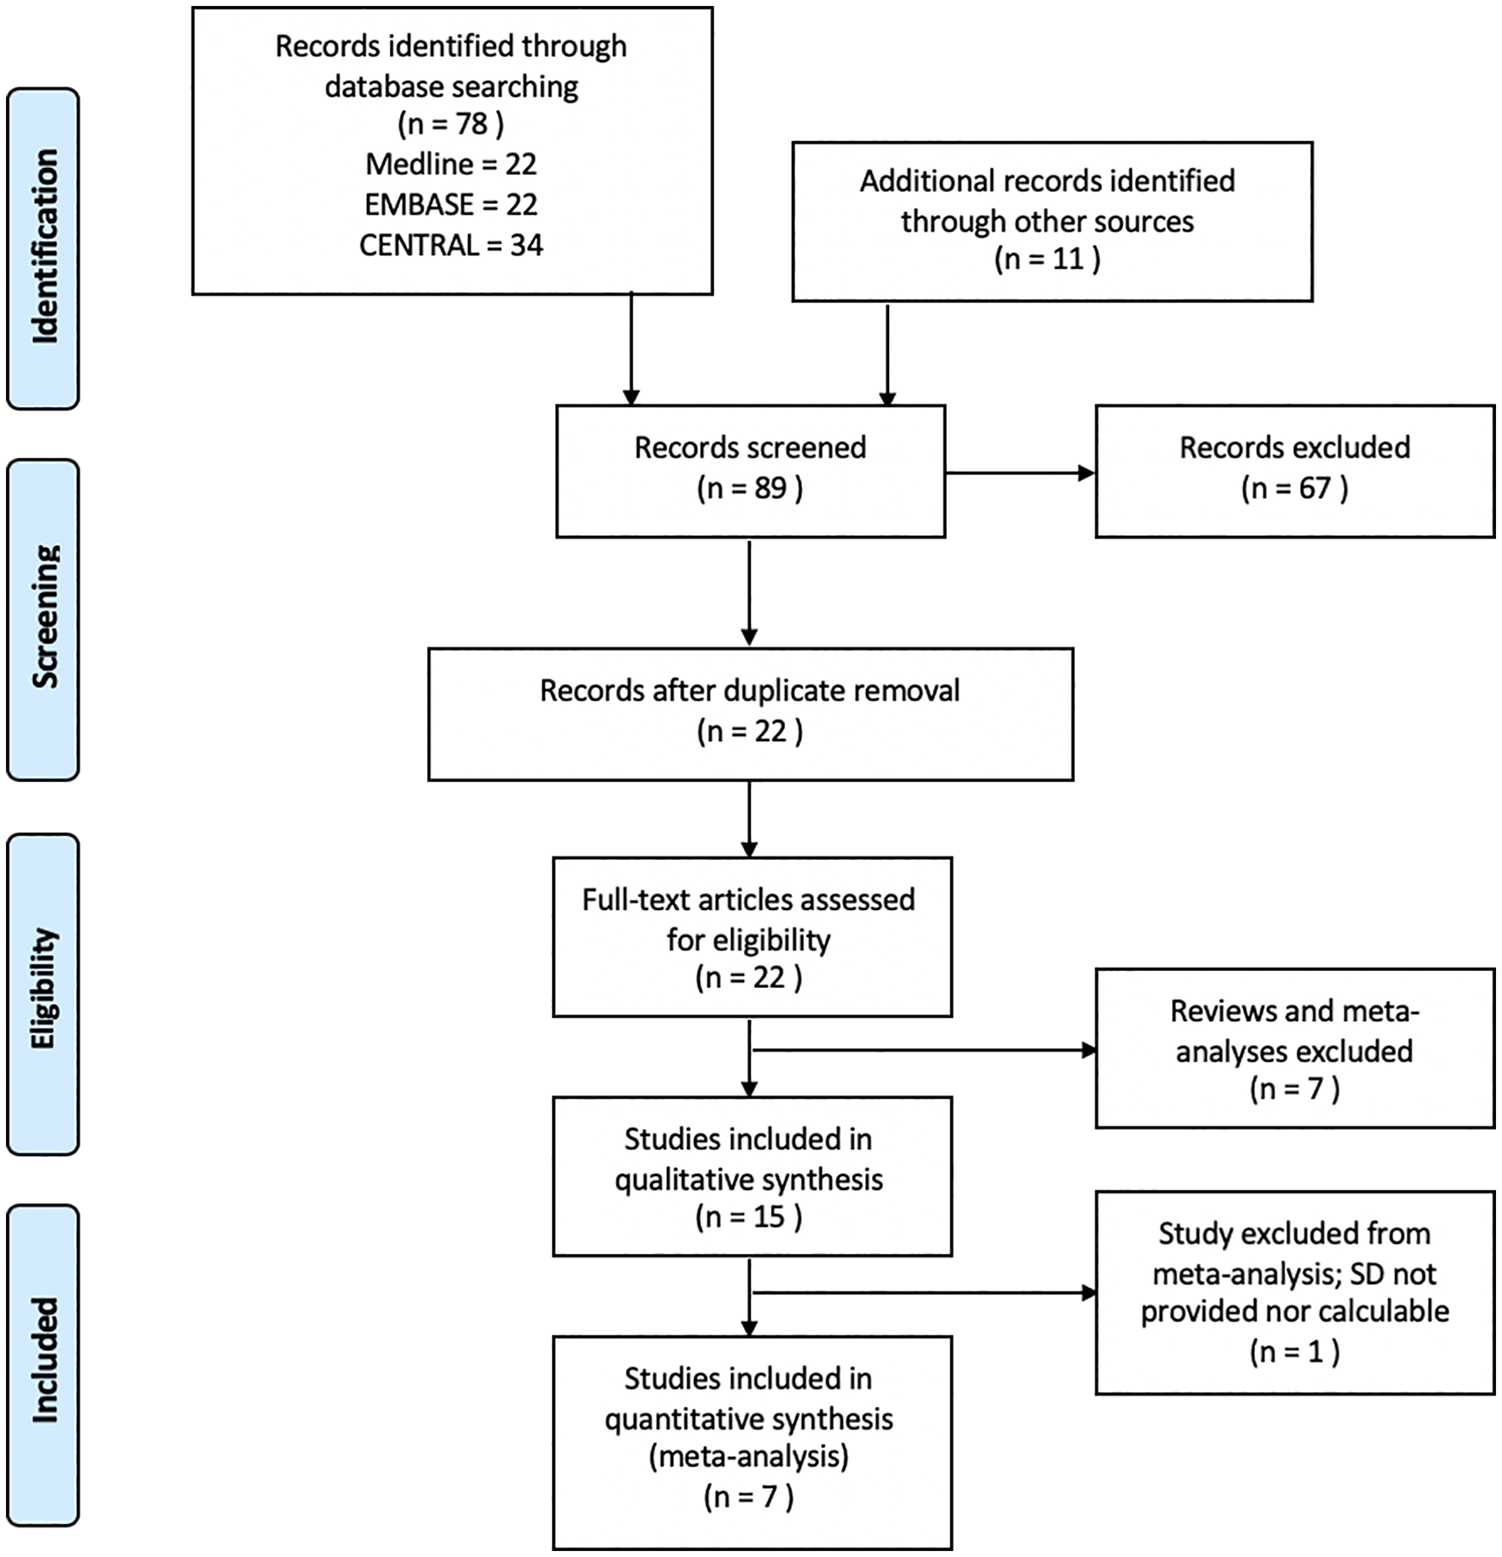
Preferred reporting items for systematic reviews and meta-analyses flowchart.
Table 1 gives an overview of the studies included in the systematic review. Of the 15 studies included in the qualitative analysis, 12 were prospective cohorts,2,5,13,25,26,28,29 two were retrospective cohorts,3,30 and 1 was a randomised control trial. 4 Overall, the studies included 2423 participants with 1738 participants remaining after accounting for participant dropout and loss to follow-up. The mean participant age in the studies ranged from 53 to 70.5 years old and the mean follow-up time ranged from 1–2 days to 52 weeks postoperatively.
Characteristics of included studies.
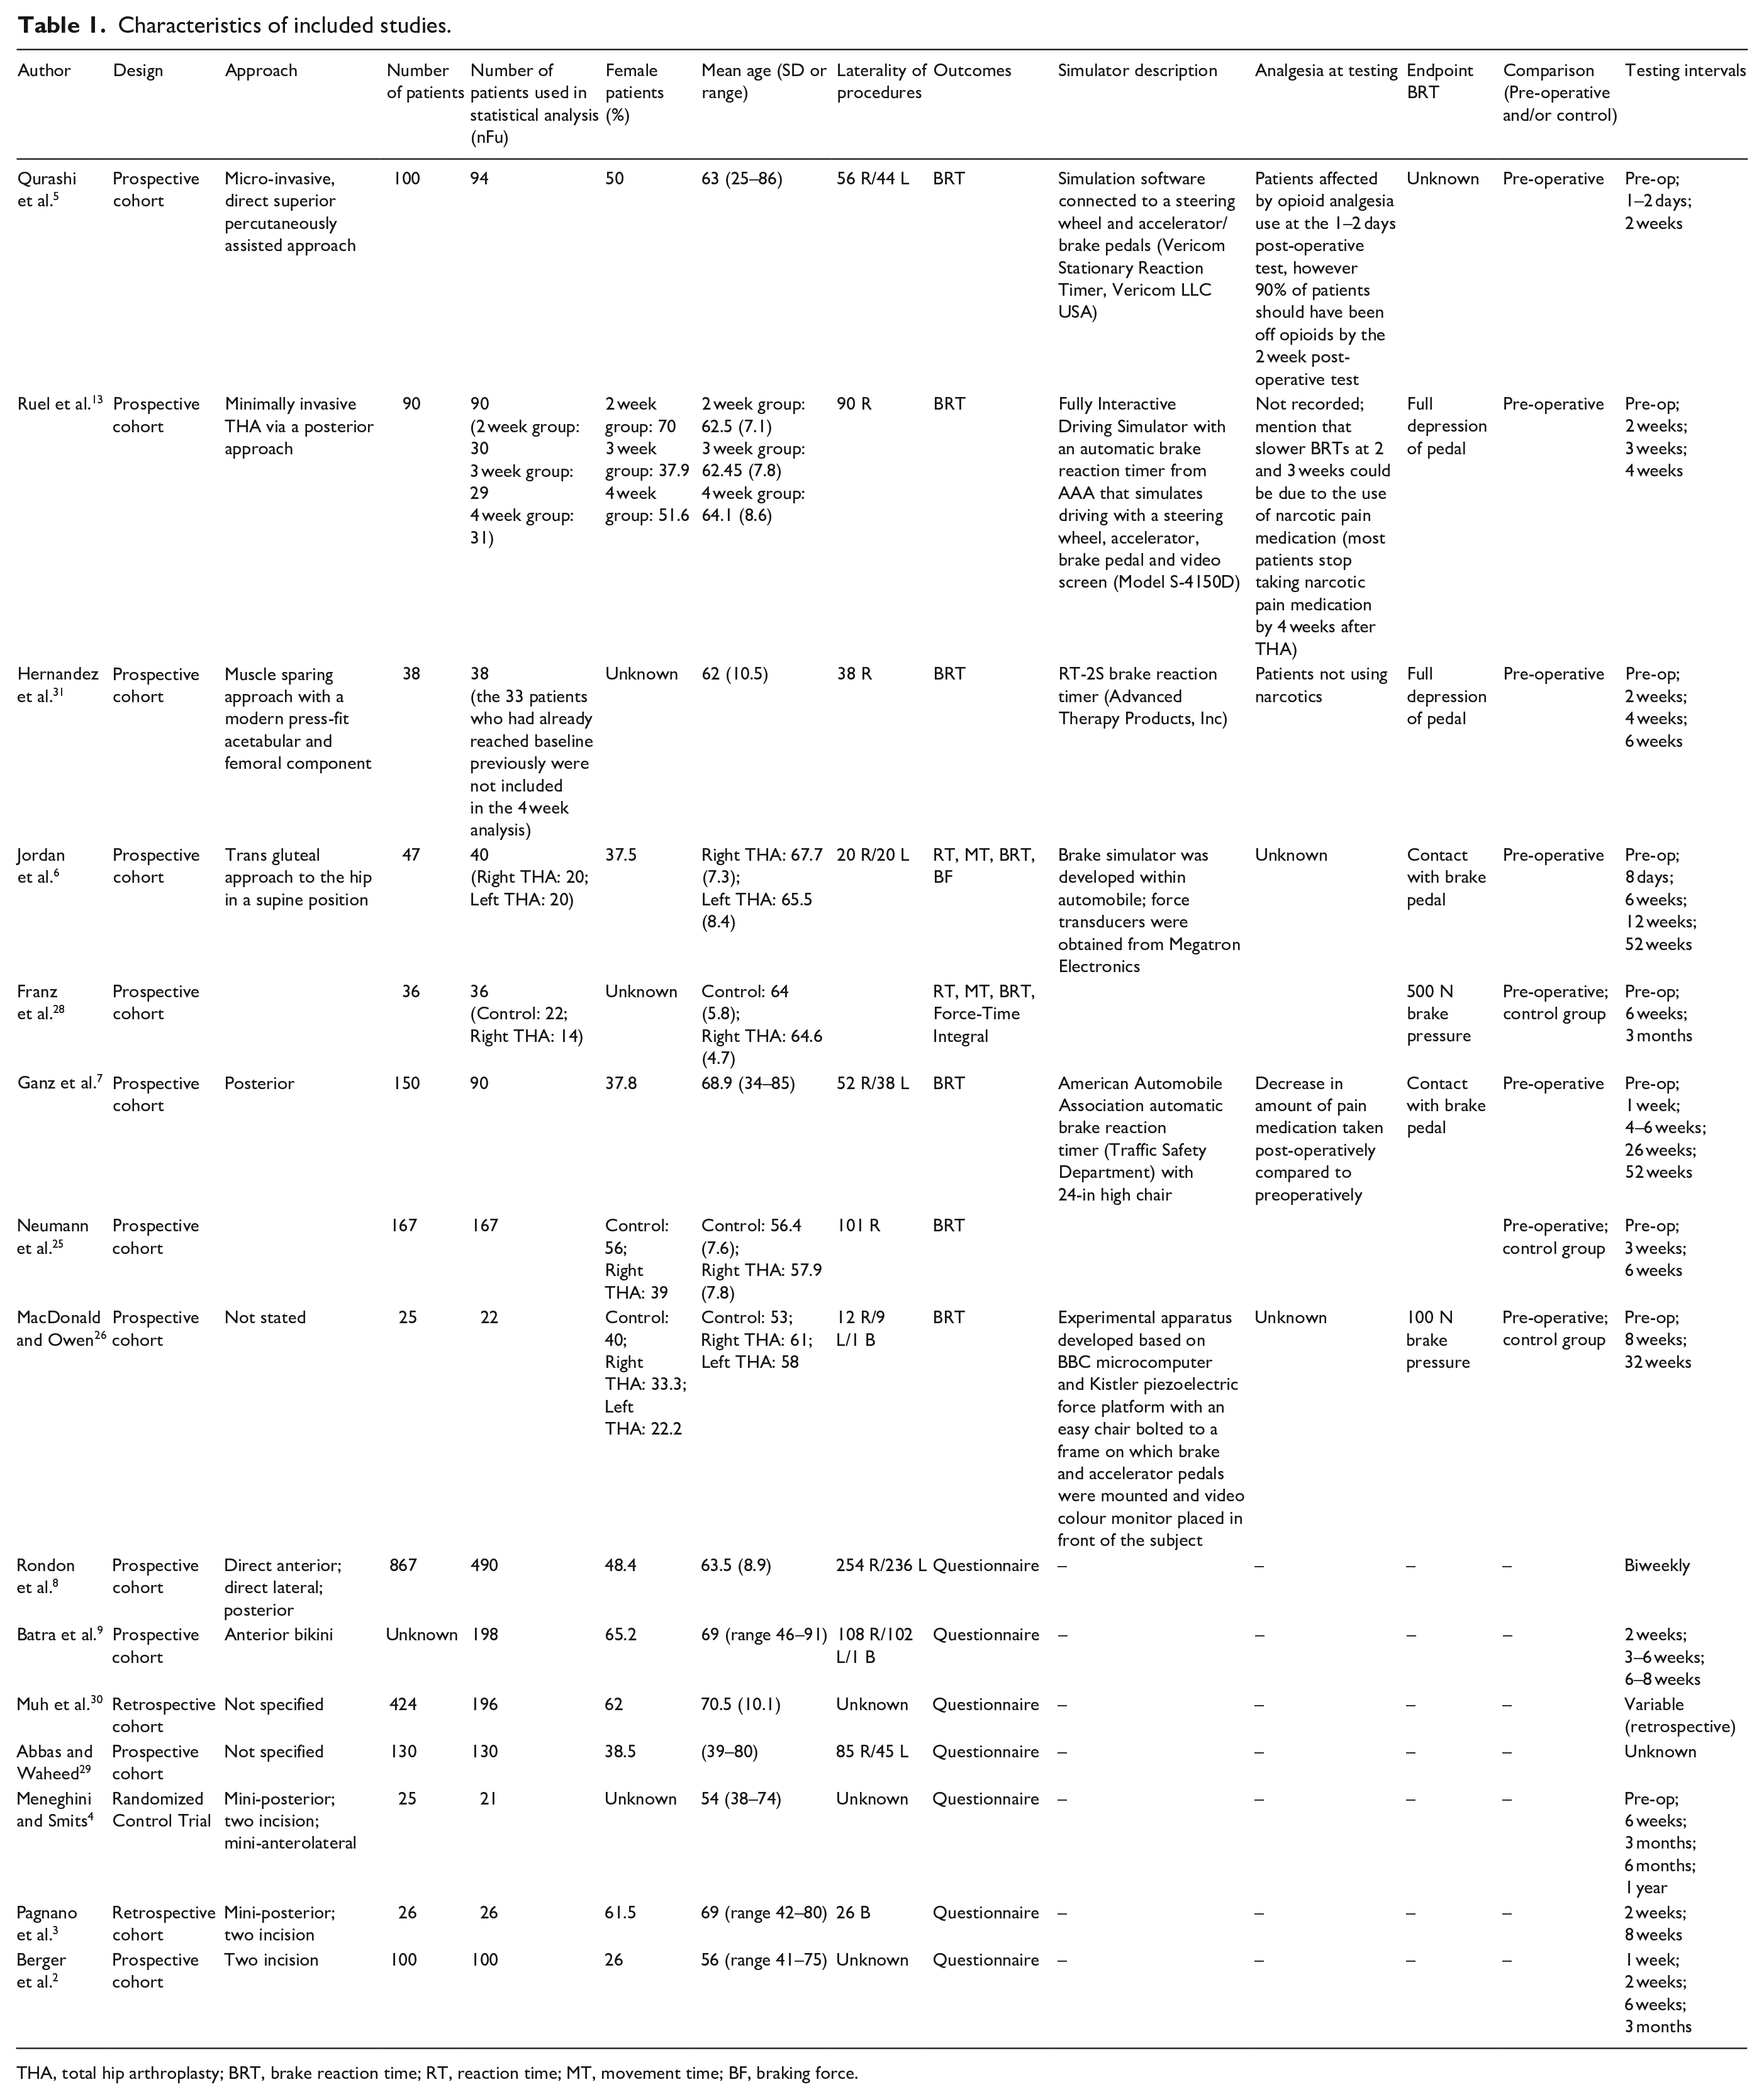
THA, total hip arthroplasty; BRT, brake reaction time; RT, reaction time; MT, movement time; BF, braking force.
Methodological quality
Appendix 3 provides an overview of the CASP, MINORS and OCEBM bias assessments, which were completed for all of the studies included in the meta-analysis. 3 studies were graded as low risk and 4 studies were graded as low/moderate risk.
GRADE analysis (Appendix 4) showed the quality of evidence to be Very Low or Low for all analyses. Based on this there is a possibility that the true effect may differ significantly from the estimate.
Qualitative analysis: recommended return to driving
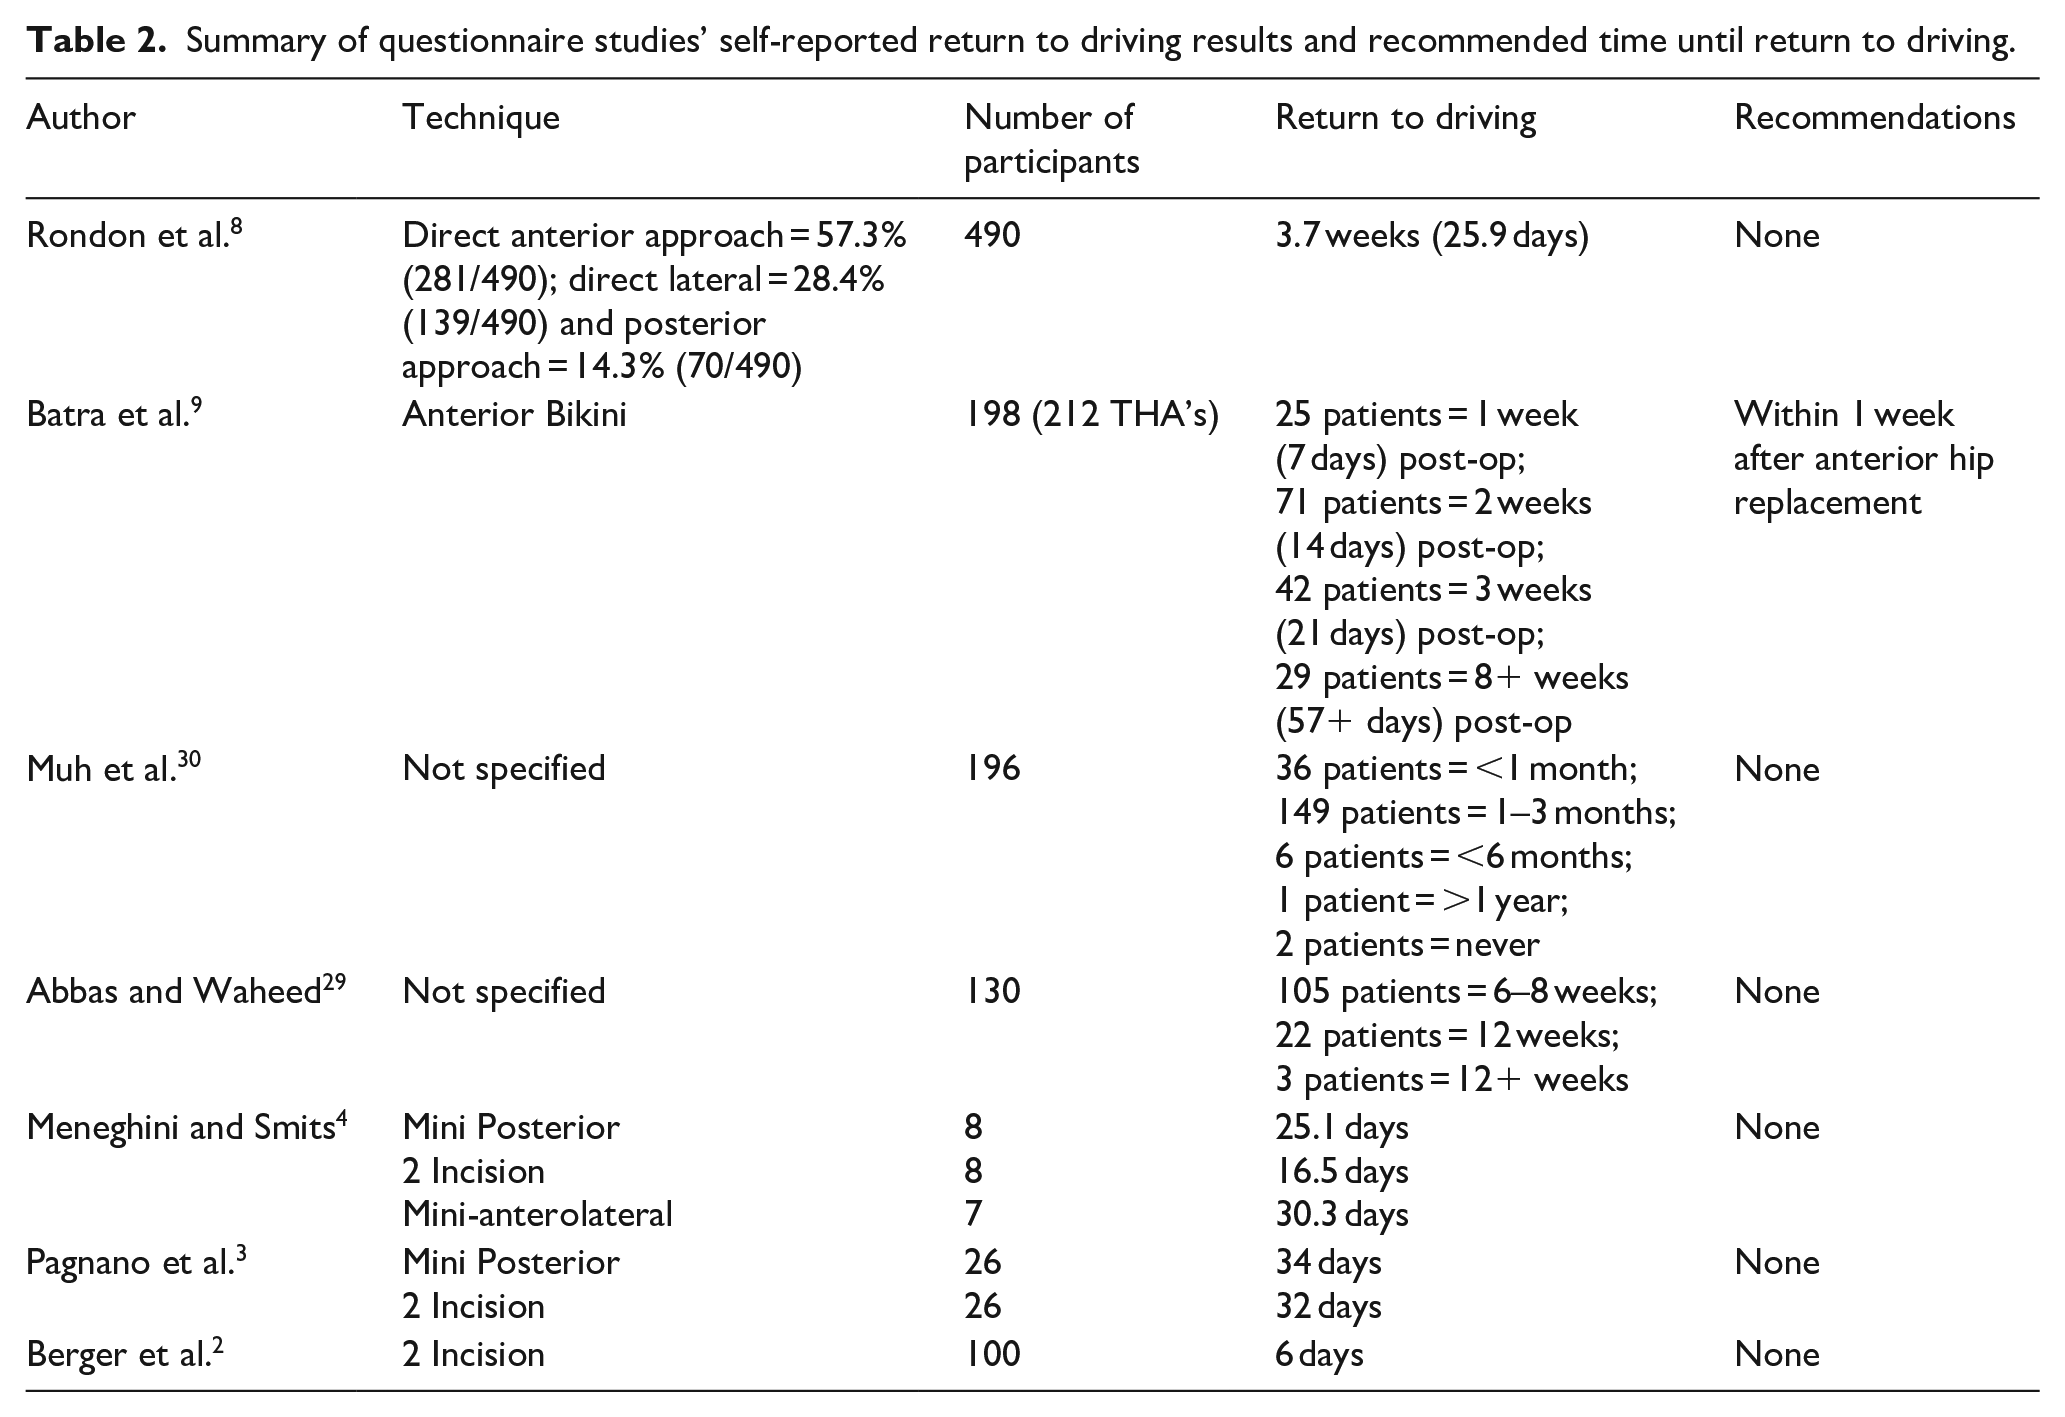
Based on patient-reported return to driving times, driving confidence, number of driving accidents incurred and various other measurements, a total of 4 studies out of the 14 qualitative and quantitative studies included in the analysis made recommendations on return to driving post THA. As demonstrated in Tables 2 and 3, the mean recommended time till return to driving was 4.5 weeks (mean of the 4 studies) and the range was <1 week to 8 weeks.
Summary of questionnaire studies’ self-reported return to driving results and recommended time until return to driving.
Summary of simulation studies’ recommended time until return to driving.
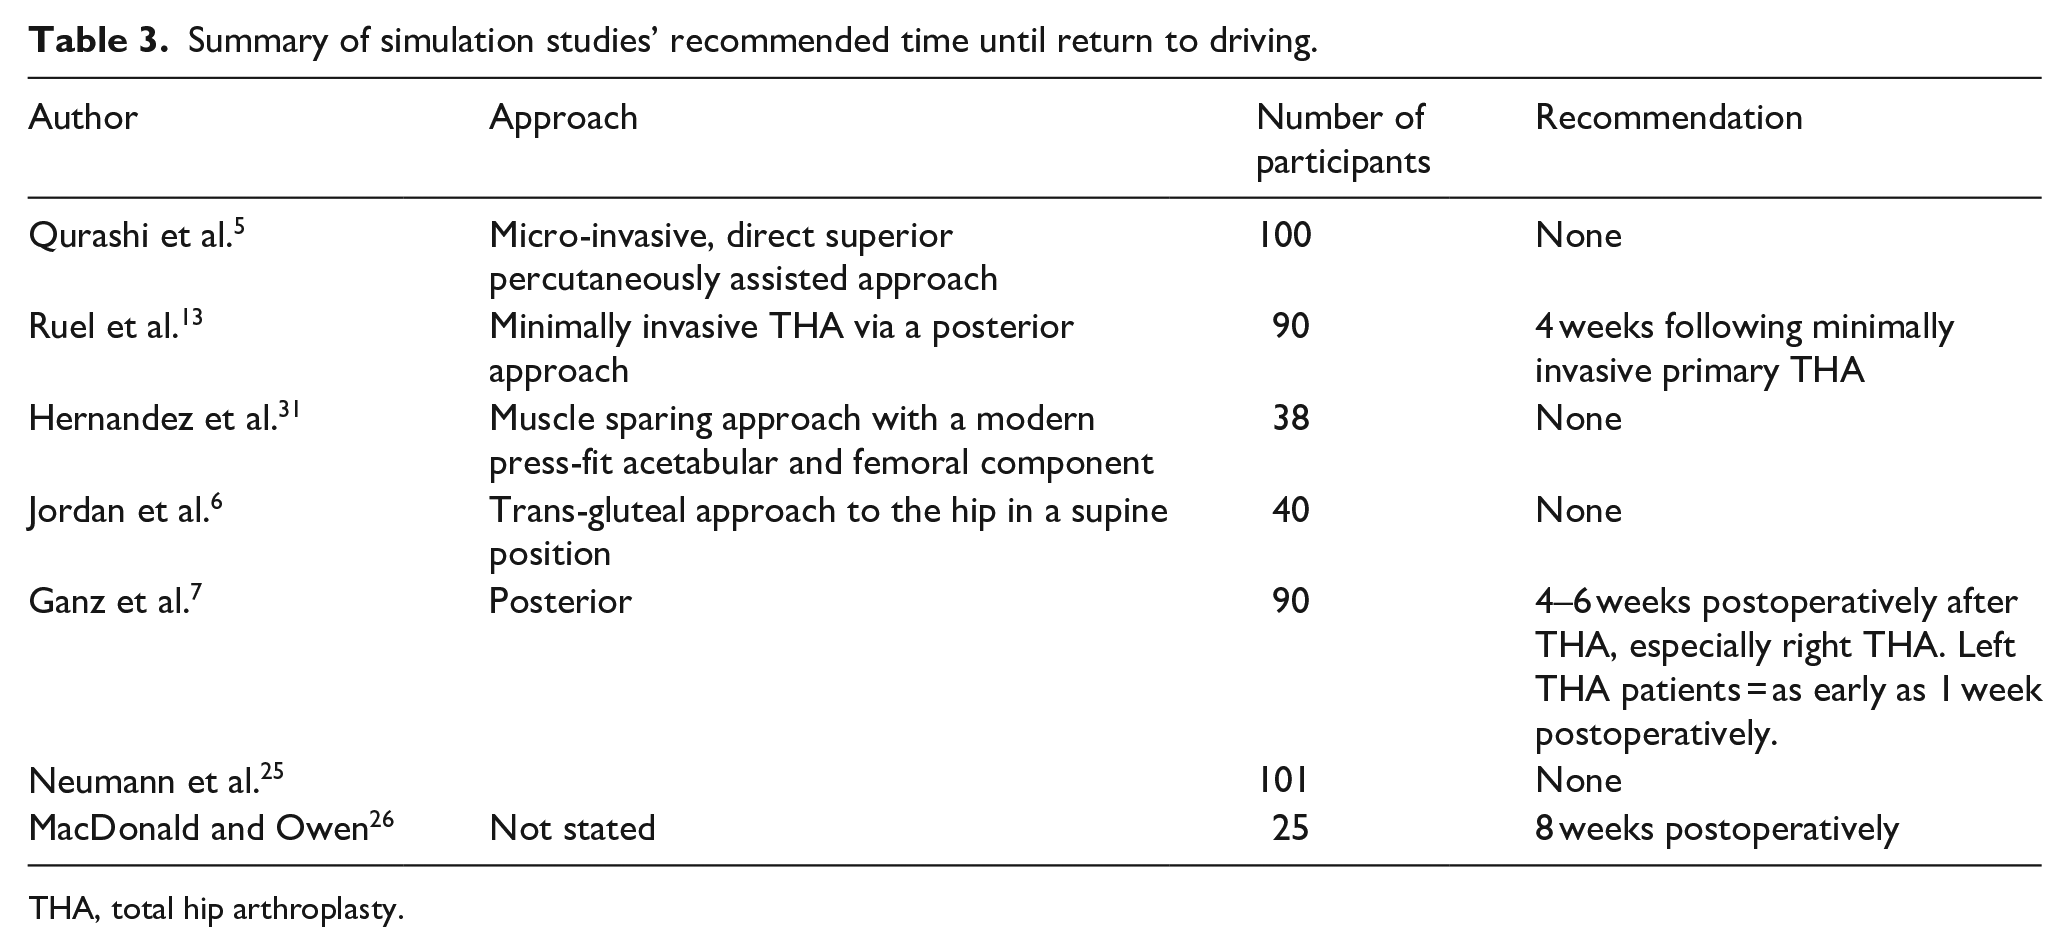
THA, total hip arthroplasty.
Qualitative analysis: patient-reported time to resume driving after THA
An overview of the studies looking at self-reported postoperative return to driving is shown in Table 2. In total there were 1189 participants. Postoperative return to driving times ranged from 6 days to >1 year or in rare cases (n = 2) never. The majority of patients (n = 960) self-reported safely returning to driving within approximately 6 weeks. The mean self-reported return to driving across all studies was 32.9 days.
Quantitative analysis: BRT
Appendix 2 summarises the BRT data of the 8 included studies. Brake reaction times were pooled and compared to pre-operative baseline values at time intervals of 1, 2, 3, 4, 6, 12, 32, and 52 weeks (Figure 2. Right sided THA and Figure 3. Left Sided THA).
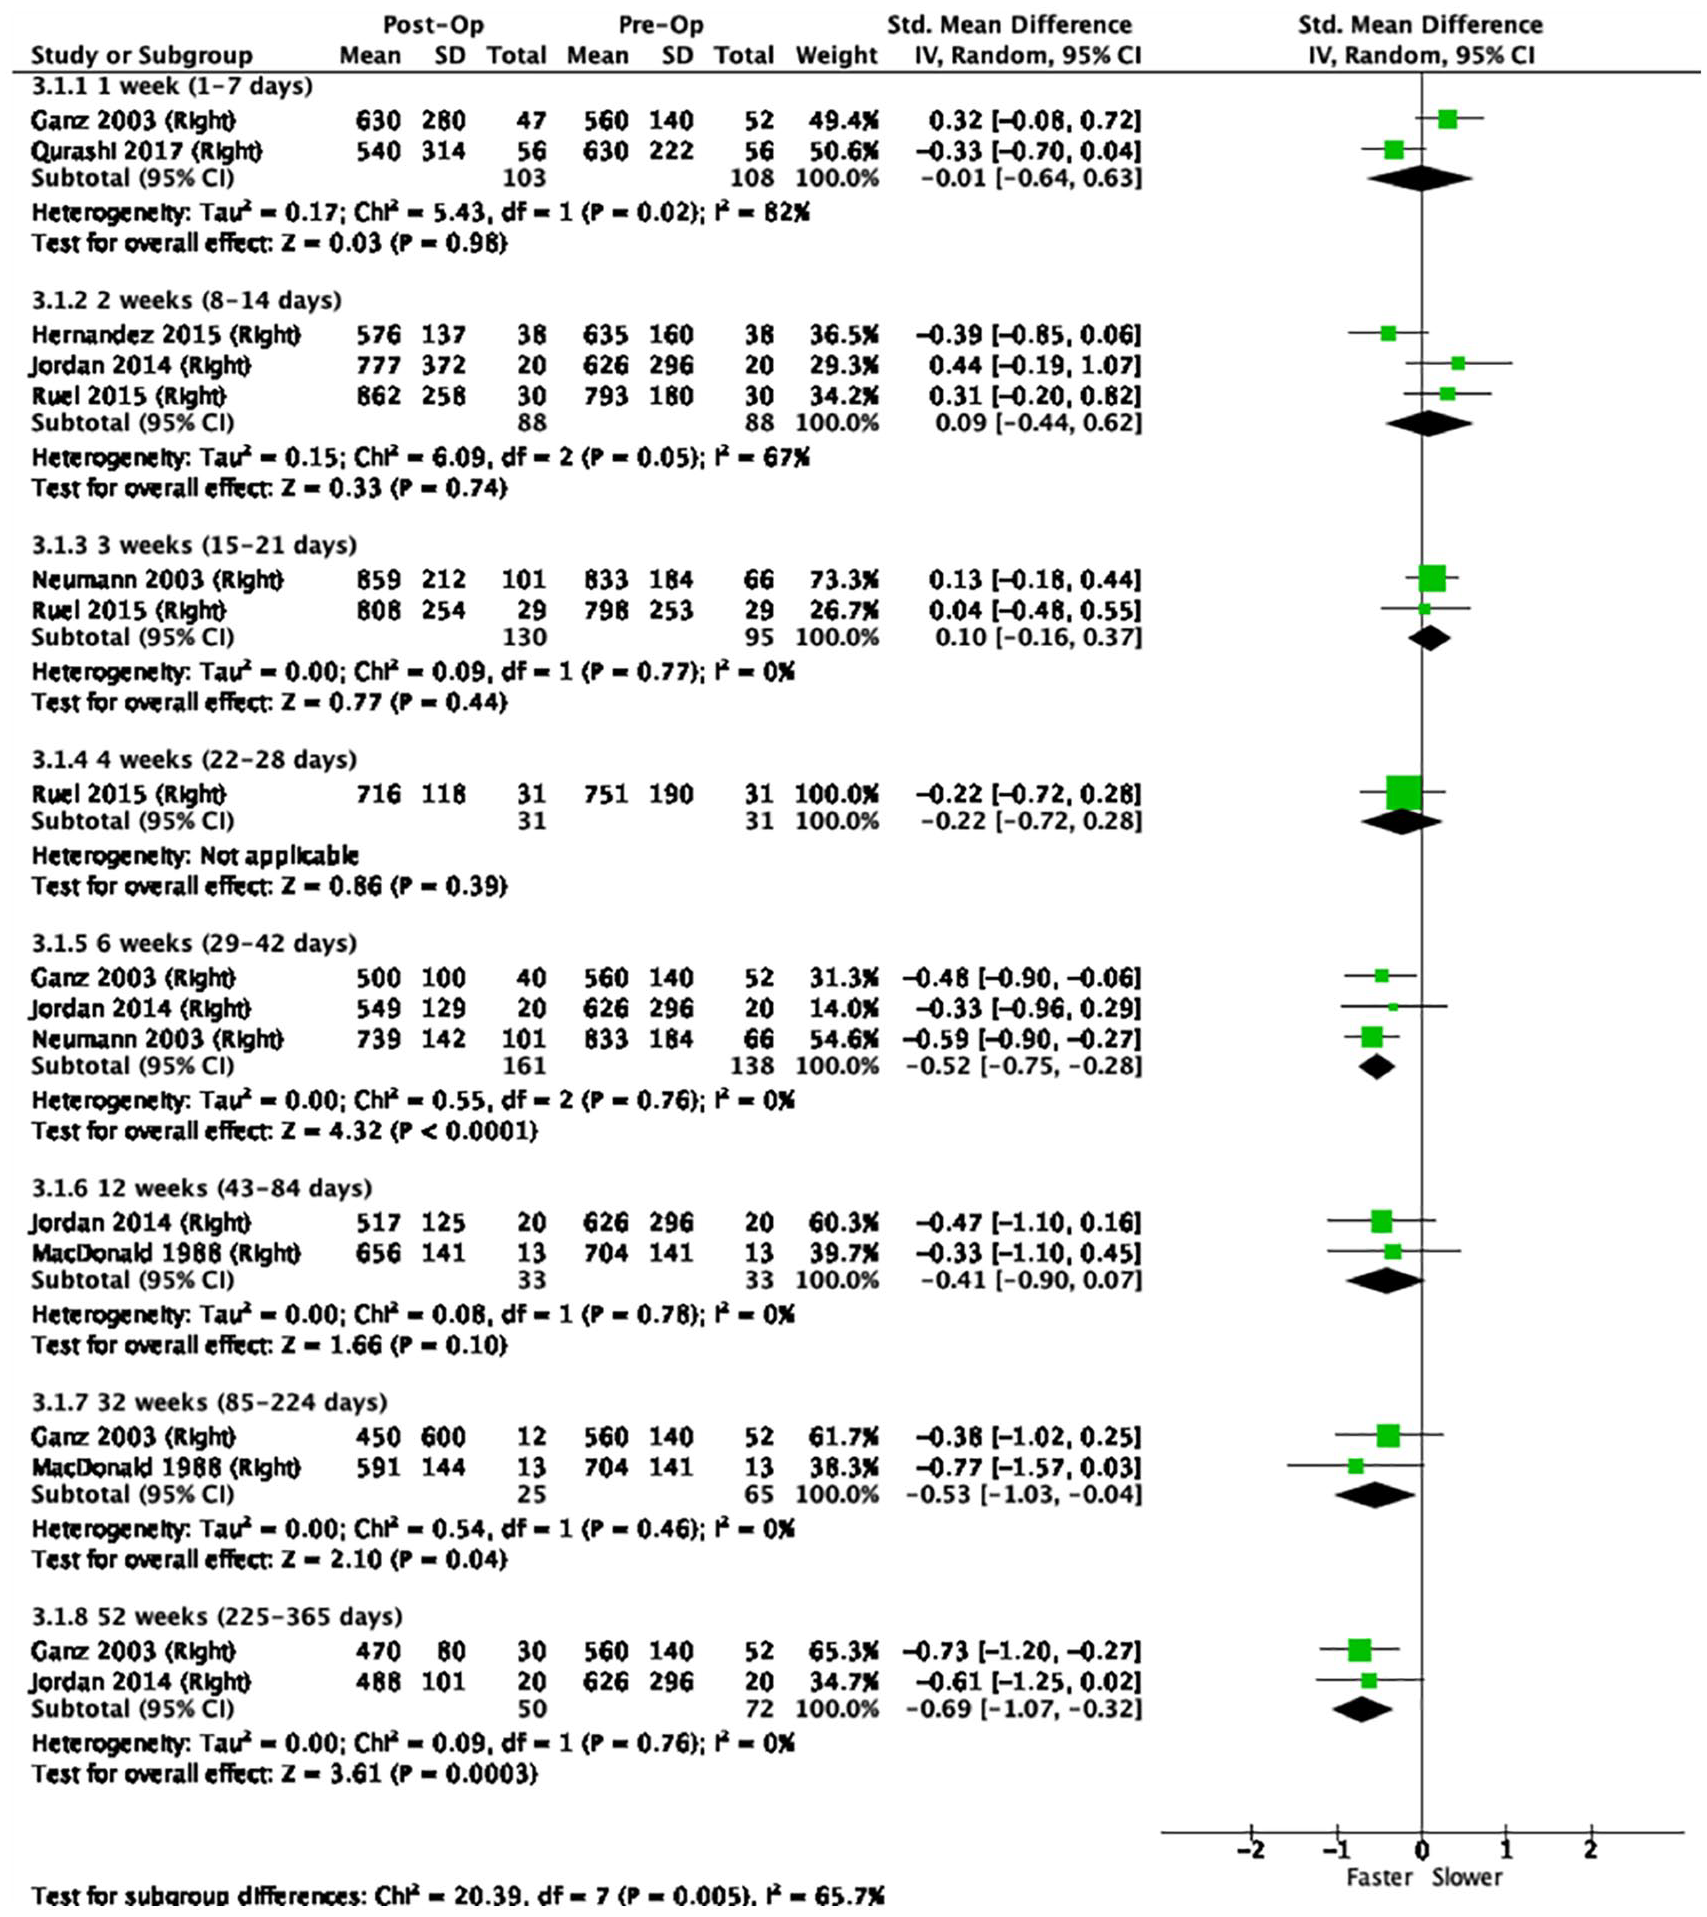
Forest plot showing right-sided total hip arthroplasty.
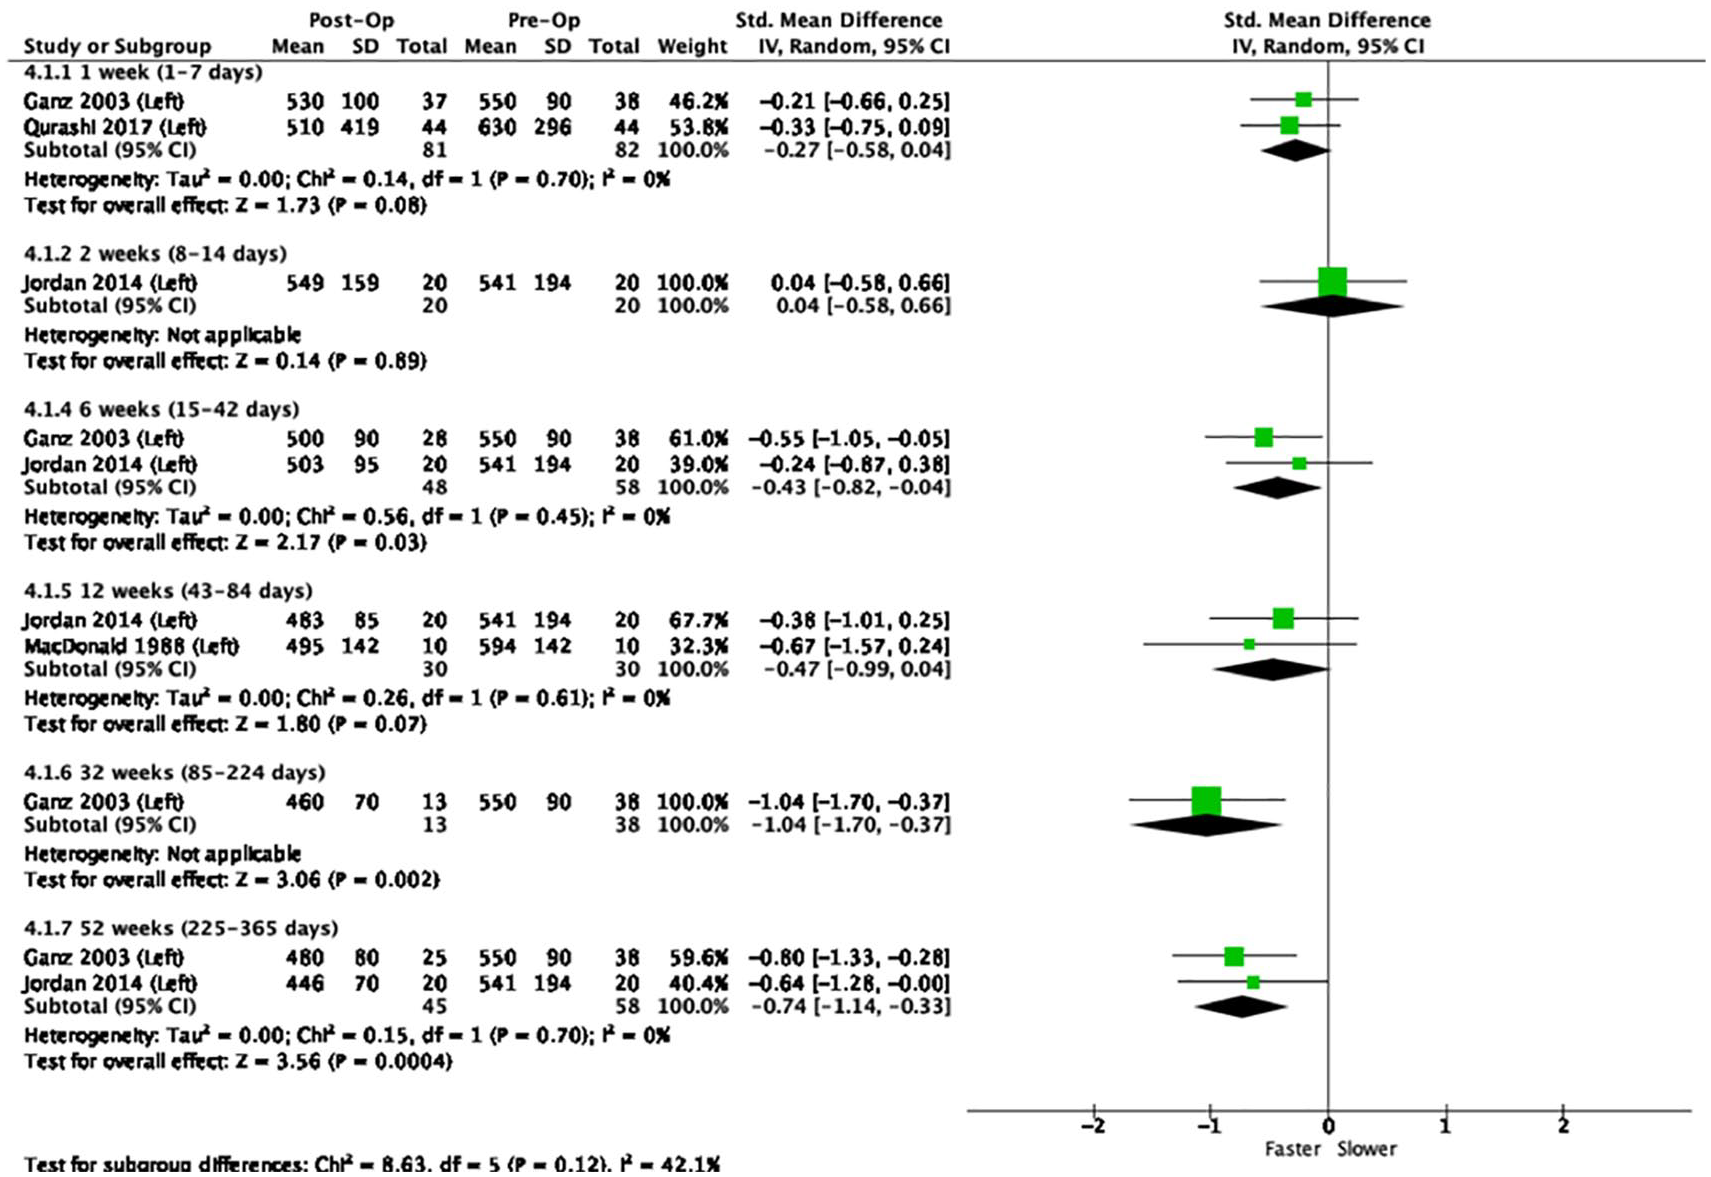
Forest plot showing left-sided total hip arthroplasty.
Right THA
The pooled means for right THAs alone show a BRT near to or just slower than baseline at 1, 2, 3, and 4 weeks, and faster than baseline at 6, 12, 32, and 52 weeks with values at 6, 32, and 52 weeks being significant (p < 0.05).
Left THA
The pooled means for left THA (n = 237) showed a BRT around or just slower than baseline at 1 week and 2 weeks and below baseline (faster BRT) at 6 weeks, 12 weeks, 32 weeks and 52 weeks. Only the pooled means at 6, 32 and 52 weeks were significant (p < 0.05).
All (right and left) THA
The pooled means of both right and left THAs show a brake reaction time (BRT) around or just slower baseline at 1 week, 2 weeks, 3 weeks and 4 weeks, and faster than baseline at 6 weeks, 12 weeks, 32 weeks and 52 weeks. Of these, only the pooled means at 6, 32, and 52 weeks were significant (p < 0.05). Of note the long-term findings of BRT i.e., at 12 weeks onwards captured approximately only 10% of study participants.
Discussion
This systematic review identified that, among the studies offering a recommendation, the average recommended return to driving was at 4.5 weeks post operation. Self-reported patient questionnaires identified safely returning to driving within approximately 6 weeks (pooling of mean values 32.9 days).
Meta-analysis of BRT showed that the trend of the pooled means at 6 weeks and beyond had returned to preoperative baseline values. However, only values at 6, 32, and 52 weeks were significant. Side specific analyses showed no differences between left and right THA as both demonstrated significant improvement in brake reaction time beginning at 6 weeks.
A previous meta-analysis, conducted by van der Velden et al. 14 in 2017, determined that total brake reaction time (TBRT) returned to the preoperative level 2 weeks after right-sided THA. Based on 2 studies, they also found a significant decrease in TBRT at 6 weeks.6,7 However, significant decreases were not seen at 8 weeks and 3 months postoperatively, which decreases the confidence in recommending patients to resume driving at 6 weeks postoperatively. The present study shows that BRT reaches preoperative levels as soon as 1 week after right-sided THA. Similar to that reported by van der Velden et al., 14 the meta-analysis also found a significantly faster BRT at 6 weeks. This statistical significance was also found at 32 and 52 weeks, which shows that the improvement of BRT continues to be maintained in the patients’ longer-term recovery. Overall, the current meta-analysis presents a more comprehensive analysis with additional studies included, which provides a more accurate estimation of a safe return to driving time compared to the previous meta-analysis.
Ganz et al. 7 found that although drivers use only their right lower extremity to control the accelerator and brake pedals, weight is almost always shifted to the left hip and pelvis when the right foot is moved on and off the pedals. 85% of left-sided THA patients also reported increased pain in the left hip when driving before surgery. Therefore, as BRT may be affected by impaired function of the left hip, the data of those having a left-sided THA was analysed in the meta-analysis. Commonly, it is assumed that patients undergoing a left-sided THA may be less impaired in driving postoperatively and able to return to driving earlier than those undergoing a right-sided THA. However, the results of the present study indicate otherwise. The data showed that similar to right-sided THA, BRT reached preoperative values at 1 week postoperatively and was found to be significantly decreased at 6 weeks postoperatively. Therefore, patients undergoing a left-sided THA may not be able to return to driving earlier than those undergoing a right-sided THA as previously thought.
Few studies have looked at left-sided THA, therefore the current evidence is weak and further research is needed to discern whether patients can return to driving earlier upon a left THA. Additionally, not many studies have examined BRTs at 3 and 4 weeks postoperatively, thus data is needed to draw robust conclusions and determine if BRT’s return to baseline sooner than 6 weeks postoperatively.
There are additional limitations associated with this systematic review and meta-analysis. Although most of the included studies had similar patient (gender, age) and study characteristics (outcomes, BRT comparison), heterogeneity was possible due to publication time span, THA technique utilised, rehabilitation protocol followed, and analgesia at testing. 1 important difference, demonstrated in Table 1, is that studies varied in endpoint BRT. While some measured the time it took to make contact with the brake pedal,6,7 others measured the time required to apply a certain brake force or fully depress the pedal.13,26,28,31 BRT was also measured at different post-operative times and a few studies had missing values and details. Furthermore, the current study was unable to analyse reaction time (RT- time to react to danger and release the accelerator pedal) and movement time (MT- time to move from accelerator to apply pressure to the brake pedal) in addition to BRT as the simulation studies rarely reported this data. Both MT and RT are of interest as trials have shown that patients can develop a learned effect when using simulation machines and their overall BRT can improve due to the RT, whilst the MT may still remain sub-optimal.7,32
The ability to drive relies on having adequate strength to brake using the pedal in an optimal reaction time. Thus, BRTs are frequently used to determine an individual’s ability to drive. However, driving involves much more than the ability to brake and relies on patients’ sensory, motor, and cognitive abilities. Additionally, simulators are less realistic than real driving. They do not exactly replicate the feel (noise, seat, controls, visuals, etc.) of a real car and fail to perfectly replicate the feeling of a driving emergency, such as the panic, apprehension and concern associated with seeing a child run after a toy in front of your car. Therefore, BRT is not a perfect measure of driving abilities and the simulation is not a test of a driving emergency.
A main limitation of this study is the comparison of preoperative values with the postoperative follow-up values. Since patients are legally allowed to drive preoperatively, preoperative BRT is typically accepted and used as a reference BRT for individuals’ ability to drive. However, as demonstrated by Hofmann et al., 33 osteoarthritis of the hip significantly impairs driving ability. Therefore, patients undergoing THA may have prolonged BRTs prior to surgery. Thus, an age-matched control group may be a better choice to evaluate driving ability after THA. This is supported by the results of MacDonald and Owen 26 which compared postoperative values to both preoperative and control. The study showed that patients’ postoperative BRT showed an improvement when compared to their preoperative values, but remained worse than that of the control group. Furthermore, the findings of this study are applicable to cars which use automatic transmission and hence may not be generalisable to all countries (e.g. in the UK 1.6 million driving tests are taken using manual transmission). Another key limitation is the lack of detailed datasets in the published papers and therefore our inability to provide further granularity with regards to varying factors which can potentially impact the time to return to driving after a THA.
The use of preoperative values for comparison is also disadvantageous because in repeated simulations, subjects demonstrate a learning effect and improve at anticipating the hazard signal and transferring from accelerator to brake. 28 As a result, BRT may not be a true indicator of the extent to which braking performance is compromised after THA.
Interestingly, the American Occupational Therapy Association (AOTA) recommends a comprehensive clinical evaluation of a patient’s driving abilities in the post-operative period including driving simulation; however, this is not the current standard of care nor feasible in all orthopaedic practices. 13 The development of a clinical examination which directly correlates to driving simulation performance may prove to be beneficial in the future.
Conclusion
Based upon the meta-analysis of BRT, an improvement in braking performance was noted at 6 weeks postoperatively. The mean recommended return to driving time was 4.5 weeks although it should be noted only 4 studies offered a recommendation. Based on studies using patient reported questionnaires return to driving was at approximately 6 weeks. Orthopaedic surgeons should use these results as a guideline when advising patients on when to resume driving. Given the lack of level 1 evidence, further research is needed in the area prior to definitively changing guidelines. Future studies should also incorporate the other parameters of BRT (MT and RT) in their analysis due to the learning effect demonstrated in previous studies.
As driving is a complex skill, the recommendation to a patient should be individualised based on factors such as the type of vehicle driven (automatic or manual), THA technique, surgical side (right or left), medication and comorbidities. For instance, patients driving sports cars may be unable to maintain post-operative THA precautions while entering or exiting the car or sitting in the driver’s seat, however this may not be a problem for a patient who drives a van. Additionally, patients should take appropriate safety precautions when resuming driving after THA. They should practice driving in a stationary vehicle, begin with shorter journeys and be accompanied by another driver who can take over if they face any issues.
Supplemental Material
sj-docx-1-hpi-10.1177_1120700021998028 – Supplemental material for Doctor when can I drive? A systematic review and meta-analysis of return to driving after total hip arthroplasty
Supplemental material, sj-docx-1-hpi-10.1177_1120700021998028 for Doctor when can I drive? A systematic review and meta-analysis of return to driving after total hip arthroplasty by Purva V Patel, Vasileios Giannoudis, Samantha Palma, Stephen Guy, Jeya Palan, Hemant Pandit and Bernard Van Duren in HIP International
Supplemental Material
sj-docx-2-hpi-10.1177_1120700021998028 – Supplemental material for Doctor when can I drive? A systematic review and meta-analysis of return to driving after total hip arthroplasty
Supplemental material, sj-docx-2-hpi-10.1177_1120700021998028 for Doctor when can I drive? A systematic review and meta-analysis of return to driving after total hip arthroplasty by Purva V Patel, Vasileios Giannoudis, Samantha Palma, Stephen Guy, Jeya Palan, Hemant Pandit and Bernard Van Duren in HIP International
Footnotes
Author statement
This study does not necessarily represent the official views of Indiana University School of Medicine-West Lafayette. HP: is a National Institute for Health Research (NIHR) Senior Investigator. BvD: is a BRC-NIHR Academic Clinical Lecturer. The views expressed in this article are those of the author(s) and not necessarily those of the BRC, NIHR, or the Department of Health and Social Care.
Declaration of conflicting interests
The author(s) declared no potential conflicts of interest with respect to the research, authorship, and/or publication of this article.
Funding
The author(s) disclosed receipt of the following financial support for the research, authorship, and/or publication of this article: This project was funded, in part, with support from Indiana University School of Medicine-West Lafayette.
Supplemental material
Supplemental material for this article is available online.
References
Supplementary Material
Please find the following supplemental material available below.
For Open Access articles published under a Creative Commons License, all supplemental material carries the same license as the article it is associated with.
For non-Open Access articles published, all supplemental material carries a non-exclusive license, and permission requests for re-use of supplemental material or any part of supplemental material shall be sent directly to the copyright owner as specified in the copyright notice associated with the article.