
Abstract
Diabetic retinopathy (DR) remains a leading cause of vision loss globally. Timely detection through photographic screening is key to prevention, yet considerable variability exists across imaging protocols. This systematic review and meta-analysis evaluates the diagnostic accuracy of various photographic strategies for DR detection to inform evidence-based screening practices. We systematically searched six databases and trial registries up to June 2023. Eligible studies included adults (≥18 years) with type 1 or 2 diabetes undergoing DR screening using fundus photography, compared against a reference standard (7-field ETDRS or dilated ophthalmoscopy). We performed bivariate meta-analyses for direct comparisons (e.g., mydriatic vs. non-mydriatic), and indirect armbased meta-analyses. Eighty studies (over 50,000 participants) were included. Direct comparisons including 8 studies (16 arms, 2967 participants), found that the sensitivity for detecting any DR was comparable between mydriatic and non-mydriatic imaging (90% vs. 89%), though specificity was lower without dilation (85% vs. 90%). Sensitivity improved with the number of fields (from 0.82 with 1-field to 0.98 with ≥4-fields), particularly in nonmydriatic settings. Results also showed an observed heterogeneity in accuracy of screening across settings showing the need for continuous auditing of screening performance. Photographic screening for DR was effective across multiple configurations. Two-field mydriatic protocols offer high diagnostic accuracy, while trained graders and portable devices can enhance scalability. Findings support the design of structured screening programs adapted to local resources and clinical priorities.
Keywords
Introduction
Diabetic retinopathy (DR) is the most common microvascular complication of diabetes mellitus (DM) and remains a leading cause of irreversible vision loss in working-age adults worldwide. 1 Approximately one-third of people with DM are affected by DR, and 10% develop sight-threatening DR (STDR), including proliferative DR or diabetic macular oedema.1,2 DR burden is expected to rise considerably in the coming decades 3 with the International Diabetes Federation (IDF) estimating a projected 783.2 million people affected by 2045.4,5
Early detection and management are essential to prevent vision loss from DR with regular ophthalmic screening remaining the most effective strategy.6,7 Several countries, including the United Kingdom, Singapore, and Hong Kong, have implemented structured national DR screening programs based on digital fundus photography, leading to measurable reductions in DR-related blindness.8–10 In contrast, Italy currently lacks national guidelines for DR screening and is often opportunistic and hospital-based, leading to a low proportion receiving recommended annual retinal examinations. 11 Recent developments in Italy, including regional and pilot initiatives employ telemedicine 12 and have demonstrated the feasibility and clinical relevance of adopting more structured approaches to DR screening. This highlights a growing institutional awareness of the need to establish national guidelines to ensure equitable and standardised regional screening access.
In DR screening, several photographic modalities are currently used varying by number of fields (single vs. multi-field), pupil status (mydriatic vs. non-mydriatic), and device type (tabletop vs. handheld cameras).9,13–16 Although 7-field stereoscopic fundus photography remains the reference standard for the diagnosis and grading of DR, 17 its complexity and resource requirements limit its applicability in large-scale screening programs. Two-field mydriatic imaging, adopted in many national screening programs, 9 offers comparable diagnostic performance and improved operational efficiency.18,19
Non-mydriatic and handheld imaging also offer flexibility and portability, facilitating DR screening in primary care and underserved settings.20–24 However, some studies report these modalities may suffer from lower image quality and a higher proportion of ungradable images, particularly in patients with small pupils or media opacities.25–27 Pupil dilation consistently improves image gradeability but may increase screening time, patient discomfort and convenience, critical in population screening.28–30 Newer technology such as ultra-widefield imaging extends visualisation to the peripheral retina, potentially improving detection of early or atypical lesions31–33 Artificial intelligence (AI) algorithms also could offer real-time interpretation of fundus photographs, however this is not routinely used in population screening programmes.8,34,35
Several previous systematic reviews have explored individual imaging strategies, few have directly compared their diagnostic accuracy against a common reference standard, such as 7-field ETDRS photography or dilated ophthalmoscopy.15,19,36 Therefore, this systematic review and meta-analysis aims to synthesise available evidence on the diagnostic accuracy of different photographic screening methods for DR. We compared single- vs. multi-field imaging, mydriatic vs. non-mydriatic protocols, and handheld vs. stand-mounted cameras. The findings will inform the design of structured, evidence-based screening programs in Italy.
Methods
This study aimed to answer two questions:
What is the diagnostic accuracy of fundus photographic grading with What is the diagnostic accuracy of
For these primary objectives we aimed to use direct comparisons, since indirect comparisons are more likely to obtain biased estimates. We aimed to explore potential sources of heterogeneity in diagnostic accuracy, including both
The study followed a systematic review approach following the PRISMA guidelines. 37 An information specialist was consulted in the initial stages of the systematic review to determine search terms, appropriate databases and BOOLEAN operators. A protocol was developed including background, search terms, inclusion/exclusion criteria and data extraction tables (registered on PROSPERO: registration number CRD42025641968. This review was structured around a predefined PICO question developed to address the diagnostic performance of photographic strategies for diabetic retinopathy (DR) screening in telemedicine settings.
(Figure 1).
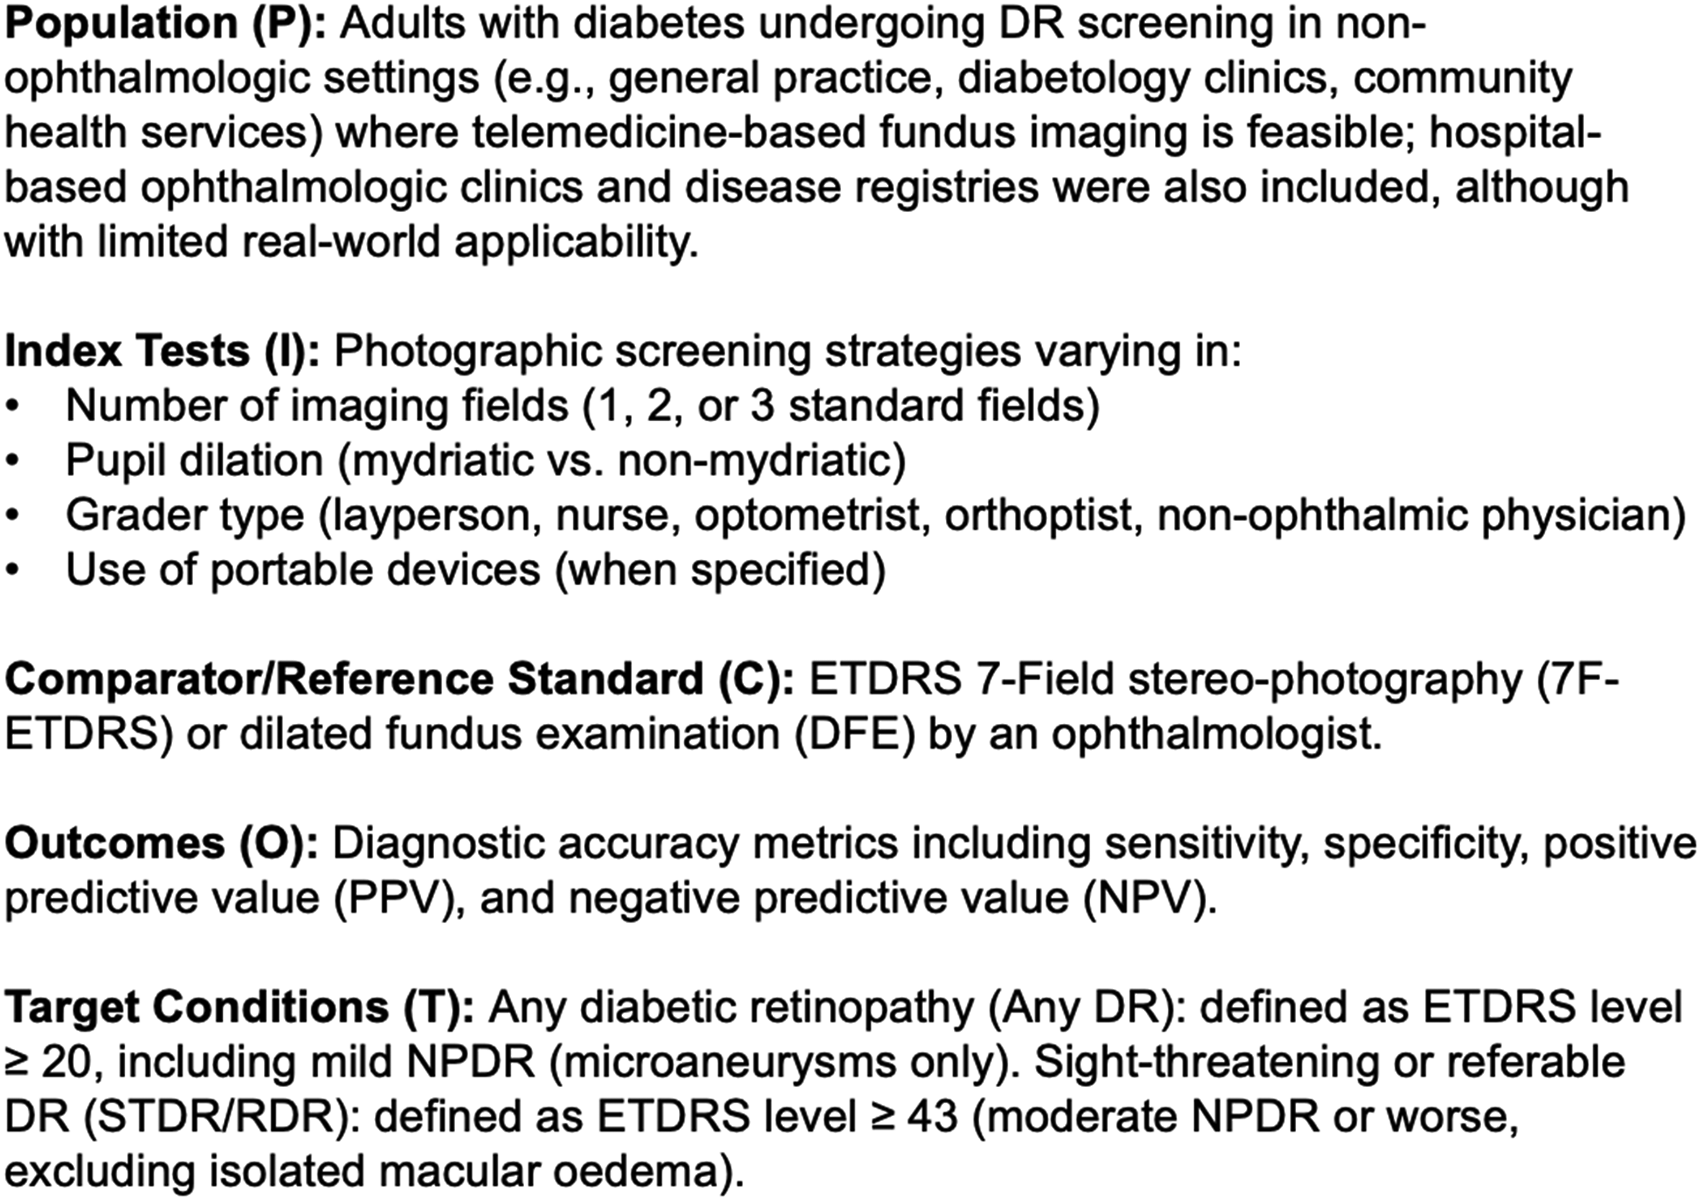
PICO question rationale.
The study design eligibility focused on prospective or retrospective cohort studies enrolling consecutive patients. Case–control studies were excluded unless they involved direct within-patient comparisons of multiple index strategies. High-quality systematic reviews of diagnostic test accuracy (DTA) studies were also eligible if they contributed unique data.
A systematic search was conducted on PubMed, Embase, MEDLINE, Web of Science, Cochrane Library of Systematic Reviews and trial register on 18th June 2023. The search terms and Boolean operators used are shown in Supplemental table 1.
Inclusion criteria
-Adults (≥18 years) with a diagnosis of type 1 or type 2 diabetes mellitus undergoing DR screening;
-No or any DR in line with the Early Treatment Diabetic Retinopathy Study (ETDRS) classification or clearly related adaptations;
-Studies including participants recruited from population-based, community-based, or routine care settings, including general practice, diabetology clinics, and non-specialist health services;
-Studies conducted in hospital-based ophthalmologic clinics or disease registries, although their applicability to real-world screening is limited;
-Primary diagnostic test accuracy (DTA) studies and high-quality systematic reviews of DTA studies, from which we extracted eligible primary data;
Exclusion criteria
-Were not published in English;
-Evaluated artificial-intelligence, machine learning or other automated grading software instead of human photographic grading;
-Did not target diabetic retinopathy (DR) or sight threatening DR (STDR);
-Lacked an appropriate reference standard (dilated fundus examination or 7 field ETDRS photography);
-Focused solely on image post processing/elaboration, cost effectiveness analyses;
-Were narrative reviews, guidelines, editorials or other non-systematic publications;
-Enrolled exclusively gestational diabetes screening, hospitalised patients, limiting generalisability.
Title, abstracts and full texts were screened independently by two reviewers (VD, MSP). Disagreements were resolved by discussion, and, when necessary, a third senior academic (GV) adjudicated. At this stage only systematic reviews and meta-analyses that met our PICO criteria were retained for full-text assessment; from these we extracted eligible primary diagnostic accuracy studies and supplemented them with additional primary studies identified in updated searches.
Where information was available, we collected data to evaluate fundus photography strategies using digital or film-based desktop cameras in a screening context and explore sources of heterogeneity in indirect comparisons. Specific variants assessed included:
Pharmacological mydriasis vs. non-mydriatic imaging Number of fields captured (one, two, three, or more; wide-field imaging) Use of portable vs. non-portable devices (where applicable) Type of grader (ophthalmologist vs. trained non-physician) Management of ungradable images (as excluded or as positive)
Risk of bias and certainty of evidence assessment
Risk of bias was assessed with the
Statistical analysis
We conducted bivariate meta-analysis models with the users’ written command metadta 38 in StataNew version 19.5 (StataCorp, College Station, TX). This macro adopts an unstructured covariance between studies, needing a minimum of 6 studies to fit a standard bivariate model without covariates. This setting can be reduced to an exchangeable covariance structure, such as with metandi. Metadta also allows meta-regression of categorical variables on sensitivity, specificity, or both. Finally, both arm- and contrast-based bivariate network meta-analyses can be fit. We chose to fit contrast-based bivariate meta-analyses for direct comparisons, and arm-based analyses for indirect comparisons. Both analyses could include multiple datasets from the same study, which we accounted for as random effects at the study level. When models including one or more covariates did not achieve convergence, we fit separate models for each covariate levels and comparisons were made descriptively, with no formal statistical testing. The effects of the number of fields will also be considered both as an exposure of interest and as a confounder in adjusted analyses.
Results
(Figure 2).
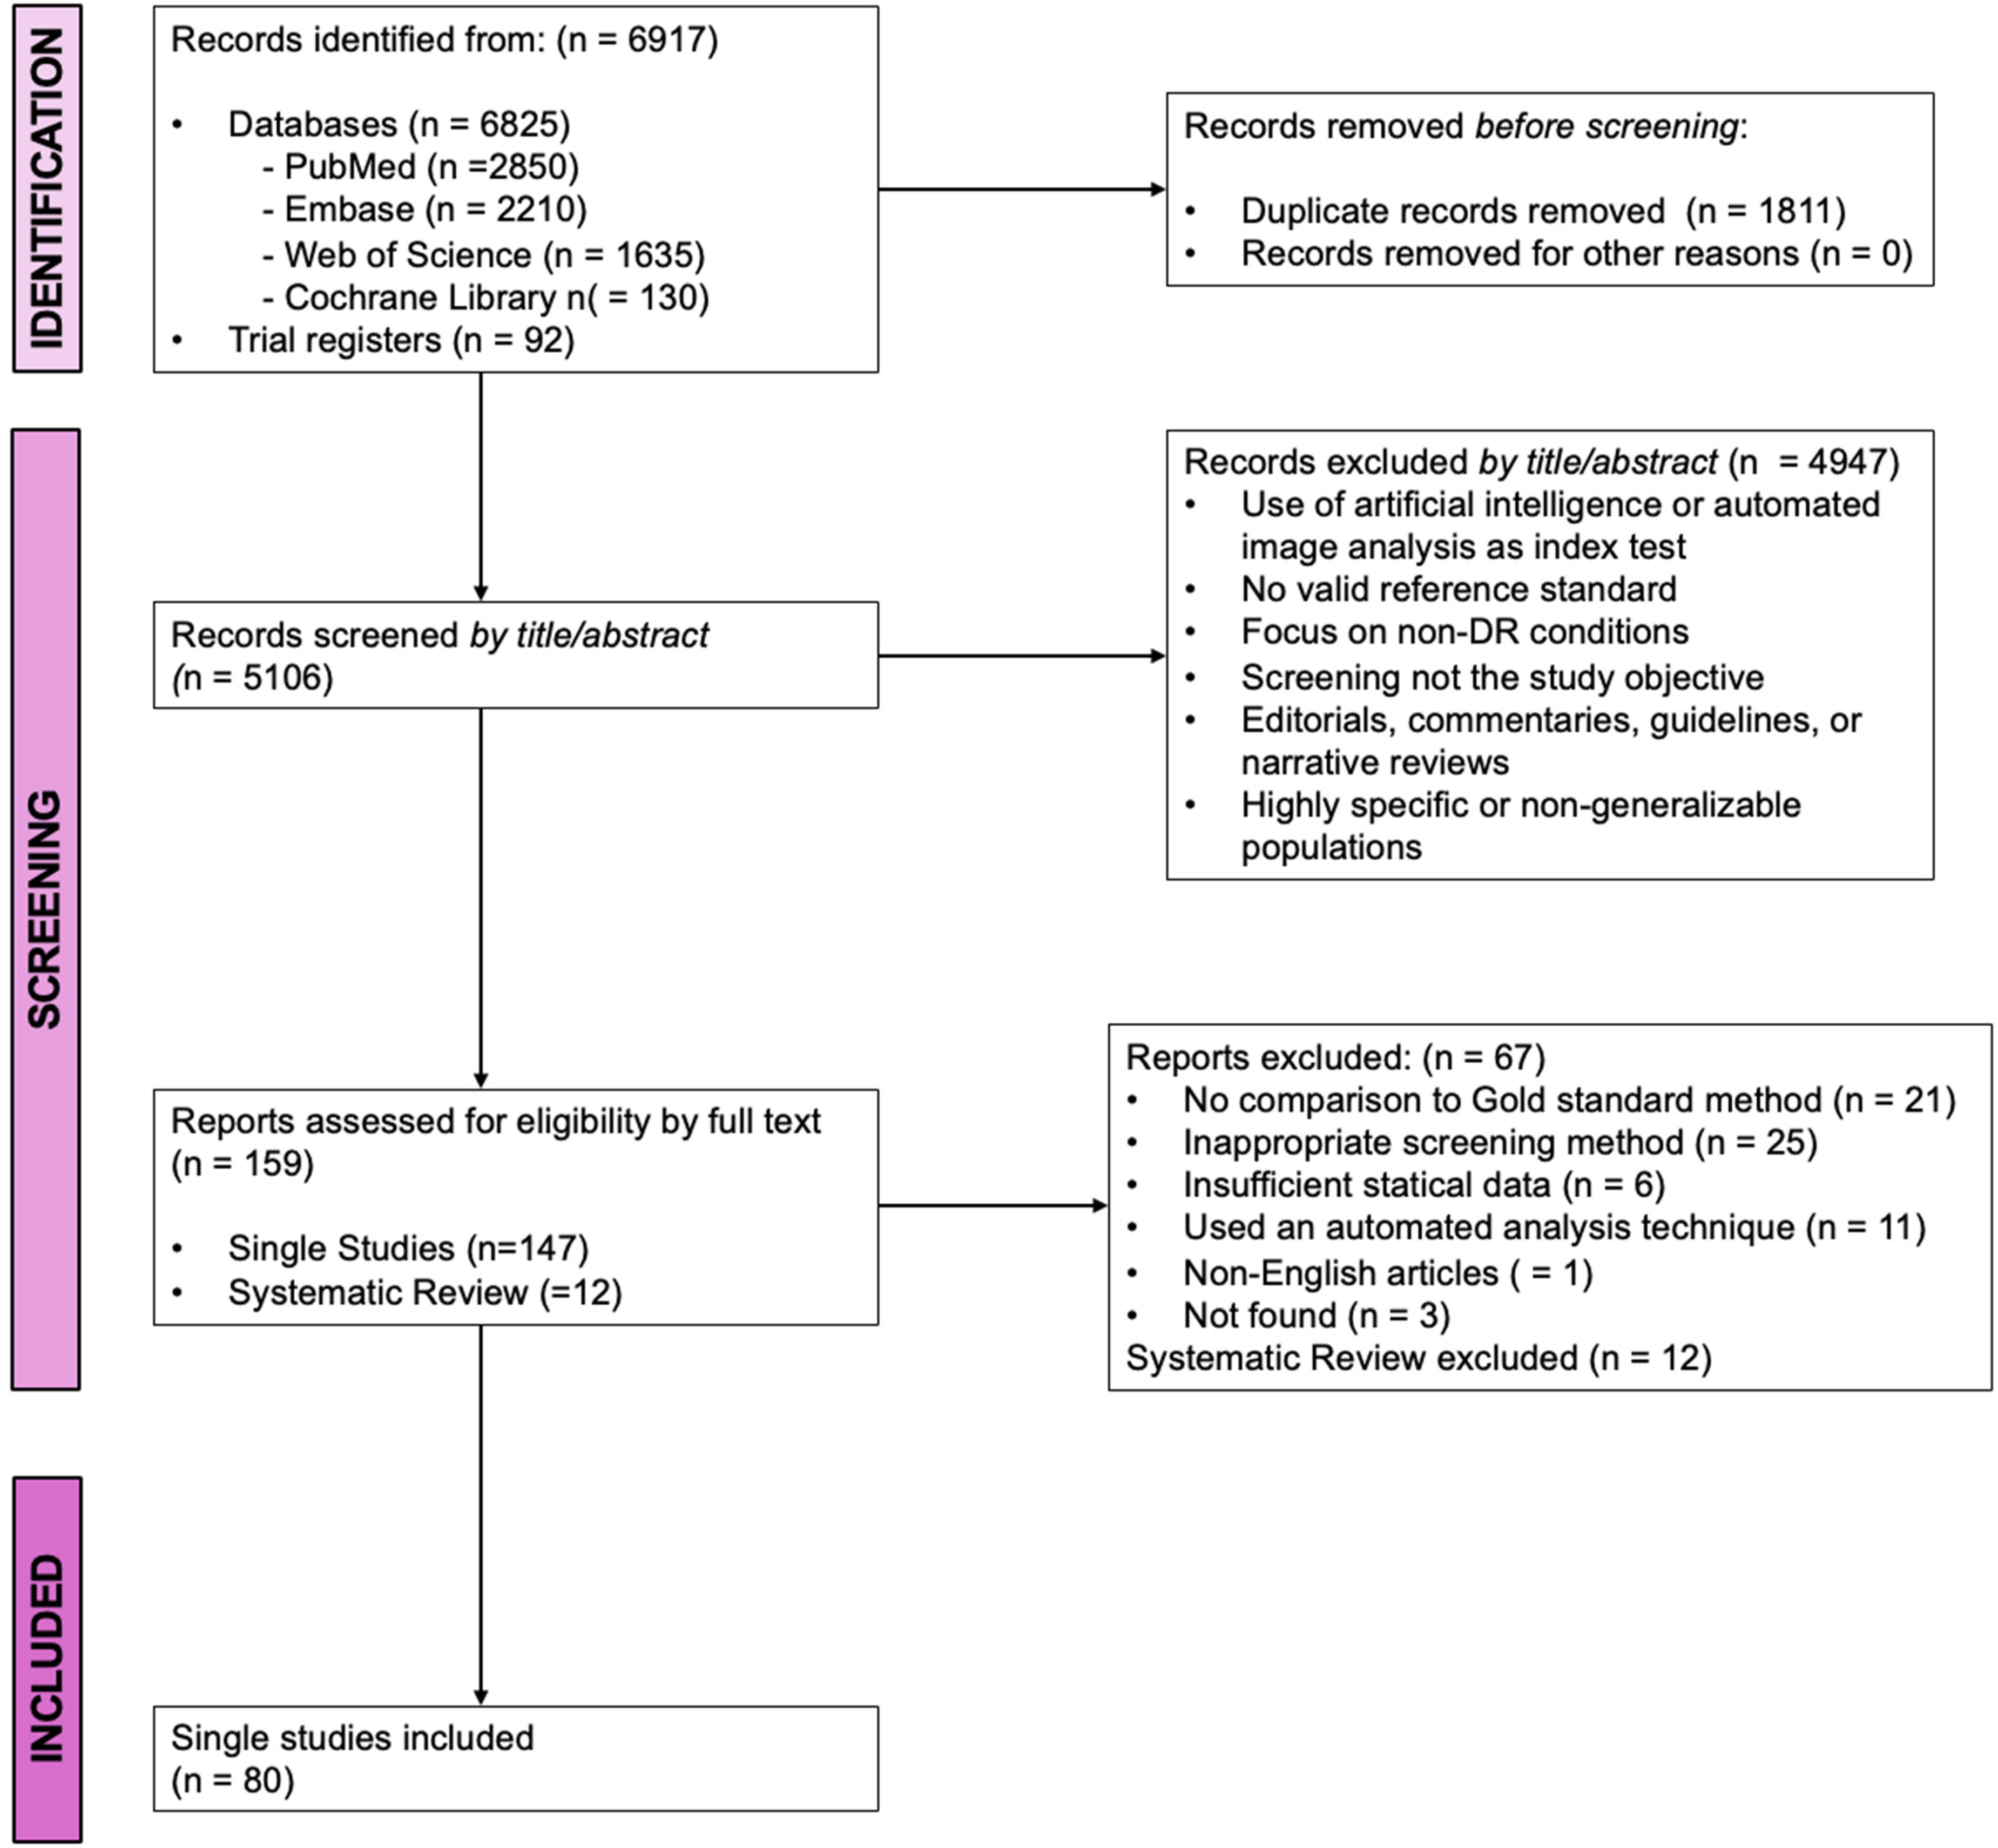
PRISMA flow diagram.
We identified a total of 6,917 records through systematic searches of bibliographic databases (n = 6,825) and trial registries (n = 92). After exporting all references into a Microsoft Excel spreadsheet, duplicates were identified and removed manually by comparing titles, authors, journal names, and year of publication (n = 1,811). 5106 unique titles/abstracts were screened independently by two reviewers (VD, MSP). Disagreements were resolved by discussion, and, when necessary, a third senior academic (GV) adjudicated. Of these, 4,947 records were excluded based on predefined eligibility criteria. Exclusion was applied only when sufficient information was clearly reported in the title or abstract to justify it. Records lacking clear exclusion criteria at this stage were retained for full-text assessment. Reasons for exclusion at title/abstract screening were not systematically quantified, as records were excluded only when clearly ineligible based on predefined criteria.
A total of 159 full-text reports were assessed for eligibility, comprising 147 primary studies and 12 systematic reviews. Of these, 67 reports were excluded for the following reasons: absence of a gold standard comparison (n = 21), use of ineligible screening methods (n = 25), insufficient statistical data (n = 6), use of automated image analysis as primary screening method (n = 11), non-English language (n = 1), and irretrievable full text (n = 3). A total of 80 single studies were included in the final review.
Risk of bias across studies
Methodological quality varied considerably, particularly in the patient selection domain. In fact, the main source of bias was related to patient selection, where 20 studies were judged at high risk due to purposive, feasibility-based, or convenience sampling, and 24 studies had unclear risk due to insufficient reporting on recruitment methods or exclusion criteria. The index test domain was rated at low risk in 74 studies, with six studies having unclear risk due to unreported masking of image grading. For the reference standard, 74 studies were at low risk and six were unclear, mainly because it was not clearly stated whether gold standard interpretation was performed independently of the index test. Flow and timing were low risk in 75 studies, with four studies judged at high risk due to inconsistent application of the reference standard or incomplete inclusion of participants. Regarding applicability, we judged that all studies had low concern. In the QUADAS-C assessment, five studies had high or unclear risk in patient selection, and one was rated at high risk in flow and timing due to partial verification and incomplete analysis.
Study demographics
Included studies varied in design, setting, population, and imaging protocol. Most were cross-sectional diagnostic accuracy studies, primarily conducted in community-based or outpatient screening settings, with some based in secondary or tertiary care. All studies enrolled adult participants (≥18 years) with a confirmed diagnosis of type 1 or type 2 diabetes mellitus undergoing DR screening through fundus photography. The reference standard was either dilated ophthalmoscopy or ETDRS 7-field photography. Index test protocols differed in terms of pupil dilation, number of photographic fields, device type, and grader qualifications.
Diagnostic accuracy: non-mydriatic vs. Mydriatic imaging (Any DR)
In a meta-analysis of eight studies (1744 cases out of 4510 screened subjects, 38.7%; Figure 3, Supplemental figure 1 and Supplemental figure 2) directly comparing non-mydriatic and mydriatic imaging for the detection of any diabetic retinopathy (Any DR), sensitivity was comparable between modalities (89% [95% CI: 76–95] vs. 90% [79–96]), with a small but statistically significant reduction in specificity for non-mydriatic imaging (85% [95% CI: 70–94] vs. 90% [78–96]; absolute difference −5%, 95% CI −9% to −1%). No significant interaction was found between mydriasis status and number of fields. Despite important heterogeneity across studies and imprecision in estimates, relative sensitivity 99% [95% CI: 97–100] and specificity 95 [95% CI: 91–99] suggest non-mydriatic imaging performs similarly in sensitivity but may produce more false positives.
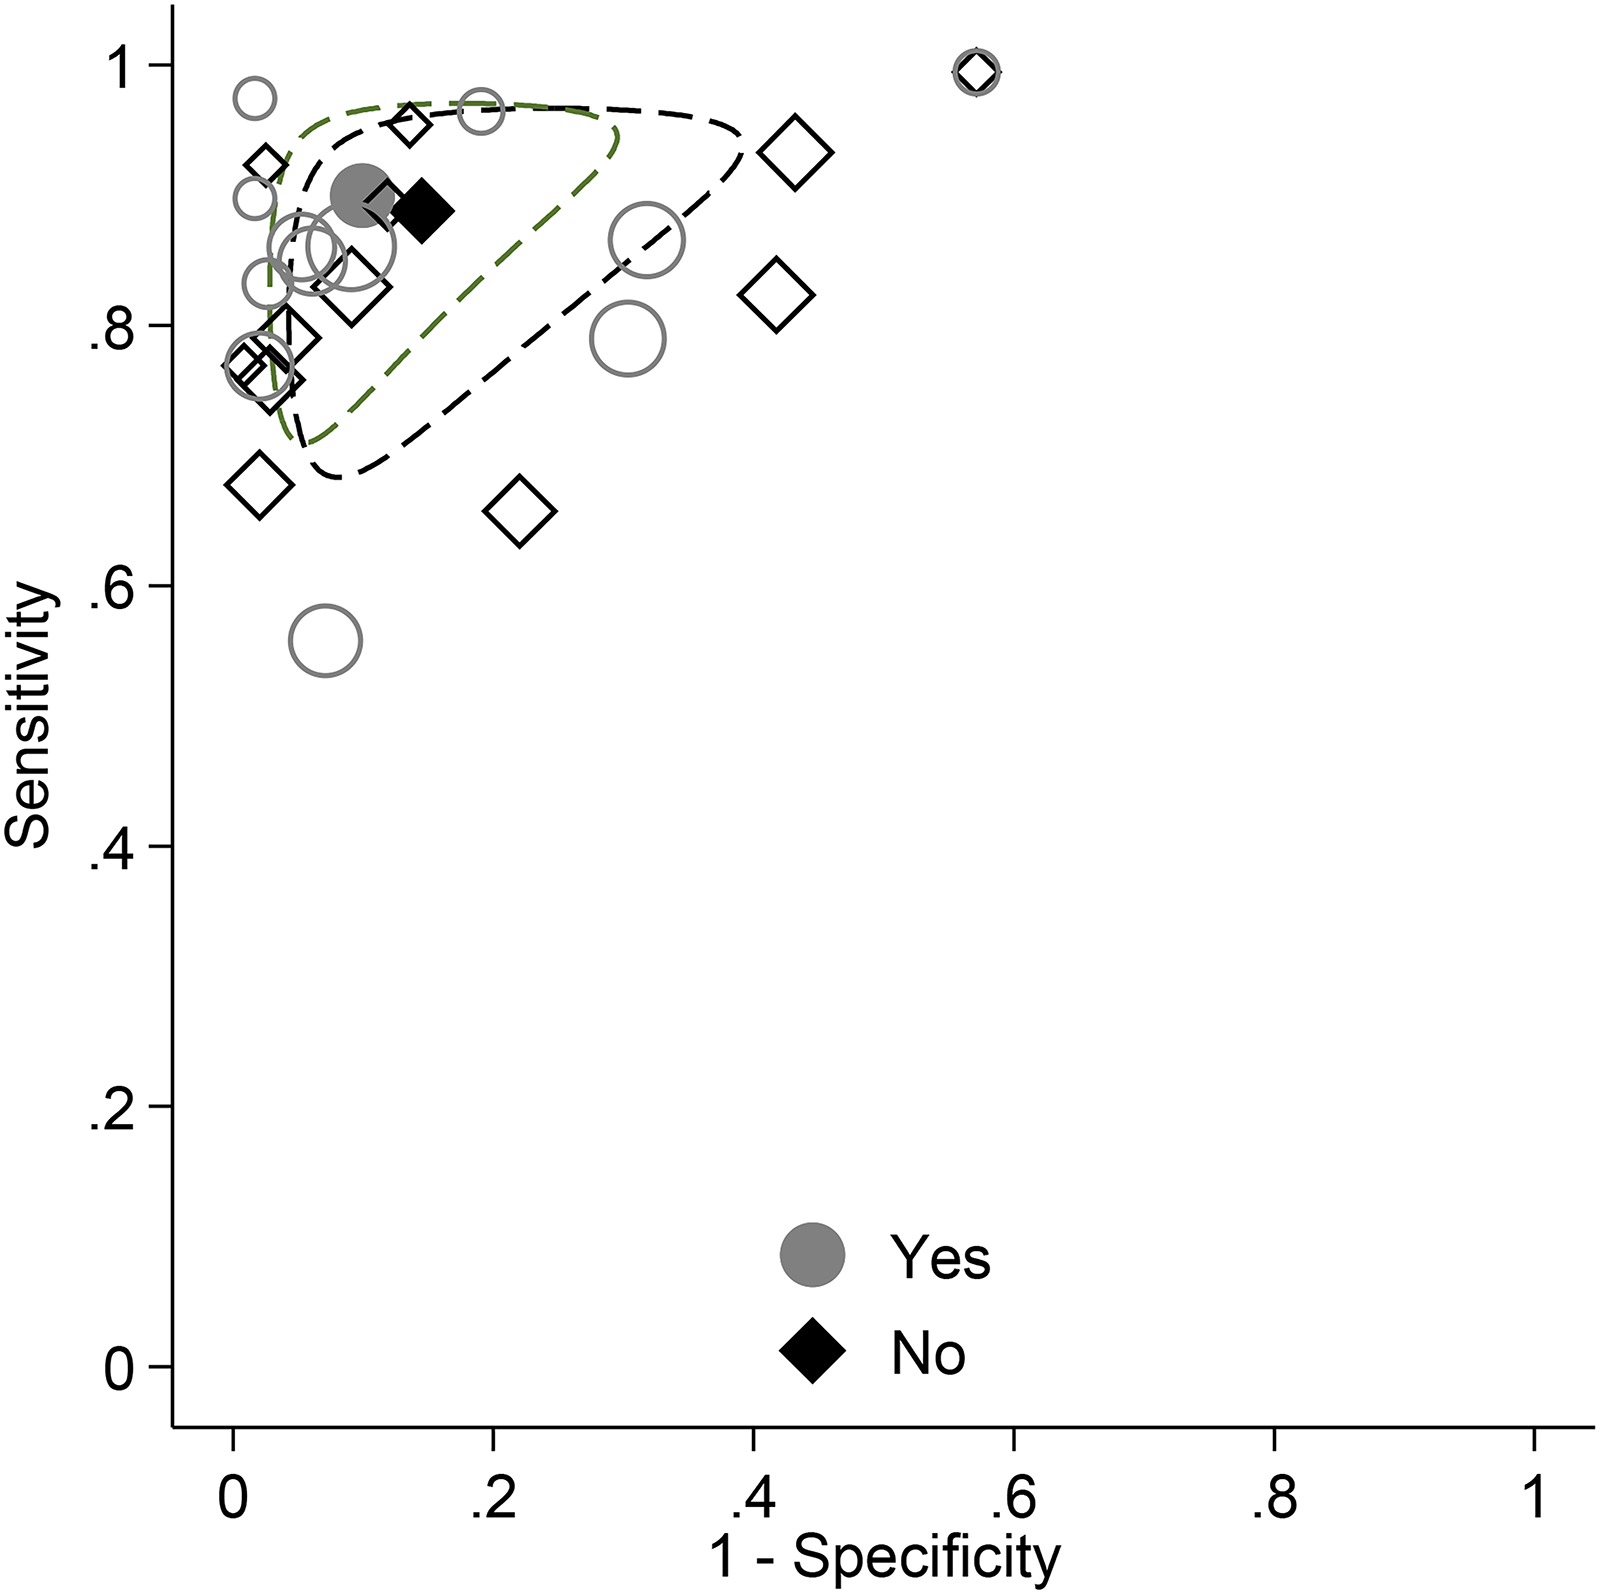
ROC plot with meta-analytic estimates and 95% confidence ellipses for direct comparisons of non-mydriatic (No) vs. mydriatic (Yes) imaging for detection of Any DR.
Supplementary Table 2 shows the impact of differences in accuracy according to mydriatic status at two levels of Any DR prevalence (30% and 60%). GRADE assessment rated the certainty of evidence as low, mainly due to heterogeneity and imprecision.
Diagnostic accuracy: non-mydriatic vs. Mydriatic imaging (STDR)
In a meta-analysis of six studies (623 cases among 2891 screened individuals, overall prevalence 21.5%; Figure 4, Supplemental Figure 3, supplementary Table 2), direct comparisons between non-mydriatic and mydriatic fundus imaging for the detection of sight-threatening diabetic retinopathy (STDR) showed a trend toward higher sensitivity with mydriatic imaging (70% [95% CI: 49–86] vs. 78% [95% CI: 58–90]) and significantly higher specificity (90% [95% CI: 79–95] vs. 94% [95% CI: 87–97]). Removal of an outlier study with poor diagnostic performance (Kim 2007) brought estimates more in line with findings for Any DR, confirming a slight advantage of mydriasis (Supplemental Figure 4). Despite variability in absolute accuracy, relative measures were more consistent across studies.
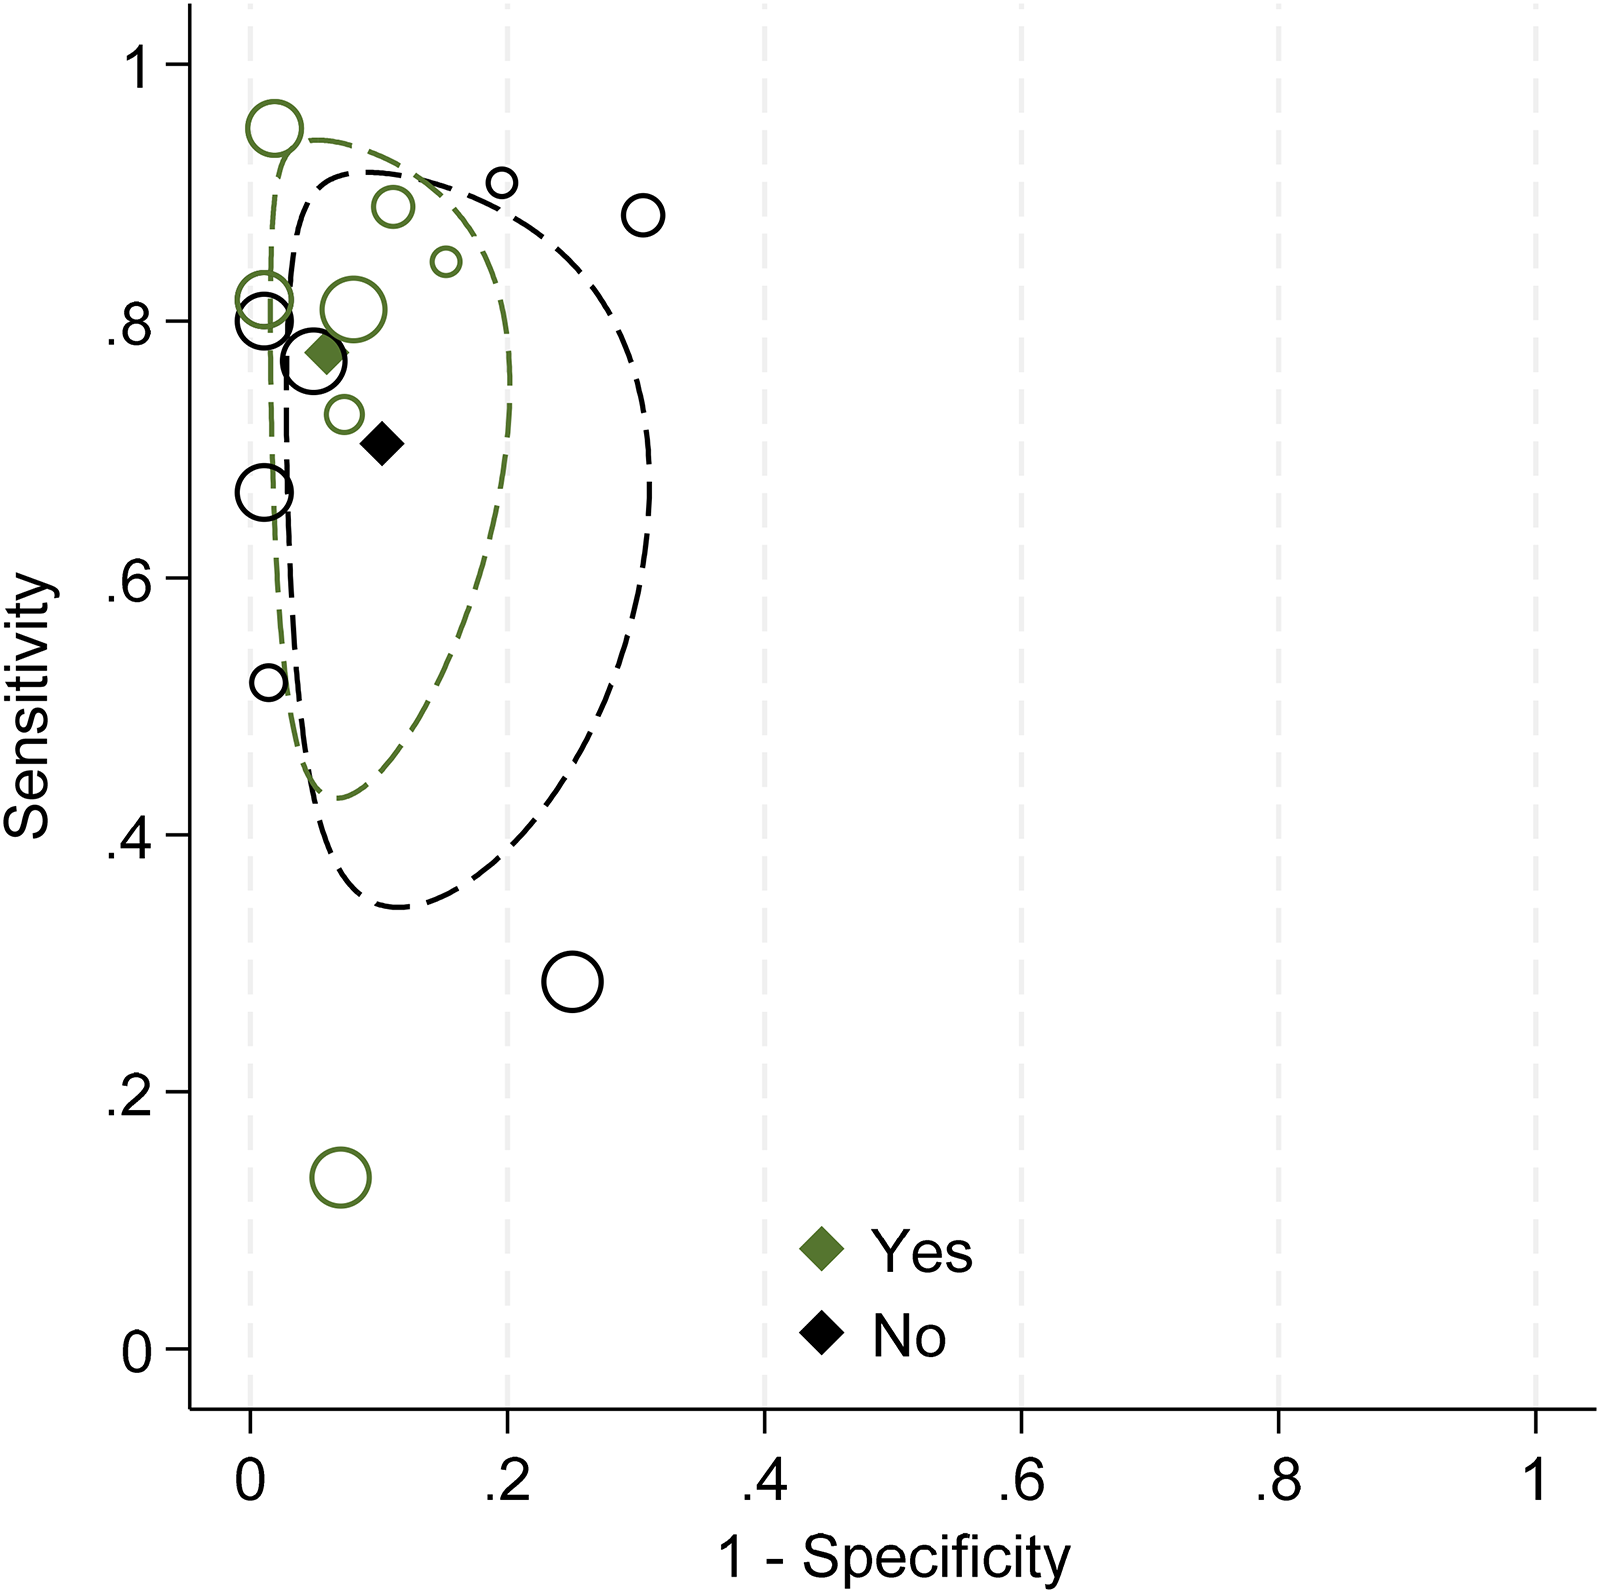
ROC plot with meta-analytic estimates and 95% confidence ellipses for direct comparisons of non-mydriatic (no) vs. mydriatic (Yes) imaging for detection of STDR.
Figure 4 shows the impact of differences in accuracy according to mydriatic status. supplementary table 2 presents the GRADE assessment, rating the certainty of evidence as low due to imprecision and heterogeneity, though no downgrades were applied for risk of bias or indirectness.
(Table 1).
Effect of number of photographic fields (indirect comparisons)
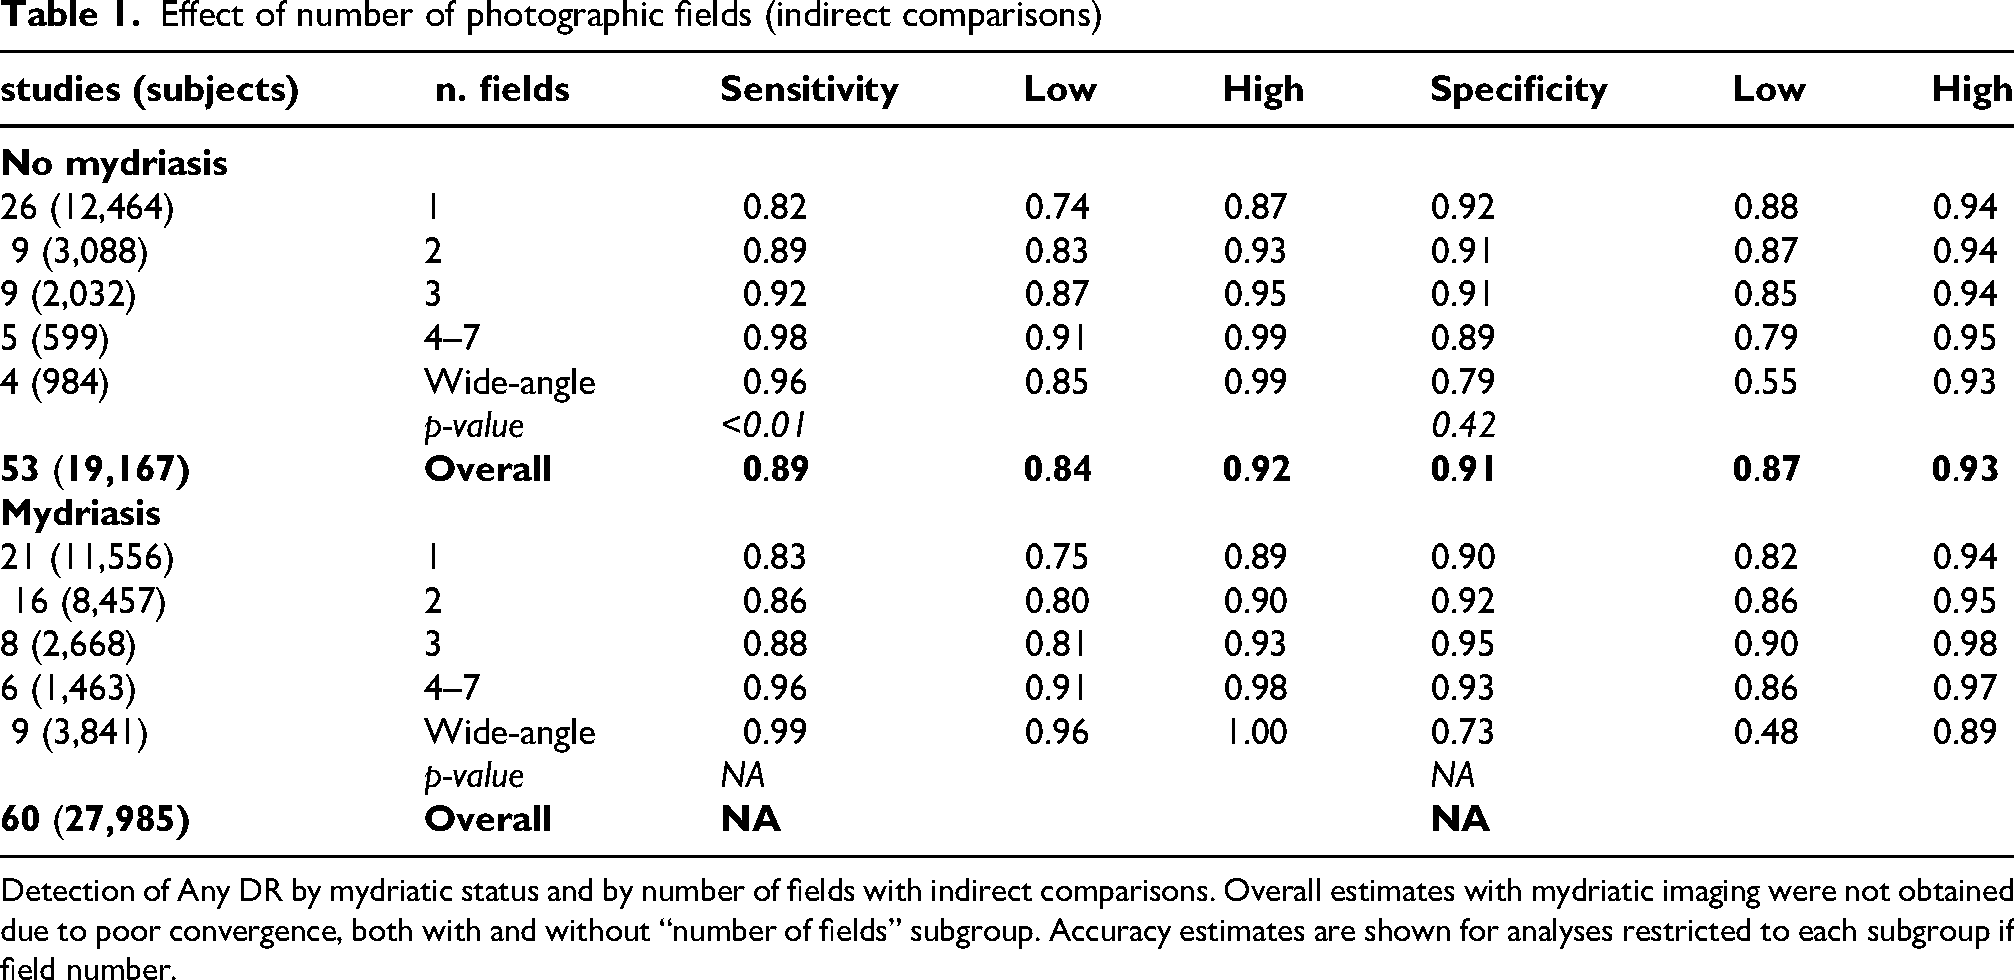
Detection of Any DR by mydriatic status and by number of fields with indirect comparisons. Overall estimates with mydriatic imaging were not obtained due to poor convergence, both with and without “number of fields” subgroup. Accuracy estimates are shown for analyses restricted to each subgroup if field number.
For this primary objective, we used the same dataset as for comparing mydriatic vs non-mydriatic imaging. In fact, though comparisons are not direct, they are fully adjusted by mydriatic status.
In an indirect comparison across 53 non-mydriatic and 61 mydriatic study arms, totalling over 46,000 subjects, both imaging modalities demonstrated comparable diagnostic performance for Any DR detection. Overall sensitivity and specificity were approximately 90%, with stratified analyses confirming the number of fields was the main driver of improved sensitivity.
Across studies using non-mydriatic imaging, diagnostic accuracy improved with increasing number of photographic fields (Figure 5, Supplemental figure 5). For detection of Any DR, sensitivity rose from 82% with one field (95% CI: 74–87) to 92% with three fields (95% CI: 87–95), and 98% with ≥4 fields (95% CI: 91–99). Specificity remained consistently high across all groups (>89%), except for wide-angle imaging, which demonstrated lower specificity (79%, 95% CI: 55–93). Meta-regression confirmed a statistically significant association between the number of fields and sensitivity (p < 0.01) and no significant association with specificity (p = 0.42).
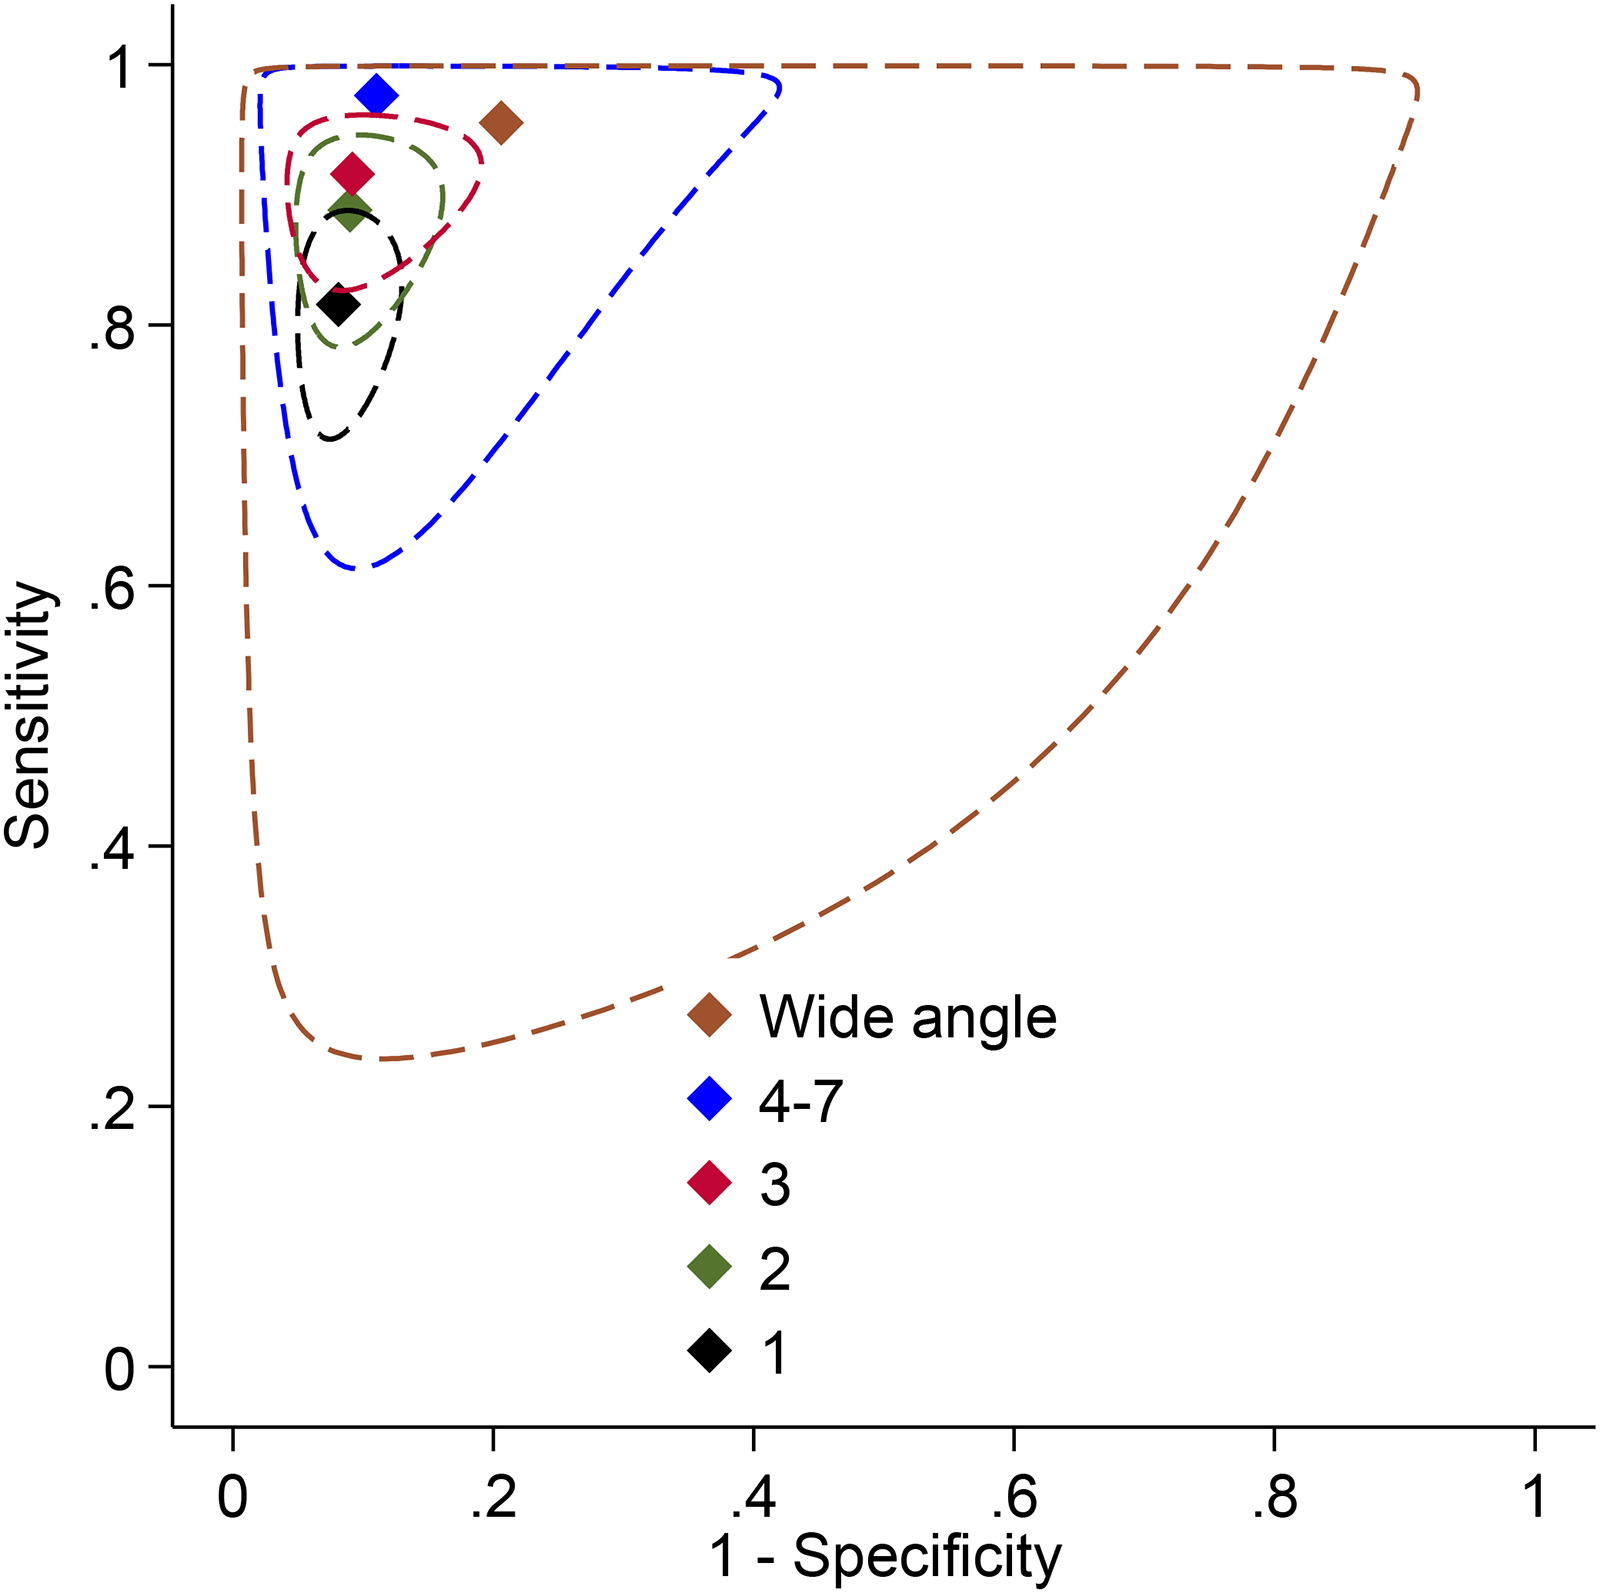
ROC plot with meta-analytic estimates and 95% confidence ellipses with non-mydriatic imaging for detection of any DR by number of fields.
In mydriatic imaging, sensitivity ranged from 83% (95% CI: 75–89) with a single field to 96% (95% CI: 91–98) with ≥4 fields, with consistently high specificity (>90%). Wide-angle imaging under mydriasis showed the highest sensitivity (99%, 95% CI: 96–100) but lower specificity (73%, 95% CI: 48–89) (Supplemental figure 6, Supplemental figure 7). Overall pooled estimates for mydriatic imaging were not calculated because the statistical models did not converge, likely due to the combination of high heterogeneity across studies and sparse data in certain subgroups. As a result, accuracy estimates were reported separately for each field number category.
In an indirect comparison across 32 non-mydriatic and 50 mydriatic study arms, including over 37,000 participants, both imaging modalities showed high diagnostic performance for STDR detection. Overall sensitivity ranged from 84% to 88% and specificity from 94% to 96%, with stratified analyses indicating the number of fields was again the principal factor associated with increased sensitivity.
For STDR detection, analyses stratified by number of fields showed sensitivity increased progressively with additional fields in both non-mydriatic and mydriatic imaging. In non-mydriatic protocols, sensitivity was 73% (95% CI: 61–83) with one field, 78% (95% CI: 64–87) with two fields, 83% (95% CI: 71–91) with three fields, and 96% (95% CI: 88–99) with four to seven fields. Wide-angle imaging had a sensitivity of 90% (95% CI: 82–95). Specificity remained consistently high across all categories (90–95%) (Supplemental figures 8 and 9).
(Table 2).
Detection of STDR by mydriatic status and by number of fields with indirect comparisons.
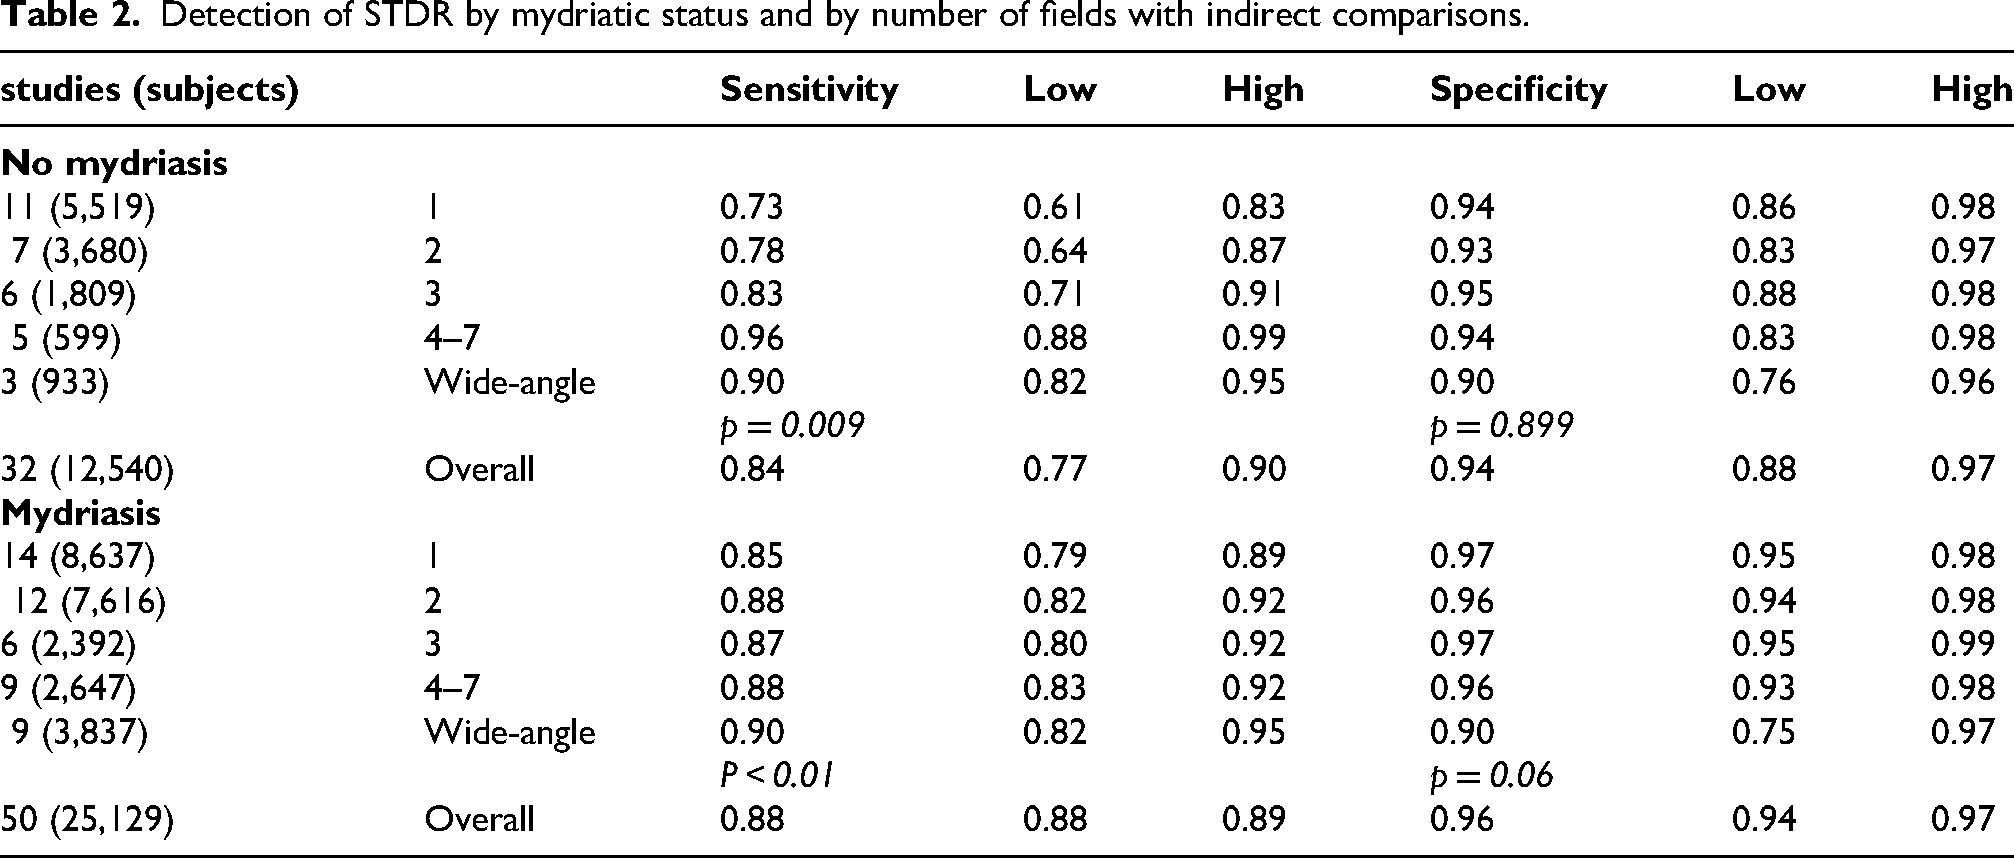
In mydriatic imaging, sensitivity estimates were similar across subgroups: 85% (95% CI: 79–89) with one field, 88% (95% CI: 82–92) with two fields, 87% (95% CI: 80–92) with three fields, and 88% (95% CI: 83–92) with four to seven fields. Wide-angle imaging showed the highest sensitivity (90%, 95% CI: 82–95) but a specificity of 90% (95% CI: 75–97). Specificity in other mydriatic subgroups was consistently high (>96%).
Meta-regression indicated a statistically significant association between the number of fields and sensitivity in both non-mydriatic (p = 0.009) and mydriatic imaging (p < 0.01) and a non-significant association with specificity.
Subgroup analyses
To further investigate potential sources of heterogeneity, we conducted subgroup analyses examining key methodological and technical factors with implications for screening implementation. Specifically, we analysed the impact of grader type (ophthalmologist vs. trained non-physician), the management of ungradable images (excluded vs. considered positive), camera type (handheld vs. stand-mounted), and reference standard modality (ETDRS 7-field photography vs. dilated ophthalmoscopy). These variables were selected for their potential influence on diagnostic performance and operational feasibility, and results are reported separately for Any DR and STDR, stratified by mydriatic status where applicable.
(Table 3).
In this analysis we compared type of screening grader/image assessment: ophthalmologist vs. trained reader (*) obtained from separate models
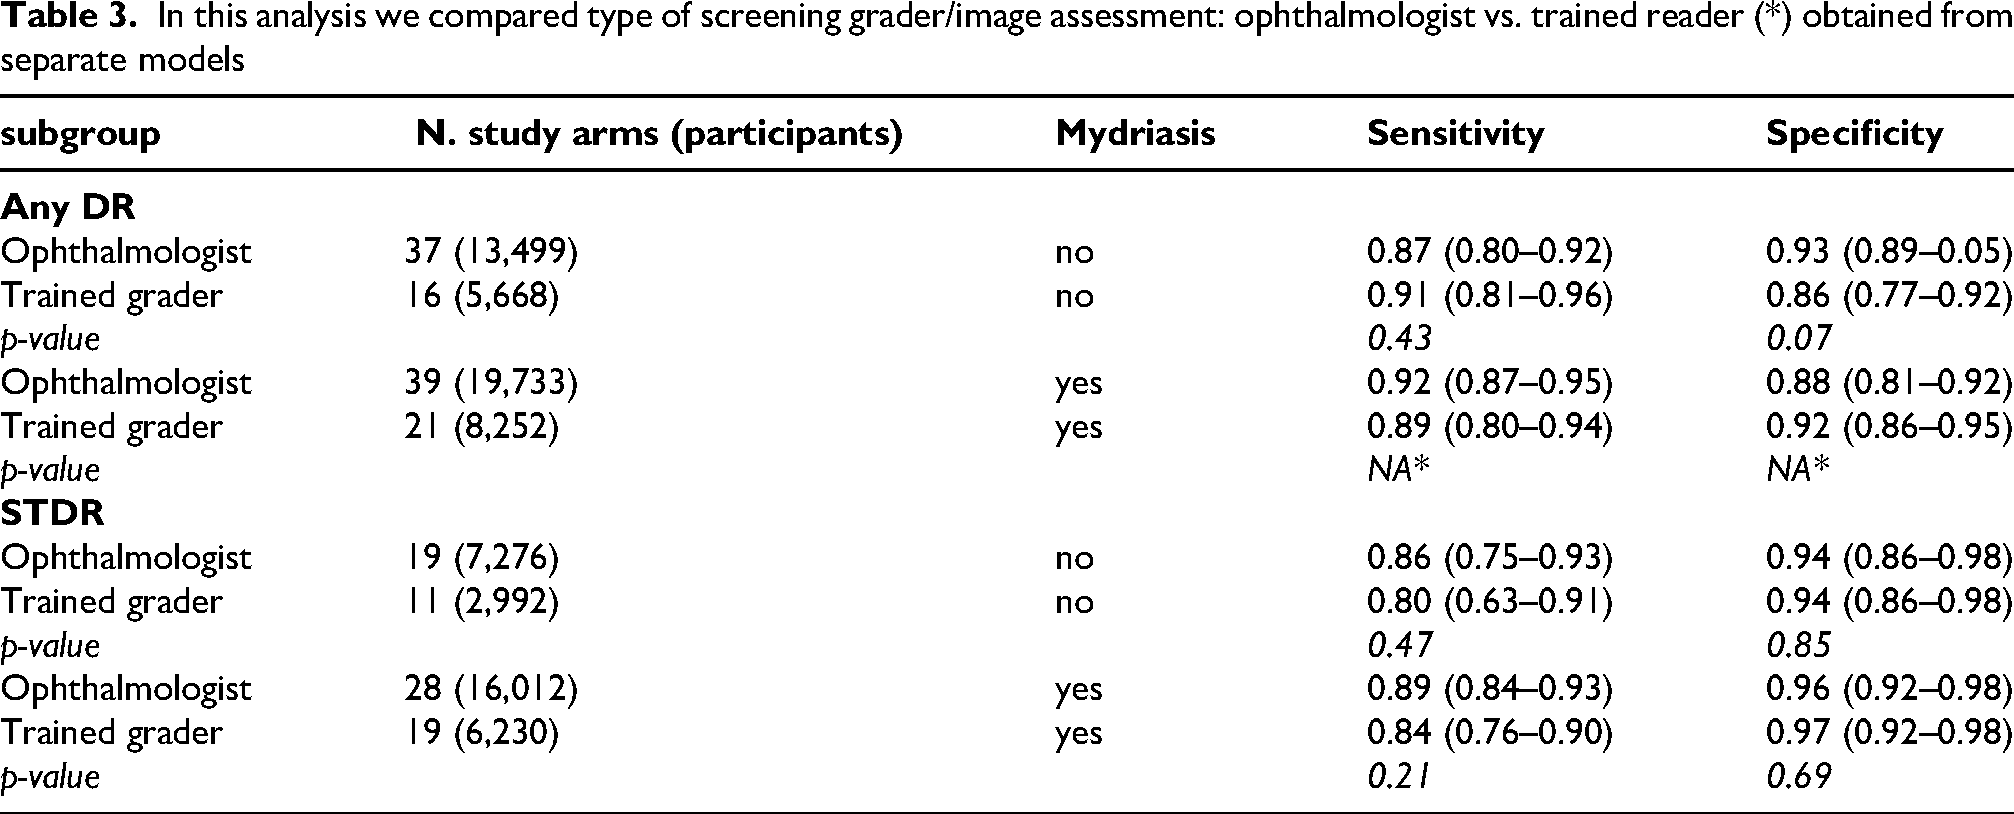
In analyses comparing the performance of ophthalmologists versus trained graders as screening readers, diagnostic accuracy for detecting Any DR and STDR showed only minor, non-significant differences (Table 3). For Any DR under non-mydriatic conditions, 37 study arms (13,499 participants) used ophthalmologists and 16 (5,668) used trained graders; for mydriatic imaging, the corresponding numbers were 39 and 21 study arms, respectively. Trained graders demonstrated slightly higher sensitivity, but lower specificity compared to ophthalmologists, though these differences did not reach statistical significance. For STDR detection, sensitivity was slightly lower for trained graders, while specificity remained similar, again with no statistically significant differences.
Indirect comparisons of diagnostic performance by screening grader (ophthalmologist vs. trained reader) are summarized in Table 4. For Any DR detection, with mydriatic imaging, sensitivity ranged from 89% to 92% across grader types, with no meaningful differences observed. Specificity was comparable (88–92%), and p-values could not be estimated.
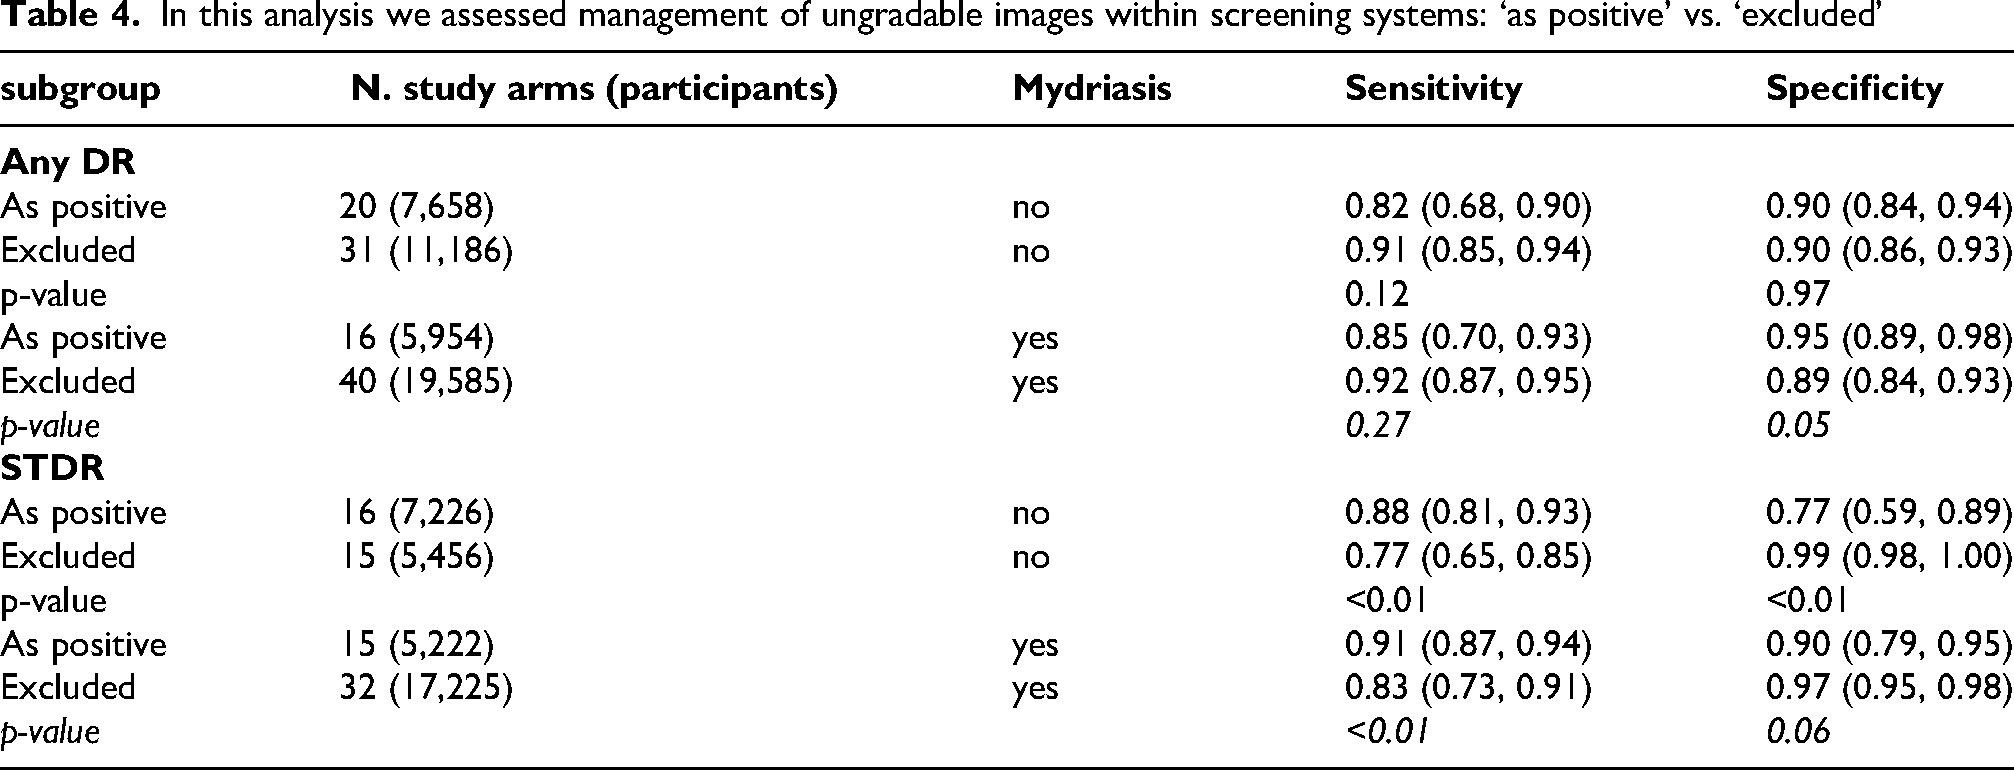
In this analysis we assessed management of ungradable images within screening systems: ‘as positive’ vs. ‘excluded’
For STDR detection with mydriatic imaging, sensitivity ranged from 84% to 89% and specificity from 96% to 97%, with no statistically significant differences between grader types (p > 0.20).
Type of reference standard grader: ophthalmologist vs. trained reader
In analyses stratified by type of reference standard grader (ophthalmologist vs. trained grader), no significant differences in diagnostic accuracy were observed for the detection of Any DR or STDR, under non-mydriatic conditions. For Any DR, 43 non-mydriatic study arms (16,388 participants) used ophthalmologists and 10 (2,779 participants) used trained graders; for mydriatic imaging, the respective numbers were 43 and 17 study arms. Similarly, for STDR detection, 67 non-mydriatic studies (28,174 participants) and 17 (4,995) used ophthalmologists and trained graders, respectively.
For Any DR detection in non-mydriatic imaging, sensitivity was nearly identical between ophthalmologists (88%, 95% CI 82–92) and trained graders (89%, 95% CI: 74–96), with no significant differences neither in sensitivity or in specificity. In mydriatic imaging, sensitivity was slightly higher when ophthalmologists graded the reference standard (92%, 95% CI: 88–94) compared to trained graders (88%, 95% CI: 0.81–0.93), with the difference reaching statistical significance (p < 0.01), while specificity was similar across groups (88 vs. 93%).
For STDR detection, sensitivity was similar between grader types in both non-mydriatic (ophthalmologists: 87%, trained graders: 83%) and mydriatic imaging (89% vs. 90%), with no statistically significant differences. Specificity ranged from 91% to 95% across subgroups and also did not differ significantly between ophthalmologists and trained graders (p > 0.20).
Management of ungradable images: excluded vs. considered positive
Indirect comparisons assessing the impact of ungradable image handling on diagnostic performance are presented in Table 4. For Any DR detection with non-mydriatic imaging, studies excluding ungradable images reported higher sensitivity (91%, 95% CI 85–94) compared to studies treating them as positive (82%, 68–90), although the difference did not reach statistical significance. Specificity was virtually identical between the two approaches. In mydriatic imaging, sensitivity was also higher when ungradable images were excluded (92%, 87–95) compared to treating them as positive (85%, 70–93), while specificity was slightly lower (89 vs 95%), with a borderline significant difference (p = 0.05).
For STDR detection, excluding ungradable images was associated with significantly lower sensitivity in non-mydriatic imaging (77% vs 88%; p < 0.01) and higher specificity (99% vs 77%; p < 0.01). In mydriatic imaging, sensitivity was again significantly lower when ungradable images were excluded (83% vs 91%; p < 0.01), while specificity was higher (97% vs 90%; p = 0.06).
Camera type: handheld vs. Stand-mounted
For Any DR detection under non-mydriatic conditions, diagnostic accuracy was similar for handheld vs. stand mounted cameras (Table 5). In mydriatic imaging, sensitivity was lower for handheld devices compared to desktop cameras, while specificity was slightly higher for handheld cameras. However, due to model limitations, p-values were not calculated for this subgroup.
In this analysis we assessed type of camera: hand-held vs. desktop.
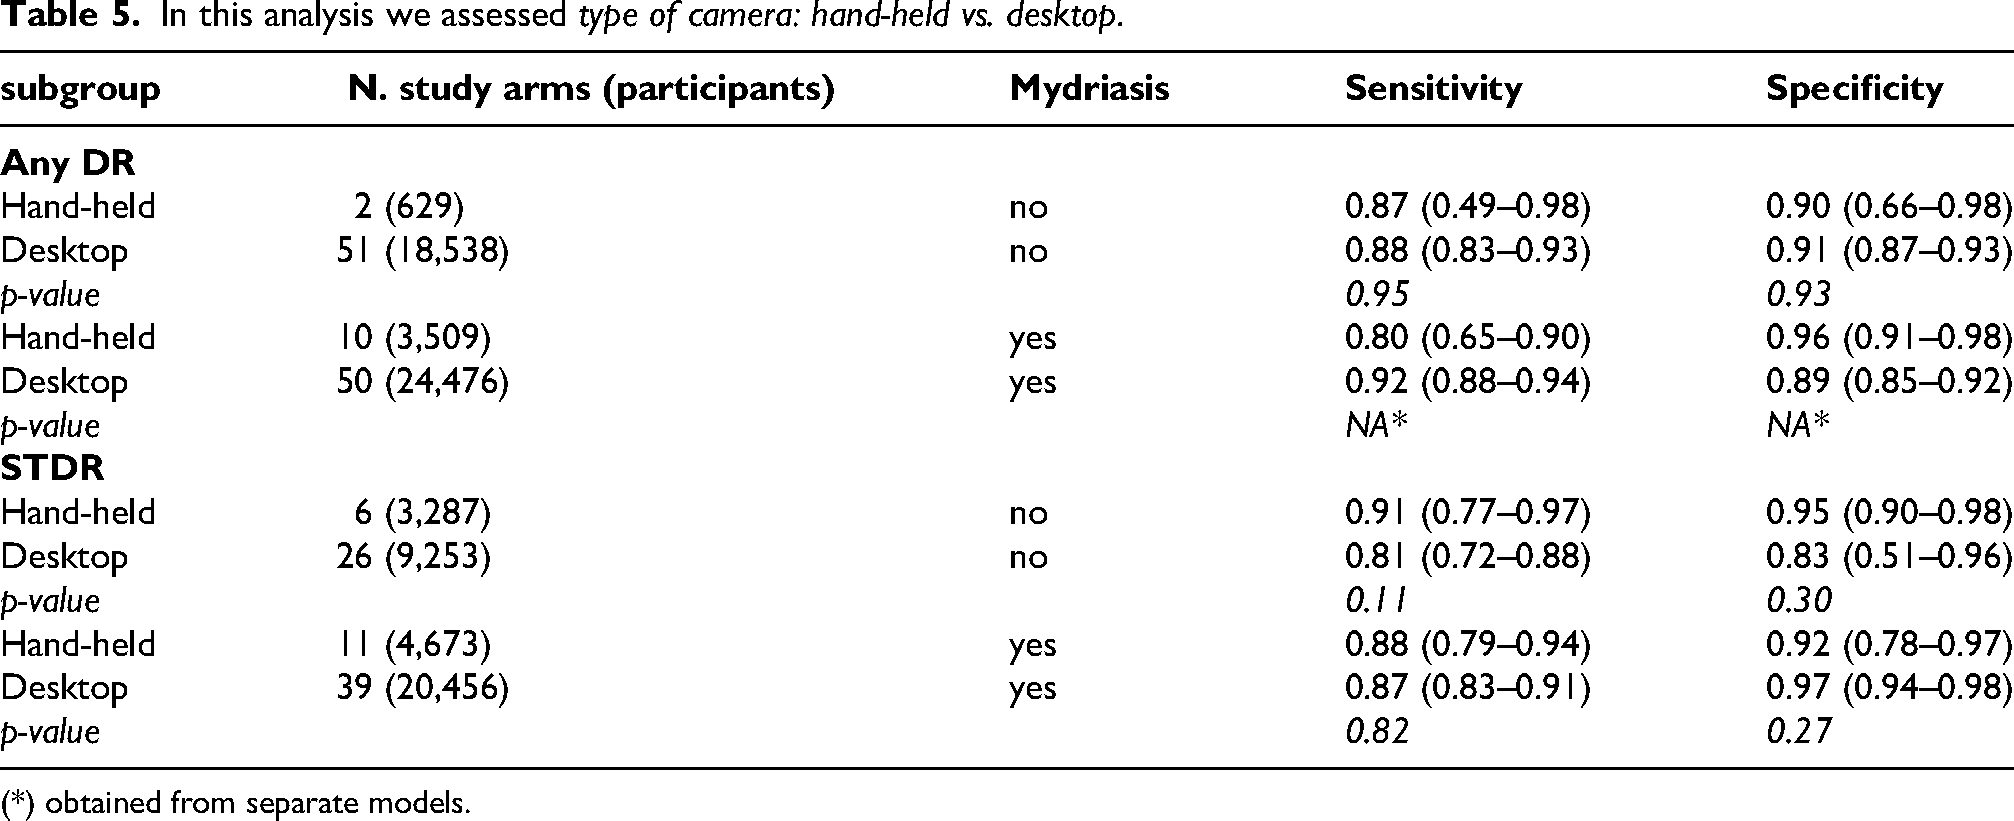
(*) obtained from separate models.
For STDR detection, non-mydriatic handheld cameras showed higher sensitivity compared to desktops, though specificity was higher in desktop systems without statistically significant differences. In mydriatic imaging, sensitivity and specificity were broadly comparable between handheld and desktop cameras, with no significant differences.
Type of reference standard: ophthalmoscopy vs 7-field photography
In subgroup analyses evaluating the impact of the reference standard used for disease ascertainment—direct ophthalmoscopy versus 7-field stereoscopic photography—diagnostic accuracy for Any DR and STDR was examined across 32 and 33 study arms using ophthalmoscopy, and 21 and 27 using photography, respectively, under non-mydriatic and mydriatic conditions (Supplemental Table 4).
For Any DR detection with non-mydriatic imaging, sensitivity was slightly higher when 7-field photography was used as reference (0.92, 95% CI 0.85–0.92) compared to ophthalmoscopy (0.86, 0.78–0.91), while specificity was similar (0.88 vs. 0.92). These differences did not reach statistical significance. In mydriatic imaging, sensitivity was again numerically higher with 7-field photography (0.95, 0.90–0.98) compared to ophthalmoscopy (0.87, 0.82–0.91), but due to model limitations, formal comparisons could not be performed for this subgroup.
For STDR detection, sensitivity was slightly lower when 7-field photography was the reference in non-mydriatic imaging (0.77 vs. 0.89) and specificity was higher (0.96 vs. 0.91), though differences were not statistically significant. In mydriatic imaging, estimates were similar across reference standards, with sensitivity ranging from 0.89 to 0.86 and specificity from 0.97 to 0.95.
Additional subgroup analyses for variables not directly related to photographic methods: geographic area, setting, publication year, risk of bias of studies
Subgroup analyses explored heterogeneity by region, clinical setting, publication year, and study risk of bias (Supplemental Table 5). For Any DR detection, studies conducted in Europe and North America reported higher sensitivity (93%, 95% CI 88–96) compared to those from Asia, Middle East, and Australia (<87%). Specificity was consistently high between 89% to 92%. However, these differences were not statistically significant (p = 0.21 for sensitivity; p = 0.95 for specificity).
Sensitivity for any DR detection was significantly higher in studies performed in secondary care settings compared to primary care (95 vs. 82, p < 0.01), while specificity was higher in primary care settings (93 vs. 86, p = 0.01).
For STDR detection, the difference in sensitivity between settings was smaller (88% in secondary care vs. 84% in primary care, p = 0.32), but specificity remained significantly higher in primary care studies (99% vs. 92%, p < 0.01).
When stratified by publication period, studies published after 2010 showed higher sensitivity for Any DR (95, 95% CI 91–97) compared to those published before 2010 (86%, 95% CI 81–91; p = 0.01), but slightly lower specificity (85 vs. 93%, p = 0.02).
Finally, risk of bias assessments among non-mydriatic studies of Any DR showed modest differences. Sensitivity estimates ranged from 86% (low risk) to 93% (high risk), and specificity ranged from 88% to 92% (high risk - low risk respectively), with no significant differences between risk of bias categories (p = 0.30 for sensitivity; p = 0.70 for specificity).
Discussion
Our systematic review found good diagnostic accuracy of fundus photography for both any DR and sight-threatening DR (STDR) based on a meta-analysis of studies, published between 1986 and 2023. Our pooled analysis confirmed pharmacologic dilation improves the diagnostic accuracy of fundus photography for diabetic retinopathy. While sensitivity for detecting any DR was broadly comparable between mydriatic and non-mydriatic protocols, specificity was consistently higher in dilated examinations, and the rate of ungradable images was markedly reduced. Regarding STDR detection, accuracy was lower and even more imprecisely estimated. Thus, methods that maximise the diagnostic performance should be adopted for this target condition, such as obtaining at least two fields with mydriatic imaging.
Estimates of diagnostic accuracy were imprecise, and the certainty of evidence was rated as ‘low’ for both sensitivity and specificity, mainly due to heterogeneity and imprecision. These apparent limitations may arise from having included studies conducted in very different settings, including ethnically different populations and including low and middle-income countries. Therefore, contextualising our accuracy estimates to specific settings should be done with caution and considering the effect of influential correlates of higher performance. Our results also showed that there seemed to be a shift with better sensitivity and lower specificity in more recent studies which could be due to improved training and wider photographic fields, with the final go to maximise case capture.
Among subgroup analyses that impact DR screening, service implementation and performance, we found no evidence that trained graders are less accurate than ophthalmologists for detecting Any DR or STDR. In fact, estimates were similar or suggestive of threshold effects. The evidence on hand-held cameras was substantially less than that on desktop cameras. These comparisons suggested either threshold effects (i.e., differences limited to the balance of sensitivity and specificity) or favoured hand-held cameras in terms of point estimates. Handheld cameras, due to their portability and lower cost, are particularly valuable for expanding DR screening in primary care and underserved settings. While desktop cameras remain the gold standard in high-throughput clinics, advances in handheld technology and operator training have minimized performance gaps. The choice of device should consider local resources, screening goals, and the need for accessibility. Studies in primary vs. secondary care were also less sensitive and significantly more specific than those in secondary care both for detecting Any DR and STDR. Studies published after 2010 also found better sensitivity and lower specificity compared to 1986–2009.
Our results largely agree with other systematic reviews, to which we added further evidence and further subgroup analyses, which can help contextualise our findings. The addition of peripheral fields or the use of ultra-wide-field imaging further increases sensitivity, particularly for detecting new vessels and peripheral lesions that may be missed by standard two-field protocols.39–41 Wide-field imaging can detect up to 30% more neovascularisations compared to two-field imaging, though specificity may be slightly reduced. 41 Within this study, our results showing lower specificity between 7-field and widefield photography means that current false positives are likely increased detection of peripheral lesions including microaneurysms, haemorrhages and neovascularisation. There are conflicting results in the literature on grading widefield images in the same way as 7 field and 2 field photography due to the likelihood of finding additional pathology. Studies have found that ultra-widefield is useful in detecting unsuspected sight threatening DR which needs clinically referred. 42 One study showed a nearly 100% agreement between 7-field imaging and widefield using the Clarus device 43 while another study advises exercising caution when using ETDRS grading between 7-field and ultra widefield grading. 44
International guidance increasingly recommends two-field photography as sufficient for population-based DR screening, especially in primary care and telemedicine settings, due to its balance of diagnostic performance and operational feasibility.45,46 However, in high-risk populations, referral refinement or for research purposes, three or more fields or wide-field imaging may be preferred.39–41
Taken together, these results support the adoption of at least two-field protocols as the minimum standard for DR screening, consistent with international guidelines. This evidence reinforces the rationale for pragmatic strategies, such as two-field non-mydriatic imaging with rescue dilation for ungradable cases, which balance diagnostic yield, patient comfort, and program efficiency.
Other large-scale studies and meta-analyses have confirmed that trained graders—such as optometrists, nurses, or general physicians—can achieve diagnostic performance comparable to ophthalmologists. These findings support the feasibility of task-shifting in DR screening programs. The use of trained screeners has been successfully implemented in several national DR screening programs, such as in the UK and Iceland, where non-physician graders contribute to high-throughput screening with robust quality assurance systems.47,48 The slightly lower specificity observed in trained graders may reflect a conservative approach to minimize false negatives, a trend previously noted in comparative studies of grader performance. 49
Strengths
This is one of the most comprehensive and robust systematic reviewers on the various approaches to diabetic retinopathy screening which could help guide screening programmes. This study also offers subgroup analysis to answer important screening questions such as how to deal with ungradable image, accuracy of image analysis by multiple screener/graders and an analysis on tabletop versus standard desktop cameras.
Limitations
There are some limitations of the study methodology such as inclusion of older technology including ophthalmoscopy as a reference standard, lower quality of digital imaging and the inclusion of a broad range of technology employed, for example in digital cameras quality or type of reference standard. Nonetheless, we conducted extensive subgroup analyses that suggest limited differences in accuracy across these fields, ensuring comprehensive estimates and as robust a methodology as possible.
In conclusion, this systematic review and meta-analysis provide the most comprehensive comparative evaluation to date of photographic screening methods for DR, analysing multiple dimensions including pupil status, number of fields, camera type, and grader expertise. Our findings confirm the overall reliability of fundus photography as a screening tool, reinforce its role as the practical gold standard for DR detection, and provide robust evidence to inform the development of structured national DR screening programmes.
Continuous auditing of the screening performance is critical to ensure delivery with high, given the observed heterogeneity in accuracy across settings.
Supplemental Material
sj-docx-1-ejo-10.1177_11206721251406434 - Supplemental material for Comparative diagnostic accuracy of photographic methods for detecting diabetic retinopathy: A systematic review and meta-analysis
Supplemental material, sj-docx-1-ejo-10.1177_11206721251406434 for Comparative diagnostic accuracy of photographic methods for detecting diabetic retinopathy: A systematic review and meta-analysis by Valeria Dattilo, Maria Sole Polito, Mariacristina Parravano, Maria Carla Donati, Tunde Peto, Massimiliano Orso, Gianni Virgili and Laura Cushley in European Journal of Ophthalmology
Footnotes
Acknowledgements
We would like to thank Myra McGuinness for her help and support throughout the review.
ORCID iDs
Ethics
Not applicable.
Funding
The research for this paper for the IRCCS-Fondazione Bietti was financially supported by the Italian Ministry of Health and Fondazione Roma, Italy.
Declaration of conflicting interests
MP reports personal fees from Abbvie, Novartis, Bayer, Roche, Zeiss outside the submitted work. TP received speakers’ fee from Roche, Novartis, Boehringen-Ingelheim, Apellis, Abbvie, Optos, Optomed, Grant paid to Institution: Boehringen-Ingelheim - nonrelevant to current publication.
Data availability statement
Data are partly available in the manuscript and supplements; further data can be obtained from the authors by request
Supplemental material
Supplemental material for this article is available online.
References
Supplementary Material
Please find the following supplemental material available below.
For Open Access articles published under a Creative Commons License, all supplemental material carries the same license as the article it is associated with.
For non-Open Access articles published, all supplemental material carries a non-exclusive license, and permission requests for re-use of supplemental material or any part of supplemental material shall be sent directly to the copyright owner as specified in the copyright notice associated with the article.