
Abstract
Purpose
To describe the population characteristics, prevalence, and causes of visual impairment in Maltese adults aged 50–80 years.
Methods
The Malta Eye Study invited 4,006 random adults aged 50–80 for eye exams and interviews at the Malta and Gozo state hospitals (September 2021–July 2024). Tests included visual acuity, refraction, anthropometry, clinical measurements, tonometry, slit-lamp and dilated fundus exams, retinal imaging, and cognitive screening. Interviews covered sociodemographic, medical, ocular, and medication histories.
Results
A representative sample of 1,794 individuals (44.8% turnout) were assessed. Visual impairment in either eye was found in 23.9% (95%CI 21.9%–25.9%), and bilateral impairment in 6.0% (95%CI 4.9%–7.2%). The most common causes in either eye were uncorrected/undercorrected refractive error (12.3%), amblyopia (5.0%), cataract (3.8%), pathological myopia (1.3%), diabetic retinopathy (0.8%), age-related macular degeneration (0.6%), and glaucoma (0.4%). Predictors of visual impairment included older age, lower education, diabetes requiring insulin and tablets, and dementia. Protective factors were sunglasses use and angiotensin receptor blocker therapy.
Conclusions
Although overall visual impairment rates are favourable, this study highlights the need to strengthen screening and treatment services for avoidable causes, particularly by improving public optometry access, among older adults, socioeconomically vulnerable groups, and those with poorly controlled diabetes.
Keywords
Introduction
In 2020, global age-standardised prevalence of visual impairment (VI) in those aged ≥50 years was 1.85% for blindness, 11.18% for moderate-to-severe VI (MSVI), 7.73% for mild VI, and 22.33% for uncorrected presbyopia. 1 Eastern Europe had lower blindness (0.88%) but similar MSVI (11.5%), mild VI (4.56%), and higher presbyopia (30.6%), 1 with country-specific MSVI rates reported as 15.2% in Moldova 2 and 5.6% in Hungary 3 . Central Europe showed lower blindness (0.58%), MSVI (6.78%) and mild VI (2.75%) with presbyopia close to global levels (23.5%). 1 Western Europe reported low blindness (0.60%), MSVI (5.15%), mild VI (3.63%), and very low presbyopia (2.03%), and variation exists in MSVI rates between Northern (0.59% in Iceland, 4 0.66% in the UK 5 ) and Southern Europe (3.1% in Italy 6 ). Higher VI in Eastern than in Western Europe likely reflects differences in healthcare access.
A 1989 Malta report found 0.9% blindness and 9.3% MSVI in adults aged ≥40. 7 Among adults ≥18, the 2010 European Health Examination Survey (EHES) reported 1.1% low vision, while the 2008 and 2019/20 European Health Interview Survey (EHIS) recorded 0.8% blindness and 2.9% and 10.4% non-blind VI, respectively.8,9
Globally, the main causes of blindness are cataract (45.5%) and glaucoma (11%), followed by uncorrected/undercorrected refractive error (URE) (6.6%), age-related macular degeneration (ARMD) (5.6%), and diabetic retinopathy (DR) (2.5%).10–12 URE is the leading cause of MSVI (41%), followed by cataract (38.9%)10,12–15. In high-income countries, glaucoma is the leading cause of blindness (28.2%) and URE the leading cause of MSVI (44.5%)10–12. URE and cataract, being common and reversible, are classified by the World Health Assembly as “avoidable” causes of visual impairment. 16
Malta, a small island state in Southern Europe, has a densely growing and ageing population of 563,443. With a GDP per capita slightly above the EU average (109 vs 100 adjusted for purchasing power), 17 Malta is a high-income country. It has the highest prevalence of overweight and obesity (69.75%) 18 and one of the highest diabetes rates (10.31%) among EU states,18,19 both rising over the past 30 years. High UV radiation and air pollution,20,21 combined with age and diabetes 22 as key ocular risk factors, may influence VI prevalence.
Previous data on VI in Europe are over a decade old, while more recent data is scarce.2,3 With changing risk profiles and scarce recent national and European data, updated VI prevalence estimates, especially from small islands like Malta, are crucial for public health planning.
The Malta Eye Study (TMES) is a cross-sectional population-based study estimating the prevalence of common eye diseases and VI in Maltese adults aged 50–80. This paper presents the population's characteristics, VI prevalence, causes and predictors.
Method
TMES methodology, including sample size derivation from expected VI prevalence using the one-proportion confidence interval (CI) formula, is detailed elsewhere. 23 The target of 1,800 was feasible and sufficient for all estimates. The study followed the STROBE checklist ( Supplementary Table 1 ).
Ethical clearance and permissions
Ethical approval (FRECMDS_1819_94) was obtained from the University of Malta Faculty Research Ethics Committee before data collection. The study adhered to the Declaration of Helsinki and GDPR, with hospital and Data Protection Officer approvals. Informed consent was obtained and data pseudonymised.
Study population
A random sample of 4006 individuals aged 50–80 years, stratified by age, sex, and locality from the electoral register, was invited for ophthalmic assessment between September 2021 and December 2023. Invitations, sent 2–4 weeks prior in Maltese and English, included appointment details, contact information, and instructions. Reminders were made via phone or SMS, and participants could reschedule by phone or email. Participation was promoted through free hospital parking, flexible scheduling including late sessions, additional Gozo sessions, social media campaigns, television features, second recruitment calls, follow-up explanations of the study's importance and small incentives such as gifts and free refraction prescriptions. Hospital transport was offered to participants with limited mobility or access, though uptake varied due to waiting times when drivers collected multiple passengers.
Ophthalmic assessment
Examinations took place at Mater Dei (September 2021–May 2024) and Gozo General Hospital (June–July 2024). Vision testing included monocular presenting visual acuity (MPVA) via electronic ETDRS chart with distance glasses if available, expressed in logMAR; pinhole was performed if MPVA > 0.3. Best-corrected visual acuity followed autorefraction (Visionix®) and subjective refraction. Cognitive impairment prompted guidance, such as pointing to optotypes or examiner interpretation. Slit-lamp ocular exams included tonometry and dilated fundoscopy (90D lens). Imaging comprised colour fundus photography and swept-source optical coherence tomography (OCT, 3D wide, macula and optic disc). Anthropometrics included height and weight; clinical measures included capillary glucose and blood pressure. The questionnaire recorded sociodemographic, medical, ocular, and drug histories, plus cognitive screening (Quick Mild Cognitive Impairment Score).
Response rate and missing data
Of 1,794 participants (44.8% response), age–gender representativity was checked against national census data 24 using binomial and chi-squared tests; weights (population proportion/sample proportion) corrected minor under-representation (Supplementary Table 6). The questionnaire was completed by 1,786 participants. Missing data were minimal: 0.4% for most items, 0.2% for VI classification, 8.1% for education (post-survey calls), 4.8% for autorefraction, and 2.3% for anthropometry.
Definitions used
VI was defined per ICD-11 using monocular presenting visual acuity (MPVA): any VI if MPVA > 0.3 in ≥1 eye; bilateral VI (VIOU) if MPVA > 0.3 in the better eye; unilateral VI if MPVA > 0.3 in one eye and ≤0.3 in the fellow eye. Severity (better eye or affected eye for unilateral VI) was mild (MPVA > 0.3–0.5), moderate-to-severe (MSVI; MPVA > 0.5–1.3), or blindness (MPVA > 1.3). Near VI was presenting near vision worse than N6 at 40 cm. Other definitions are in Table 1's legend. Causative pathologies were examiner-identified; URE was classified regardless of lens status and counted if pinhole improved MPVA to ≤0.3.
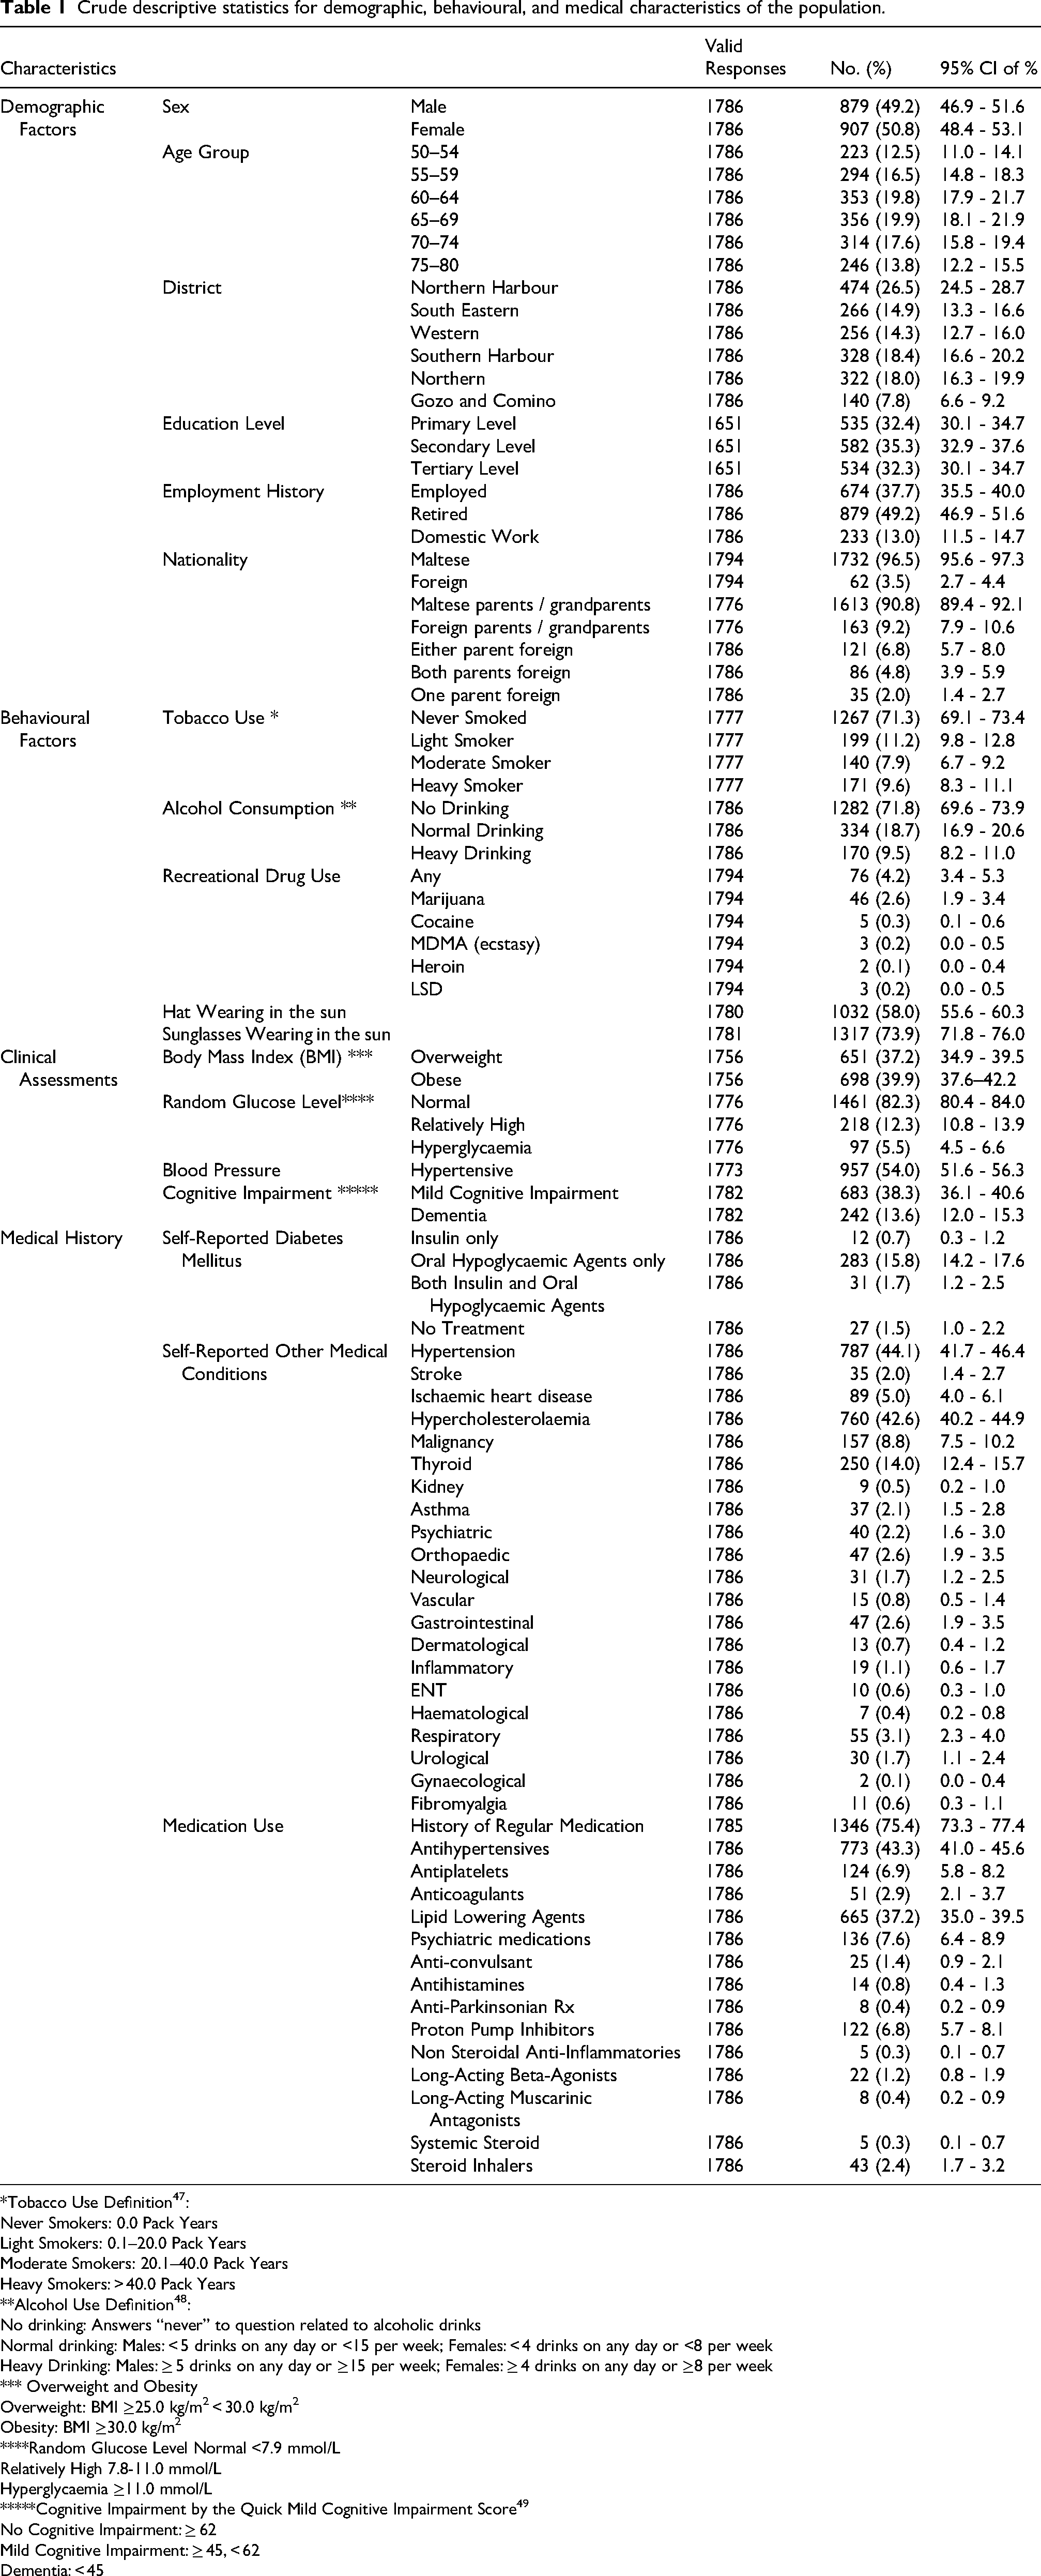
Crude descriptive statistics for demographic, behavioural, and medical characteristics of the population.
*Tobacco Use Definition 47 :
Never Smokers: 0.0 Pack Years
Light Smokers: 0.1–20.0 Pack Years
Moderate Smokers: 20.1–40.0 Pack Years
Heavy Smokers: > 40.0 Pack Years
**Alcohol Use Definition 48 :
No drinking: Answers “never” to question related to alcoholic drinks
Normal drinking: Males: < 5 drinks on any day or <15 per week; Females: < 4 drinks on any day or <8 per week
Heavy Drinking: Males: ≥ 5 drinks on any day or ≥15 per week; Females: ≥ 4 drinks on any day or ≥8 per week
*** Overweight and Obesity
Overweight: BMI ≥25.0 kg/m2 < 30.0 kg/m2
Obesity: BMI ≥30.0 kg/m2
****Random Glucose Level Normal <7.9 mmol/L Relatively High 7.8-11.0 mmol/L Hyperglycaemia ≥11.0 mmol/L *****Cognitive Impairment by the Quick Mild Cognitive Impairment Score 49
No Cognitive Impairment: ≥ 62
Mild Cognitive Impairment: ≥ 45, < 62
Dementia: < 45
Distance effective refractive error coverage (eREC) was the proportion achieving MPVA ≤ 0.3 among those with refractive error; near eREC was analogous for N6. 25 Effective cataract surgical coverage (eCSC) was the proportion of cataract-operated eyes achieving postoperative MPVA ≤ 0.5 among cataract-related VI cases. 26
Statistical analysis
Analyses used IBM SPSS® v23. Demographics were compared with census data. Descriptive statistics provided prevalence estimates with 95% CIs; crude prevalences described population characteristics. Age- and gender-adjusted prevalences were calculated via direct standardisation. Categorical VI predictors were tested with Chi-square or Fisher's exact tests (Supplementary Tables 2–5). Significant univariate predictors (p < 0.05) entered backward stepwise binary logistic regression (Wald test), with absence of VI as reference; final steps were presented. Minimal missing data, unrelated to VI, were handled by listwise deletion without imputation.
Results
Baseline population characteristics
Participants completing the full ophthalmic examination had a mean age of 64.8 years (SD 8.0). Compared with the national 50–80-year census population (mean 63.8, SD 8.4), the sample was representative for age, gender, and district (all p > 0.05) overall but underestimated males (p < 0.001) and females (p = 0.009) aged 50–59 in the Northern Harbour, and females 50–59 in Gozo (p = 0.004); weighting corrected these discrepancies (Supplementary Data Table 6).
Overweight and obesity affected 698 individuals (77.0%; 95%CI 75.0–79.0%), 97 persons (5.5%; 95%CI 4.5–6.6%) were hyperglycaemic, and 957 persons (54.0%; 95%CI 51.6–56.3%) were hypertensive. Cognitive impairment was present in 925 individuals (51.9%; 95% CI 49.6–54.3%) (Table 1).
Hypertension (44.1%, 95%CI 41.7%-46.4%), hypercholesterolemia (42.6%, 95%CI 40.2%-44.9%) and diabetes (19.8%, 95%CI 17.9%-21.7%) were the commonest self-reported medical conditions while antihypertensives (43.3%, 95%CI 41.0%-45.6%) and lipid lowering agents (37.2%, 95%CI 35.0%-39.5%) were the commonest reported used medications.
Prevalence of visual impairment
Adjusted population data showed that 23.9% (95%CI 21.9%–25.9%) of adults aged 50–80 had VI in either eye, with 6.0% (95%CI 4.9%–7.2%) having VIOU and 17.9% (95%CI 16.1%–19.7%) unilateral VI. By severity, mild VIOU was prevalent in 4.5% (95%CI 3.6%–5.5%), MSVI OU in 1.3% (95%CI 0.9%–2.0%), and blindness in 0.2% (95%CI 0.1%–0.6%) of individuals. Mild unilateral VI was the most frequent subtype (10.3%, 95%CI 9.0%–11.8%), followed by unilateral MSVI (4.9%, 95%CI 4.0%–6.0%) and unilateral blindness (2.6%, 95%CI 1.9%–3.5%). Near VI occurred in 10.2% (95%CI 8.1%–12.7%) individuals. VI indices varied mainly by age rather than sex (Figure 1
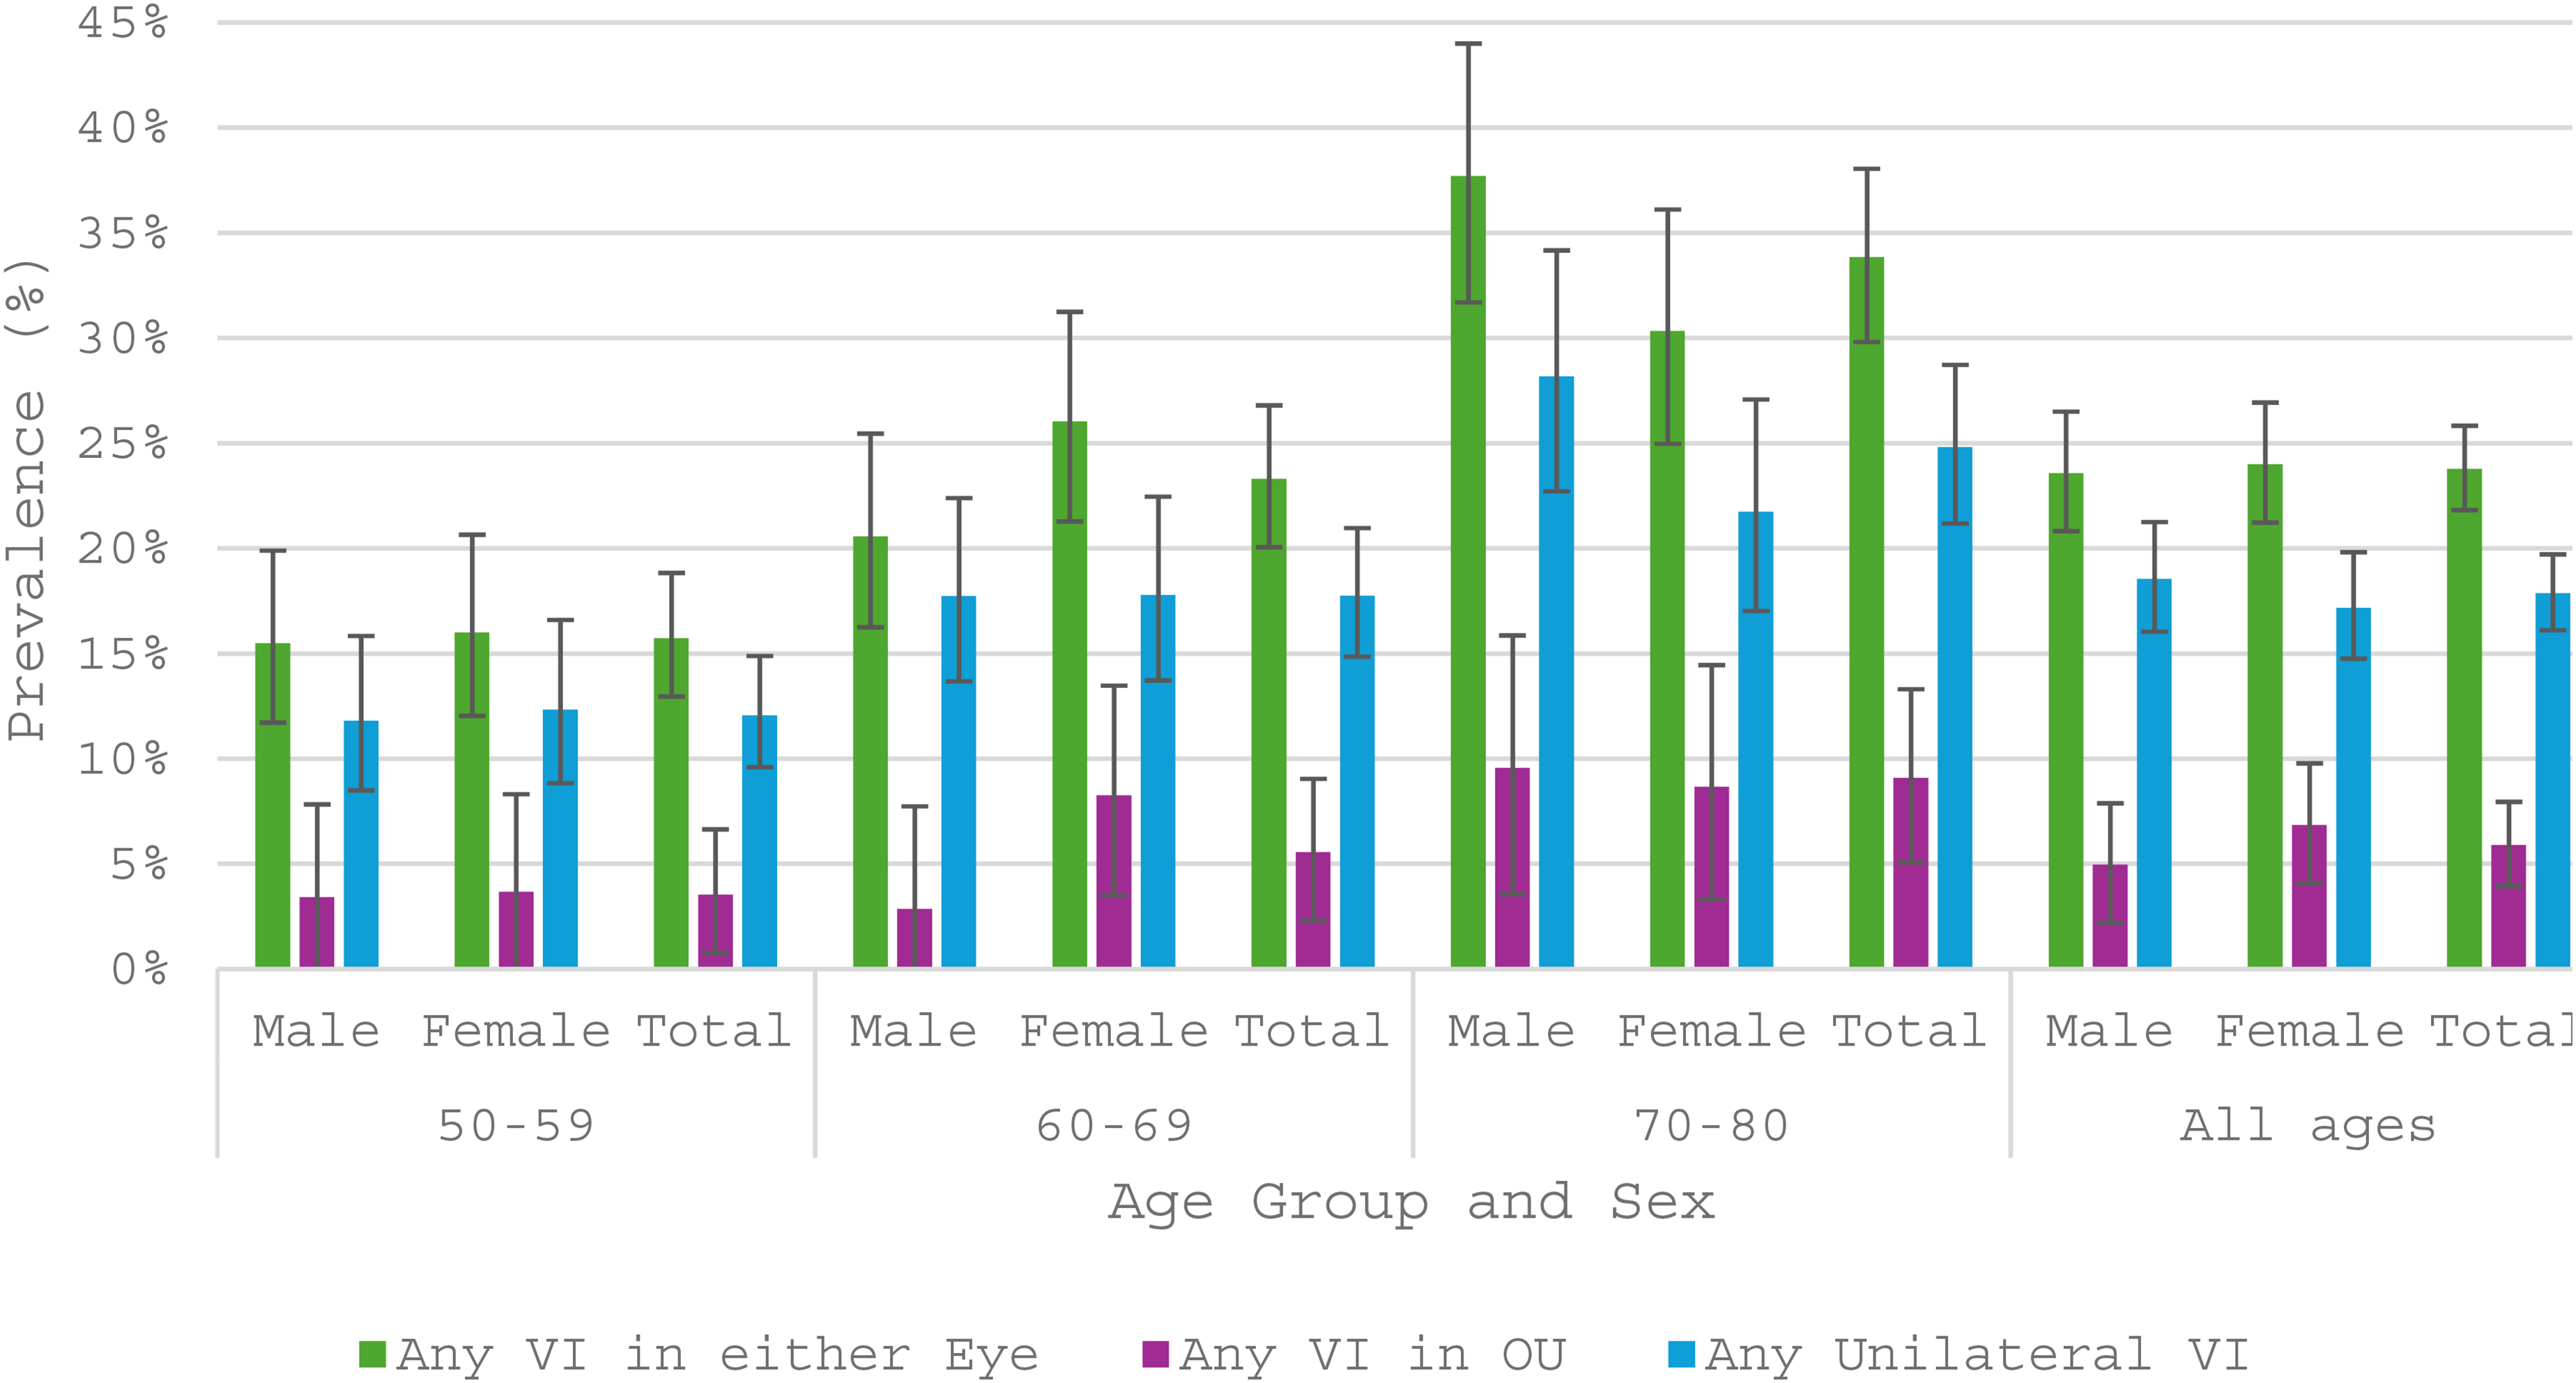
The prevalence of visual impairment (vi) laterality by age group and sex in the adjusted TMES population.
Predictors of visual impairment
Multivariate models were adjusted for age, education, employment, nationality (self and parent), sunglasses use, alcohol intake, diabetes type, cerebrovascular disease, cognitive status and the use of calcium channel blockers, angiotensin converting enzyme inhibitors (ACEI), angiotensin receptor blockers (ARB) and lipid-lowering agents (Table 2).
Multivariate analyses of predictors of visual impairment (vi) in at least 1 eye, uncorrected / undercorrected refractive error (URE) vi, amblyopia vi and cataract vi
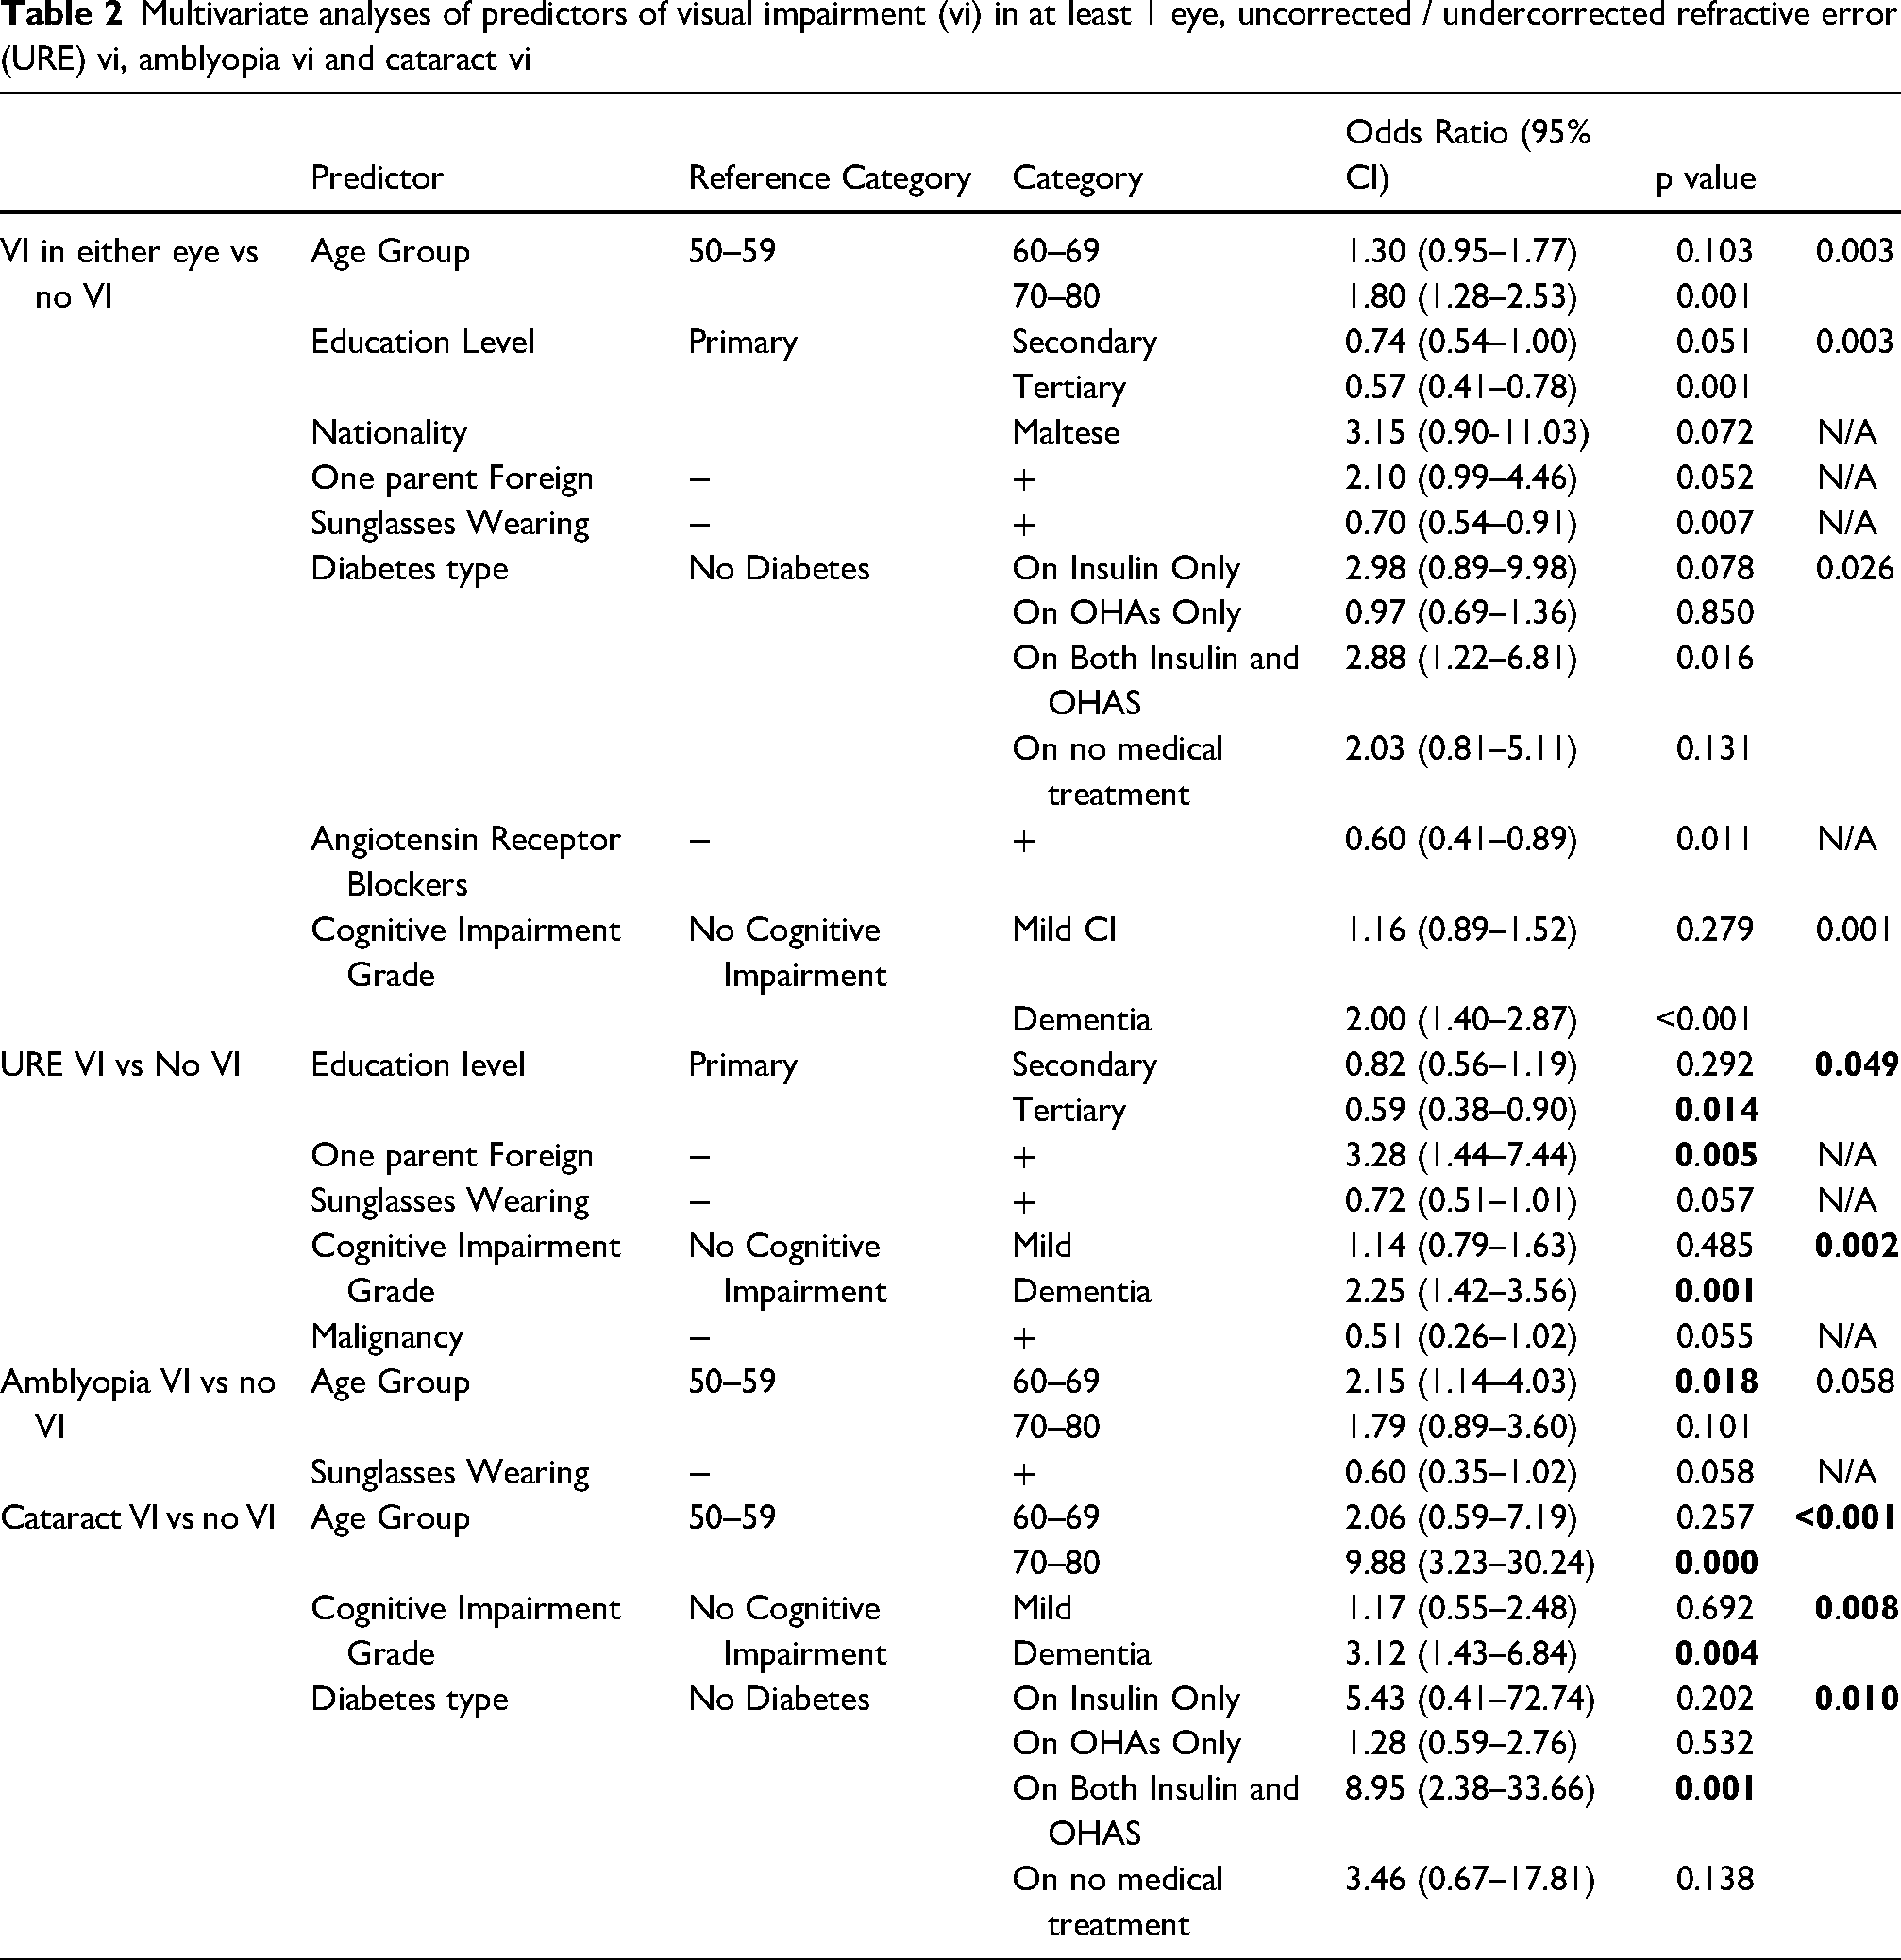
Compared with the 50–59-year group, those aged 70–79 had higher odds of VI in either eye (OR 1.80). Tertiary education was protective versus primary education (OR 0.57). Diabetes treated with both insulin and OHAs was associated with greater odds of VI (OR 2.88), as was dementia (OR 2.00). ARB use was linked to lower odds (OR 0.60).
Sunglasses wear was also protective (OR 0.70) and associated with reduced URE VI (11.3% vs 14.8%; p = 0.046) and cataract VI (3.0% vs 6.0%; p = 0.003). These remained significant after mutual adjustment (URE VI OR 0.72, 95%CI 0.53–0.98, p = 0.036; cataract VI OR 0.47, 95%CI 0.28–0.76, p = 0.002). No association was observed between sunglasses and ARMD, while cortical opacities were linked to lower sunglasses use (data not shown).
Visual impairment by causes
Prevalence of visual impairment by causes
The commonest cause of distance VI of any severity or laterality was URE (12.3%, 95%CI 10.8%–13.9%), followed by amblyopia (5.0%, 95%CI 4.1%–6.1%) and cataract (3.8%, 95%CI 3.0%–4.8%). Other age-related causes accounted for 7.1% (95%CI 5.9%–8.4%), including pathological myopia (1.3%, 95%CI 0.8%–1.9%), DR (0.8%, 95%CI 0.5%–1.4%), ARMD (0.6%, 95%CI 0.3%–1.0%), and glaucoma (0.4%, 95%CI 0.2%–0.9%). Avoidable VI (URE and/or cataract) was present in 15.8% (95%CI 14.1%–17.5%) of individuals and comprised most cases, while non-avoidable causes represented 8.1% (95%CI 6.9%–9.5%) of the population.
For VIOU by cause and severity, URE mild VI was most frequent (3.1%, 95%CI 2.4%–4.1%), followed by cataract mild VI (1.2%, 95%CI 0.7%–1.8%) and URE MSVI (0.7%, 95%CI 0.3%–1.2%).
Uncorrected presbyopia caused near VI in 4.5% (95%CI 3.1%–6.3%) and this is significantly higher than that in Western Europe (2.03%, 95%CI 1.32%, 2.88%) 27 and high-income countries (2.37%, 95%CI 1.59%, 3.31%). 28
Table 3 shows adjusted prevalences of causes of VI by eye and severity, while Supplementary Figures 3–9 present adjusted rates stratified by age and sex.
Prevalence rates (with 95% confidence intervals) of the main visually impairing causes in either eye and in the better eye (stratified by severity) in the adjusted TMES population
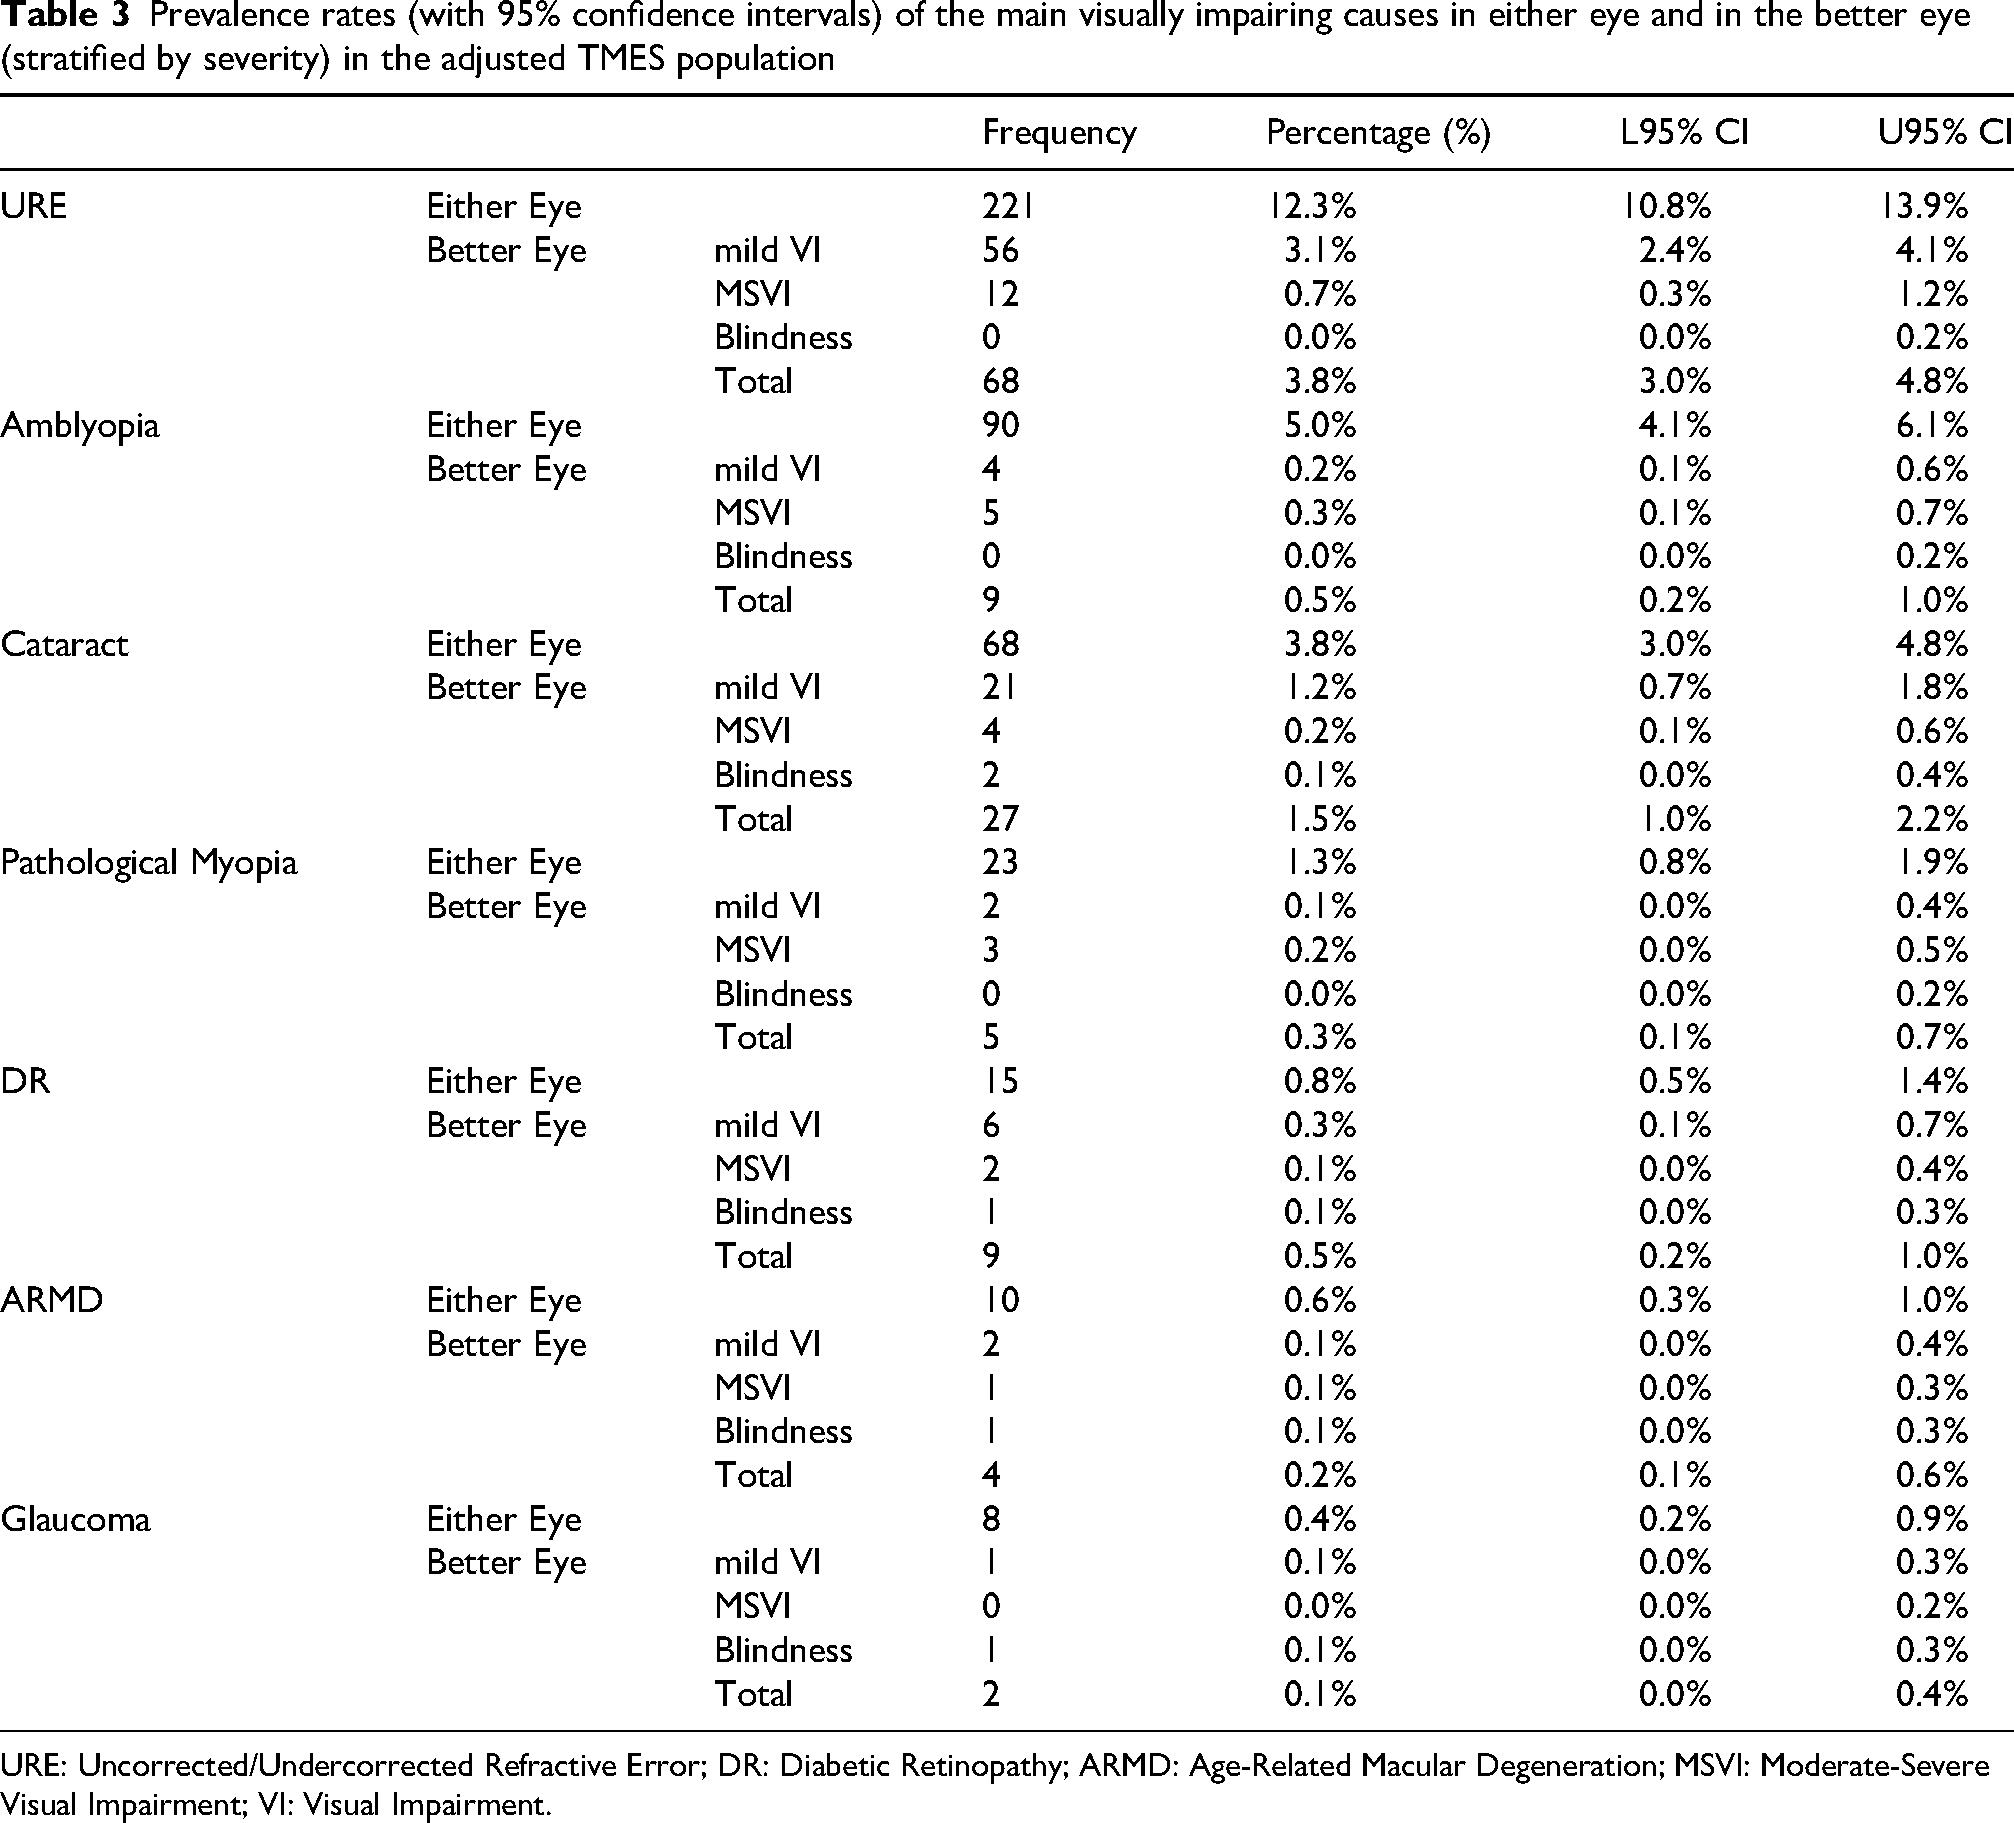
URE: Uncorrected/Undercorrected Refractive Error; DR: Diabetic Retinopathy; ARMD: Age-Related Macular Degeneration; MSVI: Moderate-Severe Visual Impairment; VI: Visual Impairment.
Effective refractive error coverage and effective cataract surgical coverage
TMES reported better rates for distance eREC than high income countries (92.8%, 95%CI 91.0%-94.4% vs 79.1%, 95%CI 72.4%-85.0%; p < 0.001) 25 and eCSC than Hungary (94.5%, 95%CI 88.5%-98.0% vs 70.3%, 95%CI 65.8%-74.9%; p < 0.001). 26 The near eREC in TMES was 93.7% (95%CI 91.2%-95.6%).
Proportion of causes of visual impairment
Figure 2 and Supplementary Figures 10–16 show proportions of non-mutually exclusive VI causes by laterality and severity. URE was the leading cause of any VI (51.6%, 95%CI 46.8%–56.5%), unilateral VI (47.8%, 95%CI 42.2%–53.4%), and VIOU (63.0%, 95%CI 53.1%–72.2%). Amblyopia ranked second for VI in either eye (21.0%, 95%CI 17.3%–25.2%) and unilateral VI (25.3%, 95%CI 20.6%–30.4%), but less so for VIOU (8.4%, 95%CI 3.9%–15.4%). Cataract was third overall (15.9%, 95%CI 12.6%–19.7%), second for VIOU (24.3%, 95%CI 16.5%–33.5%), and third for unilateral VI (12.8%, 95%CI 9.4%–17.0%). Pathological myopia was fourth for VI in either eye (5.1%, 95%CI 3.2%–7.7%) and unilateral VI (5.3%, 95%CI 3.1%–8.4%). DR ranked third for VIOU (9.3%, 95%CI 4.5%–16.4%) and fifth overall (3.5%, 95%CI 2.0%–5.7%), but was less frequent in unilateral VI (1.6%, 95%CI 0.5%–3.6%).
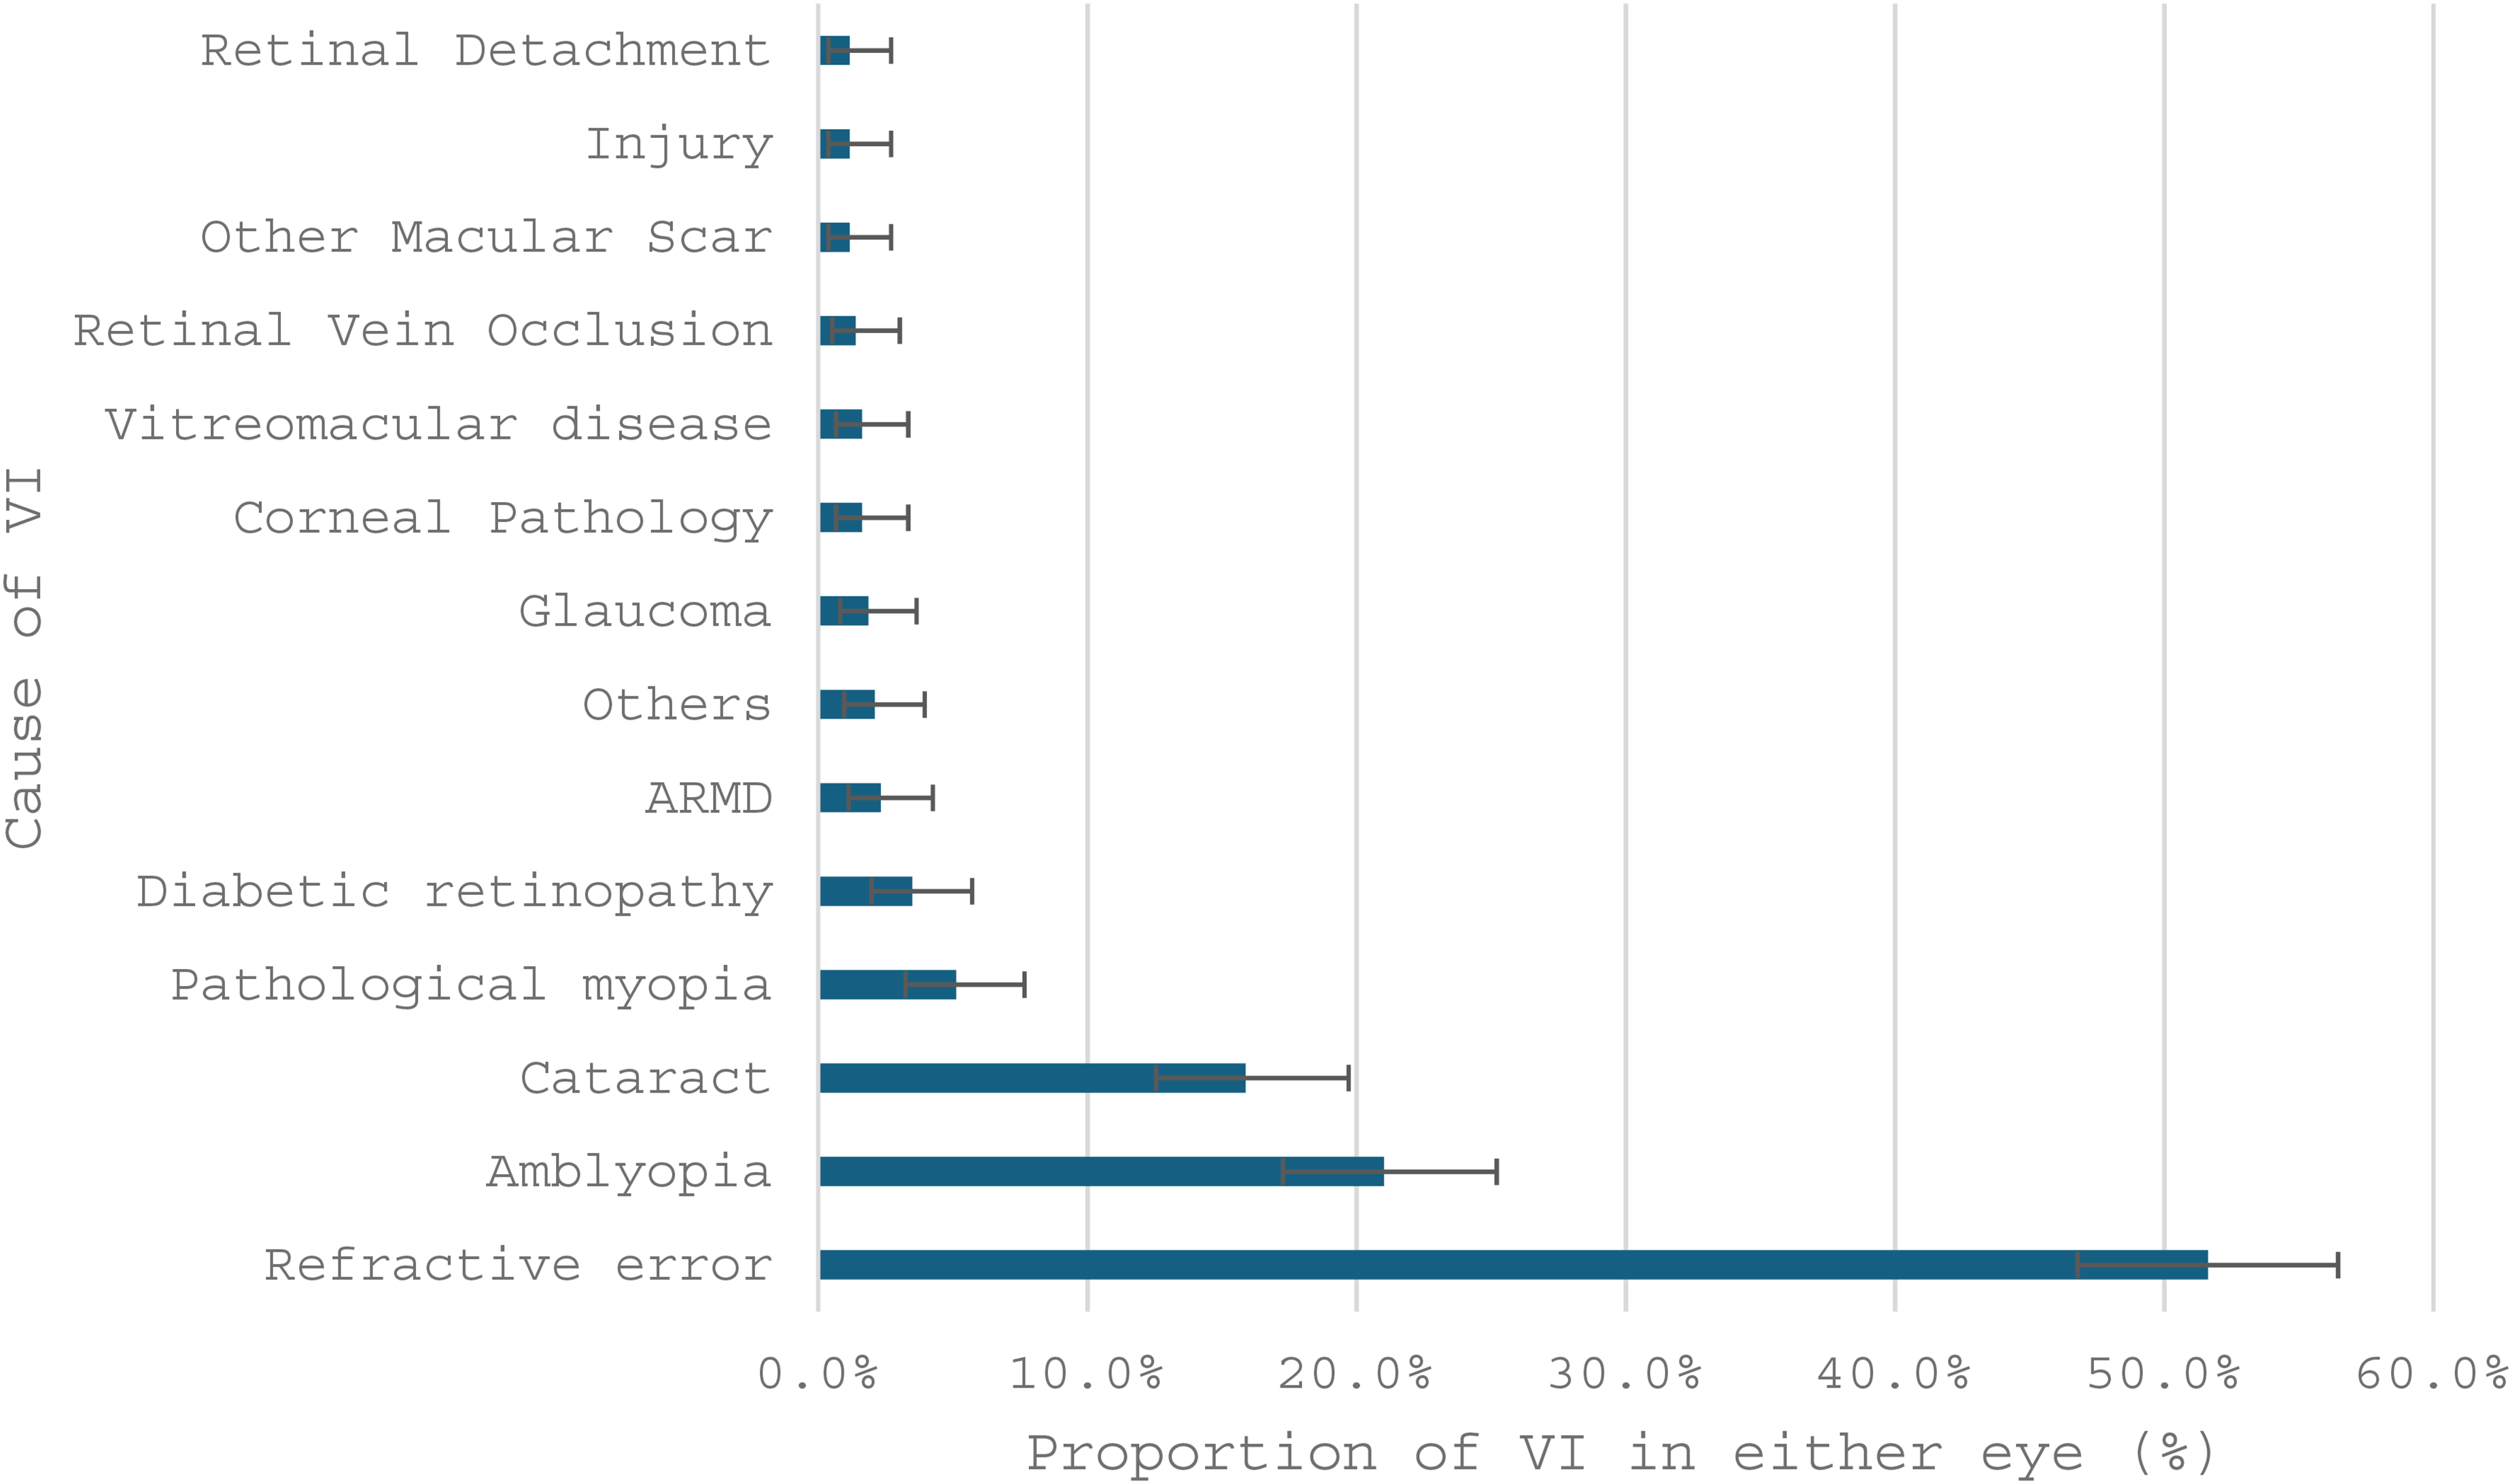
Proportions (with 95% ci bars) of non-mutually exclusive causes of visual impairment in at least one eye. ARMD: Age-Related Macular Degeneration; VI: Visual Impairment.
Avoidable causes explained 66.1% (95%CI 61.4%–70.6%) of VI in either eye and 82.2% (95%CI 73.7%–89.0%) of VI in the better eye. Multiple causes occurred in 9.8% (95%CI 7.2%–13.0%) of individuals with VI.
Predictors of causes of visual impairment
Predictor models for the main VI causes are shown in Table 2. URE VI was positively associated with dementia (OR 2.25) and inversely with higher education (tertiary vs primary OR 0.59). Amblyopia VI was associated with age 60–69 (OR 2.15 vs 50–59), while cataract VI was linked to age 70–80 (OR 9.88), dementia (OR 3.12), and diabetes treated with both insulin and oral agents (OR 8.95). Uncorrected presbyopia near VI was less frequent with higher education (tertiary vs primary OR 0.18, 95%CI 0.05–0.68, p = 0.011) and more frequent with dementia (OR 3.54, 95%CI 1.37–9.14, p = 0.009).
Discussion
The population characteristics
Obesity and diabetes rates in Maltese adults align with previous estimates.18,29 High cognitive impairment rates reflect global post-pandemic trends 30 and may be influenced by the older sample age, the more sensitive screening tool versus the standardised mini-mental state examination, 31 and potential cultural or educational effects on performance.
The prevalence of visual impairment
In TMES, one in four adults aged 50–80 had VI in at least one eye, of whom one-fourth had VIOU. A prior local study reported MSVI/blindness (better eye) at 10.11% (95%CI 8.89%–11.43%) in those aged 40+, 7 whereas TMES showed a lower prevalence with the same criteria (1.39%, 95%CI 0.89%–2.05%), despite excluding the typically lower-risk 40–49 age group.
Although Malta's population is ageing, 24 VI prevalence has declined, likely reflecting expanded eye care services. In 1988, with a population of 349,014 and only seven public service ophthalmologists, 7 access was limited. Today their number has more than quadrupled (n = 29), alongside major advances in screening and management of refractive error, cataract, retinal disease, and glaucoma.
Despite age group differences (TMES: 50–80 years; EHES: ≥ 18; EHIS: ≥ 15), TMES reported a comparable prevalence of low vision to EHES 2010 (1.1%) when using the same presenting visual acuity definition (Snellen 6/25–6/320), at 1.2% (95%CI 0.7%–1.8%). When grouping self-reported visual difficulty responses to match EHIS, TMES found 17.3% (95%CI 15.5%–19.6%) reported non-blind VI, broadly aligning with EHIS 2008 (2.9%) and 2019/20 (10.4%). Differences in age structures, survey tools, and data collection modes may explain these variations.
TMES data were age-standardised to the 2019 Global Burden of Disease standard population for comparison with the Vision Loss Expert Group meta-analysis. TMES distance VI and presbyopia rates differed significantly from Western Europe (p < 0.001; Table 4). When compared with Central and Eastern European estimates, TMES rates remained lower, placing Malta at the lower end of the European spectrum despite its Southern location. This likely reflects differences in eye care access, with lower eREC in Central and Eastern Europe contributing to higher VI. 25 The upper age limit of 80 years in TMES may partly explain the lower prevalence compared with studies without such limits.
Comparison of age-standardised prevalence of vi grades between TMES and the Western Europe component of the global burden of disease (GBD) study. 50
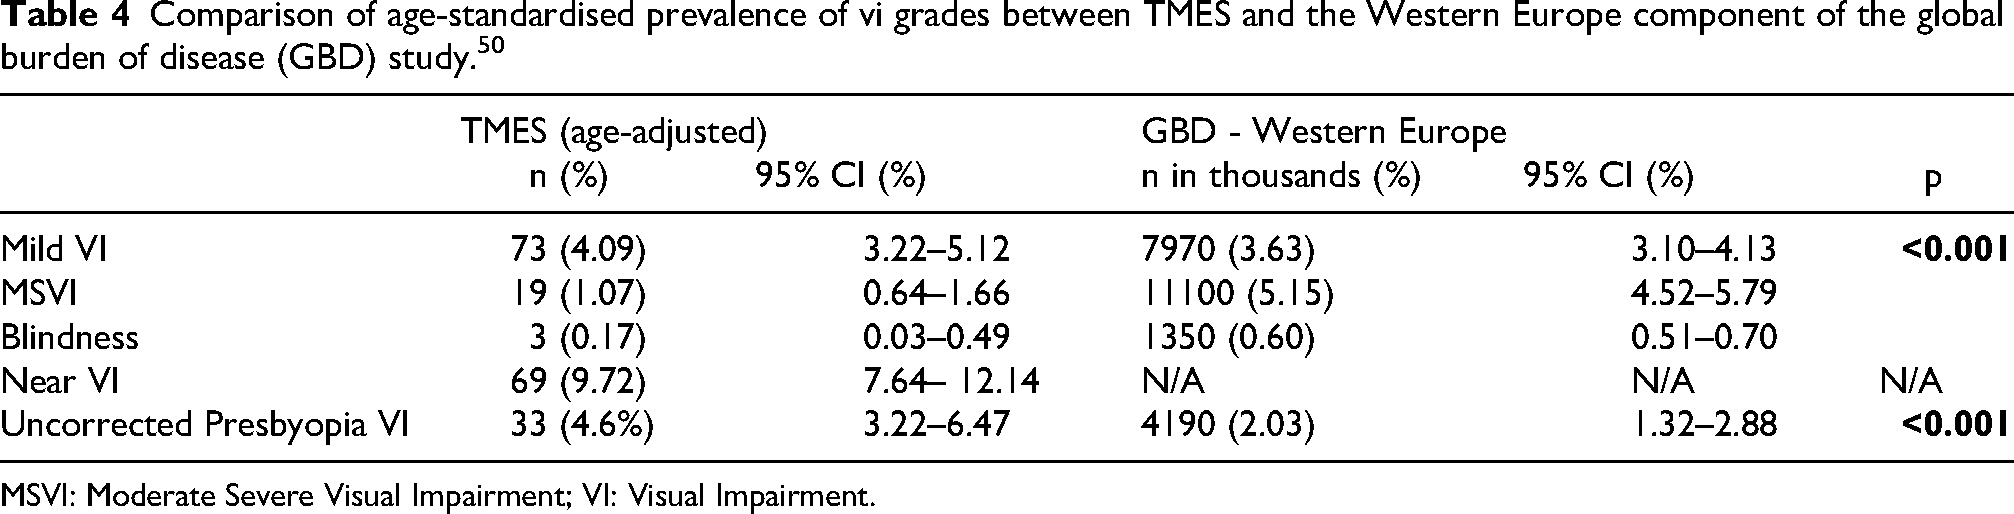
MSVI: Moderate Severe Visual Impairment; VI: Visual Impairment.
Malta's lower distance VI rates likely reflect short clinic travel distances and strong eye care access. With 85 ophthalmologists per million and a refractionist ratio of 1:9,237, Malta exceeds both high-income and WHO workforce benchmarks32–34.
The Causes of Visual Impairment
The age-adjusted prevalence of MSVI due to URE was significantly lower in TMES (0.6%; 95% CI: 0.3%-1.1%) than in comparable high-income populations (1.94%; 95%CI 1.67%-2.25%, p < 0.001). 28 A similar trend was observed for cataract-related MSVI (0.1%, 95%CI 0.0%-0.4% vs 1.46%, 95%CI 1.22%-1.71%, p < 0.001). 11 High coverage for both refractive correction and cataract surgery, as measured by distance eREC and eCSC, likely contributes to the low prevalence of VI observed in TMES. These results align with patterns reported in other high-coverage populations, highlighting the importance of effective refractive and cataract services.
Avoidable VI, though less prevalent than in Western Europe, explained the main causes of VIOU, accounting for two-thirds and one-quarter of cases, respectively. This reflects the lower proportion of other causes, amplifying the relative impact of avoidable VI. Despite rising diabetes prevalence, DR-related VI is not higher than in other countries, likely due to diabetes care, screening programmes, and DR management. Further reductions may be supported by shorter waiting times and improved public-sector optometry access.
Amblyopia VI was highest in the 60–69 age group (6.2%, 95%CI 4.4–8.3%, 60–69 vs 50–59 OR 2.15, p = 0.018), reflecting childhood ophthalmic care between 1952 and 1971. Orthoptic services were first established in the early 1970s, meaning those now aged 60 + missed the critical treatment window before age seven35–37. With childhood vision screening and paediatric ophthalmic and orthoptic services now in place, lower amblyopia prevalence is expected in younger and future older cohorts.
Relevance of predictors of visual impairment
Despite good eCSC, prioritising cataract surgery in older adults remains essential, given the ageing population and burden of reversible cataract VI. Since late 2024, evening surgical lists have been introduced to meet the patient charter 38 and reduce waiting times below six months. 39 Expanding surgical capacity improves access, but health literacy declines with age, particularly beyond 75 years, 40 where most cataract VI occurs ( Supplementary Figure 5 ), and may limit uptake. Age-friendly outreach through primary care, community hubs, or local councils should raise awareness of cataract as a treatable condition.
Higher education reduces VI and URE VI through improved health literacy, lifestyle, and care access. 41 Bridging gaps requires public education, awareness of free services, investment in primary eye care, and expansion of the public optometry workforce, as only 4 of 30 registered optometrists are government-employed.
Having one foreign-born parent was associated with higher VI and URE VI. This may reflect interactions between genetic background, 42 health awareness, 43 and eye care access. In Malta, school vision screening has only been in place for the past 30 years, which may partly explain these findings, underlining the value of early detection and equitable refractive care through school screening.
Insulin- and oral-treated diabetes was significantly linked to VI, particularly cataract-related. Given diabetes’ role in cataractogenesis,44,45 TMES recommends prioritising cataract assessment and surgery for poorly controlled individuals.
Dementia and cerebrovascular disease were associated with VI, especially URE and cataract VI. 46 VI may also indicate underlying cognitive decline, supporting reciprocal screening for VI and dementia. ARBs may protect against retinal stress, inflammation, 47 and vascular damage, 48 key in DR, ARMD, and glaucoma, 49 with meta-analyses supporting ACEI/ARB use in DR regression. 50
Strengths of the study
Despite the response rate, the sample represented 1% of the population and was broadly representative by age, gender, and district, with weighting applied for full representativity. Information bias was minimised through validated tools, and all examinations were performed by a single observer, ensuring consistency. 23 The rigorous assessment enabled detection of symptomatic and asymptomatic conditions. This study adds to the limited literature on unilateral VI, recognising common coexisting pathologies and inter-eye differences. Non–mutually exclusive cause categories were used to capture clinical complexity, an approach useful for future studies.
Weaknesses of the study
Turnout matched similar local studies, 18 but the 44.8% response rate may introduce nonresponse bias. Post-stratification weighting corrected the underrepresented 50–59 age group. Nonrespondents may still have differed systematically from participants in unmeasured ways, which could influence prevalence estimates. Other underrepresented subgroups included prisoners, foreign residents without contact details, and individuals with disabilities. Hospital-based screening excluded those unable or unwilling to attend; domiciliary visits, could have complemented data collection but were not feasible for this study. Cognitive impairment sometimes hindered cooperation, but examiners adapted procedures to obtain accurate outcomes. Subgroup analysis of bilateral blindness (n = 4) was not feasible. VI was defined solely by visual acuity, potentially underestimating disability, with limited detection of cerebral or subtle neuro-ophthalmological causes. Comparisons with other studies were limited by TMES’ 50–80-year age range.
Conclusions
In TMES, adjusted prevalence of VI in either eye was 23.9% (95%CI 21.9%–25.9%) and blindness in the better eye 0.2% (95%CI 0.1%–0.6%). Despite diabetes and UV risks, VI rates, especially DR-related, compared well internationally. Reducing avoidable VI requires stronger public optometry services and targeted cataract screening, particularly in older adults and those with poorly controlled diabetes.
Supplemental Material
sj-docx-1-ejo-10.1177_11206721251383740 - Supplemental material for The population characteristics and prevalence of visual impairment in a Southern European population
Supplemental material, sj-docx-1-ejo-10.1177_11206721251383740 for The population characteristics and prevalence of visual impairment in a Southern European population by David Agius, Julian Mamo, Neville Calleja, Daniel Cassar, Xeniya Marku, Maria Christina Nappa, Michaela Zammit, Maria Elena Pace and Francis Carbonaro in European Journal of Ophthalmology
Footnotes
Acknowledgements
We thank the management at Mater Dei and Gozo General Hospitals for study support. We also acknowledge the support of Mr Nicolai Schembri and Mr Christian Attard for IT services, Mr Stefan Attard for invitation design, Dr George Farrugia for translation services and Ms Roberta Galea for primary health information. Thanks to Dr John Cachia for sharing his past research experience, and to all staff, volunteers, and assistants involved in data collection. Special thanks to Mrs Marilyn Grech for her vital logistical support throughout the study.
Ethical approval and informed consent
Ethical approval was granted by the University of Malta Faculty Research Ethics Committee (FRECMDS_1819_94) before data collection in 2019. The study followed the Declaration of Helsinki 1 and GDPR 2 guidelines, with hospital and Data Protection Officer approvals. Written, informed consent was obtained, and data were pseudonymised.
Authors’ contributions
Funding
The authors disclosed receipt of the following financial support for the research, authorship, and/or publication of this article: This work was supported by the Tertiary Education Scholarship Scheme (TESS), Class Optical ®, Prohealth Ltd ®, Research Innovation and Development Trust, University of Malta, (grant number N/A, 20190304).
Conflict of interest and financial disclosures
The study was made possible with a stipend allowance given to Dr David Agius as part of a University of Malta Scholarship agreement dated 30/01/2019 (agreement 20190304) who was the lead researcher of the study, who has organised the study, compiled all the gathered data and is presenting this work as part of his doctoral dissertation at the University of Malta. All other authors declare no sources of conflict of interest or financial interests in the writing of this manuscript.
Data access,responsibility,and analysis
Dr David Agius (the lead researcher) declares that he has full access to all the data in the study and takes responsibility for the integrity of the data and the accuracy of the data analysis.
Dr David Agius has conducted and is responsible for all the data analysis.
Data sharing statement
Data will not be shared on a public repository. However, for the benefit of further research, the authors will not exclude any potential collaborations which will require the transfer of data to known and trusted bodies, with adequate ethical clearance from the respective body's ethics board and the University of Malta Research Ethics Committee.
Sources of funding
The Research Investment and Development Trust (RIDT) of The University of Malta co-ordinated a funding of EUR 132,000 sponsored by the Malta Community Chest Fund (MCCF) to supply the apparatus required, the above-mentioned scholarship stipend allowance, publications fees and conference costs. Dr David Agius’ University tuition fees were covered by the Tertiary Education Scholarship Scheme (TESS). Prohealth Ltd ® Malta made the stationary for invitations and postage payments possible. Class Optical ® supplied gifts for participants.
The authors confirm that the MCCF, RIDT, TESS, Prohealth Ltd®, and Class Optical® had no role beyond those stated above in the study's design and conduct, data collection, management, analysis, interpretation, manuscript preparation, review, approval, or the decision to submit for publication.
Supplemental material
Supplemental material for this article is available online.
References
Supplementary Material
Please find the following supplemental material available below.
For Open Access articles published under a Creative Commons License, all supplemental material carries the same license as the article it is associated with.
For non-Open Access articles published, all supplemental material carries a non-exclusive license, and permission requests for re-use of supplemental material or any part of supplemental material shall be sent directly to the copyright owner as specified in the copyright notice associated with the article.