
Abstract
Background
Central Serous Chorioretinopathy (CSCR) manifests as fluid accumulation between the neurosensory retina and the retinal pigment epithelium (RPE). Elevated levels of steroid hormones have been implicated in CSCR pathogenesis. This investigation aims to delineate the gene expression patterns of CSCR-associated risk and steroid receptors across human choroidal cell types and RPE cells to discern potential underlying mechanisms.
Methods
This study utilized a comprehensive query of transcriptomic data derived from non-pathological human choroid and RPE cells.
Findings
CSCR-associated genes such as PTPRB, CFH, and others are predominantly expressed in the choroidal endothelium as opposed to the RPE. The androgen receptor, encoded by the AR gene, demonstrates heightened expression in the macular endothelium compared to peripheral regions, unlike other steroid receptor genes. AR-expressing endothelial cells display an augmented responsiveness to Transforming growth factor beta (TGF-β), indicating a propensity towards endothelial to mesenchymal transition (endMT) transcriptional profiling.
Interpretation
These results highlight the proclivity of CSCR to manifest primarily within the choroidal vasculature rather than the RPE, suggesting its categorization as a vascular eye disorder. This study accentuates the pivotal role of androgenic steroids, in addition to glucocorticoids. The observed linkage to TGF-β-mediated endMT provides a potential mechanistic insight into the disease's etiology.
Keywords
Introduction
Central serous chorioretinopathy (CSCR) is the fourth most common non-surgical retinopathy and a frequent cause of mild to moderate visual impairment. 1 Findings in multimodal imaging include serous detachment of the neurosensory retina, monofocal or paucifocal changes in the retinal pigment epithelium (RPE), pigment epithelial detachment (PED), increased choroidal thickness with dilated blood vessels (“pachyvessels”), and in some cases choroidal neovascularization – almost exclusively in the macular region.1,2 While the majority of CSCR cases resolves spontaneously within months with visual acuity (VA) returning to pre-diseased levels, fluid does not vanish in a relevant number of cases. For these patients, novel therapeutic avenues are needed, as there is only a small number of therapeutic medical and laser-surgical attempts (e.g., photodynamic therapy, PDT, and laser-navigated micropulse laser) of limited success.1–3 Recognizing the limited efficacy of these approaches, leading guidelines from relevant societies now only recommend PDT instead of systemic medications for the condition, reflecting a significant paradigm shift in treatment strategy. 4 Subsequently, chronic disease activity regularly results in irreversible structural damage to the neurosensory retina and the RPE, and irretrievable visual loss in young patients. 1
Although morphological changes are well-described, CSCR etiology appears to be complex and multifactorial. Other than male gender (ratio 6:1) and the relatively young age (mean age of onset between 41 and 45 years), the disease has been associated with emotional stress, type A personality, smoking, and pregnancy for female patients.1,2 Multiple cases within families suggest a genetic determination, and candidate genetic risk loci allocate within or near multiple protein-coding genes including PTPRB, GATA5, TNFRSF10A, CDH5, CFH, ARMS2, ADAMTS9, SLC7A5, NR3C2, and VIPR2.1,2,5 Furthermore, there is clinical and experimental evidence for elevated levels of steroid hormones contributing to the development of CSCR, with glucocorticoids in the center of scientific attention.1,2 The corresponding steroid receptors belong to the nuclear receptor subfamily 3 group C (NR3C-, 3-Ketosteroid receptors) which comprises the glucocorticoid receptor (GCCR, NR3C1), mineralocorticoid receptor (MR, NR3C2), progesterone receptor (PR, NR3C3), and androgen receptor (AR, NR3C4).6,7 They can function both as transcription factors that bind to ligand response elements in the promoters of responsive genes to activate their transcription, and as regulators of other transcription factors.6,7 Despite this, a biomolecular CSCR understanding including mechanistic coherences is still poor, it is unknown which cell types express the risk loci-associated and nuclear receptor genes, and how they function and interact. Bridging from the established multifactorial etiology of CSCR, it becomes imperative to explore cellular mechanisms like endothelial-mesenchymal transition (endMT), a process wherein endothelial cells morph into mesenchymal cells, potentially facilitating pathological changes such as fibrosis and abnormal angiogenesis. 8 EndMT's role in CSCR is particularly significant as it may drive the progression towards choroidal neovascularization (CNV), a severe complication observed in neovascular CSCR. Moreover, in non-neovascular CSCR, endMT could underpin the chronicity and recurrence of the disease by contributing to the disruption of the choroidal vasculature, warranting a deeper investigation into its therapeutic potential.
In this article, we query an established set of 15,300 choroid and RPE transcriptomes from 7 non-CSCR human donors (14 samples: one macula and one periphery sample from each donor, 4 male, 3 female, 2 of them with neovascular age-related macular degeneration) – particularly focusing on the macula as prime spot of disease manifestation – to address three main goals: (a) to precisely elucidate risk loci gene expression patterns in order to identify disease-causing candidate cell types, and to discover the initial spot of CSCR manifestation – with a focus on the ongoing discussion: RPE versus choroidal vasculature (although most researchers and clinicians agree on CSCR as a vascular disease); (b) to establish a spatial understanding of steroid receptor gene expression signatures in the human choroid and RPE; and (c) provide a novel mechanistic understanding by showing that androgen-sensitive endothelium might adapt an endothelial to mesenchymal transition (endMT) phenotype.
Methods
Data collection of human RPE and choroid transcriptome
Raw and processed data of the human RPE and choroid have previously been deposited through GEO (gene expression omnibus, NCBI) under the accession number GSE135922 (license: CC-BY-NC-ND 4.0, with permission of corresponding author Prof. Mullins). 9 The raw gene counts for each dataset were downloaded from GEO database (https://www.ncbi.nlm.nih.gov/geo/). The original study obtained informed consent from all participants involved. Our re-analysis does not include any new data collection from human participants, nor does it disclose any identifiable personal information. Notably, two of the participants suffered from neovascular age-related macular degeneration.
Data processing
We reprocessed the data from raw quantification matrix following standard Seurat (v.3.1) clustering procedure, and as described in our previous publication.10–13 In this analysis, we included cells which expressed at least 100 features, and features, that could be detected in at least 3 cells. To take advantage of the improved Seurat pre-processing and normalization workflow, we used the “SCTransform” function, thereby we “corrected” log-normalized expression values across datasets. To reannotate the cells, multiple clusterings of different resolutions were generated among which the one best matching published clustering was picked and manual annotation was undertaken using canonical marker genes (compare our previous publication, and Supplemental Figure 1 for choroidal EC subclustering). 12 Graphs of the results were generated using Prism 6.0 (GraphPad) and the Seurat package in R (Uniform Manifold Approximation and Projection for Dimension Reduction, UMAP, t-distributed stochastic neighbor embedding, tSNE, Dot Plot, Heat Map). Statistical tests including False Discovery Rate correction procedure are indicated in figure legends. tSNE demonstration of single-cells in Figure 1b has been previously published in our recent work about SARS-CoV-2 vulnerability of the posterior eye segment. 12 For correlation analysis in Supplemental Figure 2 we used the R function cor.test (package: stats). Input data for this were taken from the slot “data” of our computed Seurat object. This object contains the log-normalized data. That means, these are the feature counts for each cell divided by the total counts for that cell, multiplied with a the scale factor, and then natural-log transformed using log1p. Cell Cycle analysis was performed by the R function CellCycleScoring.10,11 Iterative random forest (iRF) was performed as recently described by Basu et al.. 14 As indicated in Figure 3, we used 500 trees in 4 iterations. Input features only included genes that were expressed in at least 15% of endothelial cells. Data for this were taken from the slot “counts” of our computed Seurat object.
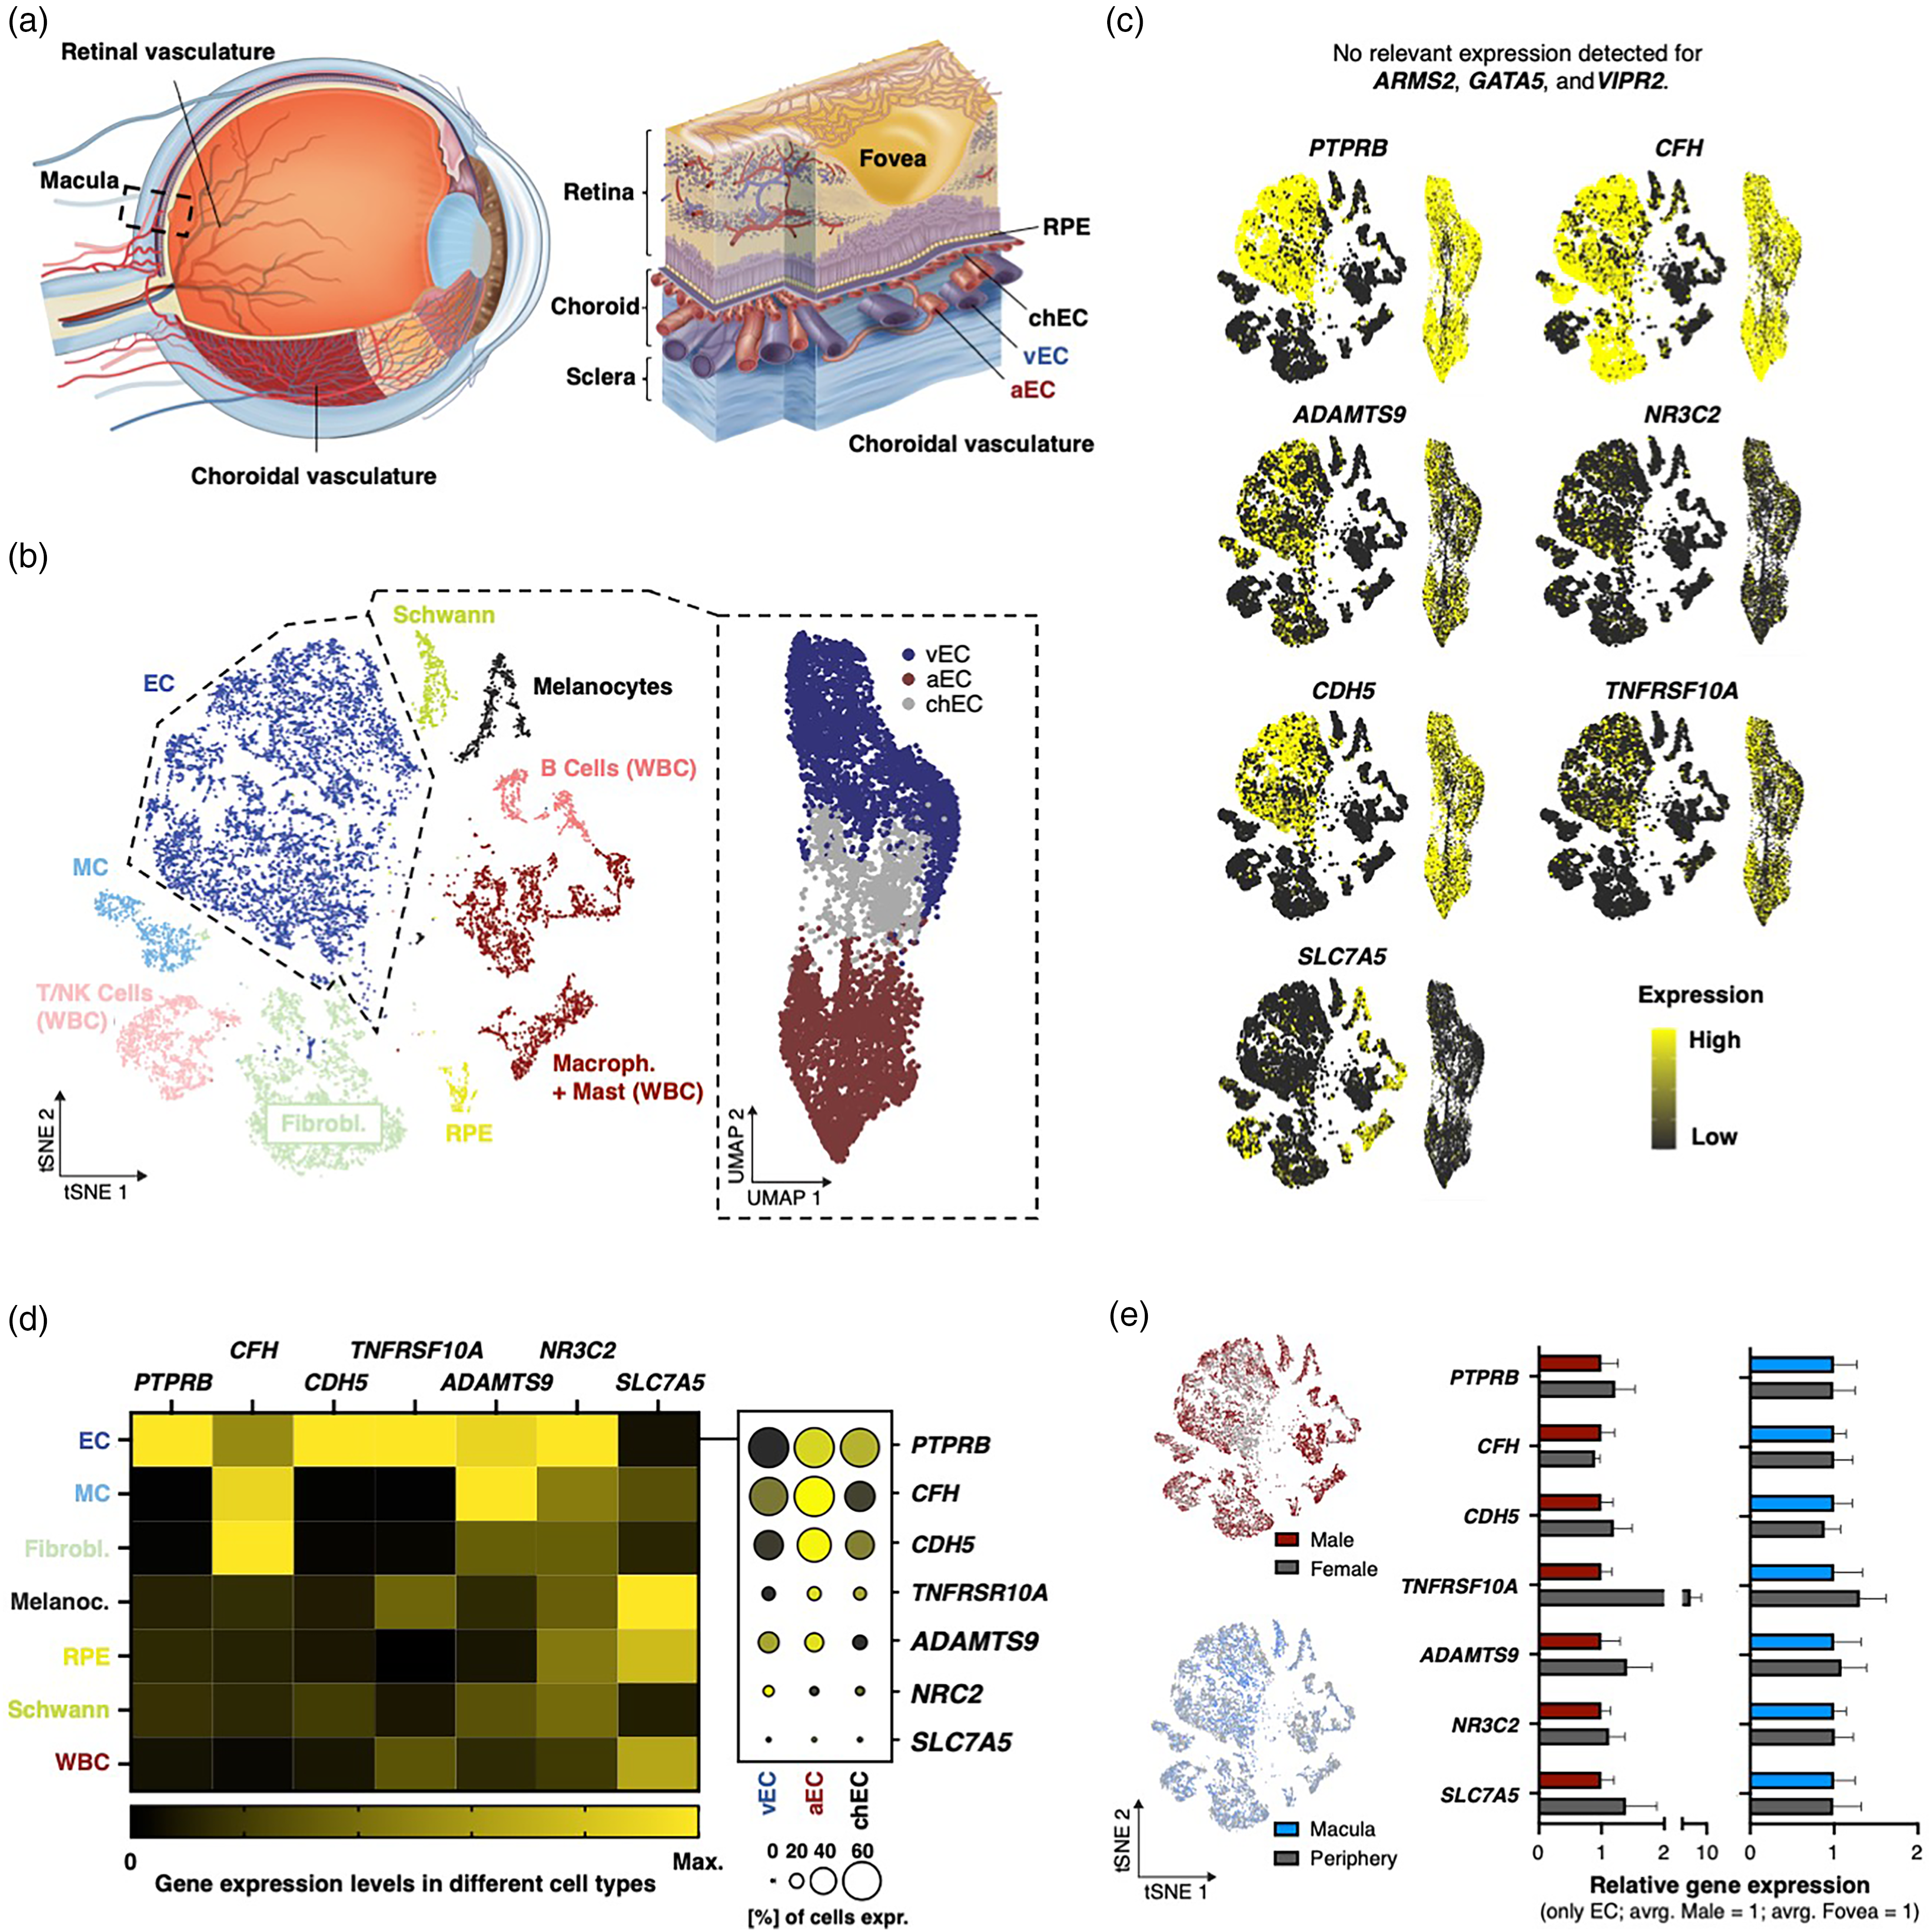
CSCR-associated “risk gene” expression in the human RPE and choroid. (a) Left: Sagittal schematic of the human eye. Dashed square indicates macular region. Right: Schematic of the macula with distinction of choroidal blood vasculature into arterial (aEC), veinous (vEC), and choriocapillary endothelium (chEC). (b) Left: tSNE of single-cell transcriptomes of the human RPE and choroid. Each dot represents an individual cell, colored by cell type. Dashed line marks EC neighborhood. Right: UMAP of the EC transcriptomes. Color-coding by EC subtypes. (c) Representation of all choroidal cells (left tSNE graph), and EC (right UMAP graph), with expression of CSCR-associated genes (indicated in graph). Yellow-black color scale represents the normalized expression level for each gene, that is the number of unique molecular identifiers (UMIs) for a given gene divided by the total number of UMIs for each cell, normalized to the maximum value across all cells for that feature. Expression scale is indicated (bottom right). (d) Left: Heatmap indicating the gene expression of indicated genes in different cell types. The average gene expression value of all donors normalized to the maximum for all cell types of this gene is represented. Right: Dot plot showing average expression (color) and fraction of expressing cells (size of dot) in EC subtypes. Average expression means the average gene expression value of all cells for this gene normalized to the maximum of all cell types and genes. Expression and fraction scale is at the bottom. (e) Left: tSNE representation of choroidal cells. Donor gender (top) and sample location (bottom) are color coded. Right: Relative gene expression of indicated genes corresponding to plots in left. Gene expression per sample was measured by UMI counts per million (CPM, relative to average of male and macular CPMs, mean + - standard error of the means (SEM), * P < 0.05, Mann-Whitney U test for gender, paired t-test for location, CPM is the number of UMIs for a given gene divided by the total number of UMIs in all cells multiplied by one million). No significant differences could be detected for any gene and condition.
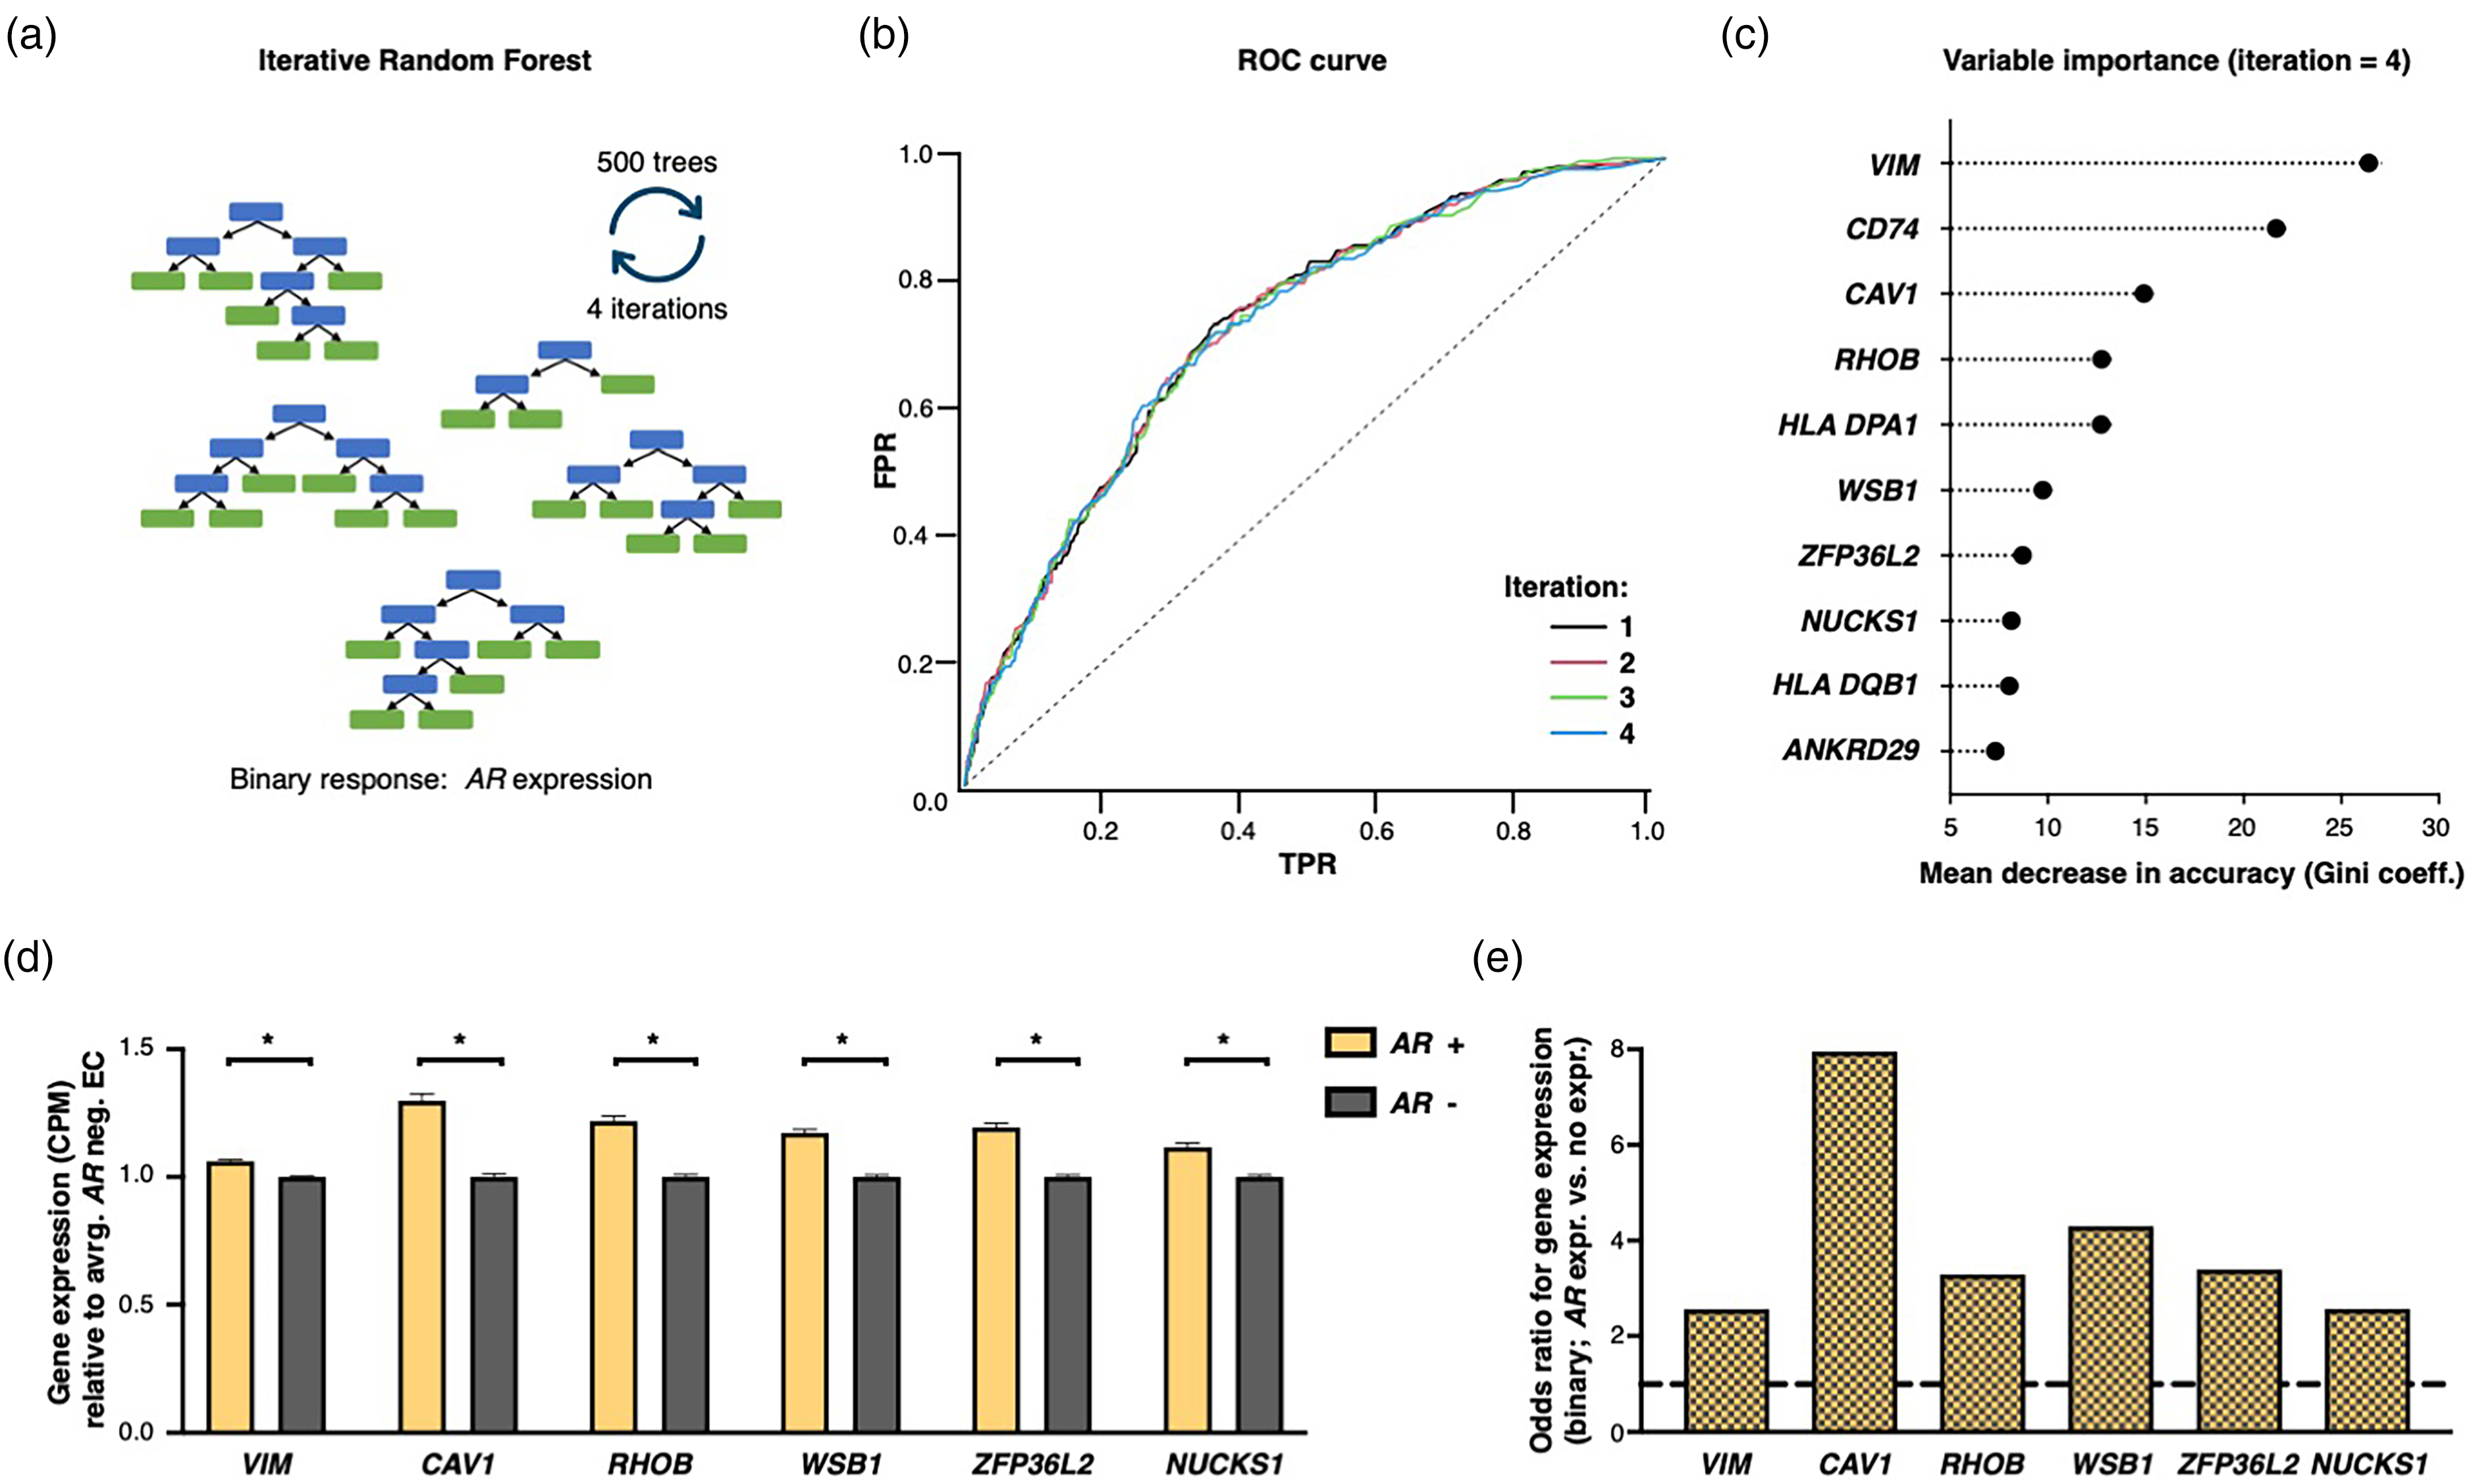
Iterative random forest identifies regulatory interactions of AR gene expression with endMT marker features. (a) Schematic of strategy: 500 trees per iteration and 4 iterations were applied. Calculation was performed on endothelial transcriptomes. Input features were all genes with an expression in 15% or more of all EC. Response for iRF is binary: AR expression vs. no expression. (b) Receiver operating characteristic (ROC) curve for binary classification. Iterations are color-coded. (c) Top ten variables measured by mean decrease in accuracy (Gini coefficient). (d) Average gene expression of indicated genes compared between AR expressing and non-expressing EC with average of AR negative EC = 1. Shown are mean and SEM with * P < 0.05, Mann-Whitney U test. (e) Odds ratio for expression of indicated gene (binary) between AR expressing EC versus not expressing EC.
Code availability
Analysis scripts will be made available upon reasonable request.
Illustrations
Copyrights on illustrations in Figure 1a were obtained by Steffen E. Künzel.
Query of transcriptome of mouse brain vasculature
For a precise expression overview of Cfh in vascular-associated cell types, we queried a transcriptome atlas of the mural brain vasculature (Supplemental Figure 1e, https://betsholtzlab.org/VascularSingleCells/database.html, last visit: 12/15/21). 15
Literature research
For a literature research concerning links between our identified, correlated genes and VEGF-A and TGF-β, we queried the free search engine PubMed, which primarily accesses the MEDLINE database of reference on abstracts on life sciences and biomedical topics (https://pubmed.ncbi.nlm.nih.gov/, last visit: 08/15/22).
Results
Genetic CSCR risk lies in the choroidal endothelium – not in the RPE
To analyze the established transcriptomic EC-enriched dataset of the human choroid and RPE, we independently integrated, clustered, and annotated cell type identities as recently described by our group, thereby yielding a satisfying overlap between our cell type annotation with the original publication of 95,65% (Adjusted Rand Index, ARI: 91,62, Figure 1b).9,12 Cell types included endothelial cells (EC), mural cells (MC), fibroblasts (FB), retinal pigment epithelium (RPE), melanocytes, Schwann cells, and multiple immune cell subtypes (Figure 1b). Furthermore, we subclustered the EC transcriptomes in three distinct subgroups as visualized in Figure 1a – arterial EC (aEC), veinous EC (vEC), and choriocapillary EC (chEC) by using a curated set of known markers for cell type annotation which comprise SEMA3G, CLDN5, IGFBP3 for aEC, DARC, TGFB3, TIMP1 for vEC, and KDR, STC1, and RGCC for chEC (Figure 1a,b and Supplemental Figure 1a). 9
We then compared gene expression of established CSCR-associated genes between those clusters. We detected relevant gene expression levels for all genes, except for ARMS2, GATA5, and VIPR2, for which we observed a low transcriptional representation in the given tissue (Figure 1c,d, compare x-axis scale in Supplemental Figure 1c). Notably, the remaining genes were highly expressed in EC, four of them (PTPRB, CDH5, TNFRSF10A, NR3C2) even showed highest expression in EC compared to all other cell types, with only CFH and ADAMTS9 being higher expressed in perivascular FB and MC (Figure 1c,d and Supplemental Figure 1b,c). 16 Transcriptional specificity of CFH to FB is known from brain vasculature, which we confirmed again by querying a rich murine dataset from this tissue (compare Supplemental Figure 1e). SLC7A5 – with its highest expression in melanocytes – is a known regulator of melanogenesis. 17 Although the number of cells expressing a certain CSCR-associated gene did not differ between different EC sub-entities, however, average gene expression levels were highest in arteries for all genes (except for NR3C2, Figure 1d). Furthermore, we compared the CSCR-associated gene expression of the EC transcriptomes between male and female donors, and between macular and peripheral region in a donor-matched manner, respectively. We found no significant difference: not for gender, nor for location (Figure 1e).
Elevated androgen receptor gene expression in the macular region
Next, we elucidated steroid receptor gene expression patterns of nuclear receptor subfamily 3 genes. The four genes were abundantly expressed in the vascular-associated cell types EC, MC, and FB, and also in other cell types (Figure 2a). Although we could detect expression levels of the four genes in the RPE – these were significantly lower compared to EC for the four genes, and – except for NR3C2 – also when compared to the other vascular-associated cell types MC and FB (Figure 2a).
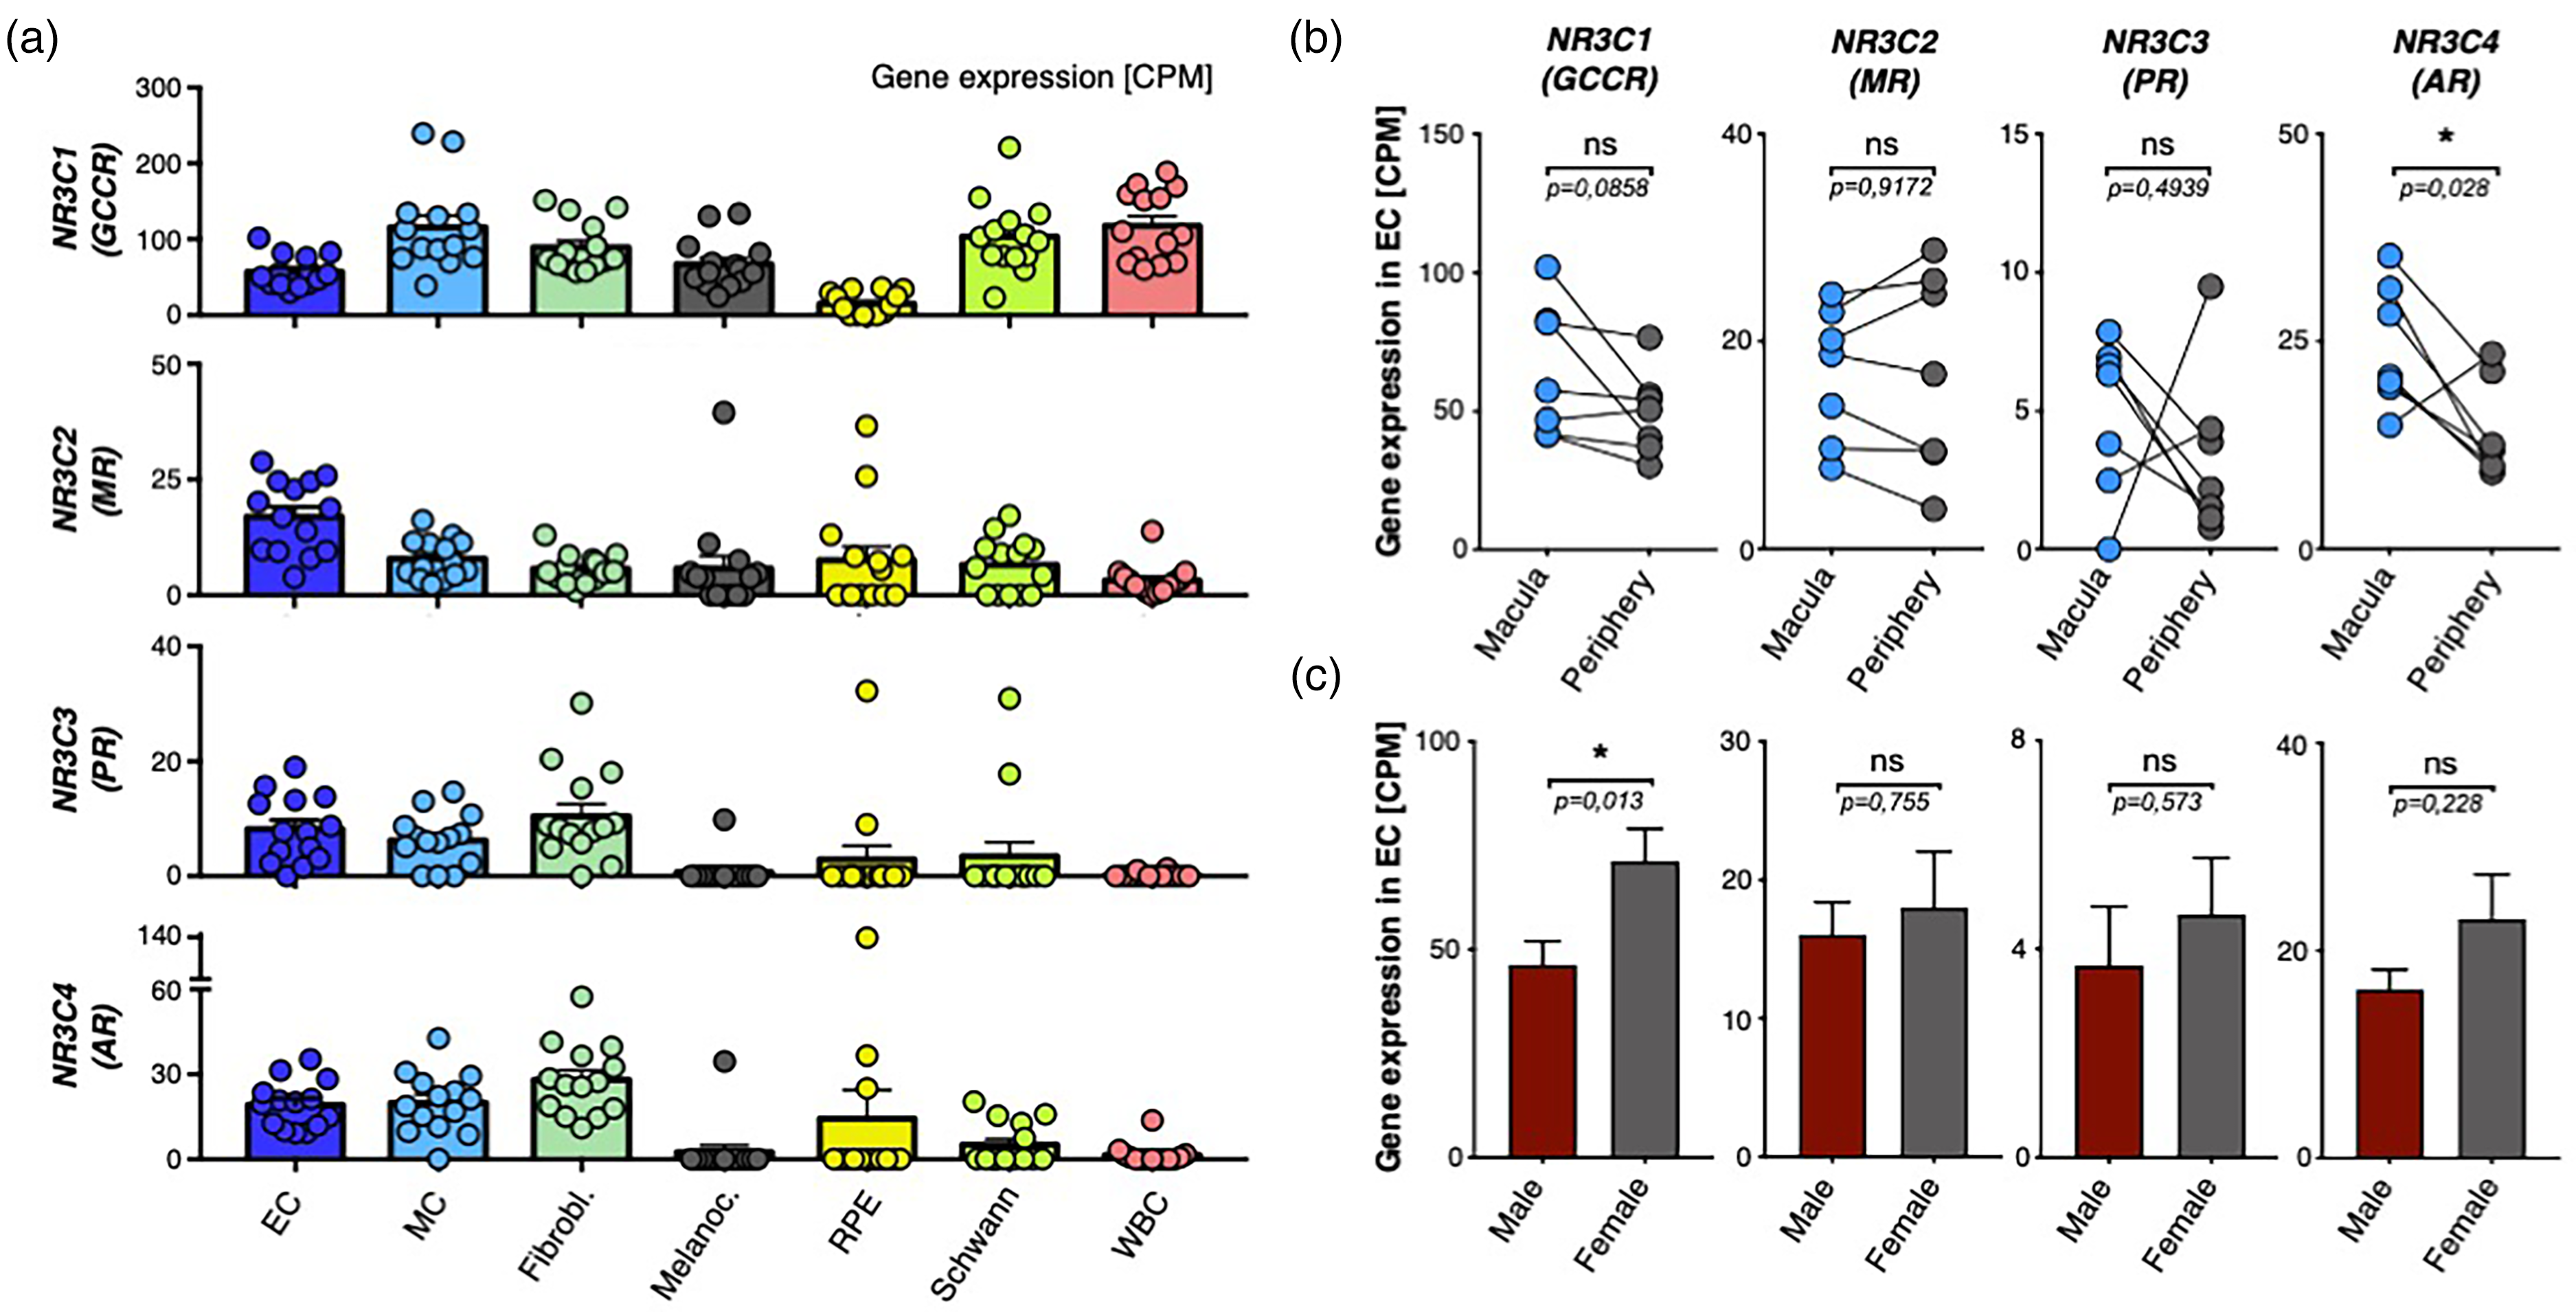
Transcriptomic expression and interaction patterns of steroid receptor genes in the choroidal endothelium. (a) Expression levels of NR3C1 (GCCR), NR3C2 (MR), NR3C3 (PR), and NR3C4 (AR) in choroidal cell types. (b) Comparison of gene expression levels between macula and periphery samples. Black line indicates direct comparison between individual donors. *P < 0.05, paired t-test. (c) Comparison of gene expression levels between male (red) and female (grey) donors. *P < 0.05, Mann-Whitney U test. Dots represent samples, bares represent mean, and error bars SEM indicated.
We also tested whether there is a spatial inequality of the candidate receptor gene expression when EC from the macular region were directly compared to the periphery in a donor-matched approach (paired t-test, Figure 2b). Interestingly, the AR (NR3C4) gene which codes for the androgen receptor was the only one with a significantly different expression between the two loci – with higher levels in the macula; potentially indicating a pivotal role of this receptor for blood vessels of this region. For the remaining three receptors, no significant difference was detected. We tested again for differences between male and female donors. Strikingly, we detect a significant difference for NR3C1 (GCCR) expression – with higher values in women. No significant difference was detected for the remaining three genes (Figure 2c). The differential expression levels of nuclear receptors (compare y-axis in Figure 2b) should not be directly equated with their physiological roles, since the abundance of mRNA transcripts does not invariably predict the impact of the resulting proteins within biological systems – especially between different genes. Specifically, the higher CPM observed for the GR gene compared to the AR may not reflect a greater biological function in CSCR, as the intricate regulatory mechanisms and distinct signaling pathways of AR could confer it a disproportionately significant role in the disease's etiology despite its lower expression.
AR interaction with VEGF-A and TGF-β signaling
In order to elucidate potential mechanistic hints between the AR (NR3C4) gene and its function in the choroidal endothelium, we exploratively tested all genes of the dataset on correlative associations with AR gene expression on single-cell level in EC and found 244 significant positive correlations after False Discovery Rate correction (Supplemental Figure 2, Supplemental Table). Interestingly, the CSCR-associated gene PTPRB was one of the highest correlated genes (rank #4 out of 244 correlated genes), and a second one, CFH, was also significantly correlated. Based on a literature review, many of the significantly correlated genes are linked to vascular endothelial growth factor (VEGF) and/ or transforming growth factor β (TGF-β) signaling (color-code red in Supplemental Figure 2), potentially indicating a mutual transcriptomic or regulatory circuit with AR. As an example, regulated genes include multiple SMAD and BMP molecules, key downstream mediators of TGF-β signaling. 18 The highest correlated gene (in terms of Pearson R) RUNX1T1 (RUNX1 Partner Transcriptional Co-Repressor 1) encodes for a member of the myeloid translocation gene family and interacts with DNA-bound transcription factors to recruit a range of corepressors and histone-modifying enzymes and to facilitate transcriptional repression. Thereby, it has also been described to mediate VEGF-A and TGF-β dependent endothelial angiogenesis, vessel permeability, and endothelial to mesenchymal transition (EndMT).19,20 As VEGF-A is a powerful regulator of permeability, vasodilation and also endothelial proliferation (key findings in CSCR), we tested, whether EC that express at least one copy of the AR gene, might also be in a more proliferative state than non-AR-expressing EC. Therefore, we utilized a computational method, that assigns every single cell to its most probable cell cycle phase by consulting a set of canonical cell cycle markers (Supplemental Figure 1d).10,11 We did not observe a significant difference between AR expressing and non-expressing EC.
Iterative random forest identifies transcriptomic interaction with androgen receptor expression and endMT markers
To elucidate promising interactions of the AR gene with other transcriptomic features in terms of a potential mutual regulation, we performed an iterative random forest (iRF) calculation with the binary response AR expression (at least one RNA copy versus no expression) on the EC transcriptome data (Figure 3a). iRF trains a feature-weighted ensemble of decision trees to detect stable interactions between biomolecules. 14 Notably, we yield an acceptable AUROC level of up to 73,26% with accuracy not decreasing after multiple iterations when testing a classifier model with the above-mentioned binary response (Figure 3b). Using feature-weights, we find decisive candidate genes as measured by mean decrease of Gini coefficient, that might act as either regulators or regulons in interaction with the AR gene (Figure 3c). Multiple identified features have already been directly linked to interact with AR in multiple tissues, but not the eye – thus, being confirmatory for the provided iRF model in this tissue.21–25 Strikingly, concerning these candidate features, we yield a strong marker expression signature indicating mesenchymal expression profiles in terms of endothelial to mesenchymal transition (endMT), including VIM (Vimentin), CAV1 (Caveolin-1), RHOB (Ras Homolog Family Member B), WSB1 (WD Repeat and SOCS Box Containing 1), ZFP36L2 (ZFP36 Ring Finger Protein Like 2), and NUCKS1 (Nuclear Casein Kinase and Cyclin Dependent Kinase Substrate 1, Figure 3c).26–31 Expression of the mentioned genes is significantly higher in AR-expressing EC compared to AR negative cells, but surprisingly only slightly different when compared in mean expression (Figure 3d). However, the odds ratios that a certain cell expresses given features when it is AR positive (binary: at least one copy) compared to AR negative (no expression) are between 2,56 (VIM) – 7,95 (CAV1), thus indicating an on/off regulation rather than a quantitative upregulation (Figure 3e).
Discussion
With this article, we propose a biomolecular CSCR disease mechanism based on precise mapping of CSCR-associated and steroid receptor gene expression profiles in the non-diseased, human choroid and RPE. We report three key findings: (1) CSCR-associated genes are predominantly expressed in the choroidal endothelium and vessel-associated cell types, not in the RPE – rooting the primary spot of disease manifestation to the choroidal vasculature; (2) Several findings propose a pivotal role of androgen receptors for CSCR pathogenesis – not glucocorticoids; (3) and mechanistically, androgen receptor signaling might induce TGF-β-mediated mesenchymal transition of the choroidal endothelium.
Even though experts in the field agree, that CSCR should be understood as a vascular disease of the choroid, a final demonstration is still missing, and some authors still declare the initial disease onset as an RPE alteration.1,2 Identifying genetic factors is crucial for understanding the initial triggers in the disease process, rather than consequences that occur after the disease has developed. Thus, this is the first work sharply mapping CSCR-associated gene expression to the choroidal vasculature, and not to the RPE. This observation aligns closely with emerging research suggesting venous overload as a key factor in the pathogenesis of CSCR. 32 While anti-VEGF treatment shows some promise for chronic CSC, its benefits over observation alone are not clear-cut, especially given the self-limiting nature of the condition. 33 Interestingly, genetic polymorphisms in the melanocyte-specific gene SLC7A5, as well as ARMS2, GATA5, and VIPR2, pop up as genetic risk factors for CSCR pathogenesis without the genes being adequately expressed in the choroid, nor in the RPE, respectively (Figure 1 and Supplemental Figure 1b,c). The finding suggests a systemic role of these genes, e.g., as regulator of the endocrinological system, but needs to undergo further investigation.
There is evidence that the human stress hormone cortisol and its metabolites cause CSCR.1,2,34 Our finding additionally qualifies the androgen receptor as a supplementary disease driver, with cortisol and androgens having known overlapping biological functions. 35 Interestingly, AR is higher expressed in the macular region, has a correlated expression pattern with multiple CSCR-associated genes (PTPRB and CFH, Supplemental Figure 2) indicating a potential transcriptomic regulation, and exerts pathomechanistic potential as a driver of TGF-β mediated endMT (discussed below). To set this in a clinical contest, evidence is growing that the androgen steroid family might be a nexus between the bio-systemic signature and CSCR onset and disease course: Disease activity, known risk factors (male sex, young age, type A personality, psychosocial stress, pregnancy for women), comorbidities (arterial hypertension, Helicobacter Pylori disease, and others), as well as morphological disease-features (choroidal thickness) jointly share an association with elevated levels of androgens.34,36–39 Furthermore, serum testosterone levels regulate choroidal thickness with exogenous testosterone uptake inducing CSCR disease onset with VA levels increasing after termination.34,36,37,40–42 And strikingly, inhibition of dihydrotestosterone synthesis (biologically most active endogenous androgen hormone) leads to a clinically relevant and statistically significant improvement of symptoms in two independent drug studies (however not being controlled).43,44
Mechanistically, androgens have been studied in mesenchymal transition of epithelial cells, but not the endothelium, yet. 21 This is the first article, that proposes a potential link between the androgen hormone, increased sensitivity for TGF-β signaling, and a transition of AR expressing cells to adopt a mesenchymal signature in the choroidal endothelium. Not only do we observe endMT marker upregulation in the transcriptome of AR expressing cells, we also identify numerous AR co-expressed features mediating TGF-β signaling - one key mediator of endMT. 45 Strikingly, endMT has previously been linked to CNV secondary to CSCR 46 ; thus, we deem these findings confirmative for our approach. Given the role of endMT in vascular alterations and fibrosis, our findings may also shed light on the pathophysiology of non-neovascular CSCR, where such cellular changes could contribute to persistent subretinal fluid and chronic disease progression. 8
Furthermore, we also observe co-expressed genes that regulate VEGF-A signaling. Higher sensitivity in AR expressing cells might explain vascular dysfunction in CSCR in terms of angiogenesis, permeability, and vasodilation, respectively – the key mechanistic features observed in CSCR pathogenesis regulated by VEGF-A signaling.47–49
There are some significant limitations to this project and CSCR research. Apparently, this work would substantially benefit from a larger number of human samples, especially from diseased donors (two of the participants are even suffering from neovascular age-related macular degeneration) – with the given dataset including samples from older patients, which can thus not fully reflect CSCR pathology. However, gathering a relevant number of CSCR donor eyes is reasonably unfeasible. Since there is no animal model that closely mimics CSCR, due to rodents lacking a fovea, it limits the methodological approaches researchers can use to study the disease. In order to get closer to the nature of CSCR, we wish to open the window for multiple research avenues: Systemic androgen suppression has been successfully tried in CSCR patients, however in non-controlled interventional approaches.43,44 Furthermore, Liao et al. already proposed a therapeutic intervention towards RUNX1T1 in a different disease context – a molecule that we deem particularly promising for CSCR. 19 It is time to discuss randomized trials of these targets in CSCR. Furthermore, our approach demonstrates correlative inference on RNA level. A precise causal characterization of downstream cascades following androgen signaling in human choroidal EC with a focus on guidance molecules (e.g., VEGF-A, TGF-β) and endothelial transition are needed – with a confirmation on protein level.
In summary, given significant limitations, this work is important evidence for an initially vascular, non-RPE disease understanding of CSCR, and highlights androgen signaling mediated endMT as a potential biomolecular disease driver.
Supplemental Material
sj-docx-1-ejo-10.1177_11206721241226735 - Supplemental material for Transcriptome Analysis of Choroidal Endothelium Links Androgen Receptor Role to Central Serous Chorioretinopathy
Supplemental material, sj-docx-1-ejo-10.1177_11206721241226735 for Transcriptome Analysis of Choroidal Endothelium Links Androgen Receptor Role to Central Serous Chorioretinopathy by Sandrine H Künzel, Dominika Pohlmann, Lynn zur Bonsen, Matteus Krappitz, Oliver Zeitz, Antonia M Joussen, Alexandre Dubrac and Steffen E Künzel in European Journal of Ophthalmology
Footnotes
Author contributions
S.H.K., A.D., and S.E.K. conceptualized the study. S.H.K. and S.E.K. performed computational analysis. Illustrations in first figure were externally created, S.E.K holds copyrights. D.P., M.K., A.D., O.Z. and A.M.J. provided equipment, revised the manuscript, and gave advice. All authors discussed results and commented on the manuscript.
Acknowledgements
We thank Prof. Mullins and his colleagues from the Institute for Vision Research from the University of Iowa, for providing the rich transcriptomic dataset.
Declaration of conflicting interests
The author(s) declared no potential conflicts of interest with respect to the research, authorship, and/or publication of this article.
Funding
The author(s) received no financial support for the research, authorship, and/or publication of this article.
Supplemental material
Supplemental material for this article is available online.
References
Supplementary Material
Please find the following supplemental material available below.
For Open Access articles published under a Creative Commons License, all supplemental material carries the same license as the article it is associated with.
For non-Open Access articles published, all supplemental material carries a non-exclusive license, and permission requests for re-use of supplemental material or any part of supplemental material shall be sent directly to the copyright owner as specified in the copyright notice associated with the article.