
Abstract
Objective
To compare peripapillary vessel density using optical coherence tomography angiography (OCT-A) in eyes of healthy people, primary open-angle glaucoma (POAG), and normal-tension glaucoma (NTG).
Methods
Thirty patients with POAG, 27 patients with NTG, and 29 healthy individuals in the control group were assessed. Capillary vessels in peripapillary retinal nerve fiber layer (RNFL) represented by whole image RPC (radial peripapillary capillary) density in an AngioDisc scan 4.5 × 4.5 mm centered on the optic disc, and ONH morphological variables (disc area, rim area, cup to disc area ratio (CDR)), and average peripapillary RNFL thickness were measured.
Results
Differences in mean RPC, RNFL, disc area, rim area, and CDR between the groups were statistically significant (P < 0.05). The difference in RNFL thickness and rim area was not significant between NTG and healthy groups, while RPC and CDR showed a statistically significant difference between all pairs. The vessel density in the POAG group was 8.25% and 11.7% lower compared to the NTG and healthy groups, respectively; while the mean difference was less (2.97%) for the NTG and healthy group. In the POAG group, 67.2% of the variation in RPC can be explained by a model containing CDR and RNFL thickness, and in normal eyes 38.8% of the changes using a model containing RNFL.
Conclusion
The peripapillary vessel density is reduced in both types of glaucoma. The vessel density in NTG was significantly lower than in the healthy eyes, despite the lack of significant difference in RNFL thickness and neuroretinal rim area between them.
Keywords
Introduction
Glaucoma is a progressive optic neuropathy, leading to visual field loss, permanent visual impairment, and a decrease of quality of life. 1 It is considered the second leading cause of blindness in the world. 2 To date, it has been estimated that almost 76 million individual suffer from glaucoma, which is estimated to increase by 1.5 times to 111.8 million patients by 2040. 3
High intraocular pressure (IOP) is considered as the main modifiable risk factor for glaucoma; however, IOP levels could be in the statistically ‘normal’ range in the presence of progressive optic neuropathy and visual field changes (NTG, normal-tension glaucoma).4,5 Though, primary open-angle glaucoma (POAG) is the most common form of glaucoma with a prevalence of 0.5 to 1% among individuals over 40 years old and is associated with an increased IOP. 6
Although the exact pathophysiological mechanism of glaucoma is not known, two basic pathways have been suggested as the mechanical and vascular theories. In the first theory, IOP rise via the blockage of axoplasmic transmission at the level of lamina cribrosa leads to the destruction of the retinal ganglion cells. In contrast, the second theory suggests reduced ocular perfusion as a consequence of an increase in IOP. 7 Optic disc hemorrhage, peripapillary atrophy, and significant blood flow reduction have been reported in progressive glaucomatous eyes compared to the eyes without progression, and a relatively stabilized status.8–10 These findings may support the idea of vascular dysfunction as a contributing factor in the development and progression of glaucoma.
Optical coherence tomography angiography (OCT-A) is a popular, noninvasive posterior segment imaging technique that is used for assessment of structural and vascular changes in the posterior segment and help with the clinical diagnosis and management of glaucoma.11,12 One of the commercially available instruments is the Avanti AngioVue OCT (Optovue Inc., Fremont, CA, USA), which gained a high reputation in clinical settings, and provides the pattern of local circulation on and around the optic nerve head (ONH) using the split-spectrum amplitude-decorrelation angiography (SSADA) algorithm to record the dynamic motion of red blood cell.13–15 Although several studies evaluate the ONH perfusion in POAG, NTG, and healthy groups,16,17 more studies are required to confirm their findings and potentially provide more evidence on vascular changes as pathogenetic mechanism in NTG. Therefore, this study was designed to compare vessel density in the studied glaucoma groups with high and normal intraocular pressure (POAG & NTG) with the control group (healthy eyes), and also to investigate vascular density correlation with ONH's structural/ morphological parameters and peripapillary RNFL thickness. The second goal was to find the best model for predicting vessel density in different groups based on ONH and RNFL thickness variables.
Subjects and methods
This case-control study included 57 glaucoma patients (30 patients with POAG and 27 patients with NTG) in the study group and 29 healthy individuals in the control group who met the inclusion criteria. The study was performed between February 2019 and February 2020 in Alzahra Eye Hospital, Zahedan, Iran. Before enrollment, the goals and objectives of the present study were explained to the potential participants in simple language, and written informed consent was obtained. All steps of the study were performed according to the tents of the Declaration of Helsinki. The research was approved by the Ethics Committee of Zahedan University of Medical Sciences, Zahedan, Iran. (IR.ZAUMS.REC.1399.413)
Inclusion and exclusion criteria
Inclusion criteria in the control group were best-corrected visual acuity of 20/20 or better, and spherical refractive error between −3.00 to +3.00 diopters, IOP less than 21 mmHg with Goldmann applanation tonometer (GAT), and no prior history of high IOP or use of IOP lowering medications, cup to disc ratio (CDR) less than 0.3 with or less than 0.2 asymmetry in cupping between the two eyes, normal neuroretinal rim, and intact retinal nerve fiber layer evaluated using both techniques, dilated fundus examination using a 90 D double-aspheric fundus lens (Volk; Mentor, OH) and ONH and RNFL OCT. In addition, all subjects included in the control group had a normal visual field, confirmed twice using Humphrey Field Analyser II (Carl Zeiss Meditec Inc., Dublin, CA, USA) and defined as a glaucoma hemifield test (GHT) result within normal limits and a pattern standard deviation (PSD) within 95% confidence limits, with no cluster of abnormal points in pattern deviation plot. None of the included subjects in this group had a family history of glaucoma.
In the POAG group, patients with the following criteria were included: best-corrected visual acuity of 20/40 or better, refractive error in the range of −3.00 to +3.00 diopters, IOP more than 21 mmHg with GAT (or IOP in normal range with glaucoma medication), presence of glaucomatous changes in the optic disc and retinal nerve fiber layer as detected by detailed dilated fundus examination using a 90 D double-aspheric fundus lens (focal or diffuse loss of retinal nerve fibers, rim notching especially in polar regions of the disc, excavation producing vertically oval or concentric cupping, CDR more than 0.5 or asymmetry of 0.2 or more between the two eyes, double angulation of blood vessels, and nasal displacement of vessels), presence of glaucomatous visual field defect (nasal step, paracentral scotoma, arcuate scotoma, altitudinal defect, generalized depression, or focal clusters). All of the above inclusion criteria were met for the NTG group except that the IOP was less than 21 mmHg before starting any glaucoma medication.
Subjects younger than 18 years, and those with prior history of ocular surgery or eye diseases other than POAG and NTG in the study group; ocular or head trauma; systemic diseases with potential retinal involvement (including diabetes mellitus and hypertension), collagen vascular disorders, connective tissue diseases and migraine; and those on medications with known effect on the retinal circulation, were excluded from the study.
An experienced glaucoma specialist (MA) did all ophthalmic examination, and confirmed the glaucoma diagnosis. Along with complete ophthalmic examinations including visual acuity assessment, refractive evaluation, anterior segment evaluation, anterior chamber angle assessment, IOP measurement, light pupillary reflex, dilated fundus examination, and visual field assessment, optical coherence tomography angiography (OCT-A) using Avanti AngioVue (Optovue Inc., Fremont, CA, USA) was done for all subjects.
Optical coherence tomography angiography (OCT- A)
The structure of retinal vasculature was assessed using Avanti AngioVue OCT (OCT-A) device, which uses a light source with a wavelength in the near-infrared range of the electromagnetic spectrum (840 nm) to perform 70,000 A-scans per second with a bandwidth of 50 nm. The imaging method used in this device is the split-spectrum amplitude-decorrelation angiography (SSADA) algorithm to process volumetric scans and provide three-dimensional high-quality vessel density maps of perfused vascular structure at the optic disc and different layers of the retina. The device expresses these findings qualitatively or quantitatively as the vessel density. Vessel density (VD) was defined as the percentage of the perfused area by large or microvessels compared to the particular area scanned.
Included variable for analysis in this study was capillary vessels in peripapillary retinal nerve fiber layer (RNFL) represented by whole image RPC (radial peripapillary capillary) density in an AngioDisc scan 4.5 × 4.5 mm, centered on the optic nerve head. This segmentation slab delineates the vessels from the innermost retinal layer or internal limiting membrane (ILM) to the back boundary of the RNFL in the peripapillary area.
In addition, ONH morphological analysis variables (disc area (mm2), rim area (mm2), cup to disc area ratio (CDR)), and average peripapillary RNFL thickness (micron) were measured and recorded.
After 3–5 min of rest to stabilize the retinal blood flow status, all scans were taken. Subjects were asked to focus on the internal fixation target during the test. Only scans with acceptable signal strength (> 48%), and scan quality (at least 6/10) were included for the analysis. Scans with artifacts, such as those with irregularities in the vessels’ pattern or motion artifacts or those with errors in the RNFL segmentation, were excluded from the analysis.
Glaucoma was classified as mild (more than −6 decibel (dB)), moderate (−6 to −12 dB), and severe (less than −12 dB) based on mean deviation (MD) in patients with POAG and NTG.
Statistical analysis
Data were analyzed in SPSS software version 24 (SPSS Inc, Chicago, IL). One eye from each participant was randomly selected for analysis. At first, the normality of quantitative variables was assessed using the Shapiro-Wilk test, which showed a normal distribution. One-way analysis of variance (ANOVA) and post hoc Scheffe tests was used to compare IOP, CDR, rim area, RNFL thickness, and RPC among the various groups (POAG, NTG, and healthy individuals), as well as the mean RPC in different severities of disease in glaucoma patients. Sex distribution in different groups was assessed using the Chi-square test. A general linear model-univariate analysis was also used. Age and sex were considered covariates due to the difference in mean age and gender distribution among the various groups. Comparison of the ONH morphology, RNFL and VD parameters based on the gender in the different groups was performed using the independent-samples T test. Pearson correlation test was used to assess the correlation between vessel density with structural and morphological parameters of ONH, along with RNFL thickness in different groups. A P-value <0.05 was considered statistically significant in all tests.
Results
Demographic data and characteristics of subjects are shown in Table 1.
Participants’ demographic characteristics. (n = 86 eyes)
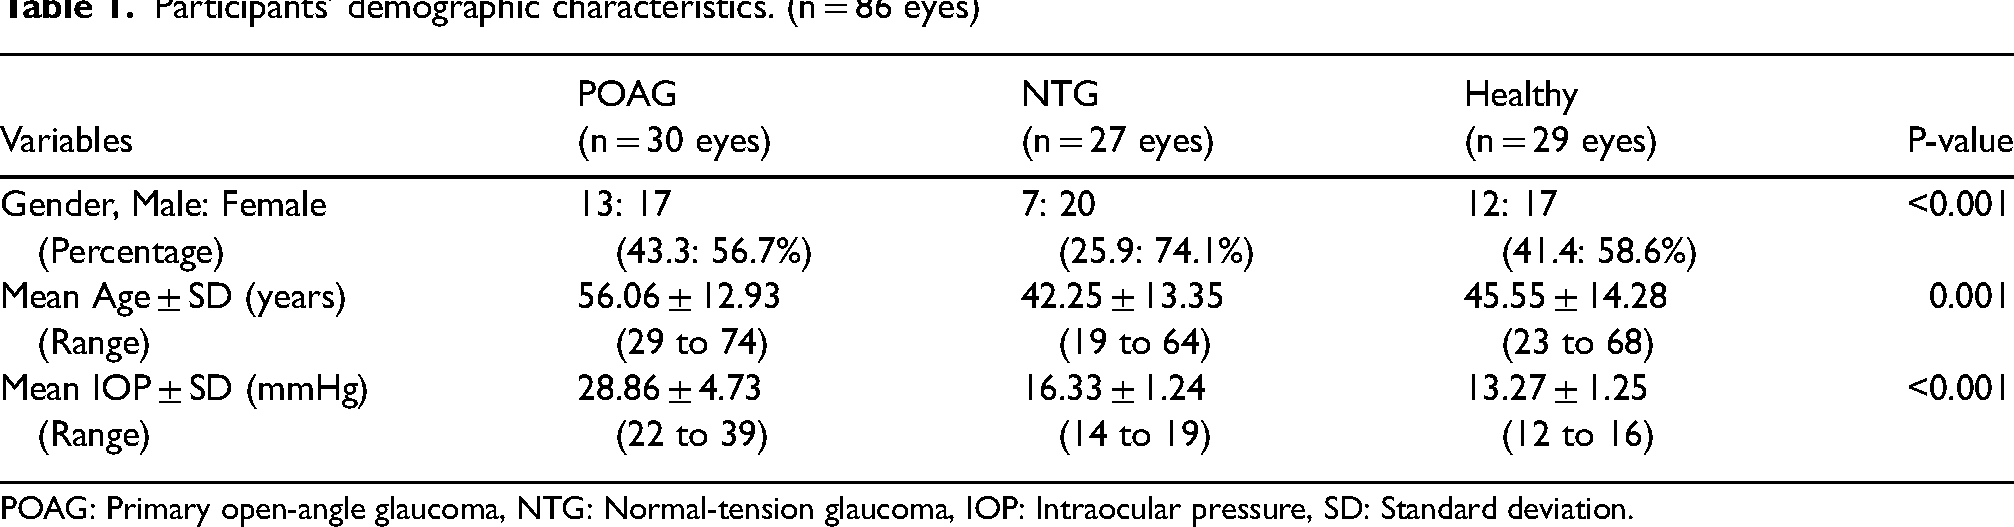
POAG: Primary open-angle glaucoma, NTG: Normal-tension glaucoma, IOP: Intraocular pressure, SD: Standard deviation.
There was a statistically significant difference in gender distribution (P < 0.001), mean age (P = 0.001), and mean IOP (P < 0.001) between the groups. Post hoc multiple comparisons showed the age differences were between POAG with NTG (P = 0.001), and POAG with Healthy (P = 0.011) groups and the differences in IOP were between all pairs.
Mean and standard deviation of vessel density, nerve fiber thickness, and optic disc morphology parameters separately in POAG, NTG, and healthy groups with age and sex considered as covariates are presented in Table 2.
Mean and SD of vessel density, nerve fiber thickness, and optic disc morphology parameters separately in different groups with age and sex considered as covariates. (n = 86 eyes)
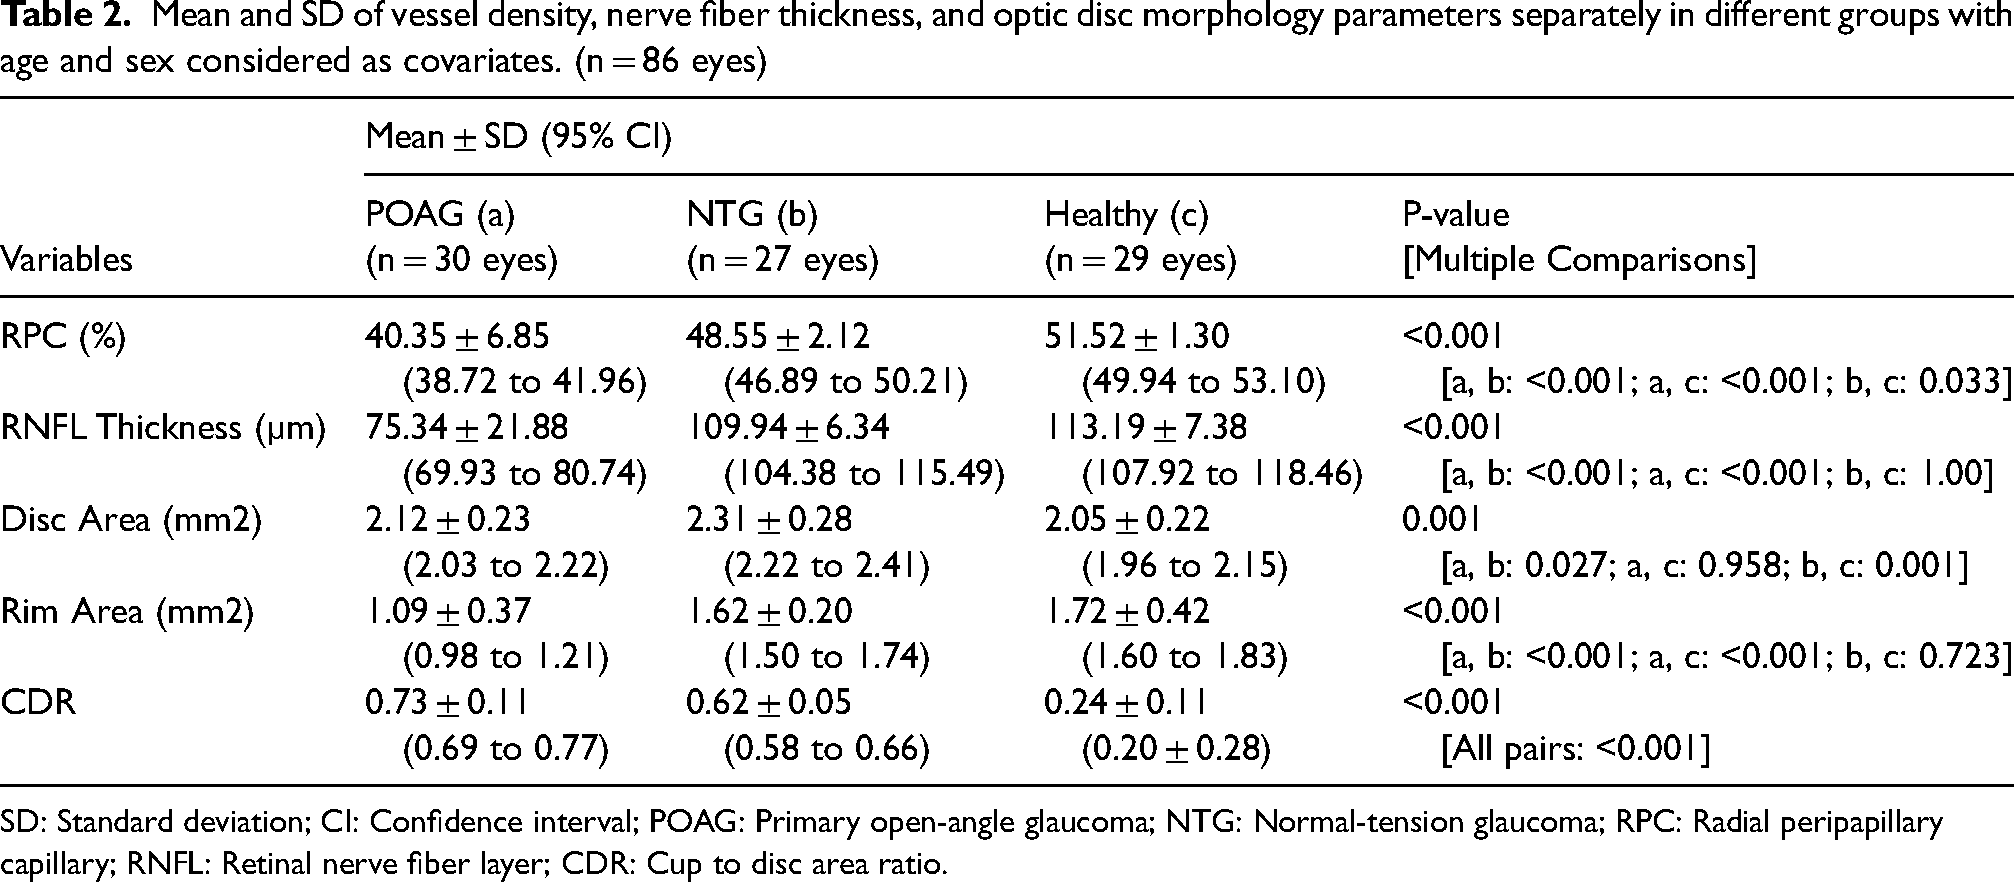
SD: Standard deviation; CI: Confidence interval; POAG: Primary open-angle glaucoma; NTG: Normal-tension glaucoma; RPC: Radial peripapillary capillary; RNFL: Retinal nerve fiber layer; CDR: Cup to disc area ratio.
There was a statistically significant difference in mean RPC (P < 0.001), mean RNFL (P < 0.001), mean disc area (P = 0.001), mean rim area (P < 0.001), and mean CDR (P < 0.001) between the groups while adjusting for age and sex. Multiple comparisons showed that statistically significant difference was seen between all pairs for RPC and CDR. In contrast, the difference in RNFL thickness and rim area was insignificant between the NTG and healthy groups.
The partial Eta Squared value indicating the effect size was also calculated for all parameters, and it was 0.544 for RPC. This value shows that 54.4% of the variance in the different groups is explained or predicted by RPC and compared with Cohen's guideline,18,19 this points to a moderate effect. The effect size for RNFL, disc area, rim area, and CDR was 0.578, 0.161, 0.437, and 0.827, respectively. The highest and lowest effect size was related to CDR and disc area, respectively, among all the measured parameters.
The vessel density in the POAG group was 8.25 and 11.7% lower than the NTG and healthy groups, respectively, while the mean difference was less (2.97%) for the NTG and healthy group.
The correlation of the vessel density with optic nerve head parameters and RNFL thickness is presented in Table 3.
Correlation of the radial peripapillary capillary (RPC) with disc and rim area, cup to disc ratio (CDR) and retinal nerve fiber layer (RNFL) thickness based on the groups.
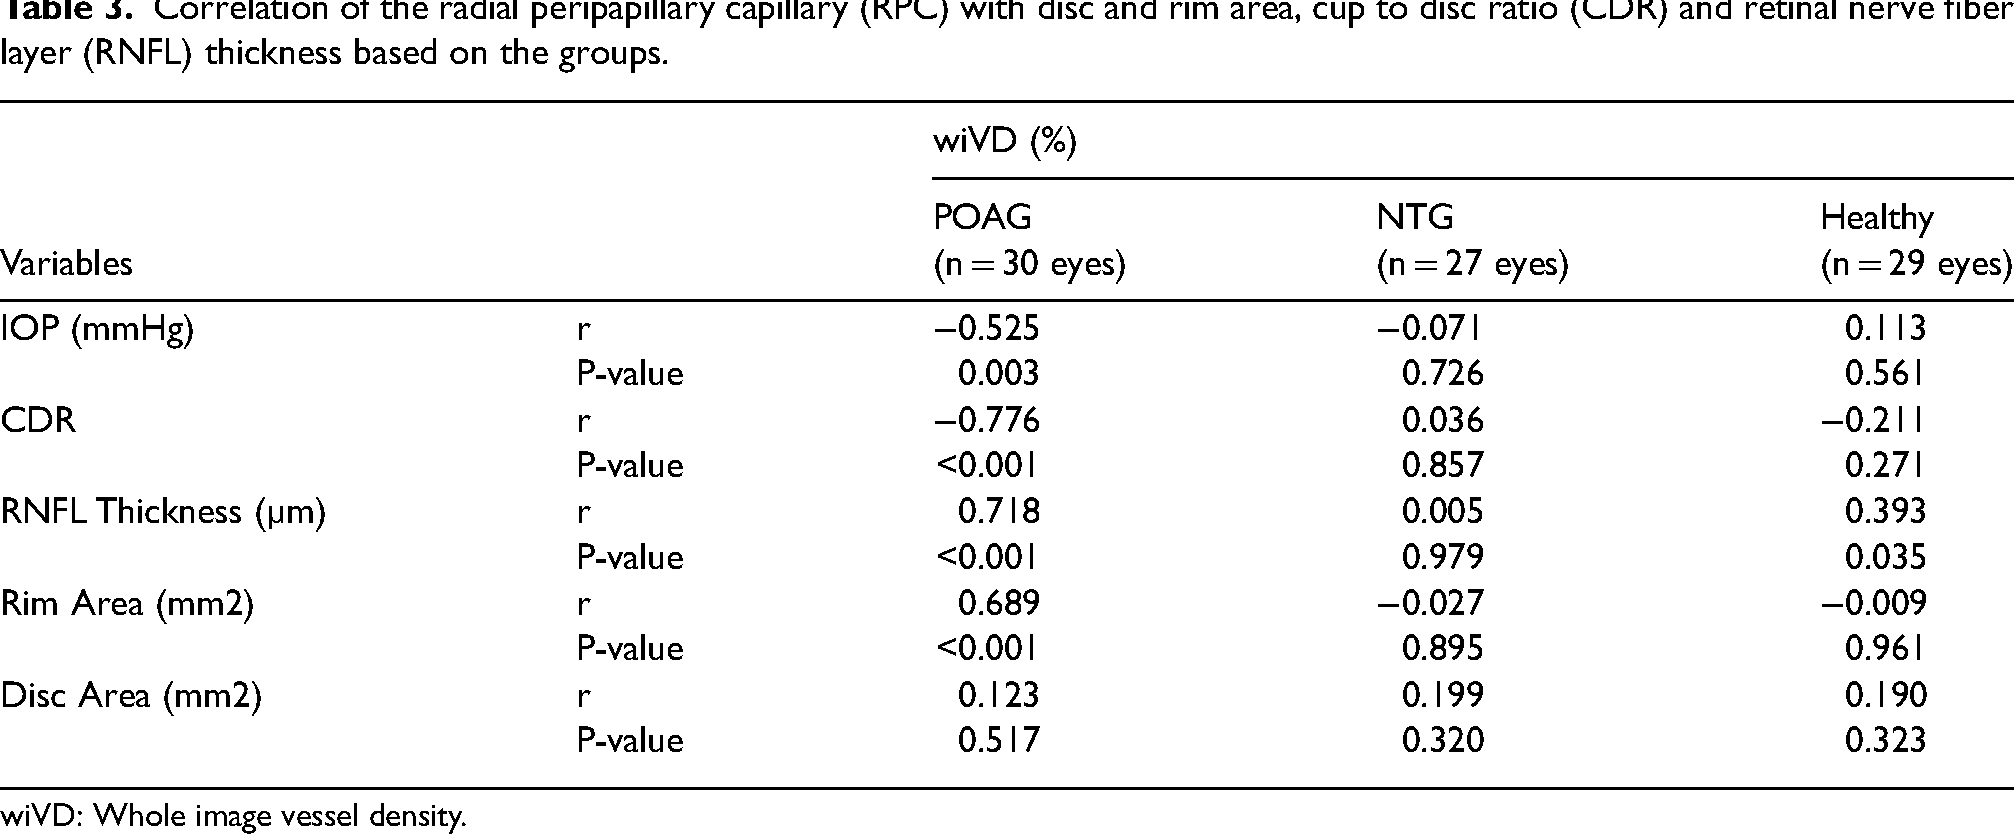
wiVD: Whole image vessel density.
In POAG group, RPC was positively correlated with RNFL thickness (r = 0.718) and rim area (r = 0.689), and negatively correlated with IOP (r = -0.525) and CDR (r = -0.776). There was no significant correlation between RPC and any of the NTG group's assessed parameters, and it showed a positive correlation only with RNFL thickness (r = 0.393) in healthy eyes.
Multiple linear regression analysis was carried out separately in each group to investigate the relationship between vessel density, age, IOP, rim area, RNFL thickness, CDR, and disc area. There was a significant relationship between CDR and vessel density (P = 0.001) in the POAG group and between RNFL thickness and vessel density (P = 0.025). For CDR, there was a 32.63 percent decrease in RPC for each additional unit in the CDR, while for each extra micron in RNFL thickness, RPC increases by 0.112. The analysis showed that 67.2% of the variation in RPC could be explained by the model containing CDR and RNFL thickness. [Vessel Density = 55.626–32.63 (CDR) + 0.112 (RNFL)]
In NTG eyes, none of the independent variables had a significant relationship with RPC, while in the normal eyes there was a significant relationship between RNFL thickness and vessel density (P = 0.035), so there was a 0.069 percent increase in RPC for each extra micron nerve fiber thickness. The model containing RNFL can predict 38.8% of the changes in RPC. [Vessel Density = 43.808 + 0.069 (RNFL)]
The mean radial peripapillary capillary (RPC) for different disease severities in glaucoma patients is illustrated in Figure 1. (Figure 1) There was a statistically significant difference in the mean RPC in mild, moderate and severe glaucoma. (P < 0.001) Multiple comparisons showed statistically significant differences between all pairs for RPC.
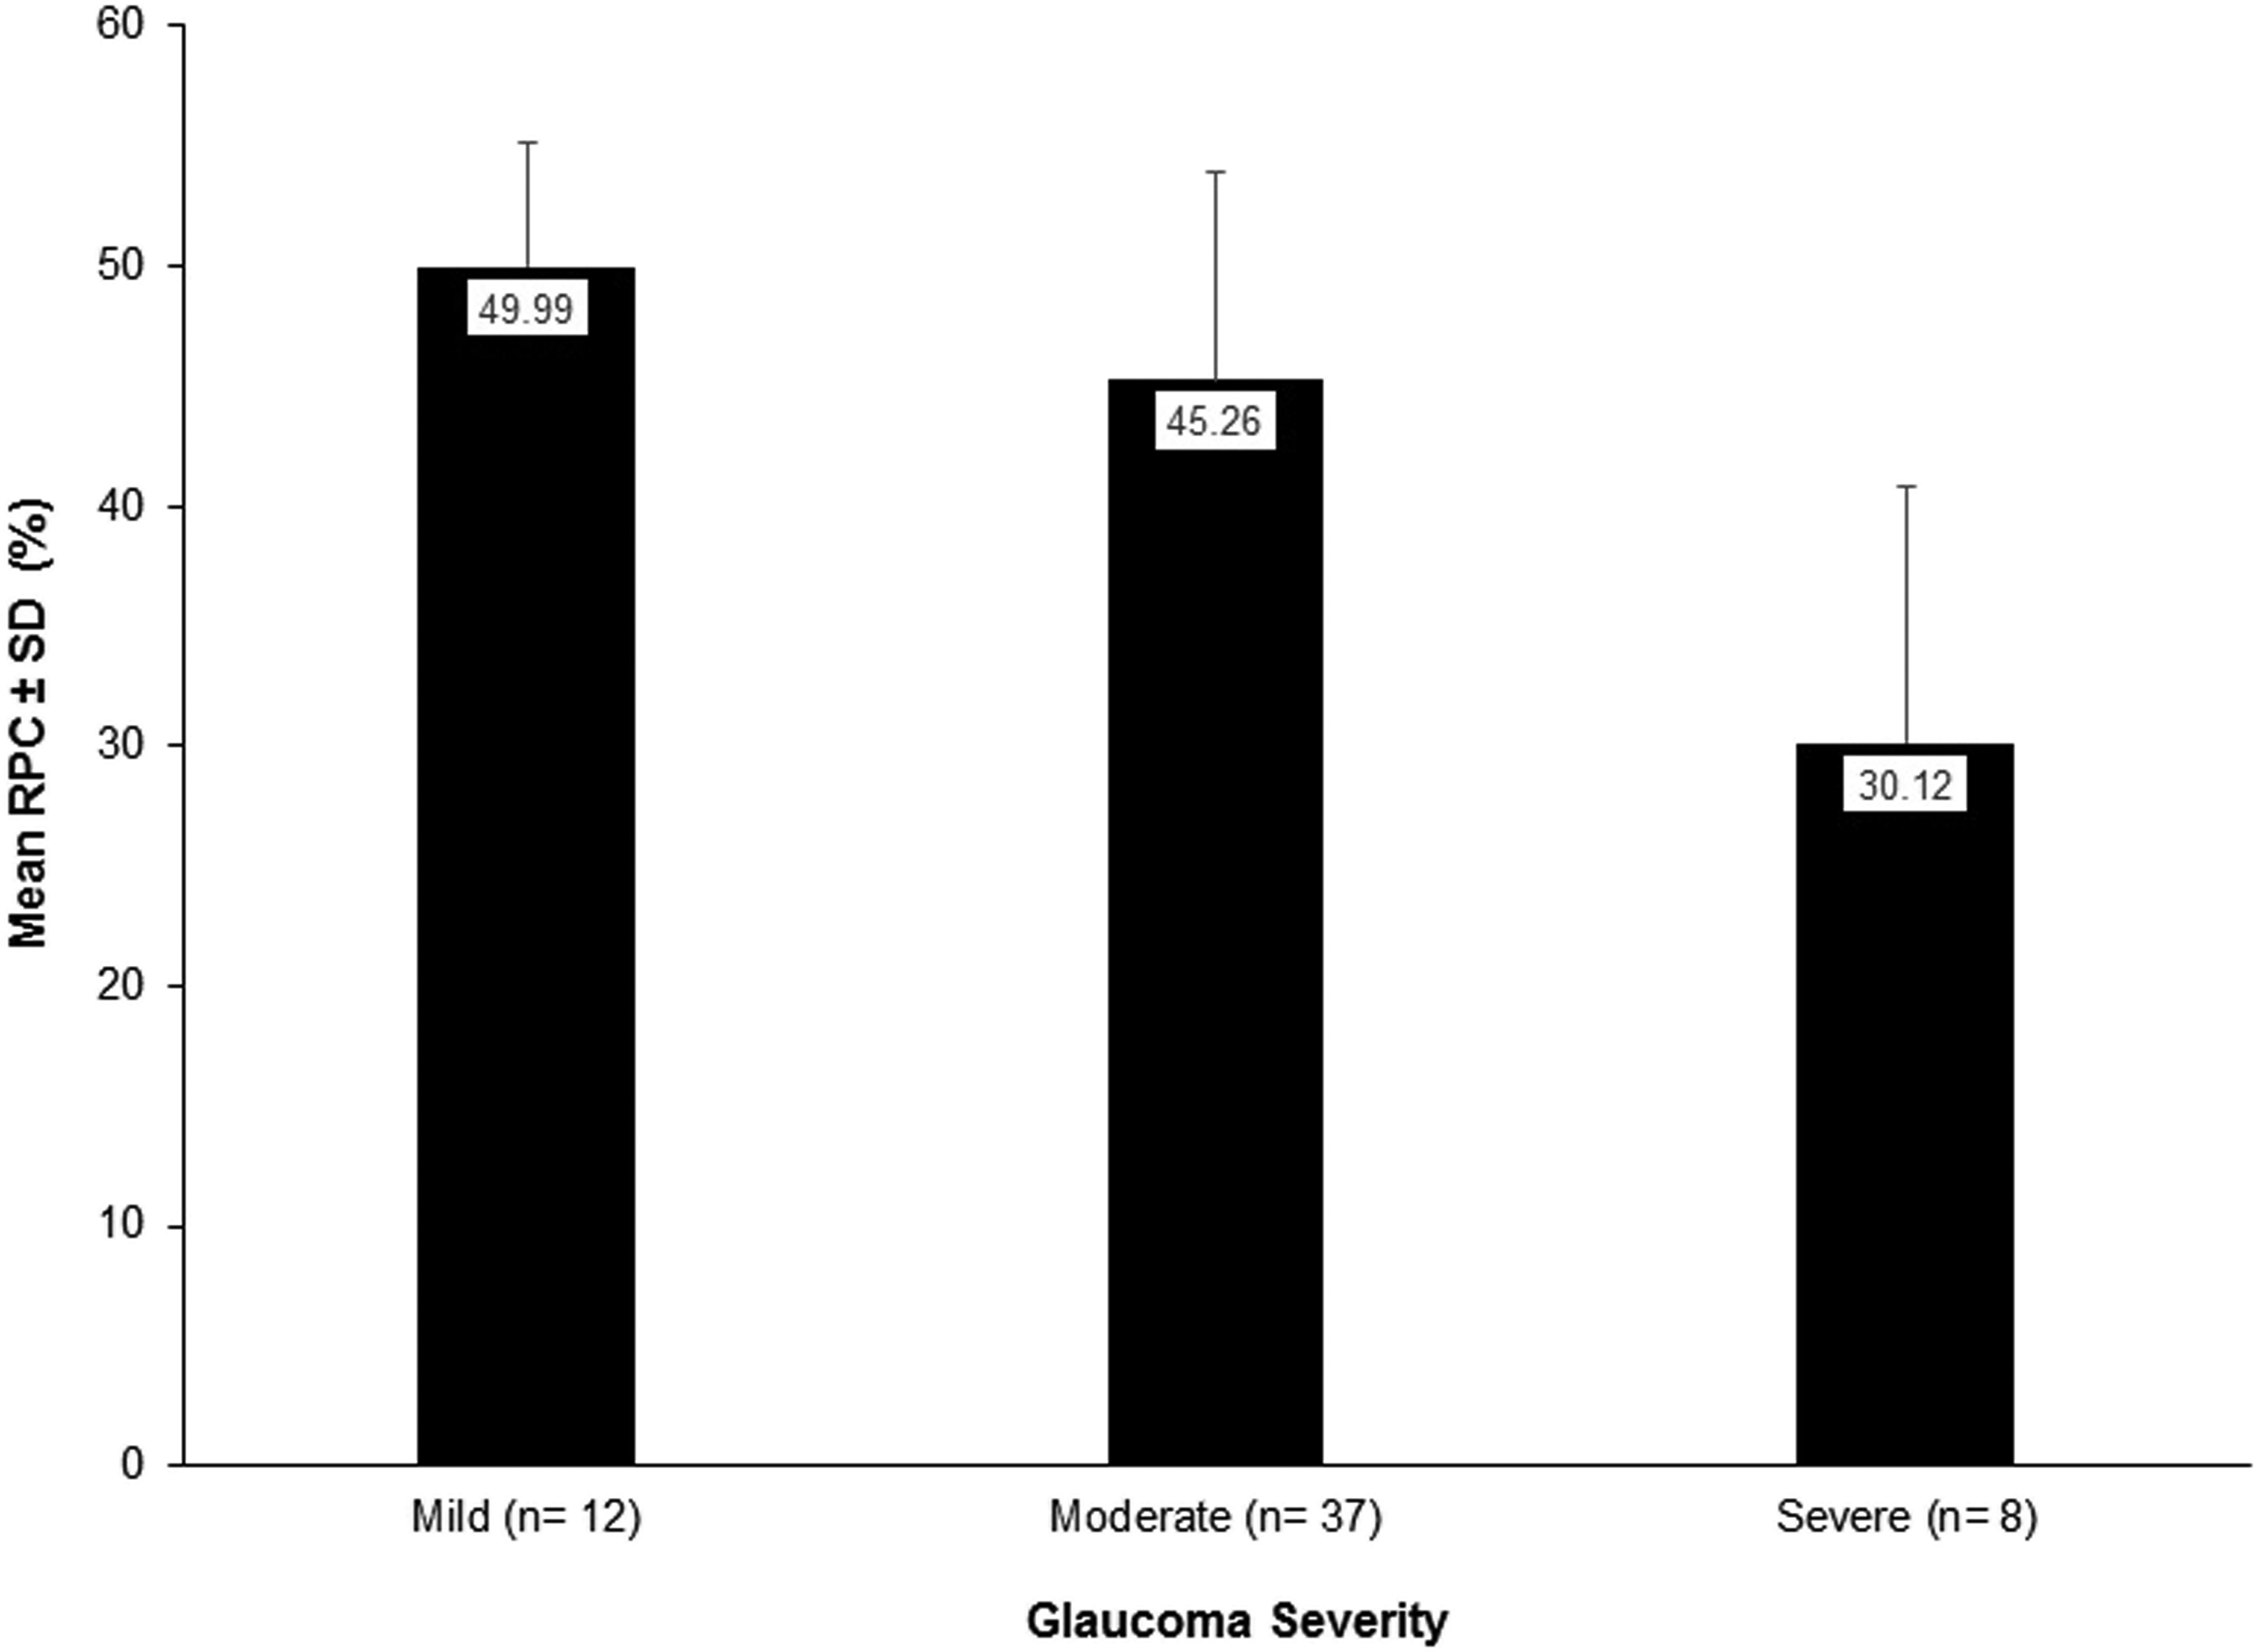
Bar chart of the radial peripapillary capillary (RPC) for different disease severities in glaucoma patients. (n = 57).
Discussion
Evaluation of the optic nerve head perfusion using OCTA in both types of glaucoma and healthy individuals showed that the vessel density in the POAG group was significantly lower than the NTG (8.25%) and healthy (11.7%) groups. In addition, vessel density was significantly higher in early/mild stages of the glaucoma compared to more advanced stages. While the RNFL thickness and neuroretinal rim area were not statistically significantly different between the healthy eyes and the NTG group, the vessel density and cup to disc ratio were different statistically. Considering the effect size of each parameter, the strongest predictor of differences among these three groups was cup to disc ratio (CDR), and after that RNFL thickness, RPC, rim area, and disc area were the predictors in decreasing order.
Another distinctive feature of the current study is the presentation of models for predicting vessel density variations based on the optic disc's structural and morphological parameters and the thickness of the retinal nerve fiber in healthy eyes and eyes with POAG. The predictors in the best fit model in the POAG group were RNFL thickness and CDR, while it was only the RNFL thickness in the normal eyes. For each micron increase in the RNFL thickness, the RPC increases by 0.112 and 0.069 percent in POAG and normal eyes, respectively.
Jia et al. first described SSADA algorithm as a technique in OCT angiography to detect the flow of red blood cells of retinal and choroidal vessels even in fine capillaries using an intrinsic motion contrast algorithm.15,18 Previous reports studied the analysis of OCTA parameters to differentiate glaucomatous eyes from normal eyes using perfusion of the peripapillary area as well as the macular zone.15,20–25 Consistent with Liu et al. & Rao et al. studies in comparison of POAG vs. normal eyes,26,27 lin et al. in comparison of NTG vs normal eyes, 16 Bhalla et al. in POAG, NTG and normal eyes, 17 the current study showed that radial peripapillary capillary reduced further in the eyes with POAG compared to NTG. This may be related to either the overall increased dosage of eye drops and medication use in POAG patients with subsequent effects on ocular perfusion pressure or due to different pathophysiological processes of these two types of glaucoma.28,29
Vascular density in both POAG and NTG patients decreased by 11.7% and 2.97% compared to the normal eyes, confirmed the results of previous studies analyzing RNFL peripapillary capillaries, 30 and entire peripapillary retina. 22
Scripsema et al. reported mean global capillary density values of 33.31, 36.48, and 41.88% in a scan area 4.5 × 4.5mm2 in POAG, NTG, and normal eyes, respectively, 30 and the current study generally confirms their findings.
It was reported that vascular changes in the peripapillary region in OCTA maps might be a reliable indicator to detect glaucoma and it is comparable to the RNFL thickness. 22 The present findings support the hypothesis of vascular changes in the development of glaucoma to some extent, while the RNFL thickness was not different between the NTG and normal eyes. Using OCTA, it was shown that the peripapillary and optic disc vessel densities were significantly reduced in locations corresponding with the areas of the visual field loss, and a decrease in vessel density was associated with a higher total mean defect in the visual field in glaucoma patients, 31 which is consistent with the findings of the present study. Contrary to the results of Akagi et al., capillary vascular density in NTG eyes was significantly lower than in healthy eyes, despite the insignificant reduction in RNFL thickness.
One of the limitations of the present study was the relatively small sample size. Other limitations were the cross-sectional design of the current study, assessing only the whole image RPC density without sector analysis, and the lack of comparison of the number of medications between the NTG and POAG groups. Further studies with a larger number of patients are needed to confirm these findings and assess changes in the ocular perfusion over time. In addition, investigation of variations in vascular density following various interventions such as pharmacological agents can be recommended for future studies.
In conclusion, as measured by OCTA, optic nerve head vascular density is reduced in both normal and high intraocular pressure glaucoma (NTG & POAG), and shows a further decrease in the advanced stages of glaucoma. The radial peripapillary capillary (RPC) in the NTG eyes was significantly lower than in the healthy eyes, despite no difference in RNFL thickness and neuroretinal rim area between them. Almost 67% of the variations in RPC can be predicted using RNFL thickness and CDR in the POAG and near 39% of its changes by RNFL thickness in the normal eyes.
Footnotes
Acknowledgements
All authors have equal contribution to this paper. The authors would like to thank the participants who made this study possible. This research was supported by the Deputy of Research of Zahedan University of Medical Sciences and was approved by the Ethics Committee of Zahedan University of Medical Sciences, Zahedan, Iran. (IR.ZAUMS.REC.1399.413).
Declaration of conflicting interests
The author(s) declared no potential conflicts of interest with respect to the research, authorship, and/or publication of this article.
Funding
The author(s) received no financial support for the research, authorship, and/or publication of this article.