
Abstract
Purpose
The aim of this study is to analyze the distribution of visual field (VF) mean defect (MD) in six subgroups of glaucoma patients at baseline and follow-up.
Methods
We assessed glaucoma patients treated in a Spanish tertiary care setting with a follow-up of at least 10 months. We have included 1036 visual fields and the following glaucoma subtypes: open-Angle Glaucoma (OAG); Angle-Closure Glaucoma (ACG); Congenital Glaucoma (CG); Ocular hypertension (OHT); Pseudoexfoliative Glaucoma (PSXG); Pigmentary Glaucoma (PG). We have calculated the baseline MD and the progression MD. We have stratified the MD progression in slow (MD rate > −0.5 dB/year); moderate (MD rate between −0.5 and −1 dB/year) fast (MD rate between −1 and −2 dB/year) and catastrophic (<−2 dB/year) progression and their glaucoma subtype.
Results
The glaucoma types with the worse baseline MD were CG and PG. We found significant differences after comparing the baseline MD of CG and OAG, ACG, OHT and between PG and OHT. Concerning the MD progression rate: OAG 73.54% showed slow MD progression rate; 9.85% fast; 7.3% moderate and 9.3% catastrophic. ACG 82.22% slow; 8.89% moderate; 2.22% fast and 6.67% catastrophic. CG 68.83% slow; 9.09% fast; 7.79% moderate and 14.29% catastrophic. OHT 88.6% slow; 6.14% moderate; 4.39% fast and 0.88% catastrophic. PSXG 63.24% slow, 13.24% moderate; 8.8% fast and 14.7% catastrophic. PG 89.29% slow; 3.57% moderate and 7.1% fast.
Conclusions
The CG requires special attention because of its aggressive presentation and progression.
Synopsis
Baseline MD and its progression were analyzed from 1036 visual fields belonging to patients with six different glaucoma types. To summarize, CG demonstrates a more aggressive nature, while the OAG-PSXG and OHT-ACG pairs exhibit similar tendencies.
Introduction
Glaucoma is a chronic, progressive optic neuropathy, with characteristic visual field (VF) loss. 1 It is a disease that remains uncurable although it is the first cause of blindness worldwide. 2 Following its progression is crucial to control it. Standard automated perimetry (SAP) is the most common method for assessing glaucoma progression. 3
There are descriptive studies about the natural history of VF progression in glaucoma large populations.4–6 However, little is known whether different glaucoma subtypes tend to progress at different rates in clinical practice when the best treatment is given. The Early Manifest Glaucoma Trial have proved that the exfoliation glaucoma was associated with a twofold risk of reaching a progression endpoint 7 while other studies concluded that the glaucoma phenotype is not an independent risk factor for VF progression. 5
The rate of visual field progression, defined as the mean deviation (MD) rate, is usually slow (<−1 dB/y) in most of the patients with glaucoma. Recently, Heijl et al. reported a median MD rate of−0.62 dB/y in patients with glaucoma undergoing routine care. 3 However a small percentage show fast or catastrophic progression. 8
It is important for several reasons to analyze the progression of the visual field in a large group of patients with different types of glaucoma where the best medical and surgical treatment is given.9,10 On the one hand, it allows us to know the real visual impairment that glaucoma produces in society. On the other, it makes possible to distinguish which types of glaucoma show a greater probability of progression and therefore require closer monitoring. 4
The aim of this study was to determine whether the glaucoma subtype, can predict the mean defect and the progression mean defect of the VF. For this, we analyze the distribution of visual field progression in a cohort of glaucoma patients belonging to a tertiary hospital in Madrid.
Methods
Patients
We included subjects evaluated in the glaucoma department of the Hospital Clínico San Carlos, a tertiary care hospital, in Madrid. To be included in the study, patients had to have one of the following diagnoses open-Angle Glaucoma (OAG); chronic Angle-Closure Glaucoma (ACG); Congenital Glaucoma (CG); Ocular hypertension (OHT); Pseudoexfoliative Glaucoma (PSXG); Pigmentary Glaucoma (PG) and a follow-up of at least 10 months with at least 5 visual fields. Only patients followed with the same perimeter strategy were analyzed. All congenital glaucoma patients were primary congenital glaucoma.
Data from all patients was collected including age, sex, date of diagnosis, follow-up time, number of examinations, mean defect and variance of visual field in each of the examination.
Data Selection
We exported the EyeSuite Perimetry Statistical database from the Octopus 600 Perimetry (Haag-Streit International). We selected the first two and the last visual fields done with a G program, TOP strategy, stimulus size of 3, duration of 100 ms, standard method and white color. Using the values of the 59 test locations, we calculated the Mean Sensivity (MS), Mean Defect (MD), Square of loss variance (sLV) of each VF as follow (Figure 1).
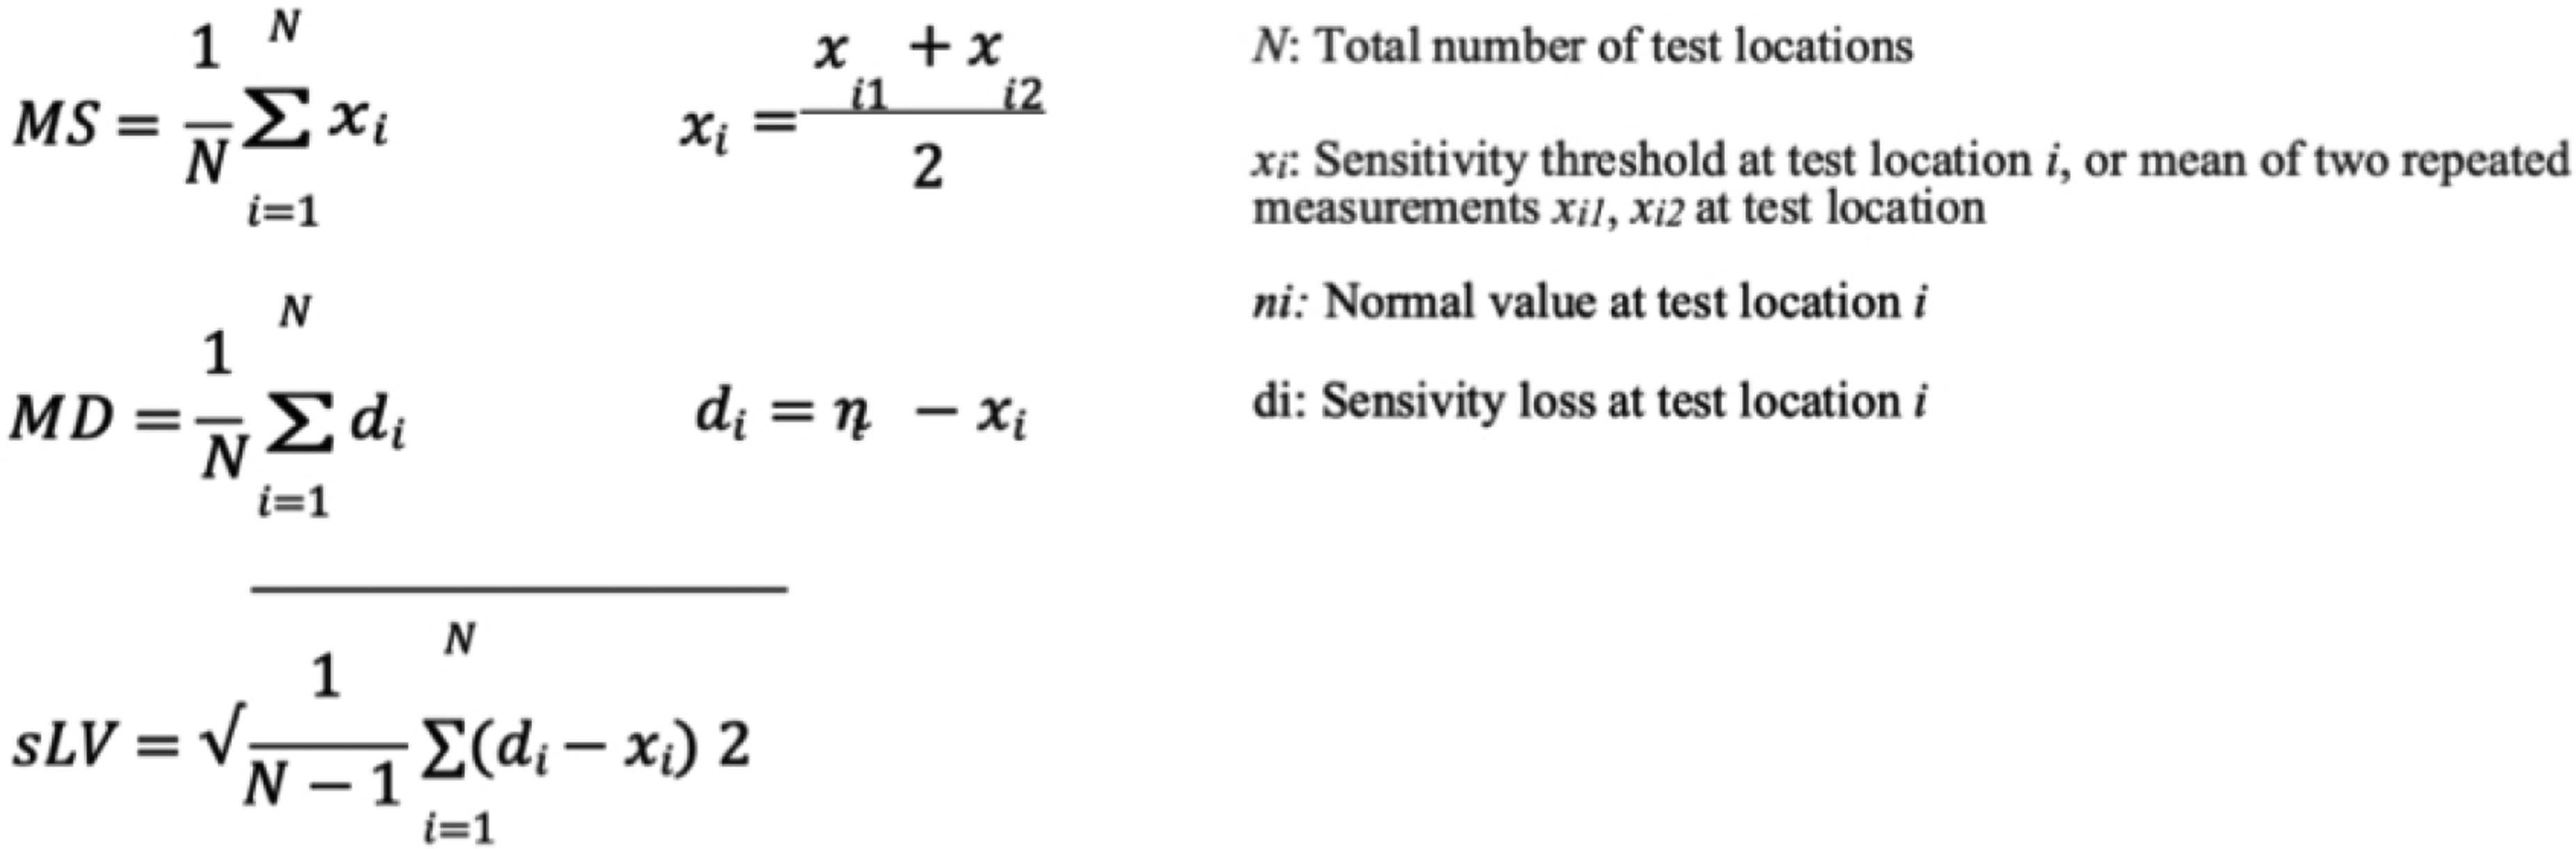
Methods for calculating MS; MD; and sLV. MS: mean sensitivity; MD: mean defect; sLV: Square of loss of variance.
From each patient we selected the first two VFs and the average of both was made. This was the baseline measurement at diagnosis. We also calculated the progression of the MD, by selecting the last VF and the average of the first two VFs. We did this process for the global VF in each glaucoma subtype.
Unreliable visual fields (i.e. those with fixation losses >20%, false-positive rates >15%, and false-negative rates >33%) were excluded from each series (total of 124 patients). We then excluded those who had no diagnostic category (62 patients), and then those with four or fewer fields in the series (132 patients). Over 97% of the population were Caucasian.
MD progression was used to determinate the proportions of slow (MD rate > −0.5 dB/year); moderate (MD rate between −0.5 and −1 dB/year) fast (MD rate between −1 and −2 dB/year) and catastrophic (<−2 dB/year) progression and their glaucoma subtype.
Data availability statement
Participants data will be available. Individual participant data that underlines the results reported in this article, will be shared after deidentification (text, tables, figures and appendices). Study protocol, statistical analysis plan and analytic code will also be available. Data will be available from beginning 3 month and ending 5 years following article publication. Data will be shared with researchers who provide a methodologically sound proposal.
The data that supports the findings of this study are available on request from the corresponding author [SGC]. Moreover, to gain access data requestors will need to sign a data access agreement.
Statistical analysis
A descriptive analysis was carried out with the means and standard deviations of the variables mean age, mean follow-up, and mean number of visual fields.
Analysis of mixed model adjusting for sex and age were done to investigate the differences in the baseline MD between the different groups of diagnosis. Bonferroni correction was applied for multiple comparisons between study groups.
The same method was used to analyze the progression of the MD in the different diagnosis groups. Bonferroni correction was applied for multiple comparisons between study groups. Computerized statistical analysis was performed using SPSS Statistics (version 20; IBM, Armonk, NY, USA).
Results
We enrolled 1036 eyes (56.17% females and 43.82% males). Mean age at baseline assessment was 43.8 years. The average follow-up was 5.27 ± 4.4 years. Concerning the type of glaucoma: 60.38% OAG; 5.2% ACG; 8.5% CG; 14.1% OHT; 8.8% PG; 2.8% PSXG.
The result of the average age, the average number of visual fields and the average follow-up, as well as their standard deviations, according to the type of glaucoma are shown in Figure 2.
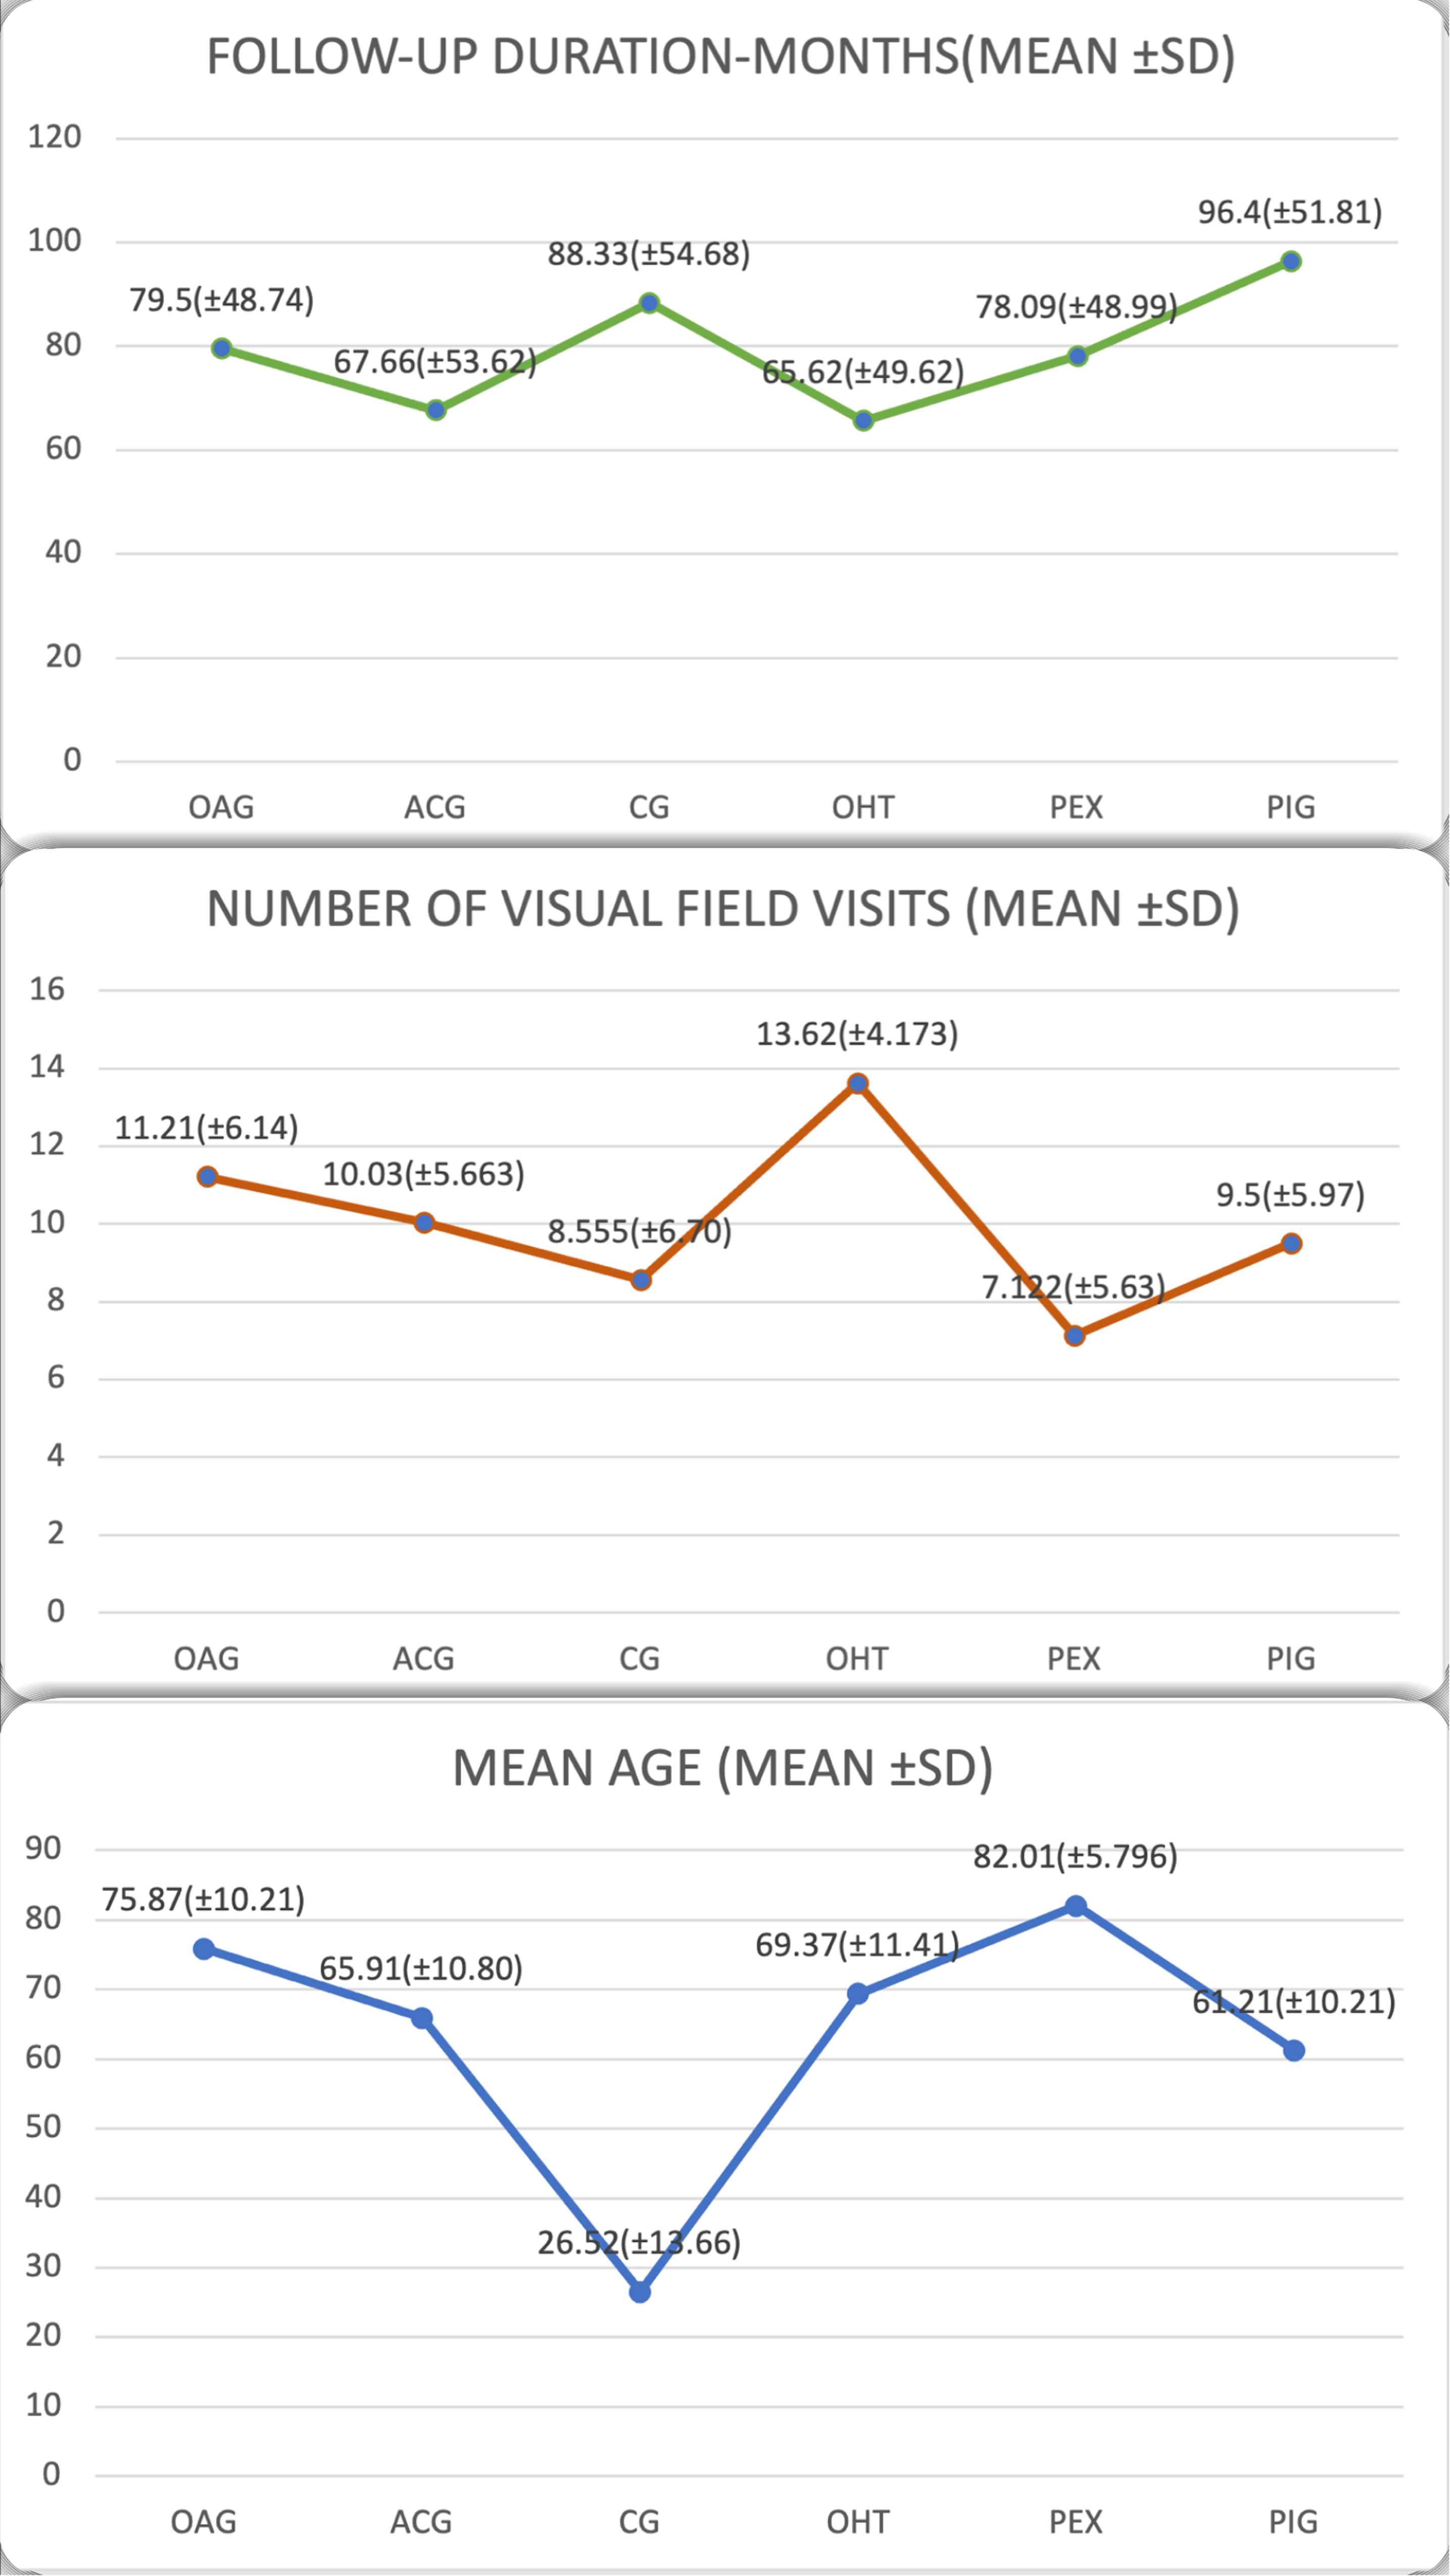
Average and standard deviations of the age, number of visual fields and follow-up according to the type of glaucoma.
The results of the mean of the baseline MD are represented in Figure 3. For this measurement the average of the first two visual fields were selected at diagnosis.
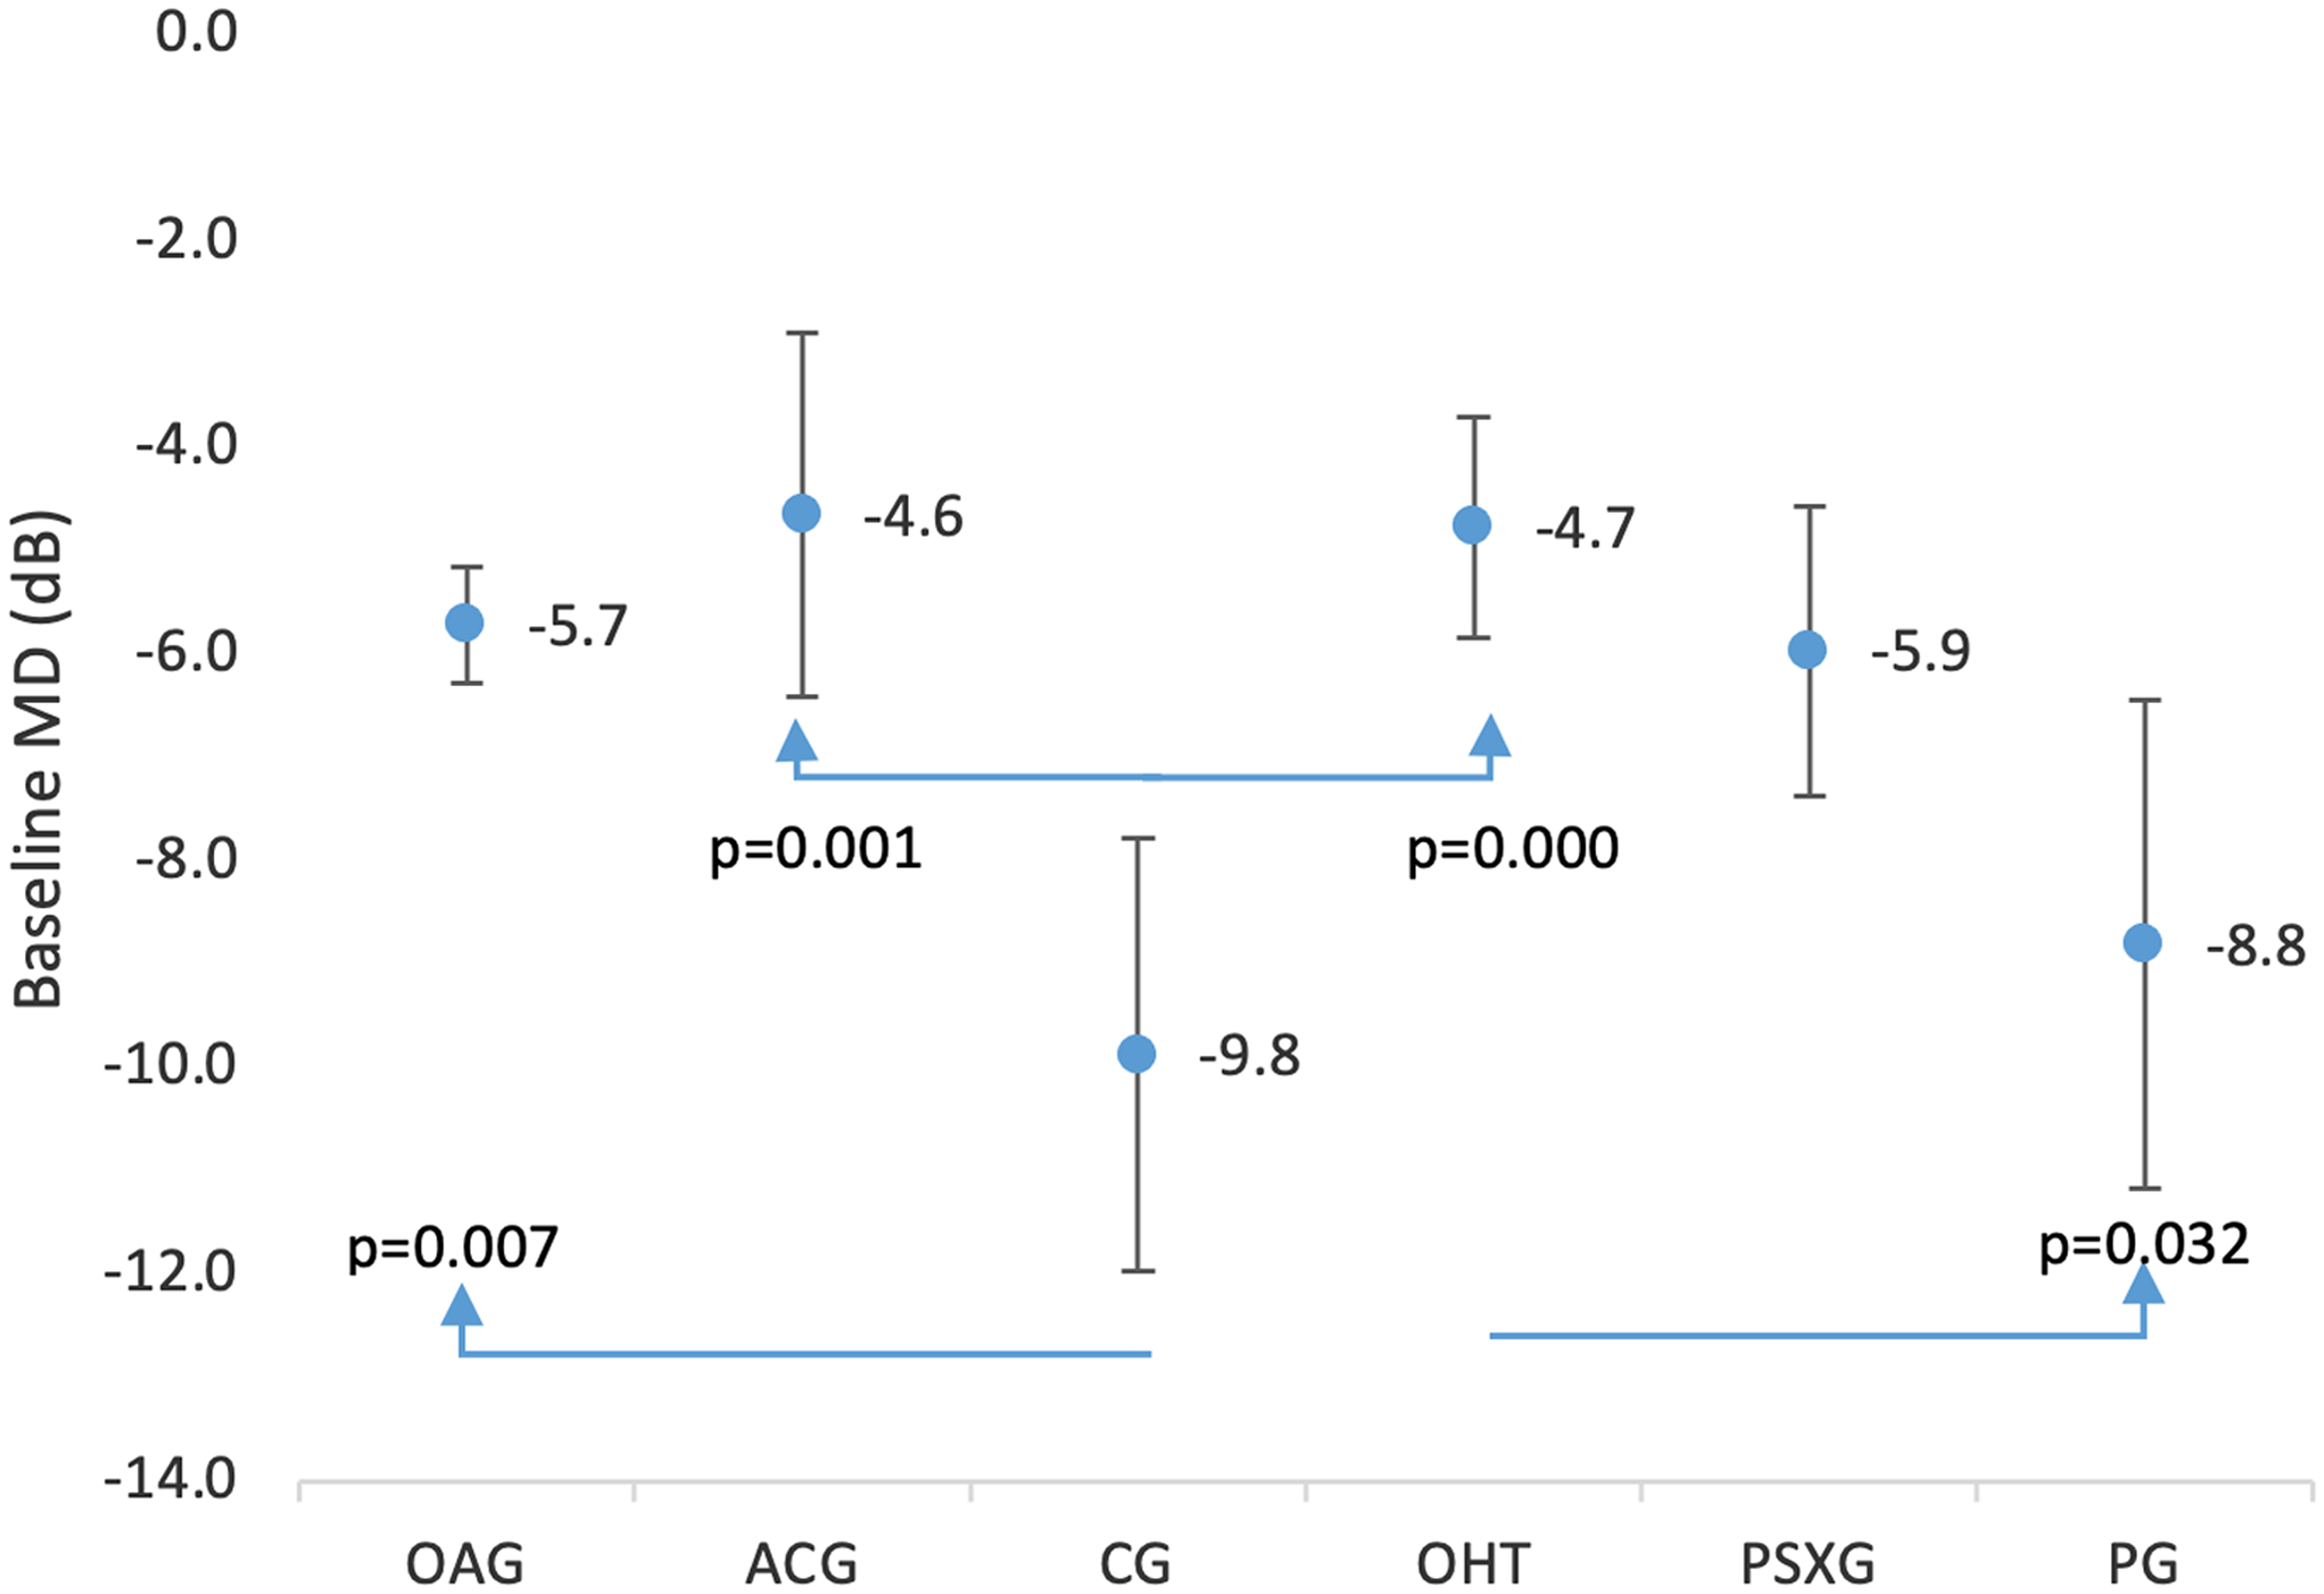
Overview of the MD at baseline in POAG; ACG; CG; OHT; PSXG; and PG. MD: mean defect; POAG: primary open-angle glaucoma; ACG: angle-closure glaucoma; CG: congenital glaucoma; OHT: ocular hypertension; PSXG: pseudoexfoliative glaucoma; PG: pigmentary glaucoma.
The glaucoma types with the worse baseline MD were CG and PG. After multiple comparisons between the different diagnosis comparing the baseline MD, we found significant result (p < 0.05) between CG and OAG, ACG, OHT and between PG and OHT. And these values are showed in Figure 3.
The results of the mean progression of the MD are represented in Figure 4. For the value of the mean progression, we have taken the baseline MD, and the last VF recorded. The mean time of follow-up was 5.27 years with a minimum of six months and a maximum of 15 years. After multiple comparisons between the different diagnosis comparing the baseline MD, we found significant result (p < 0.05) between CG and OAG, ACG, OHT and between PG and OHT.
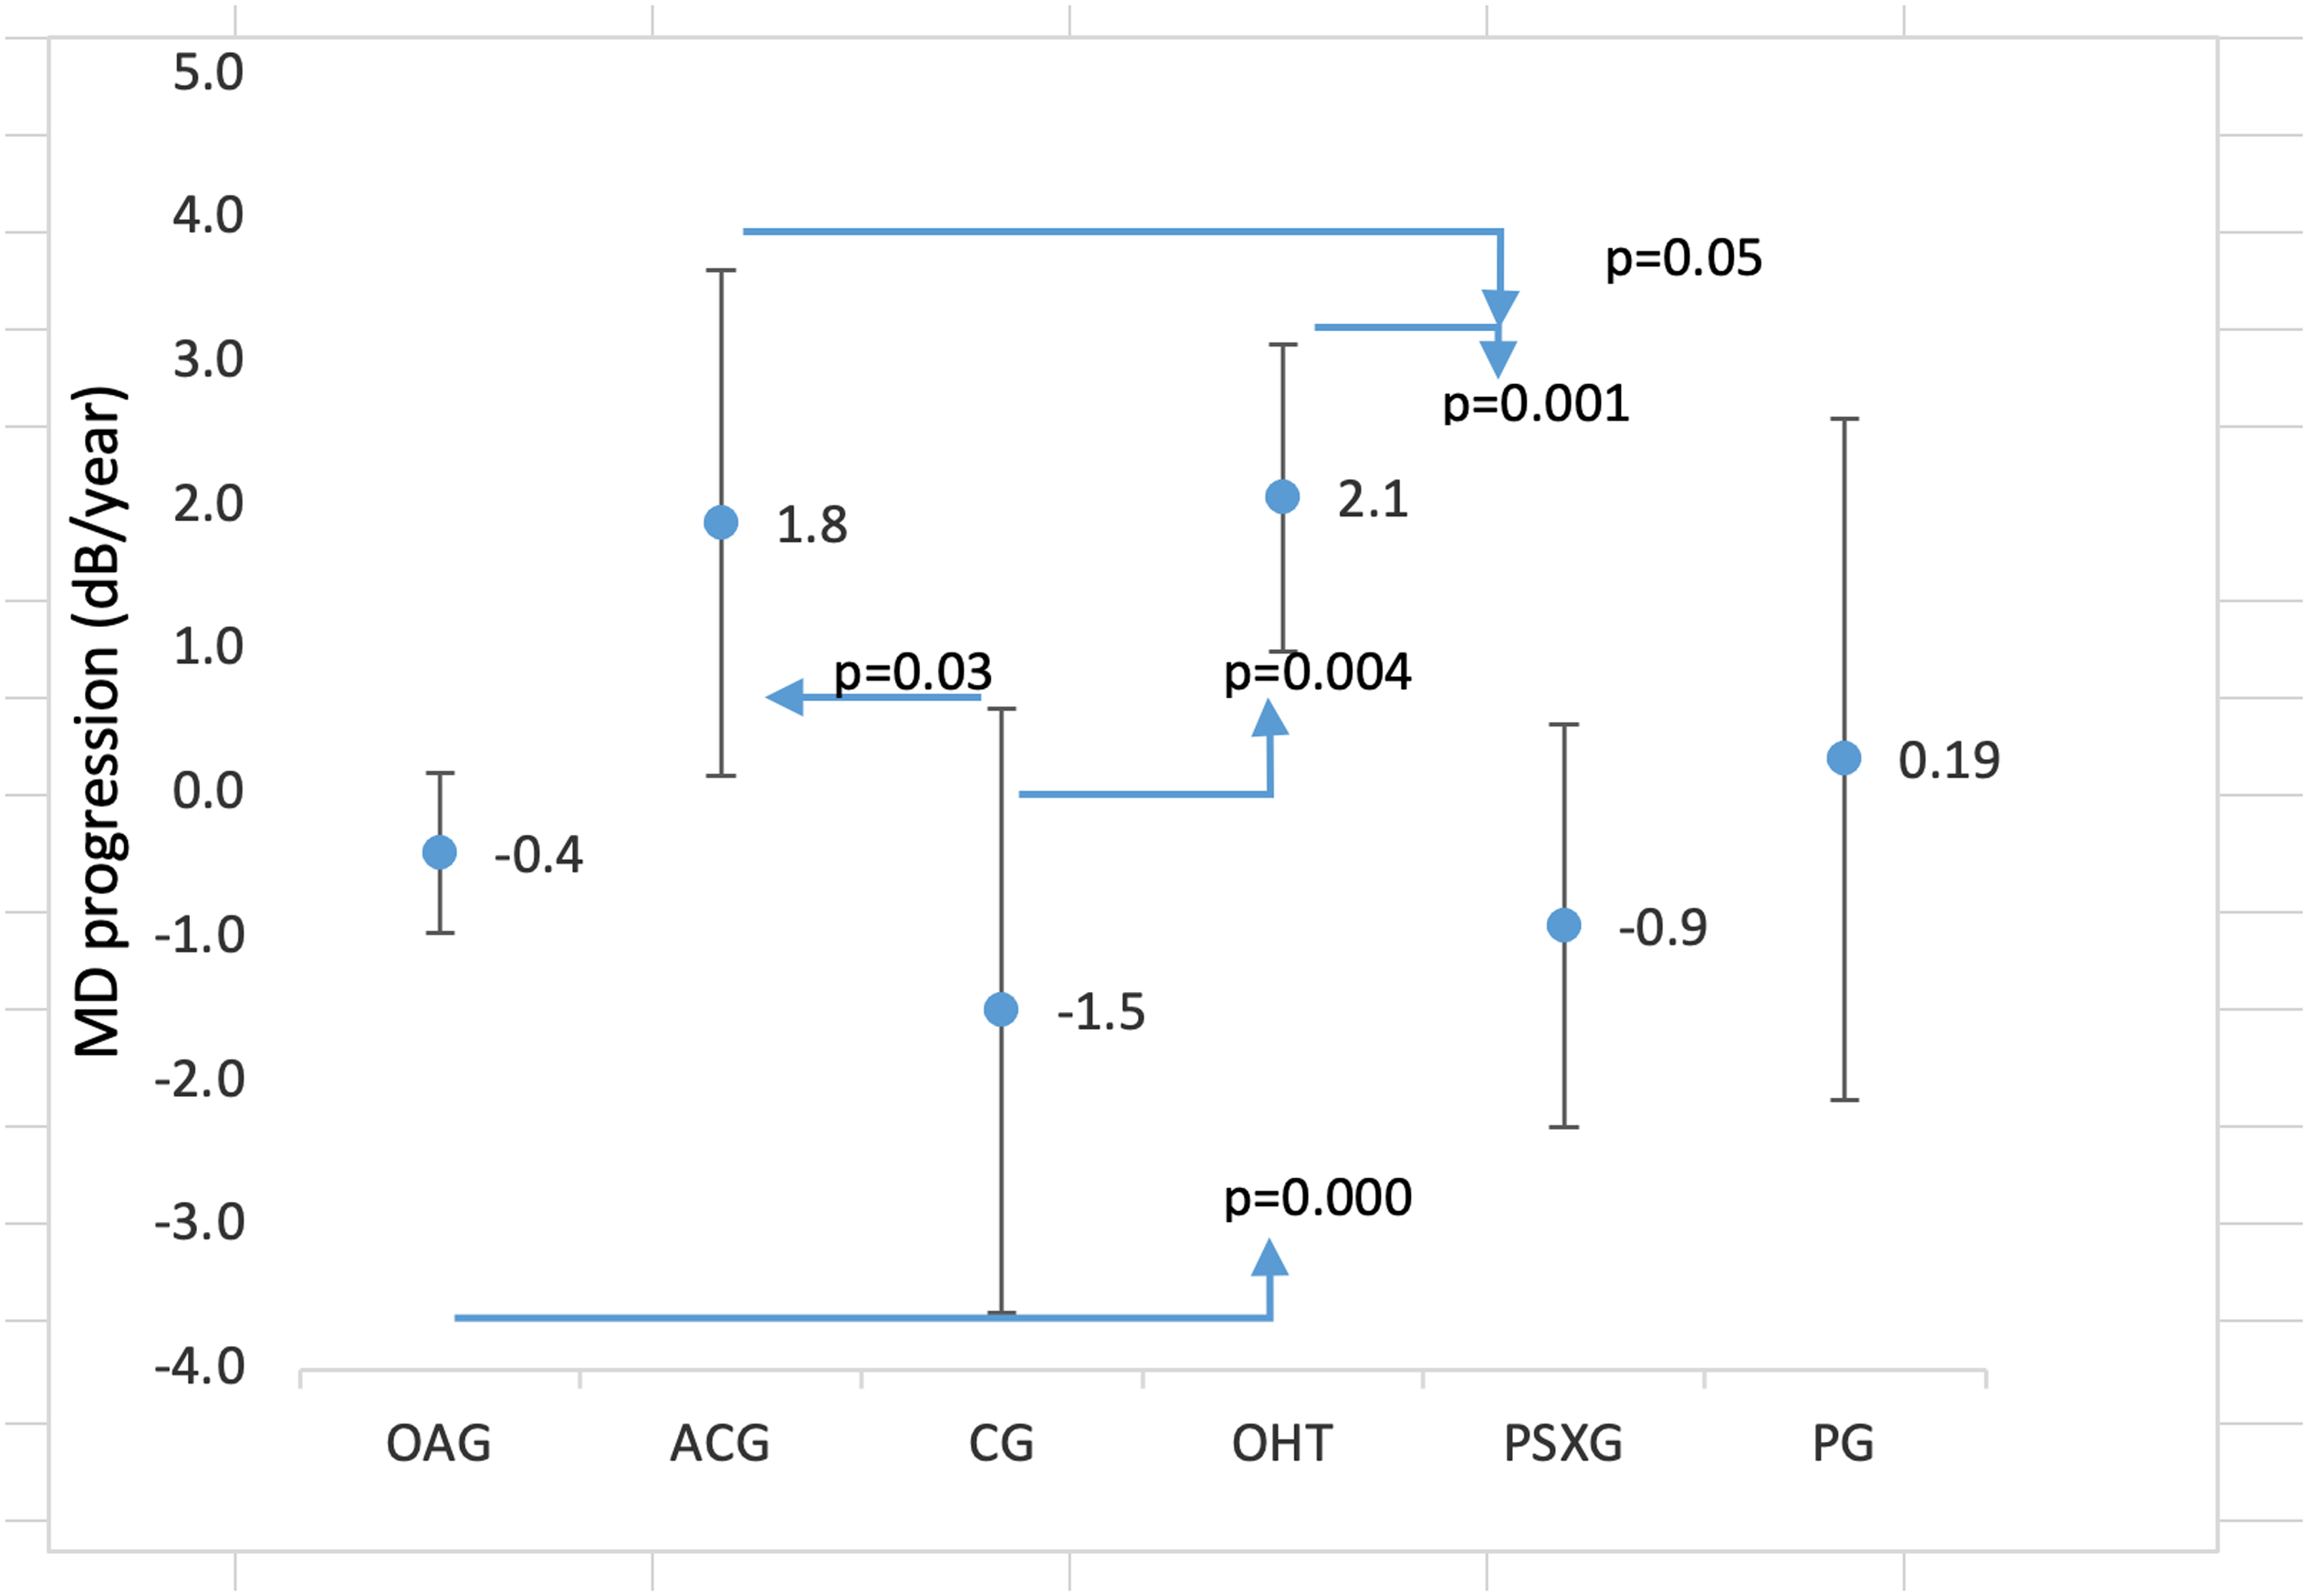
Comparison of the MD progression between different glaucoma types (POAG; ACG; CG; OHT; PSXG; and PG). MD: mean defect; POAG: primary open-angle glaucoma; ACG: angle-closure glaucoma; CG: congenital glaucoma; OHT: ocular hypertension; PSXG: pseudoexfoliative glaucoma; PG: pigmentary glaucoma.
The results of the MD progression rate: In the group of OAG (n = 548) 73.54% showed a slow MD progression rate; 9.85% fast; 7.3% moderate and 9.3% catastrophic. In the group of ACG (n = 45) 82.22% slow; 8.89% moderate; 2.22% fast and 6.67% catastrophic. The CG (n = 77) 68.83% slow; 9.09% fast; 7.79% moderate and 14.29% catastrophic. OHT (n = 114) 88.6% slow; 6.14% moderate; 4.39% fast and 0.88% catastrophic. PSXG (n = 68) 63.24% slow, 13.24% moderate; 8.8% fast and 14,7% catastrophic. PG (n = 28) 89.29% slow; 3.57% moderate and 7.1% fast (Figure 5).
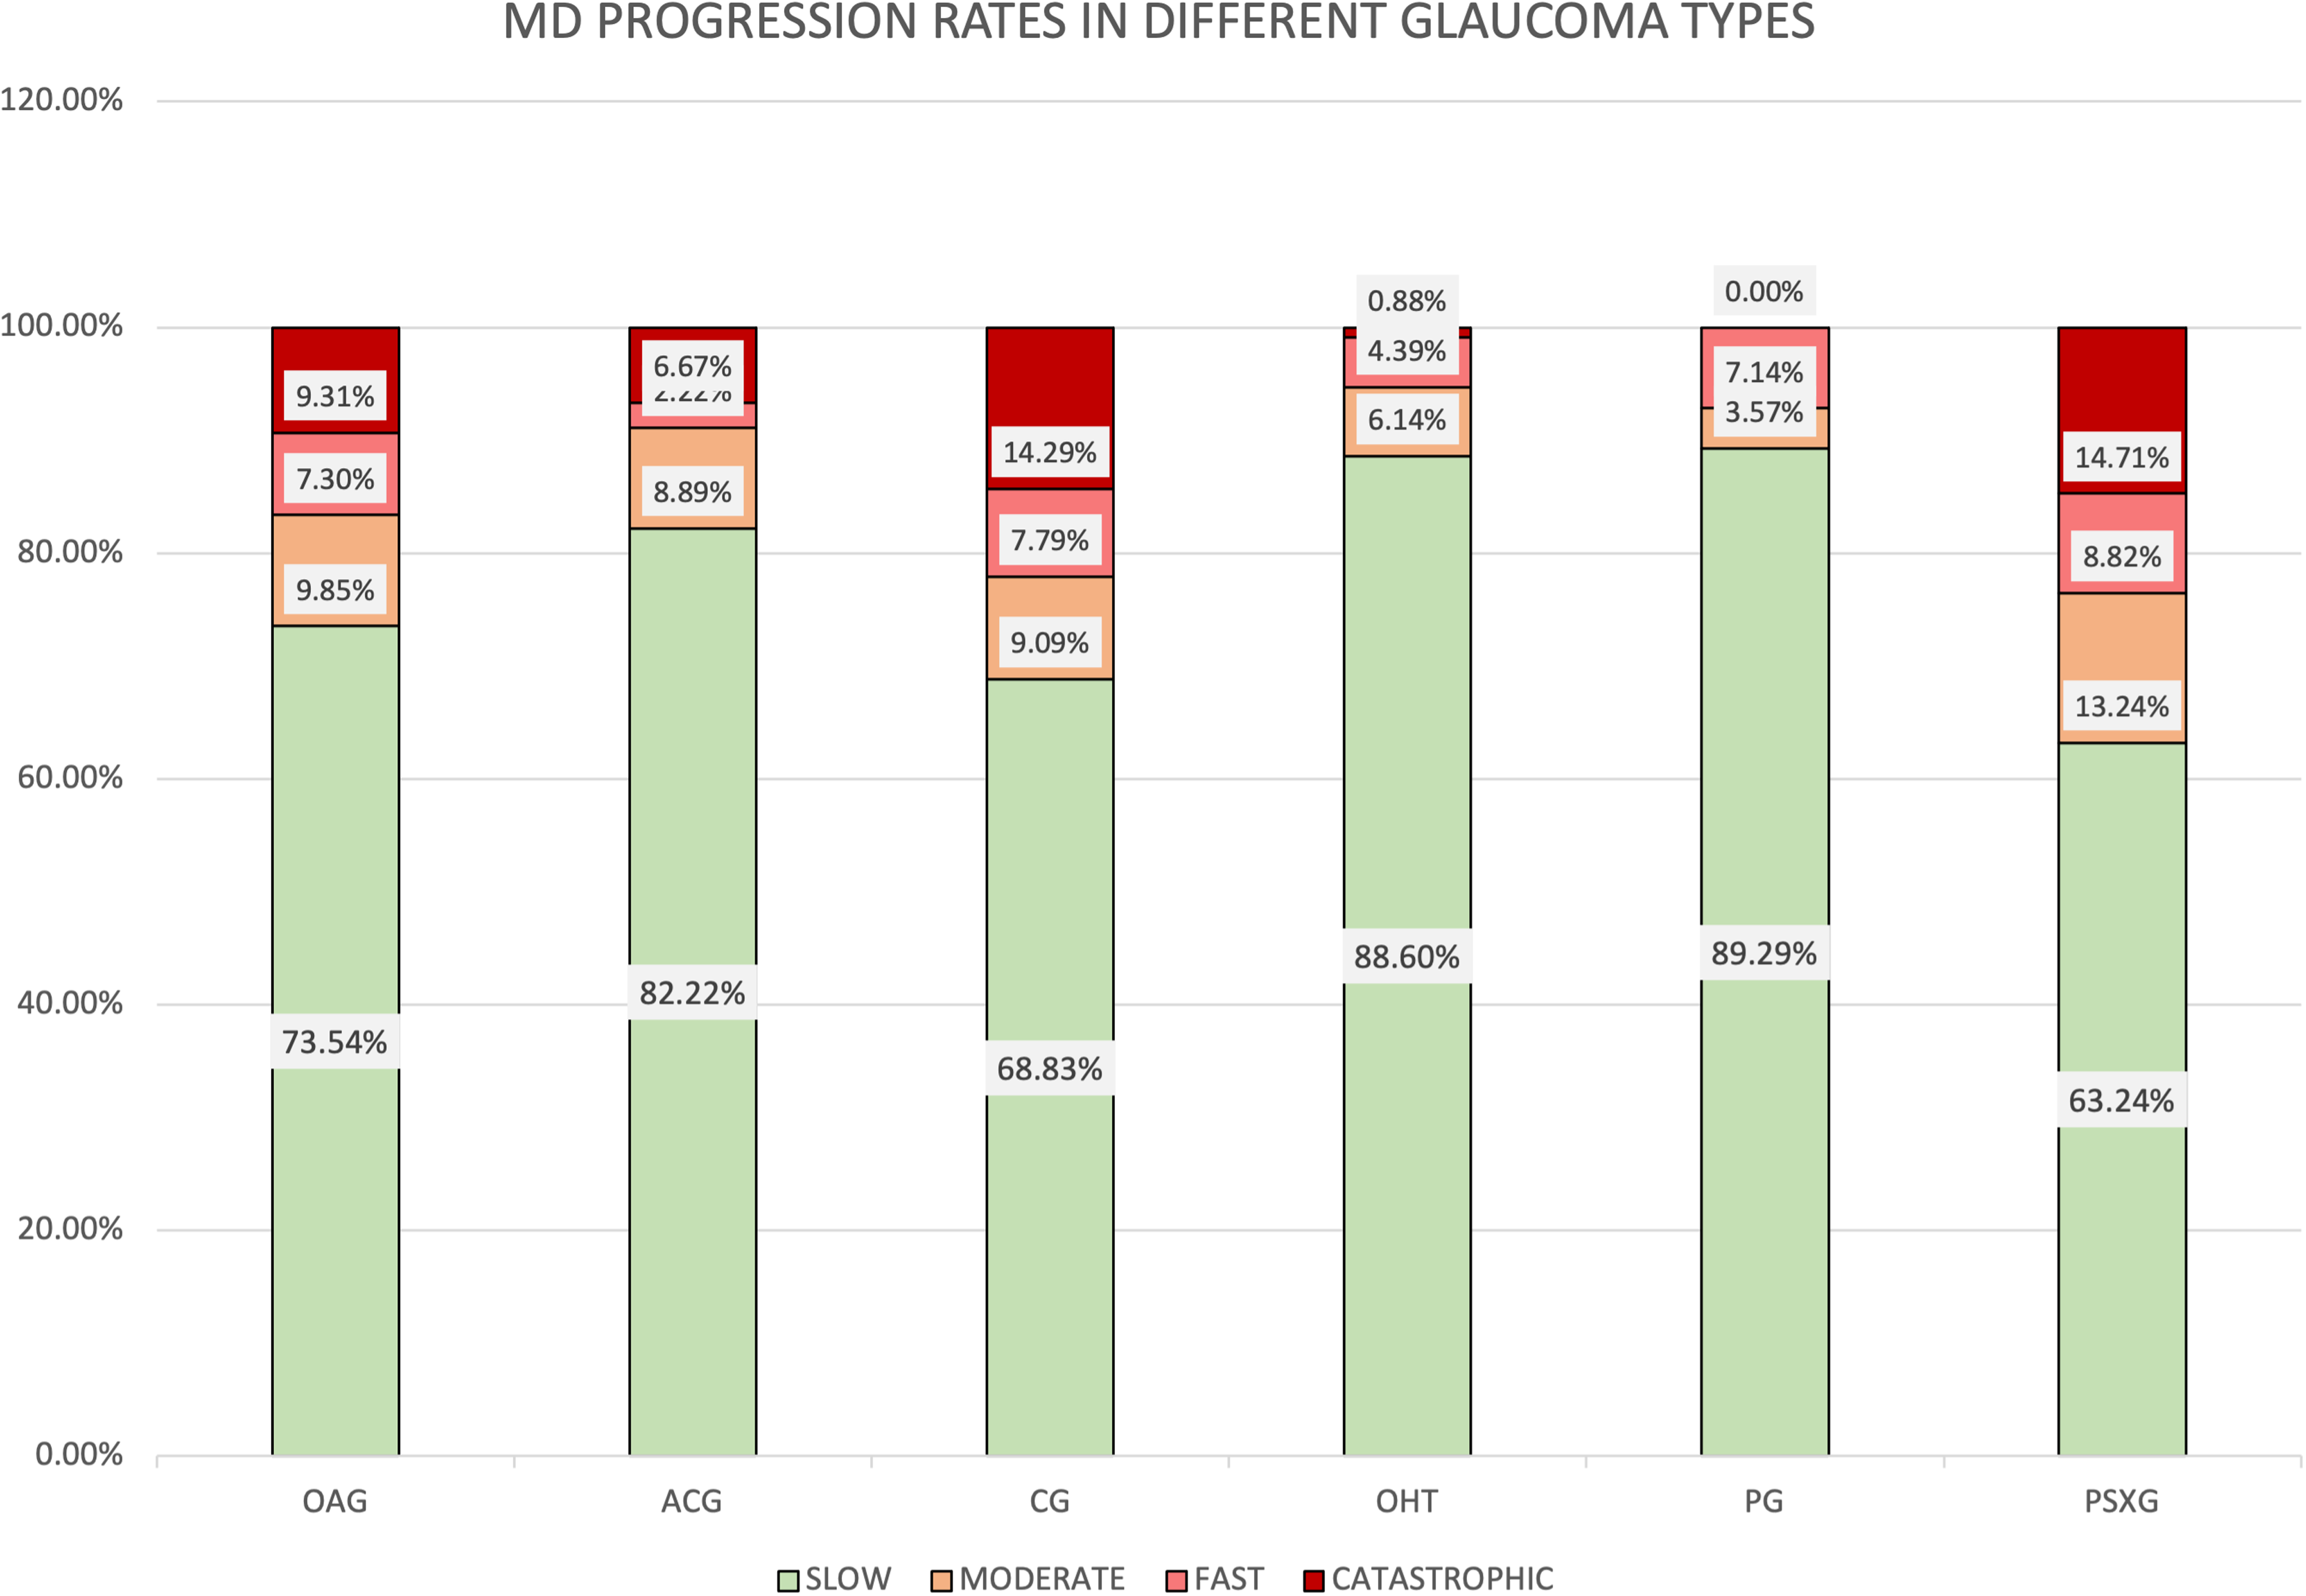
Proportion of eyes classified as slow progressors (MD rate < −1 dB/year); fast progressors (MD rate < −1 to −2 dB/year); and % catastrophic progressors (MD< −2 dB/year).
Discussion
We found similar baseline MD in some of the 6 glaucoma subtypes that we have studied. The most affected were CG (−9.9 dB) and PG (−8.8 dB). We can explain this findings based on the fact that the children with CG undertake VF examination on average at the age of 11, 11 by this time they already have had many surgeries and their visual acuity is usually low. 12 This justified a worse baseline MD on the CG.
On the other hand, patients with PG use to be young and asymptomatic these facts lead to delate diagnosis. And as a consequence they tend to have advanced glaucoma with worse baseline MD. 13
Baseline MD of OAG (−5.7 dB) showed similarities with PSXG (−6 dB) and ACG (−4.6 dB) with OHT (−4,8). However significant differences were found only after comparing CG with OAG, ACG, OHT. And OHT with PG. Other studies have found similar results, they published that patients with juvenile open-angle glaucoma (JOAG) would suffer substantial visual impartment in a significantly larger proportion than other glaucoma subtypes. 13
MD progression of the six glaucoma subtypes had a narrow range rate. This finding is similar to that reported by Anderson et al. However, in their study, they only analyzed three glaucoma subtypes (OAG, ACG and CG). 14
CG and PSXG had the higher MD progression values. Moraes et al also reported significantly higher rates of MD progression in PSXG. Other studies only found significantly higher rates of visual field progression in the group of PSXG. However this study has not included a group of CG or JOAG. 5
After analyzing the MD progression, we have found similarities with the baseline MD. OAG showed similarities with PSXG at baseline and, we find similarities in the MD progression of both glaucoma types. We have found the same fact with ACG and OHT. But not with CG and PG.
We found significant differences in the MD progression rate after comparing CG with ACG, OHT, PSXG and OAG with ACG, OHT. And OHT with PSXG.
The most different group, and with the worse MD progression rate was CG even though the best treatment was given. CG is often more aggressive and difficult to control than other glaucoma subtypes. Morin et al reported that if glaucoma is present at birth more than 50% of the affected eyes will be legally blind. 15
Based on previous study from Chauhan et al. 8 we have defined MD progression rates as slow, moderate, fast and catastrophic.
Numerous reports have described that the average rate of visual field change in glaucoma patients range from 0 to −1.1 dB/y. 16 In our study we have found that the MD progression rate was mainly slow in all the 6 different groups. This finding agrees with the study of Chauhan et al.
We also found that the percentage of catastrophic progression in the subtypes of OAG, ACG, CG and PG exceeds the fast progression. The proportion of catastrophic rates of progression published in other studies were slightly lower. This is likely due to the narrow margin that we have established in the definition of fast progression. 8
There are several limitations to the current study. The follow-up was not carried out by the same ophthalmologist. The treatment criteria are not fully standardized and this conditions the evolution of the visual fields. In addition, our hospital is a National Reference Center for the treatment of congenital glaucoma. This can lead to the accumulation of cases with a worse prognosis.
Moreover, the use of visual field (VF) testing in children can be challenging due to various factors such as their attention span, cognitive development, and ability to understand instructions. These challenges can result in worse reliability parameters, potentially affecting the accuracy of the results.
To address this limitation, we took several steps in our study. First, we ensured that the children participating in the study were of an appropriate age and had the cognitive ability to follow instructions. Additionally, we used age-appropriate testing methods and equipment to make the testing process more engaging and less intimidating for the children.
Furthermore, we provided clear instructions and explanations to the children before the test and made sure they understood the testing process. We also made efforts to keep the testing environment comfortable and distraction-free to help the children stay focused during the test.
In addition, we conducted multiple tests with each child to increase the reliability of our results. We also carefully reviewed the test results to ensure that any unreliable or inaccurate results were excluded from the analysis.
Despite these efforts, it is important to acknowledge that the limitations associated with VF testing in children can still impact the results to some extent. Therefore, further studies are necessary to improve the reliability and accuracy of VF testing in children and to develop better strategies for overcoming the challenges associated with testing.
Our study includes novel aspects that add great value to the current literature. On the one hand, we have included a large group of patients. These patients were within their usual follow-up, and the treatment received was the best available.
The hospital in which the study is carried out is a large tertiary hospital in a developed country. The hospital has all the updated medical and surgical support for the treatment of glaucoma. In addition, patients are closely monitored at this center, which guarantees the reliability of the data. Thus, in cases in which glaucoma progression is detected, we know that all possible medical means with current knowledge had been put in place.
Study subjects of prospective studies may be more adherent to treatment and less likely to be lost to follow-up.
This is a study with many patients, including subjects with congenital glaucoma. This fact is very relevant. Since the hospital in which it was carried out is a national reference center for this type of glaucoma. This makes it unique and sets it apart from other studies.
Conclusion
The CG requires special attention. CG shows statistically distinct characteristics in both its presentation and progression compared to other types of glaucoma.
The types of glaucoma, on the one hand, OAG and PSXG and on the other, OHT and ACG may exhibit similarities in terms of baseline MD and rates of MD, but they are distinct types of glaucoma. Additional research is necessary to gain a better understanding of visual field patterns across different forms of glaucoma.
Footnotes
Declaration of conflicting interests
The author(s) declared no potential conflicts of interest with respect to the research, authorship, and/or publication of this article.
Funding
The author(s) received no financial support for the research, authorship, and/or publication of this article.