
Abstract
Retinitis pigmentosa (RP) is a group of inherited rod-cone dystrophies, noted for a high genotypical and phenotypical heterogeneity.
Traditionally, VA, visual field, and electroretinography have been used to assess RP progression. However, visual acuity and visual field tests are essentially subjective and, especially in the late stages of the disease, are unable to confidently reveal minor progression. Therefore, there is a need for novel examination modalities that rely on quantitative, structural measurements. In this regard, several non-invasive imaging techniques have been studied, including spectral-domain optical coherence tomography, optical coherence tomography angiography, and fundus autofluorescence. By correlating surrogate biomarkers with functional measurements of the disease, these techniques may be able to develop reliable outcome meters that can be used to gain a deeper understanding of the underlying causes of the disease and to assess the effectiveness of therapy even before an actual loss of vision occurs.
In this review, we will summarize the recent imaging findings and biomarkers that have been identified in RP patients. Our goal is to provide information that can promptly aid in selecting patients for clinical trials and new gene therapies, monitoring the disease progression, and evaluating treatment outcomes.
Introduction
Retinitis pigmentosa (RP) is a group of inherited rod-cone dystrophies, noted for a high genotypical and phenotypical heterogeneity. 1 RP is thought to be the most prevalent phenotype of genetic retinal disorders, with an estimated 1:4000 global frequency. 1
A vast array of inherited patterns have been linked to RP, with mutations in over one hundred genes associated with specific functions of photoreceptors (i.e., cellular movement and signaling, transduction pathways, structural support, metabolism) identified to date.1,2
In its early stages, RP causes nyctalopia and visual field constriction due to the primary apoptotic death of rod photoreceptors. 1 Cone photoreceptor cell death follows rod degeneration, leading to loss of central visual acuity (VA) in advanced stages.1,2 According to the severity and rate of the disease's progression, RP may eventually result in tunnel vision or total vision loss.
Along with photoreceptor degeneration, RP eyes may also display bone-spicule intraretinal pigment, retinal pigment epithelium (RPE) degeneration, optic disc pallor, vascular thinning, and choroidal atrophy (Figure 1).1,3
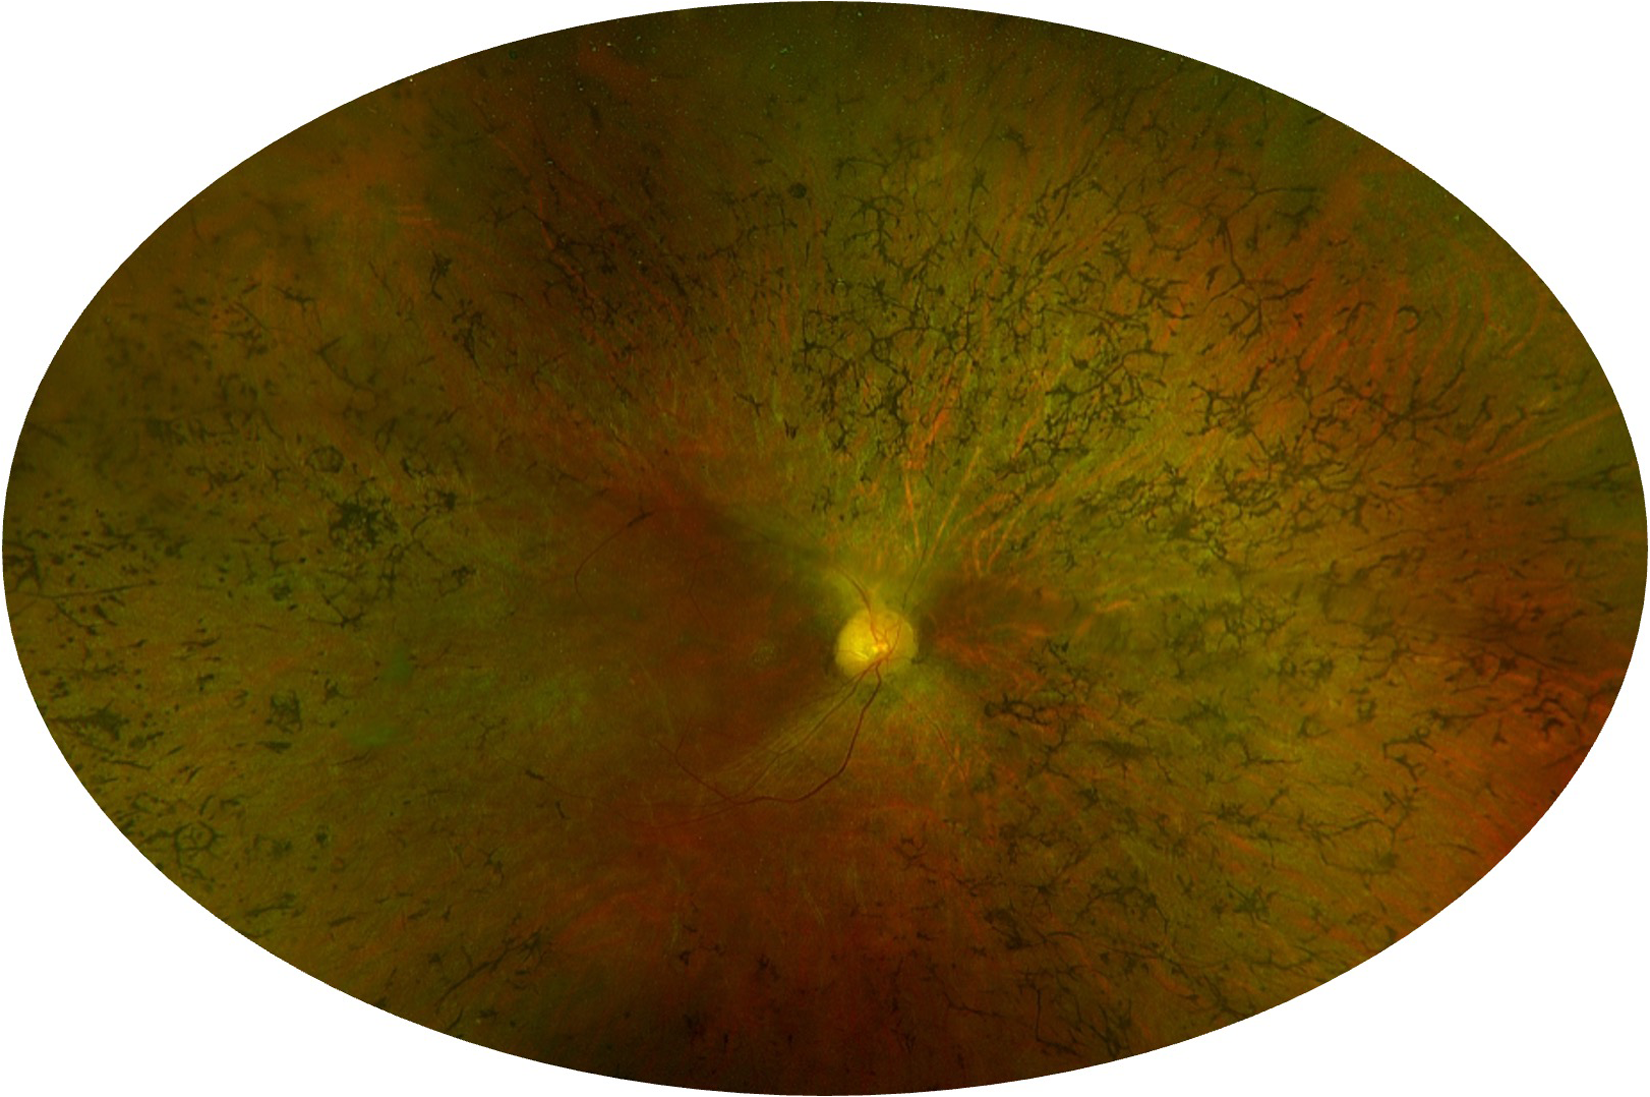
Fundus photo of a patient affected by retinitis Pigmentosa. Pseudo-color fundus photography displays typical characteristics of retinitis pigmentosa eyes: attenuated blood vessels, bone spicule pigmentation, and pallid optic nerve.
RP is diagnosed by performing a fundus examination and electroretinogram. 3 The diagnosis is confirmed by genetic tests to identify the specific gene mutation responsible for the disorder.
Traditionally, VA, visual field, and electroretinography (ERG) have been used to assess RP progression.4–6 Since visual acuity and visual field tests are essentially subjective and have significant test-retest variability, they may not be sensitive or specific indicators of retinal function.6–8 Moreover, these functional investigations, especially in the late stages of the disease, are unable to confidently reveal minor progression. 9
Therefore, there is a need for novel examination modalities that rely on quantitative, structural measurements. In this regard, several non-invasive imaging techniques have been studied, including spectral-domain optical coherence tomography (SD-OCT), optical coherence tomography angiography (OCTA), and fundus autofluorescence (FAF).
Structural imaging modalities, unlike functional assessments, focus on the macula and have higher reproducibility, increasing the ability to track the progression of a disease that develops slowly such as RP. 9 In addition, OCTA allows for the non-invasive three-dimensional (3D) examination of retinal vasculature without the need for injecting dyes, which has led to its widespread use in clinical practice.
By correlating surrogate biomarkers with functional measurements of the disease, these techniques may be able to develop reliable outcome meters that can be used to gain a deeper understanding of the underlying causes of the disease and to assess the effectiveness of therapy even before an actual loss of vision occurs.
Herein we summarized the multimodal imaging findings and biomarkers that have been recently described in RP eyes. Our aim is to collect all the relevant data that can readily help in patient selection for new gene therapies and other treatment trials, in monitoring the disease progression, and in evaluating treatment outcomes.
Optical coherence tomography
Retinitis pigmentosa typically begins in the peripheral retina and then progresses to the fovea. Therefore, once it has reached the macular region, structural optical coherence tomography (OCT) allows for studying retinal and choroidal alterations associated with disease progression.10,11
Outer retina
OCT provides in vivo retinal structural evaluation with an axial resolution that is comparable to histology. 12 Ten retinal laminar boundaries can be identified with current OCTs, resulting in nine different retinal layers.11–13 The earliest histopathological changes indicative of RP are characterized by the degeneration of the outer retina.14,15 Specifically, the most critical factors for the progression of RP are changes in the interdigitation zone (IZ) which occur at an early stage, followed by the ellipsoid zone (EZ), and ultimately in the external limiting membrane (ELM). 16
The integrities of these latter have been shown to independently correlate with VA in RP patients.11,17,18 Interestingly, regarding EZ, it has been found that there is a significant correlation not only between its integrity but also between its length (as measured on OCT linear scans) and visual acuity. 19 This correlation suggests that the impairment of central cones is closely linked to the degeneration of the peripheral rods. 20 Preservation of the EZ layer has also been described as associated with an improvement in contrast sensitivity and color vision.18,21
The most crucial aspect of evaluating the EZ is its ability to provide a long-term assessment of the progression of retinitis pigmentosa in affected eyes. 22
Birch et al 11 longitudinally studied a cohort of RP patients to quantify the progressive shortening of the EZ band. In their research, they determined that there was a mean annual decrease in EZ width of 0.86° (7%), which equates to a 13% mean annual rate of change for the corresponding area of the EZ. This rate of decline is comparable to the rates that had been previously reported for ERG and visual field.11,23,24 Furthermore, a recent study has reported a decrease in the progression rate as the disease progresses toward the fovea, supporting the concept that RP expands exponentially. 9
There are certain limitations to assessing the width of the EZ band, such as only being able to analyze a small section of the region that contains preserved photoreceptors.22,25 Additionally, the rate of changes in the EZ may differ in different meridians. 22 Therefore, evaluating the whole retained EZ would decrease noise and provide a more comprehensive assessment of the photoreceptor status.
To assess these limitations, Ramachandran and colleagues 25 compared various outer retinal measures that are derived from OCT in RP patients that were observed over time. The study suggested that for the purpose of monitoring the progression of RP patients, assessing the position of the EZ border on vertical or horizontal line scans is the most efficient measurement. This finding is supported by the evidence that the horizontal and vertical EZ width provide the same level of accuracy as measuring the total area of preserved EZ on a volume scan. This holds true for most patients, which show a symmetric progression of the disease among different meridians.
Fine modulo
The visual field decreases linearly with the disruption of the EZ. 24 Additionally, the boundary area between the healthy and affected retina serves as a structural marker for the edge of the functional visual field, representing the point at which visual sensitivity experiences a significant decline.25,26 Therefore, in the advanced stages of the disease, the length of photoreceptor segments has been shown to be a reliable measure obtained from OCT to evaluate the extension of the visual field. 11
The association between function and structure in retinitis pigmentosa has been the subject of extensive examination. 24 Studies such as that conducted by Jacobson et al 27 have revealed a correlation between a decrease in visual field sensitivity and the square of the thickness of the ONL in patients suffering from retinitis pigmentosa. Additionally, Rangaswamy et al 24 have confirmed these findings and have proposed that the loss of visual field sensitivity is better explained by a linear relationship with the product of the outer nuclear layer and outer segment thickness, as opposed to the square of the outer nuclear layer thickness. Finally, research undertaken by Wen and colleagues 28 has examined the relationship between multifocal ERG (mfERG) and receptor layer thickness as measured by SD-OCT. They discovered that mfERG amplitude was strongly correlated with outer retinal layer thicknesses.
Inner retina
While the alterations of outer retinal structures have been well-documented in the context of retinitis pigmentosa, there is yet to be a consensus about the involvement of the inner retina. A number of studies that have conducted measurements of the inner retina have reported inconsistent findings, with both increases and decreases in thickness observed. 29 Despite the progressive damage to outer retinal structures, inner retinal layers have been found to remain histologically preserved until the later stages of the disease.
The use of OCT to measure the thickness of the retinal nerve fiber layer (RNFL) has enabled the quantitative in vivo assessment of degeneration within the inner retina in patients with RP. However, previous studies utilizing OCT have yielded inconsistent results, with some reporting RNFL thickening and others demonstrating thinning in patients affected by RP.12,30,31
The thickening of RNFL may be the result of an early-stage epiretinal membrane or the stretching of RNFL to compensate for space lost from photoreceptor death.12,30,31 Conversely, while a decrease in thickness may be attributed to the loss of RNFL due to the death of photoreceptors, the same studies have demonstrated an association between RNFL thinning and age, with the latter being a significant contributing factor to RNFL thickness. 31 Likewise, correlation analyses between RNFL thickness and visual acuity in RP have shown disparate results.30,31 These inconclusive findings support the possibility that a significant number of inner retinal cells, including ganglion cells, are still functional in the later stages of the disease. 31
Additionally, Aleman et al 32 reported a strong correlation between a thick inner retina and a reduction in the thickness of the ONL in patients with advanced staged RP and outer retina damage. The presence of a normal or thickened inner retina can potentially be attributed to the potential responsive proliferation of Muller cells, which may serve to offset the potential loss of INL neurons. 12
On the other hand, other studies utilizing SD-OCT have revealed that patients with RP exhibit significant impairments and thinning in their inner retinal structures, which negatively impacts retinal function.33–36 The underlying cause of these alterations in the inner retina is currently unknown, however, possible explanations include remodeling of the retina due to the loss of photoreceptors or progressive spread of retinal pigment, leading to increased damage to the retina.36,37
In an earlier study conducted by our research group, we assessed the condition of the inner retina in patients with RP. 36 Our findings revealed a substantial reduction in thickness across all inner retinal layers, with the exception of the INL and OPL which were found to be significantly thicker. Additionally, we demonstrated that the thinning of these inner retinal layers is correlated with reduced retinal sensitivity as measured by microperimetry. Our results also indicated that the RNFL, GCL, and IPL play an important role in maintaining the functional integrity of the posterior pole of the eye. Furthermore, we found that the thickening of the INL was more strongly associated with the overall function of the retina than the RPE-photoreceptor complex, implying that changes in the INL could serve as an early sign of macular damage in RP.
This differs from the conclusions of a study by Vamos and colleagues, 12 who determined that the inner retina is altered in patients only with advanced stages of the disease and with no measurable central retinal function. Their findings also indicated that those eyes that still have measurable central retinal function exhibit only damage in the outer retina.
Choroid
Histopathological studies have established the presence of changes in the retinal vasculature in individuals affected by RP. Alterations that have been observed include constriction of the retinal arterioles, formation of perivascular cuffing, thinning of the vessels, and changes in the blood flow dynamics. 14 Additionally, research has shown that choroidal blood flow and velocity are significantly impaired in patients with RP, and these changes are often correlated with the severity of the disease.38–40 Advances in the use of different OCT modalities, such as enhanced depth imaging OCT (EDI-OCT) and swept-source OCT (SS-OCT), have allowed for greater visualization of the choroid and provided more detailed information about choroidal changes in RP. 41
In a previous study, we examined a cohort of patients with RP to determine the presence of distinct choroidal patterns and to evaluate their clinical and anatomical implications after 1 year of follow-up (Figure 2). 42 We employed structural OCT to identify three different choroidal patterns: normal-appearing choroid (pattern 1), reduced Haller and Sattler layers (pattern 2), and reduced Haller and Sattler layers with choroidal caverns (pattern 3). Our findings revealed a correlation between these choroidal patterns and clinical and OCT outcomes. Specifically, pattern 1 was associated with improved VA and superior blood flow parameters, whereas pattern 3 was associated with a significant decline in VA as well as vascular and nonvascular parameters. Conversely, the eyes classified as pattern 2, although worse than those classified as pattern 1 at baseline, maintained their functional and anatomical characteristics at the one-year follow-up.
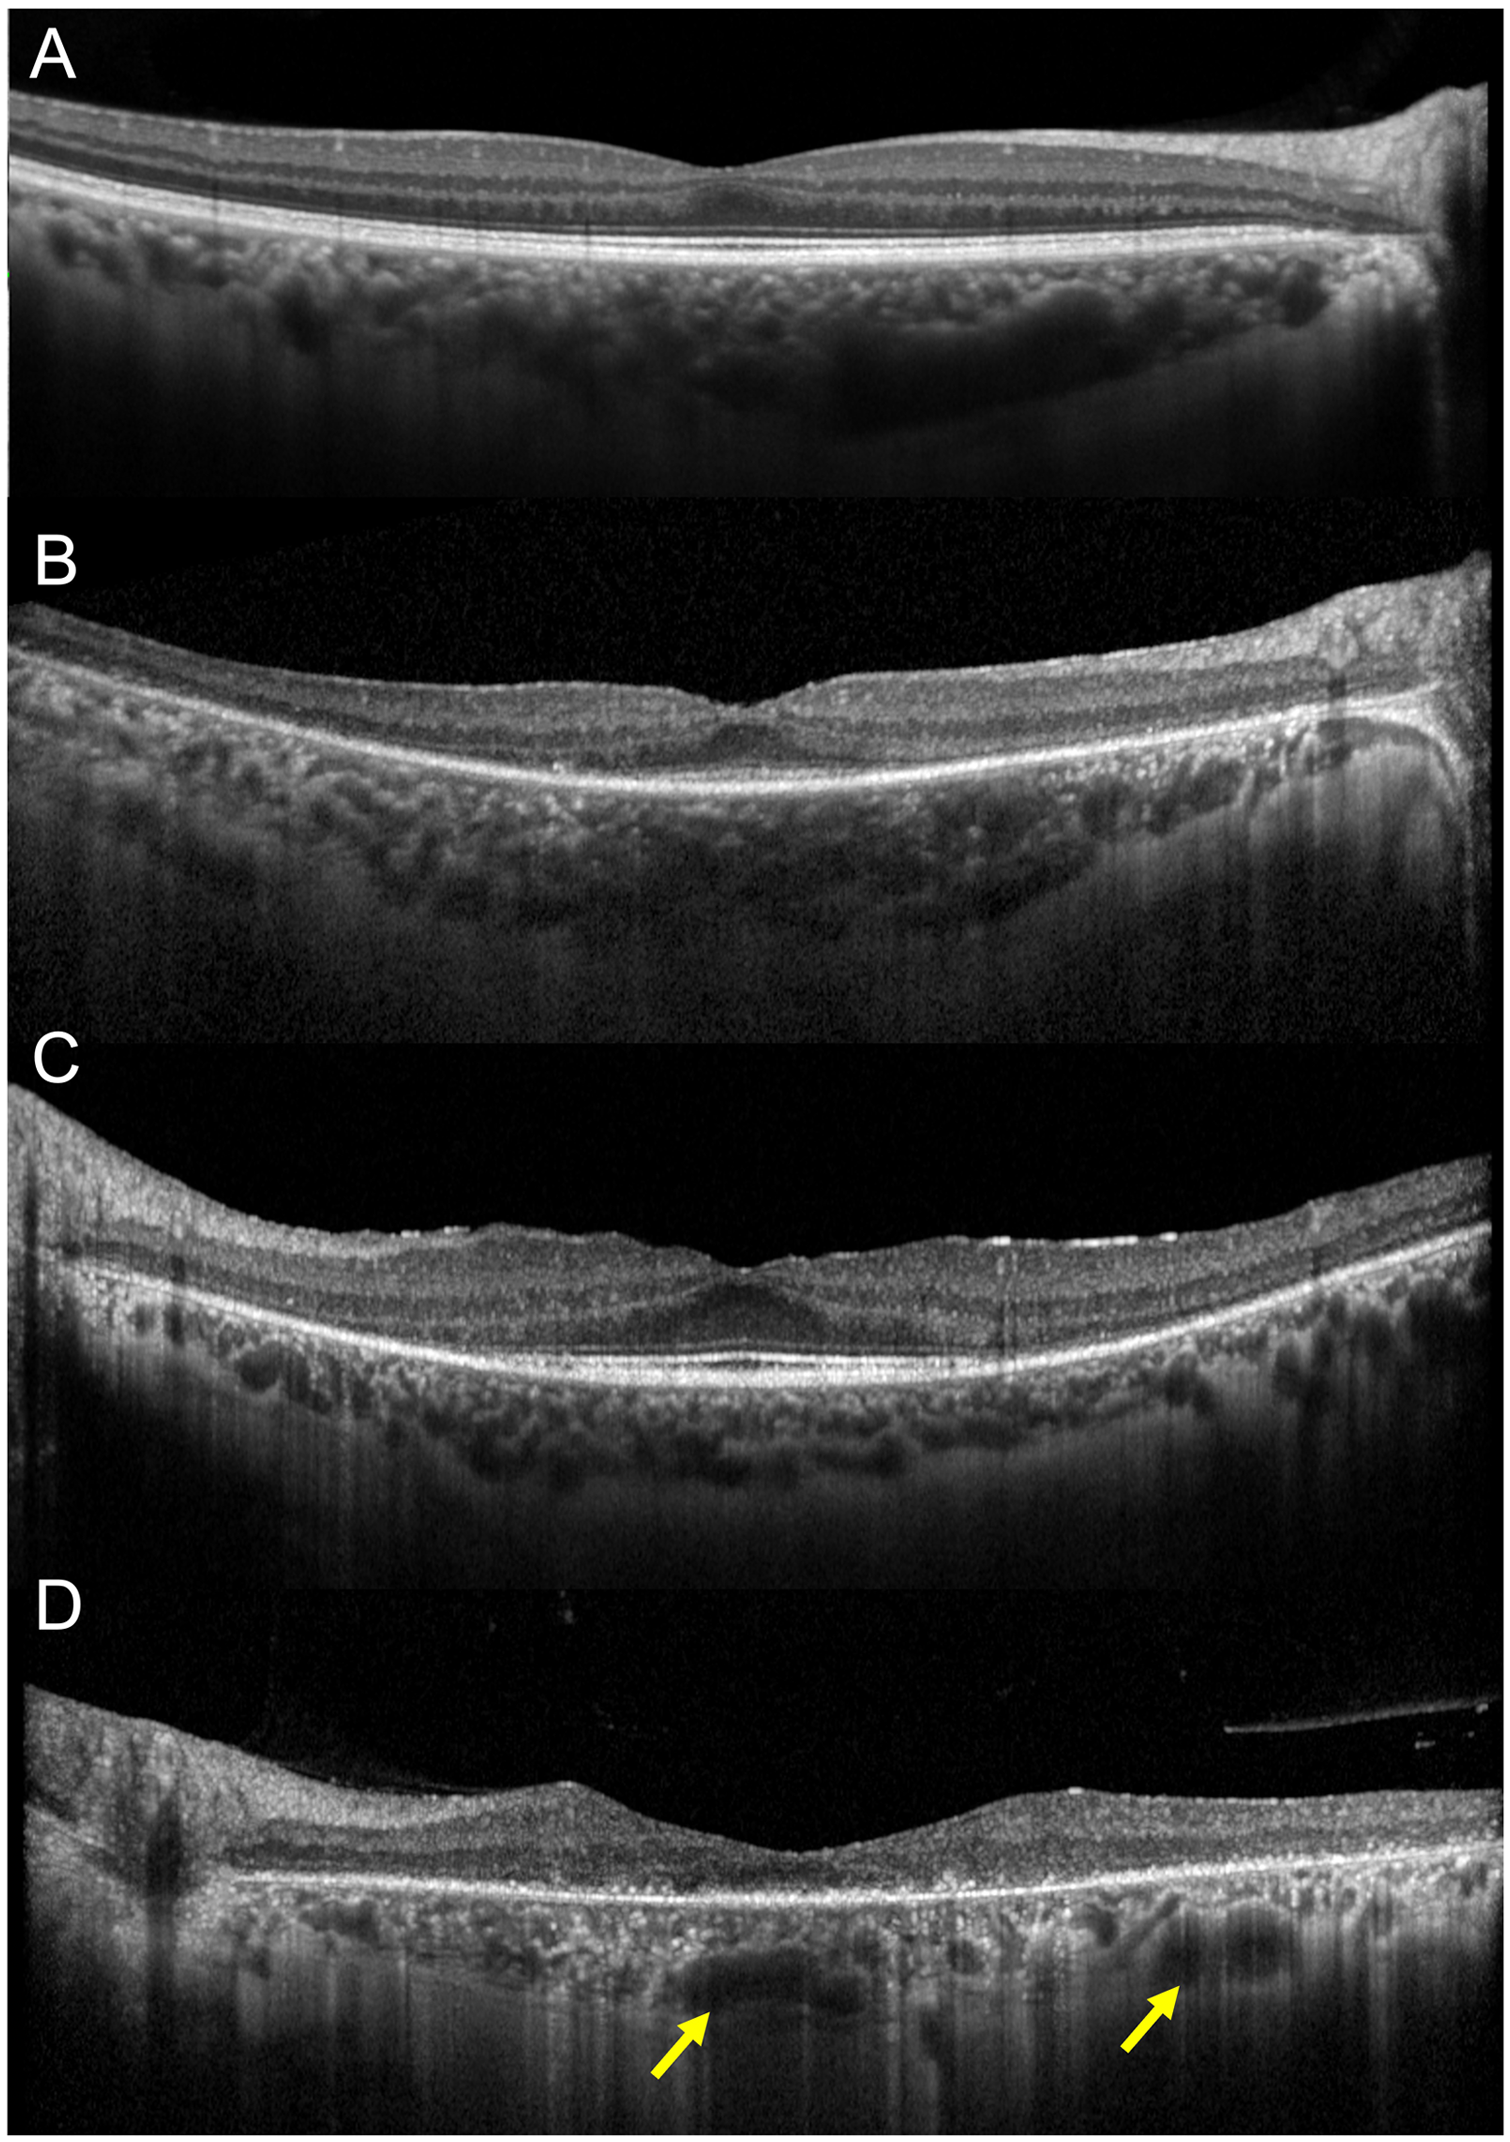
Choroidal patterns in retinitis pigmentosa. 42 (A) choroid of a healthy subject. (B) Pattern 1: normal-appearing choroidal vessels. (C) Pattern 2: reduced Haller and Sattler layers. (D) Pattern 3: reduced Haller and Sattler layers with choroidal caverns (yellow arrows).
Ayton et al 39 conducted a study in which they compared the choroidal thickness profiles between RP eyes and controls, utilizing EDI-OCT. The study found that individuals with RP showed thinner choroids with respect to controls. Furthermore, it was noted a reduced choroidal thickness in eyes with worse VA and among patients with a longer duration of symptomatic disease. The study did not find a significant correlation between choroidal thickness and age, suggesting that choroidal changes observed in RP may be a result of the progression of the disease. The physiological regulation of the choroid is primarily influenced by trophic signals generated by the RPE/photoreceptor complex. Thus, the choroidal abnormalities observed in RP may derive from alterations of these mechanisms that are responsible for maintaining the homeostasis of the choroid, as a result of the degeneration of the outer retina.
Iovino et al 43 studied the choroidal characteristics in relation to the presence of cystoid macular edema (CME) in patients with RP. The study revealed that eyes with CME had an increased average subfoveal choroidal thickness, total choroidal area, choroidal luminal area, and choroidal stromal area compared to those without CME. These measures were also found to be positively correlated with the presence of CME, suggesting that the choroid may play a role in the pathogenesis of edema in RP. They speculated that disturbances in haemodynamic and hydrostatic choroidal flow may contribute to the development of edema. 43
Finally, Shen et al 44 aimed to evaluate the choroidal vascularity index (CVI) in RP subjects. The results revealed that CVI is decreased both peripherally and in the posterior pole in RP eyes, supporting the findings from Iovino et al 43 that the choroid is affected in RP. Inizio modulo
Fine modulo
Macular alterations
While the macular region of the retina is typically spared during the early stages of RP, as the disease progresses, various macular changes have been observed in a significant proportion of patients. In fact, it is estimated that more than 40% of individuals living with RP will experience macular complications at some point during the course of the disease. 45 The most common macular changes associated with RP include CME and epiretinal membrane (ERM). 45 Additionally, other vitreoretinal interface changes such as vitreous traction, tractional macular edema, and macular holes have also been reported. 45
The incidence of CME among RP patients ranges from 10 to 50%. 46 The exact mechanisms underlying the development of CME in RP patients remain unknown and are believed to be multifactorial in nature. 46 One theory suggests that a decreased pumping of fluid from RPE cells may result in accumulation of fluid at the macula, thereby leading to CME.46,47 Another hypothesis posits that Muller cells, which play a crucial role in maintaining retinal homeostasis, including fluid dynamics, may dysfunction and lead to intraretinal fluid accumulation.46,47 CME may also occur as a result of a blood-retinal-barrier breakdown, secondary to low-grade inflammation and subsequent leakage from retinal vessels and choroidal circulation.46,47 In some cases, the presence of antiretinal antibodies may be the underlying cause of CME.46,47 Additionally, in a small number of cases, an epiretinal membrane may be responsible for tractional CME.46,47
CME can cause significant visual impairment in patients with RP, particularly those who have already experienced the loss of peripheral vision. 46 Therefore, it is essential to use OCT as a screening tool to detect macular involvement (Figure 3).
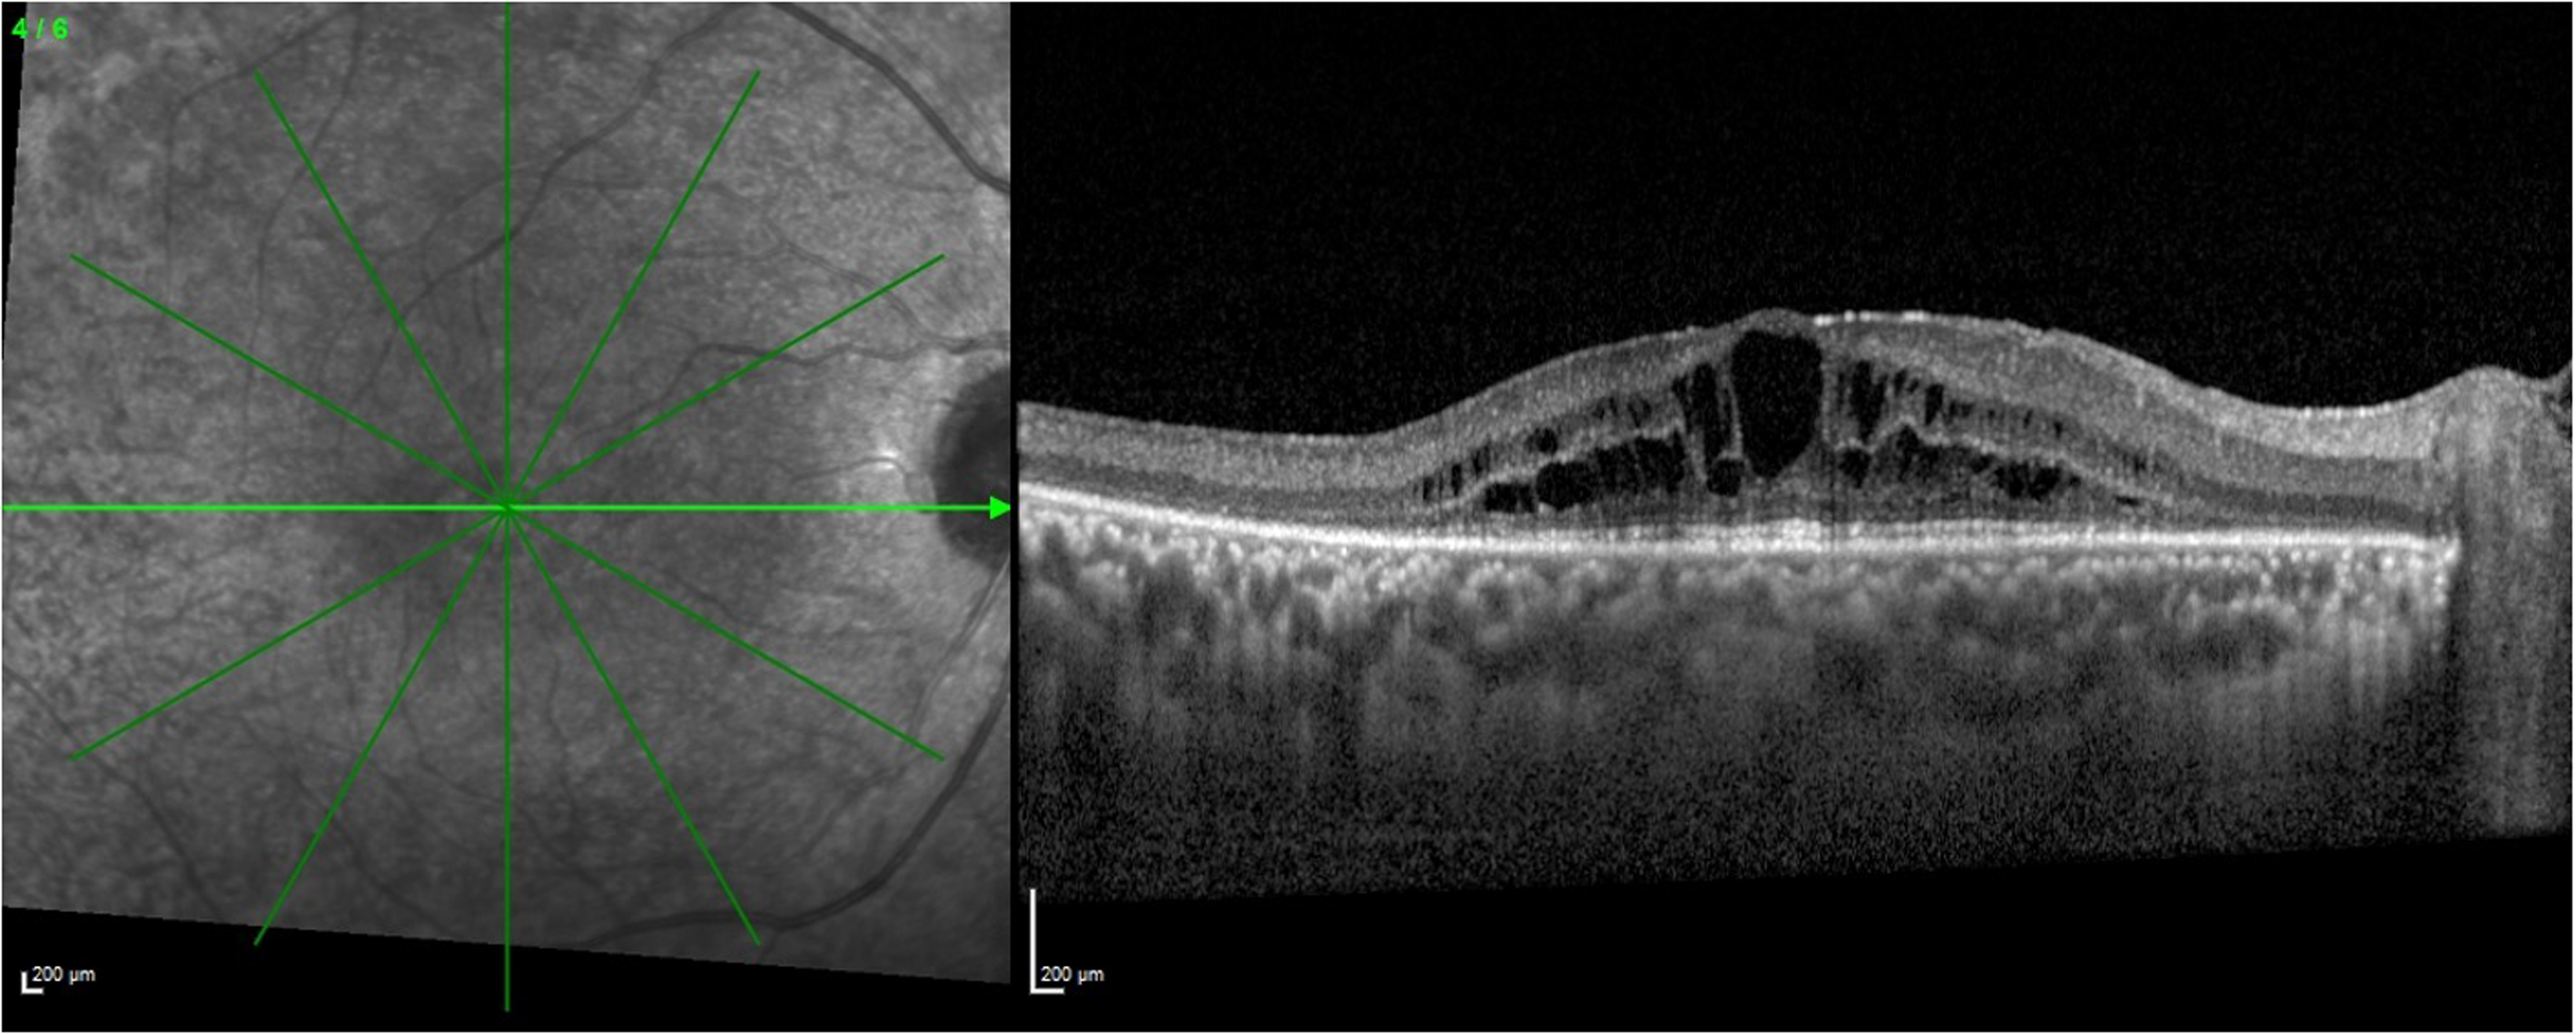
Spectral-domain optical coherence tomography of a patient affected by retinitis pigmentosa showing cystoid macular edema.
Hirakawa and colleagues 48 were the first to demonstrate the utility of OCT in identifying the presence of CME in RP patients in 1999, and they reported that it was more sensitive than slit lamp examination and FA in detecting macular edema.
Makiyama et al 49 later suggested that the principal site of fluid accumulation occurs is the inner retina. Specifically, cystoid spaces are mainly located in the inner retina and in areas of the retina that are relatively well preserved. Involvement of the INL was observed in almost all eyes with CME, while the ONL and outer plexiform layer (OPL) were involved in 28% of cases, and the ganglion cell layer was affected in 7%. This preferential inner retinal distribution of cystoid spaces lends support to the hypothesis that Müller cell dysfunction and swelling play a primary role in the development of CME. 49
Furthermore, edema is preferentially present in areas where the ELM and the EZ are retained, consistent with the finding that CME is more commonly seen in early forms of RP, as opposed to late-stage RP.47,49
The relationship between central macular thickness (CMT) and VA in eyes affected by CME remains a topic of debate. Some studies have suggested that changes in CMT are not always accompanied by corresponding changes in VA.50,51 Oishi et al 52 investigated the potential influence of the diameter of cystoid spaces on visual acuity, finding a weak association between the horizontal length and VA. However, they found that the EZ integrity is the most important parameter that correlates with visual acuity, even in CME patients.52,53
Hyperreflective foci
Hyperreflective foci (HRFs) are punctate hyperreflective dots that can be detected on linear OCT in the retina or in the choroid. 54 The formation of retinal HRFs has been hypothesized to be caused by lipid extravasation, microglial proliferation, or migration of RPE cells. 3 On the other hand, the origin of choroidal HRFs is still uncertain. Migrated RPE cells filled with lipofuscin were considered a potential explanation, but they could also be represented by choroidal melanocytes appearing as hyperreflective dots which are unmasked by the overlying atrophic retina. 3
Kuroda et al 2 reported higher numbers of HRFs in the ONL of advanced RP patients compared to early-stage ones. Typically, HRFs were present in areas where there was disruption of the EZ and the ELM, suggesting a possible migration of RPE cells into the ONL following photoreceptor cell death.
Huang et al 3 assessed the correlation among disease severity, RP progression, and the presence of HRFs. In their study, they found a correlation between VA and HRFs presence in the outer retinal layers of the central macula, at the border of the macula border, and in the choroid. The presence of HRFs in two or three of these locations was strongly associated with more severe visual impairment. Similar to the findings of Kuroda et al, 2 macular border HRFs frequently matched the areas of retinal atrophy seen on OCT. 3
Nagasaka and colleagues 55 investigated the number and localization of HRFs in different stages of RP. They found a positive correlation between HRFs number and aqueous flare grade, implying HRFs numerosity as a sign of intraocular inflammation gravity. Additionally, an increment of HRFs was correlated with a thinner outer retina and a narrower visual field. As previous studies also showed, outer retinal HRFs were only observed in areas where the EZ was disrupted. Moreover, the distribution of HRFs in the macula highly overlapped with areas of abnormal autofluorescence. These findings support the theory that outer retinal HRFs derive from RPE cells migration as a reaction to the degeneration of photoreceptors as a potential reparative response. 55
Fundus autofluorescence (FAF)
Fundus autofluorescence imaging is a technique that allows for the assessment of the status of photoreceptor cells and the RPE in vivo by providing information about the distribution of lipofuscin in the retinal pigment epithelium. 56 The utility of FAF imaging depends on variations in autofluorescence patterns, which can be a consequence of the interaction between the distribution of fluorophores, retinal structure, and pathological alterations caused by retinal diseases. 57
FAF imaging can reveal different patterns of abnormal autofluorescence in RP patients. One common finding is an abnormal ring of increased autofluorescence in the parafoveal area. 58 This ring is thought to represent a boundary between preserved and severely altered retinal function and is believed to be caused by abnormal accumulation of RPE-derived fluorescent material such as lipofuscin.57,59
This ring is typically more intense than surrounding areas and is observed to encircle areas of preservation of the ellipsoid zone as shown by structural OCT studies.57,59 The EZ band is typically not visible outside of this ring, and there is a close correspondence between the lateral border of the ellipsoid-zone band and the internal edge of the ring, indicating that as the disease progresses, the dysfunction of the central photoreceptors quickly results in disruptions of the outer retina's structure. 59
There is variability in the stability of the abnormal ring of increased autofluorescence. Some patients experience a stable ring, while others undergo ring constriction over time, which is thought to reflect variations in the rate of macular impairment, visual field narrowing, and photoreceptor disruption. 59 Serial FAF imaging may serve as an efficient method for monitoring the progression of disease, particularly in patients who are unable to participate in perimetry testing. 59 Furthermore, recent studies have established a correlation between the ring and retinal function as evaluated by electroretinography.60,61 Specifically, the size of the hyperfluorescent ring has been found to be associated with the spatial extent of preservation of mfERG signals, in accordance with findings from pattern electroretinography and psychophysics.58,60,62 It has been generally observed that preservation of photopic sensitivity is associated with scotopic sensitivity losses within the ring of RP patients.
Different authors have suggested a classification of RP patients based on macular FAF imaging, as illustrated in Figure 4.57,63 This classification system describes three different patterns: 1) no ring and preserved retinal autofluorescence, 2) evident ring and preserved retinal FAF, and 3) increased/abnormal FAF in the fovea. EZ band is preserved when there is no hyperautofluorescent ring (pattern 1), and is completely absent if there is abnormal foveal autofluorescence (pattern 3). 63
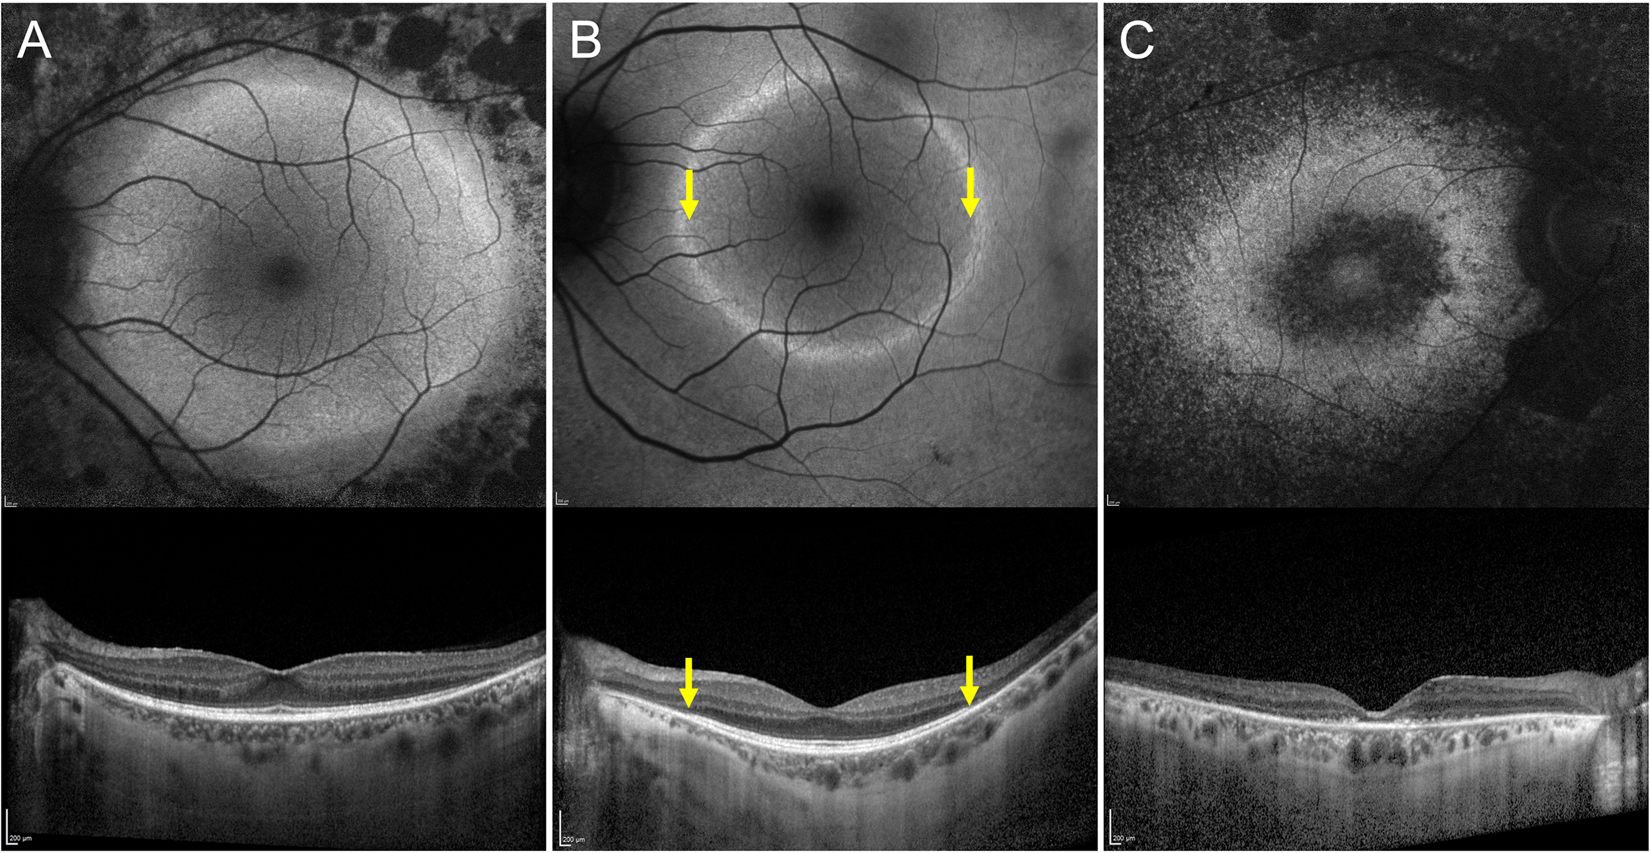
Association of patterns of fundus autofluorescence (FAF) with the ellipsoid zone (ez) status in retinitis pigmentosa. (A) Preserved retinal FAF with no hyperreflective ring (top). The EZ is intact in the macular region as shown by optical coherence tomography (OCT) (bottom). (B) In the FAF image, the hyperreflective ring is clearly detectable together with preserved retinal FAF (top). The EZ is undetectable outside the ring (yellow arrowheads). (C) Abnormal retinal FAF with no hyperreflective ring (top). The EZ line is completely absent (bottom).
The abnormal foveal FAF appearance has been suggested to be the next step of progression from the ring FAF type. Conversely, eyes without abnormal ring and with preserved foveal AF (pattern 1) are not typically considered to be the initial stage of RP that develops into the other two patterns. 57
Despite the importance of evaluating the macular region, examination of the periphery is crucial in a rod-dominant disorder like RP. 64 Ultra-widefield (UWF) fundus autofluorescence can add important information about the involvement of the peripheral retina. 64 It may reveal patchy areas of decreased autofluorescence that are associated with scotomas or mottled hypo-autofluorescence without visual field defects, the latter of which is thought to be an abnormal FAF pattern that precedes the development of scotomas. The first peripheral FAF alteration is the development of hyperfluorescence which then advance to a reticular pattern of hypofluorescence which eventually culminate in patchy hyperfluorescent lesions. 65 The interpretation of these UWF FAF findings can provide objective information to assess the duration or stage of the disease. Notably, the number of patchy areas of decreased FAF is correlated with age and disease duration. 65
Optical coherence tomography angiography (OCTA)
OCTA has been demonstrated to be a useful technique for the detailed examination of retinal and choroidal vessels, non-invasively. 66 It offers the unique advantage of quantifying blood flow. 67
A reduction in ocular blood flow has been recognized as a contributing factor in the progression of RP. 68 Histopathological studies have shown that RP is characterized by attenuation and sclerosis of retinal vessels. 14 It is suggested that the attenuation of the vessels is primarily a result of the reduced energy demand of the impaired retina, which leads to a decrease in oxygen consumption, resulting in increased oxygen concentration that finally causes constriction of retinal vessels.68,69
Previous studies utilizing OCTA have revealed retinal and choroidal capillary rarefaction and expansion of the foveal avascular zone (FAZ) in subjects with retinits pigmentosa. A meta-analysis was conducted by Ling et al 70 to assess the microvascular changes of the retinal and choroidal layers in RP patients using OCTA. The results of the study highlighted a reduced vessel density both in the superficial and deep capillary plexus in RP patients compared to healthy individuals (Figure 5). Lin et al 70 found that the deep FAZ was significantly larger in RP patients than in normal individuals, while the superficial FAZ was found similar between the two cohorts.
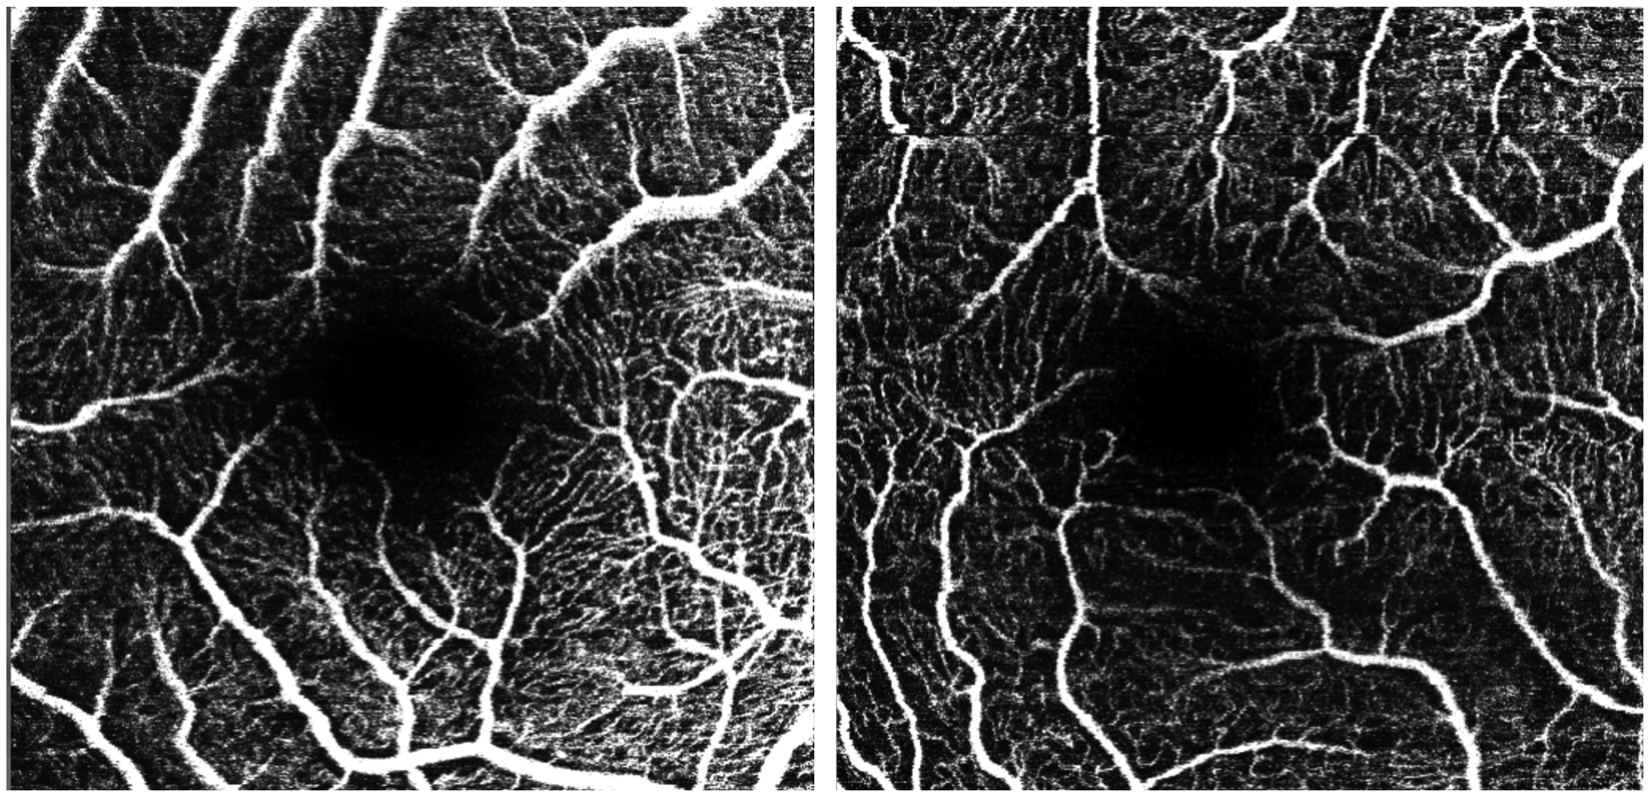
Differences at the superficial capillary plexus level between patients affected by retinitis pigmentosa and healthy individuals. 73
In contrast, the density of choriocapillaris vessels in patients with retinitis pigmentosa does not differ significantly from that of controls. However, when examining blood flow in the choriocapillaris layer, there is conflicting evidence from various studies. 71 Histopathological studies have found CC alterations in RP, OCTA investigations have shown contrasting results.72,73 These differences may be attributed to limitations in OCTA technology, such as projection artifacts and limited depth of penetration. 71
The radial peripapillary capillary network has been also found significantly impaired in RP patients.70,73 Vascular changes in these regions may contribute to the pathological processes that lead to ganglion cell death and thinning of the RNFL.71,74
The measurement of geometric vascular features using OCTA biomarkers may serve as a valuable tool to evaluate disease progression and the effectiveness of treatments. 71 In a previous study 75 conducted by our research group, we quantitatively analyzed the retinal vascular plexus at both the macula and the optic nerve in patients with RP in order to assess the presence of specific vascular alterations that may impact visual acuity. Our findings revealed a significant difference between RP eyes and controls in various OCTA variables such as vessel tortuosity, vessel rarefaction, vessel dispersion, and vessel density. Our results suggest that vessel tortuosity and vessel rarefaction may be considered the most reliable biomarkers of geometric vascular alterations, as they were the only parameters not influenced by age and disease duration, as determined by our correlation analysisInizio modulo
Fine modulo
Efforts have been made to compare OCTA parameters to measures of retinal function in order to establish a correlation between vascular signal changes and functional impairment. A study by Toto et al 76 has demonstrated a correlation between vessel densities of the superficial and deep capillary plexus with ERG macular parameters as well as with the thickness of the ganglion cell complex. The observed correlation between vessel impairment and macular function suggests that OCTA parameters may be useful for identifying and assessing the extent of functional impairment.
In a study by Liu et al, 72 the impact of choroidal vessel density on the width of the EZ band and VA in patients with retinitis pigmentosa was investigated. The findings demonstrated that choroidal circulation is a notable factor influencing the EZ integrity, VA, visual field, and functional parameters as detected by ERG b-wave.
Conclusions
Currently, there is no established treatment for retinitis pigmentosa. In order for focal therapeutic techniques, such as subretinal gene delivery, to be successful, accurate information regarding the retinal structure is required to determine the appropriate location and timing of treatment. 32 Similarly, systemic therapies for RP would benefit from quantifiable measures of retinal structure. Retinal implants may also offer a potential solution for restoring vision in RP patients; however, the effectiveness of these devices relies on the preservation of cells in the inner nuclear layer and ganglion cell layer. 77 In this context, imaging techniques such as spectral-domain optical coherence tomography, fundus autofluorescence, and optical coherence tomography angiography may provide effective and reliable outcome measures for patient selection and assessment of therapeutic efficacy in clinical trials and in clinical settings for RP.
Footnotes
Acknowledgements
None
Authorship:
All authors attest that they meet the current ICMJE criteria for Authorship.
Declaration of conflicting interests
The author(s) declared no potential conflicts of interest with respect to the research, authorship, and/or publication of this article.
Funding
The author(s) received no financial support for the research, authorship, and/or publication of this article.
Financial disclosure
Francesco Bandello consultant for: Alcon (Fort Worth, Texas, USA), Alimera Sciences (Alpharetta, Georgia, USA), Allergan Inc (Irvine, California, USA), Farmila-Thea (Clermont-Ferrand, France), Bayer Shering-Pharma (Berlin, Germany), Bausch And Lomb (Rochester, New York, USA), Genentech (San Francisco, California, USA), Hoffmann-La-Roche (Basel, Switzerland), NovagaliPharma (Évry, France), Novartis (Basel, Switzerland), Sanofi-Aventis (Paris, France), Thrombogenics (Heverlee, Belgium), Zeiss (Dublin, USA). All other authors have no disclosures to declare.