
Abstract
Best Vitelliform Macular Dystrophy (BVMD) is a dominantly inherited retinal disease caused by dominant variants in the BEST1 gene. The original classification of BVMD is based on biomicroscopy and color fundus photography (CFP); however, advancements in retinal imaging provided unique structural, vascular, and functional data and novel insights on disease pathogenesis. Quantitative fundus autofluorescence studies informed us that lipofuscin accumulation, the hallmark of BVMD, is unlikely to be a primary effect of the genetic defect. It could be due to a lack of apposition between photoreceptors and retinal pigment epithelium in the macula with subsequent accumulation of shed outer segments over time. Optical Coherence Tomography (OCT) and adaptive optics imaging revealed that vitelliform lesions are characterized by progressive changes in the cone mosaic corresponding to a thinning of the outer nuclear layer and then disruption of the ellipsoid zone, which are associated with a decreased sensitivity and visual acuity. Therefore, an OCT staging system based on lesion composition, thus reflecting disease evolution, has been recently developed. Lastly, the emerging role of OCT Angiography proved a greater prevalence of macular neovascularization, the majority of which are non-exudative and develop in late disease stages. In conclusion, effective diagnosis, staging, and clinical management of BVMD will likely require a deep understanding of the multimodal imaging features of this disease.
Keywords
Introduction
Best Vitelliform Macular Dystrophy (BVMD, MIM #153700) is an inherited retinal disease caused by dominant variants in the BEST1 gene (MIM #607854), which is located on chromosome 11 and encodes for the integral membrane protein bestrophin-1, a chloride channel found on the basolateral membrane of retinal pigment epithelium (RPE) cells.
Over 200 different BEST1 variants have been described to date and associated with a broad spectrum of retinal phenotypes, collectively named bestrophinopathies: BVMD, autosomal recessive bestrophinopathy (ARB, MIM #611809), autosomal dominant vitreoretinochoroidopathy (ADVIRC, MIM #193220), and retinitis pigmentosa (RP, MIM #613194). Individuals carrying pathogenic BEST1 variants that are diagnosed with adult-onset vitelliform macular dystrophy (AVMD) are generally reclassified as BVMD.1,2
BVMD is generally considered a rare genetic disease but actually represents the second most common macular dystrophy and the most frequent among autosomal dominant ones. Its prevalence has been estimated to be around 1 in 10.000 in USA, 3 2 in 10.000 in Sweden, 4 1 in 20.000 in Minnesota, 5 1.5 in 100.000 in Denmark. 6 The clinical onset and the evolution are extremely variable. Indeed, the age of onset is below 40 years with a median of around 19 years but may vary from 4 to 65 years. 6 Over the course of the disease, 75% of patients under the age of 40 years maintain a visual acuity of 20/40 or better in at least one eye although 75% of patients older than 30 years have a visual acuity of 20/100 or worse in at least one eye. 7
Although BVMD is characterized by a wide spectrum of macular abnormalities, its hallmark finding is a central yellow vitelliform or egg-yolk-like lesion, which is composed of lipofuscin and unphagocytosed photoreceptor outer segments (POS).8,9 On electrophysiological testing, full-field electroretinogram (ERG) is always normal while electrooculogram (EOG) is usually abnormal, with an Arden ratio of 1.5 or less. Eventually, diagnosis is confirmed by genetic testing and detection of a pathogenic BEST1 variant.
The original classification of BVMD is based on biomicroscopy and color fundus photography (CFP); however, advancements in retinal imaging provided novel structural, vascular, and functional data such that alternative classification schemes based on fundus autofluorescence (FAF) and optical coherence tomography (OCT) have been proposed. Consequently, effective diagnosis, staging, and clinical management of BVMD fully depend on multimodal retinal imaging.
In this review, we synthesize the multimodal retinal imaging findings of BVMD that emerged in the last few years. We begin by reviewing the natural history and traditional Gass’ classification. Subsequently, common findings, proposed classification schemes, and biomarkers are presented and discussed, for each imaging modality.
Color Fundus photography and Gass’ classification of BVMD
CFP provides a real color representation of a broad range of fundus abnormalities, such as subretinal vitelline deposits, pigmentary abnormalities, and atrophy, using floodlight illumination and various filters for monochromatic imaging to aids the visualization of anatomic structures and disease features at different levels within the retina. Red-free fundus photography highlights the inner retina while green-free fundus photography is focused on RPE and choroid. Traditional fundus retinography includes the central 30° or 55° of the retina: this field of view is optimal for detecting pathologic changes of the macula but is inadequate for the imaging of the retinal periphery. Despite the diffusion of ultra-widefield imaging devices, no study systematically investigated peripheral retinal lesions in BVMD. 10
Since the subretinal vitelliform lesions can adopt various anatomical configurations during the lifetime of the patient, Gass’ proposed a staging system based on ophthalmoscopic findings:
stage I (subclinical): absence of biomicroscopic fundus abnormality; stage II (vitelliform): presence of a subretinal macular lesion, round in shape, half to two-disc diameters in size, filled by yellowish material, resembling an egg yolk (Figure 1(a)); stage III (pseudohypopyon): partial fluid reabsorption in the upper part of the lesion with retention of the yellowish subretinal deposition in the lower part (Figure 1(b)); stage IV (vitelliruptive): reabsorption and break-down of the material, giving a “scrambled egg” appearance to the macula (Figure 1(c)); stage V (atrophic/fibrotic): development of chorioretinal atrophy, scarring, and/or hemorrhage (Figure 1(d)).
11
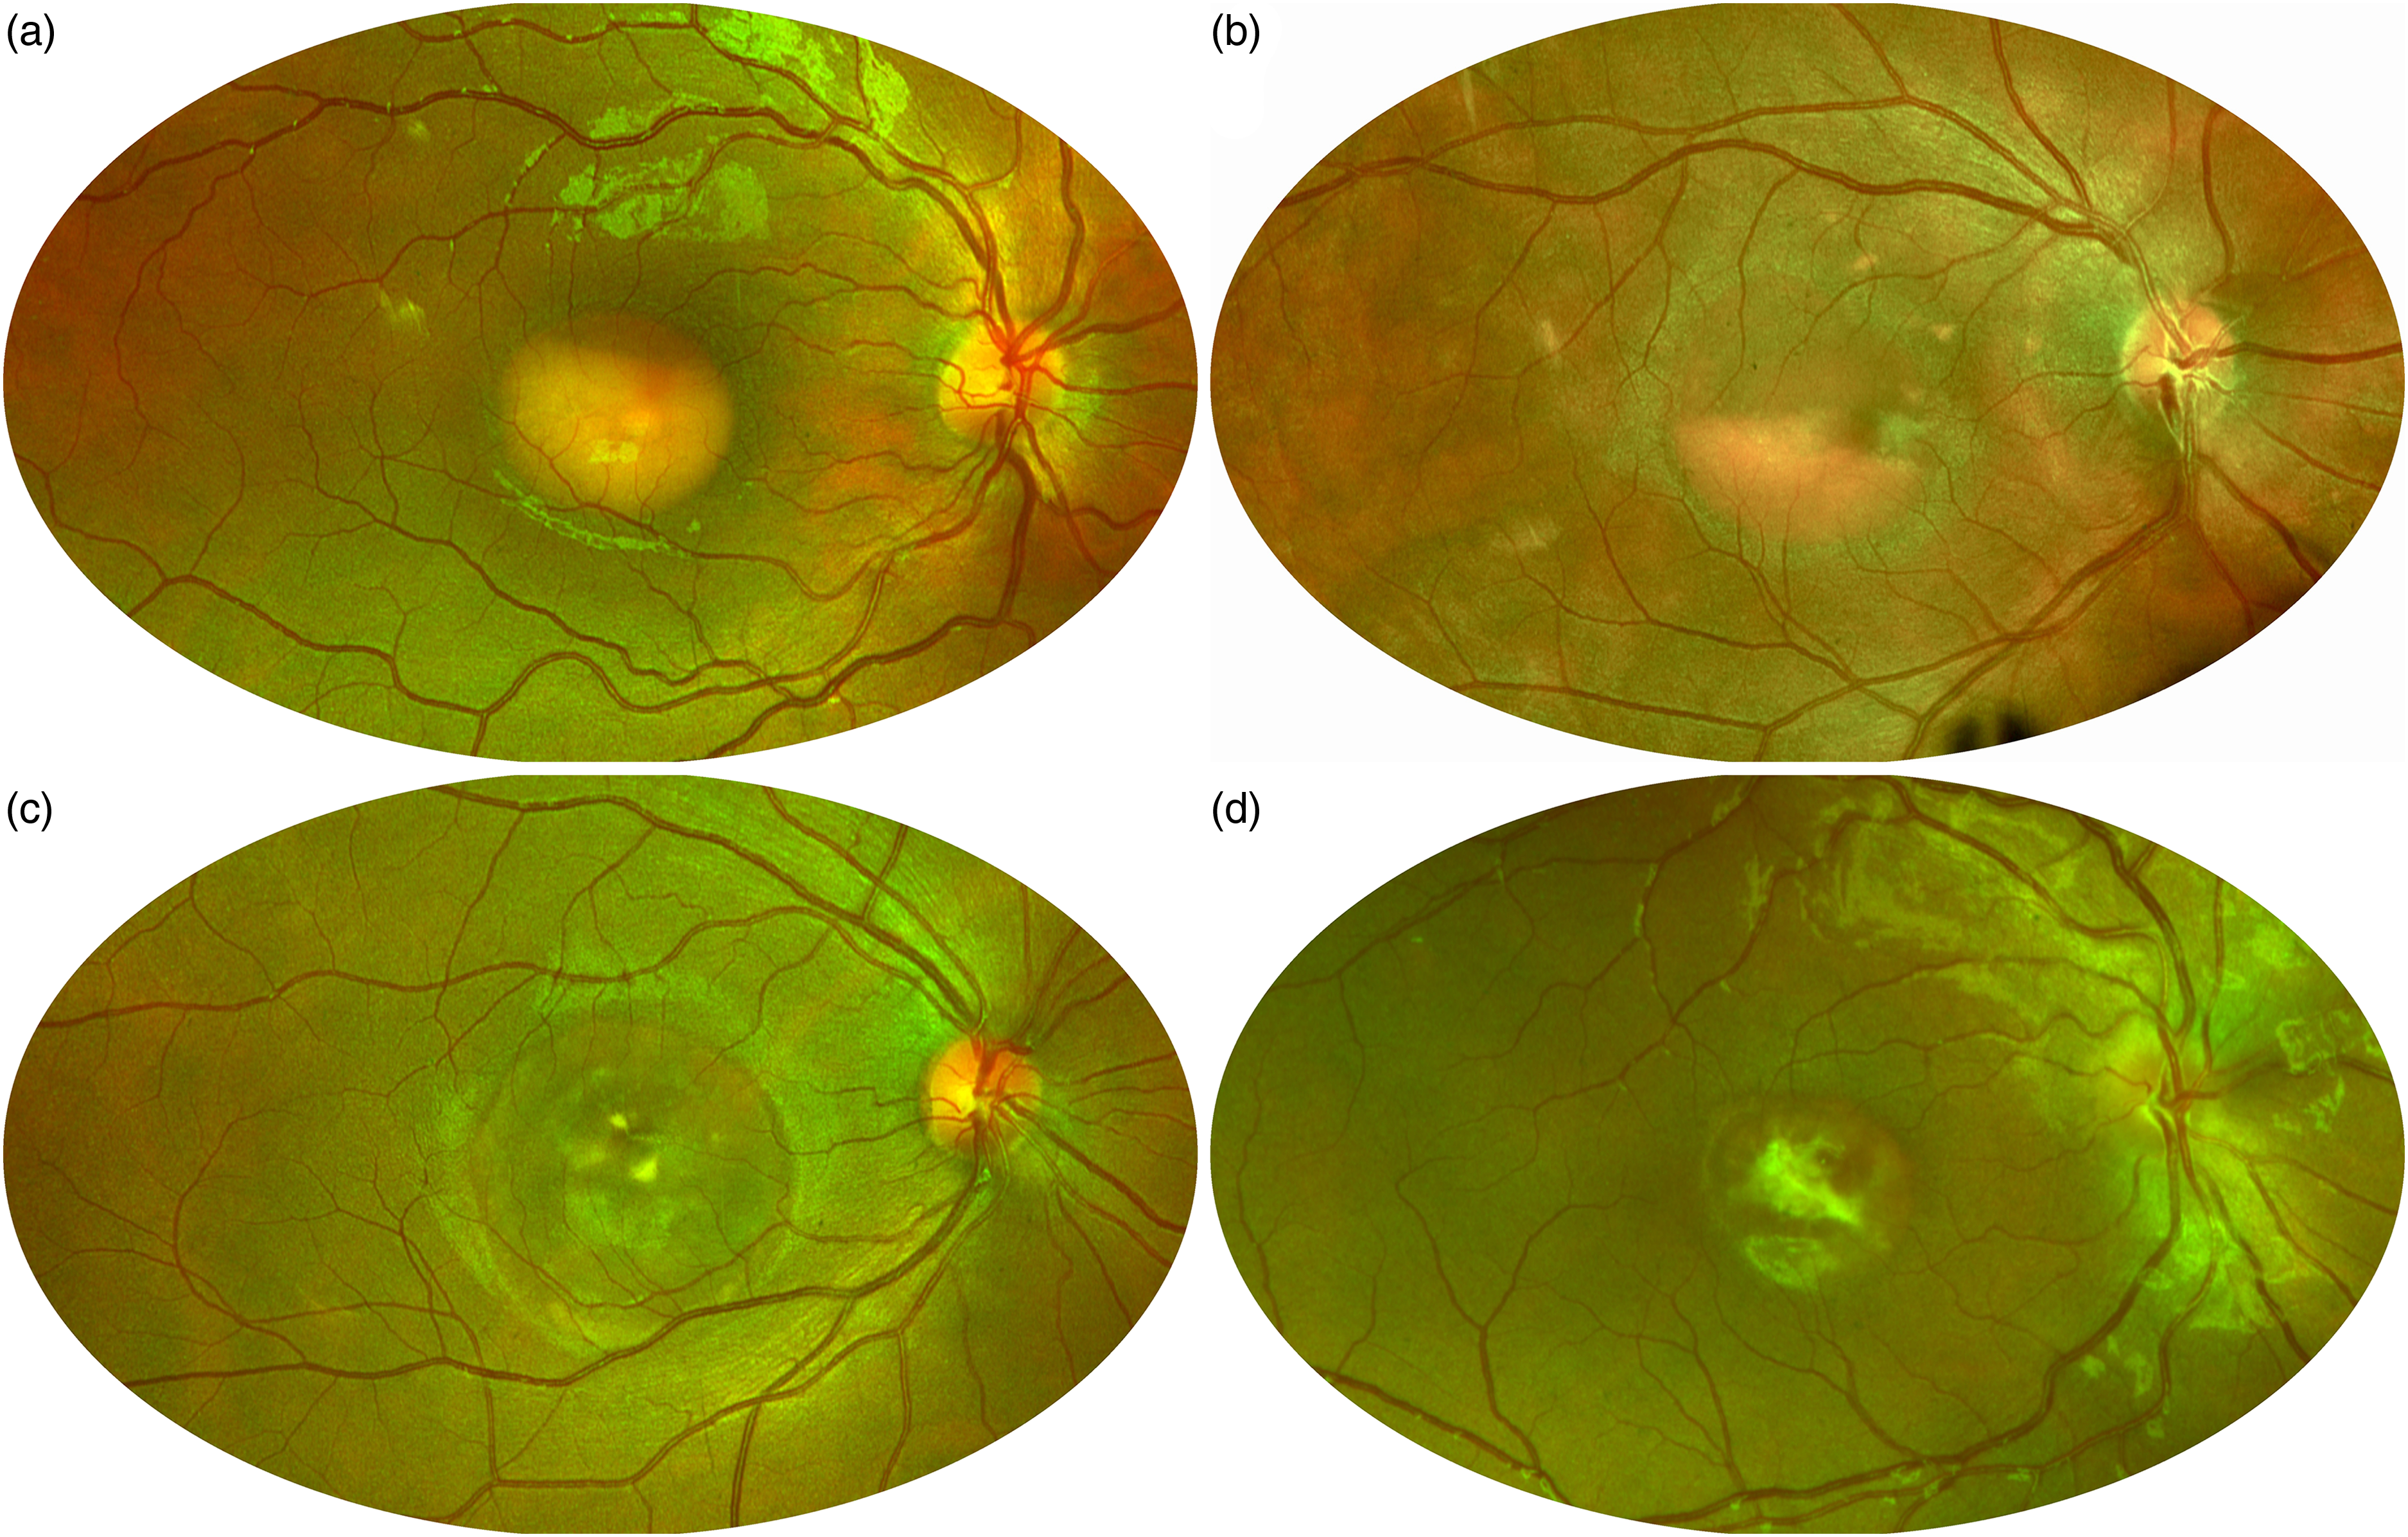
Gass’ staging of Best Vitelliform Macular Dystrophy on pseudocolor retinography. (a) Stage II, vitelliform. (b) Stage III, pseudohypopyon. (c) Stage IV, vitelliruptive. (d) Stage V, fibrotic.
Few studies have challenged the chronological order of these stages. However, follow-up studies suggest that the progression across different stages varies considerably, and it is almost unpredictable: these stages are not observed in all patients, nor do they occur consecutively, with lesions in stages II to IV evolving into one another within a few years.3,12–14 Moreover, Gass’ staging was introduced well before the advent of OCT and not surprisingly, there are often discrepancies between Gass’ stages and OCT features. Lastly, 30% of patients feature multifocal lesions within and outside the foveal region,15–17 and may present with atypical fundus features that cannot be easily assigned to a univocal Gass’ stage, such as the pattern dystrophy-like phenotype associated with the p.Ala243Val variant (Figure 2). 18
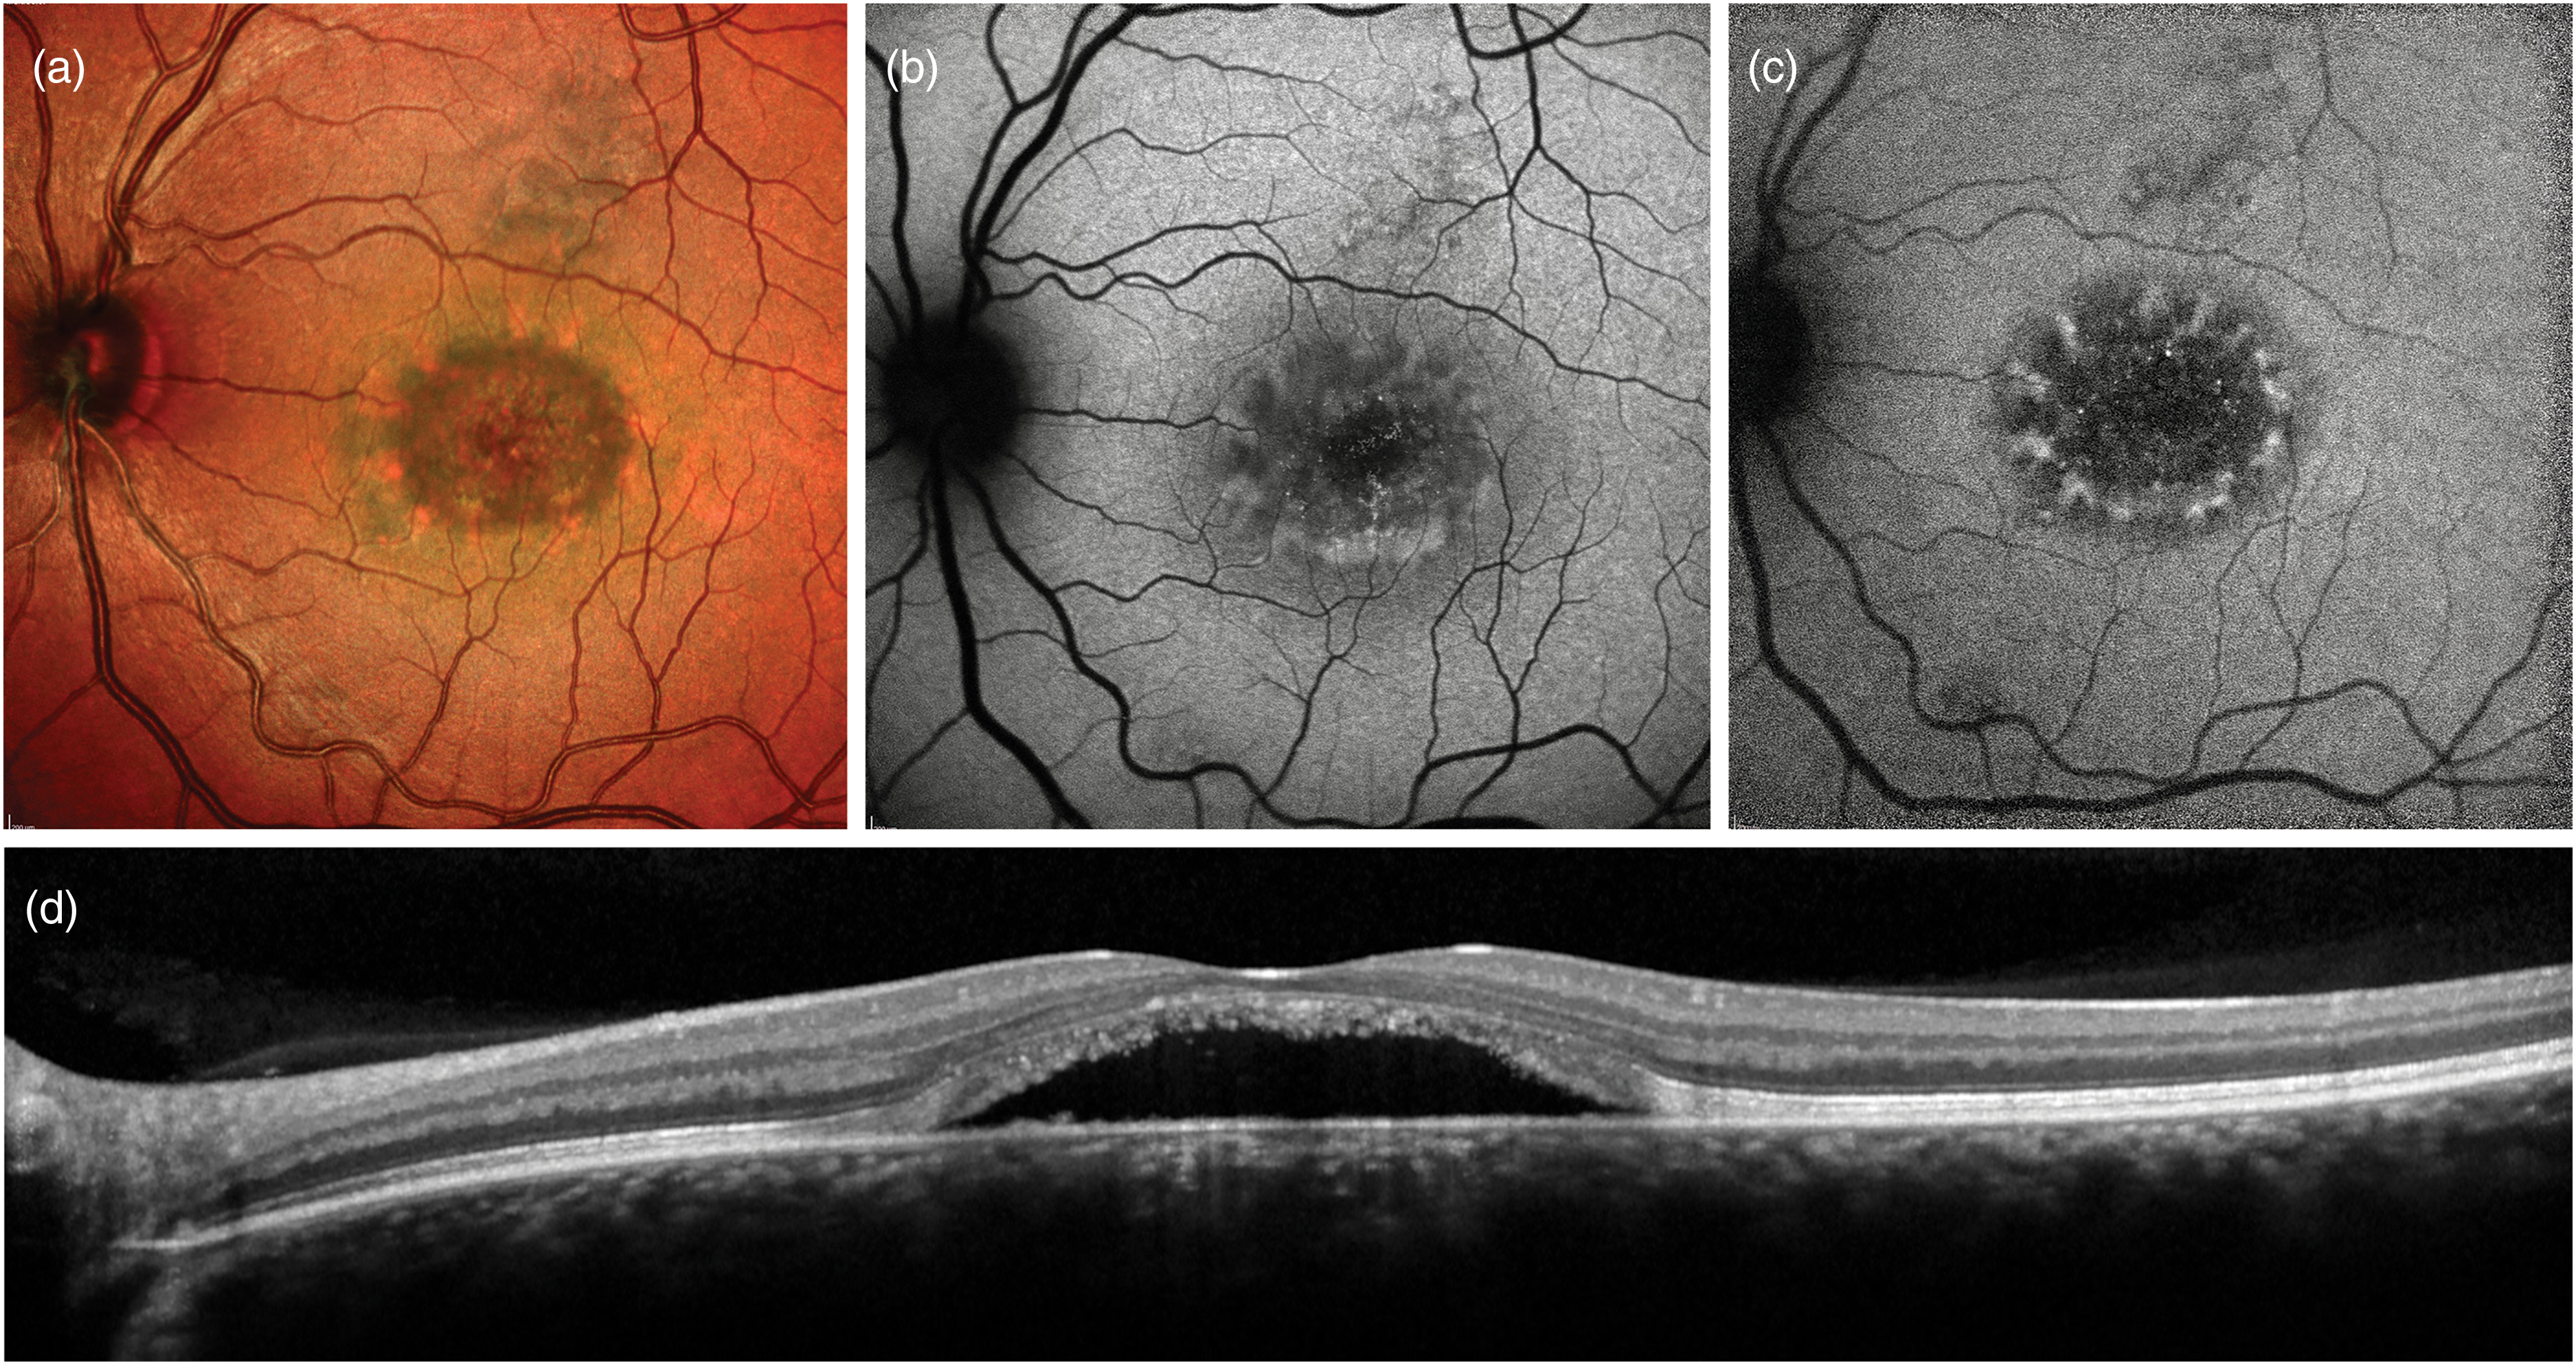
Multimodal imaging features of the pattern dystrophy-like phenotype associated with the p.Ala243Val BEST1 variant. (a) Heidelberg Spectralis Multicolor imaging reveals a central macular neurosensorial detachment with peripheral spoke-like subretinal deposits, which are hyperautofluorescent (b) on blue-light autofluorescence. (c) Near-infrared autofluorescence further enhances contrast between the two components of the lesion. (d) Corresponding horizontal Optical Coherence Tomography scan passing through the fovea.
Fundus autofluorescence (FAF)
FAF uses excitation and emission filters in traditional fundus-based cameras or modern confocal scanning laser ophthalmoscopes (cSLO) to analyze the distribution of retinal fluorophores.
Blue-light FAF (BL-FAF) that employs a cSLO with a 488 nm wavelength of excitation and a barrier filter around 500 nm enables topographic mapping of lipofuscin and is currently the most commonly used method of FAF. Early stages are characterized by a strong autofluorescent signal while a trend toward a decreased response is typical of later stages, associated with atrophy. Indeed, in the vitelliform stage, the round yellowish subretinal lesion show a homogeneously increased signal; then, as the lesion evolves toward later stages, fluorescent material forms a pseudohypopyon level in the inferior part of the lesion or becomes dispersed throughout the lesion in a granular fashion. Vitelliruptive stage shows speckled autofluorescence with a peripheral ring or small circumferential dots of hyperautofluorescence. In the cicatricial and atrophic stage, areas of decreased signal become prominent, due to RPE atrophy, blockage by scar tissue, and loss of lipofuscin. This gradual loss of BL-FAF signal in later disease stages indicates that the autofluorescent subretinal material gradually disappears as photoreceptors and RPE cell death progresses until atrophy or scarring ensues. 19
Near-Infrared FAF (NIR-FAF), introduced in 2006, employs an excitation filter centered at 787 nm and a barrier filter selecting light above 810 nm. NIR-FAF signal appears to correspond to the signal emanated by melanin, a fluorophore present in the RPE cells and choroid. 20 Three main BL-FAF and NIR-FAF patterns are identified in BVMD: hypo-autofluorescent, hyper-autofluorescent, and patchy pattern (Figure 3). The patchy pattern, which is characterized by a combination of increased and reduced signal, is the most frequent pattern with both techniques and can be identified in all clinical stages. None of the patterns can be considered specific to a definite Gass’ stage. However, the hypo-autofluorescent pattern is more typical of subclinical and atrophic stages. 21 From a functional point of view, the hyper-autofluorescent pattern seems to be associated with better functional outcomes while hypo-autofluorescent patterns (except for the subclinical stage) to a worse retinal sensitivity, both in BL-FAF and in NIR-FAF. 22
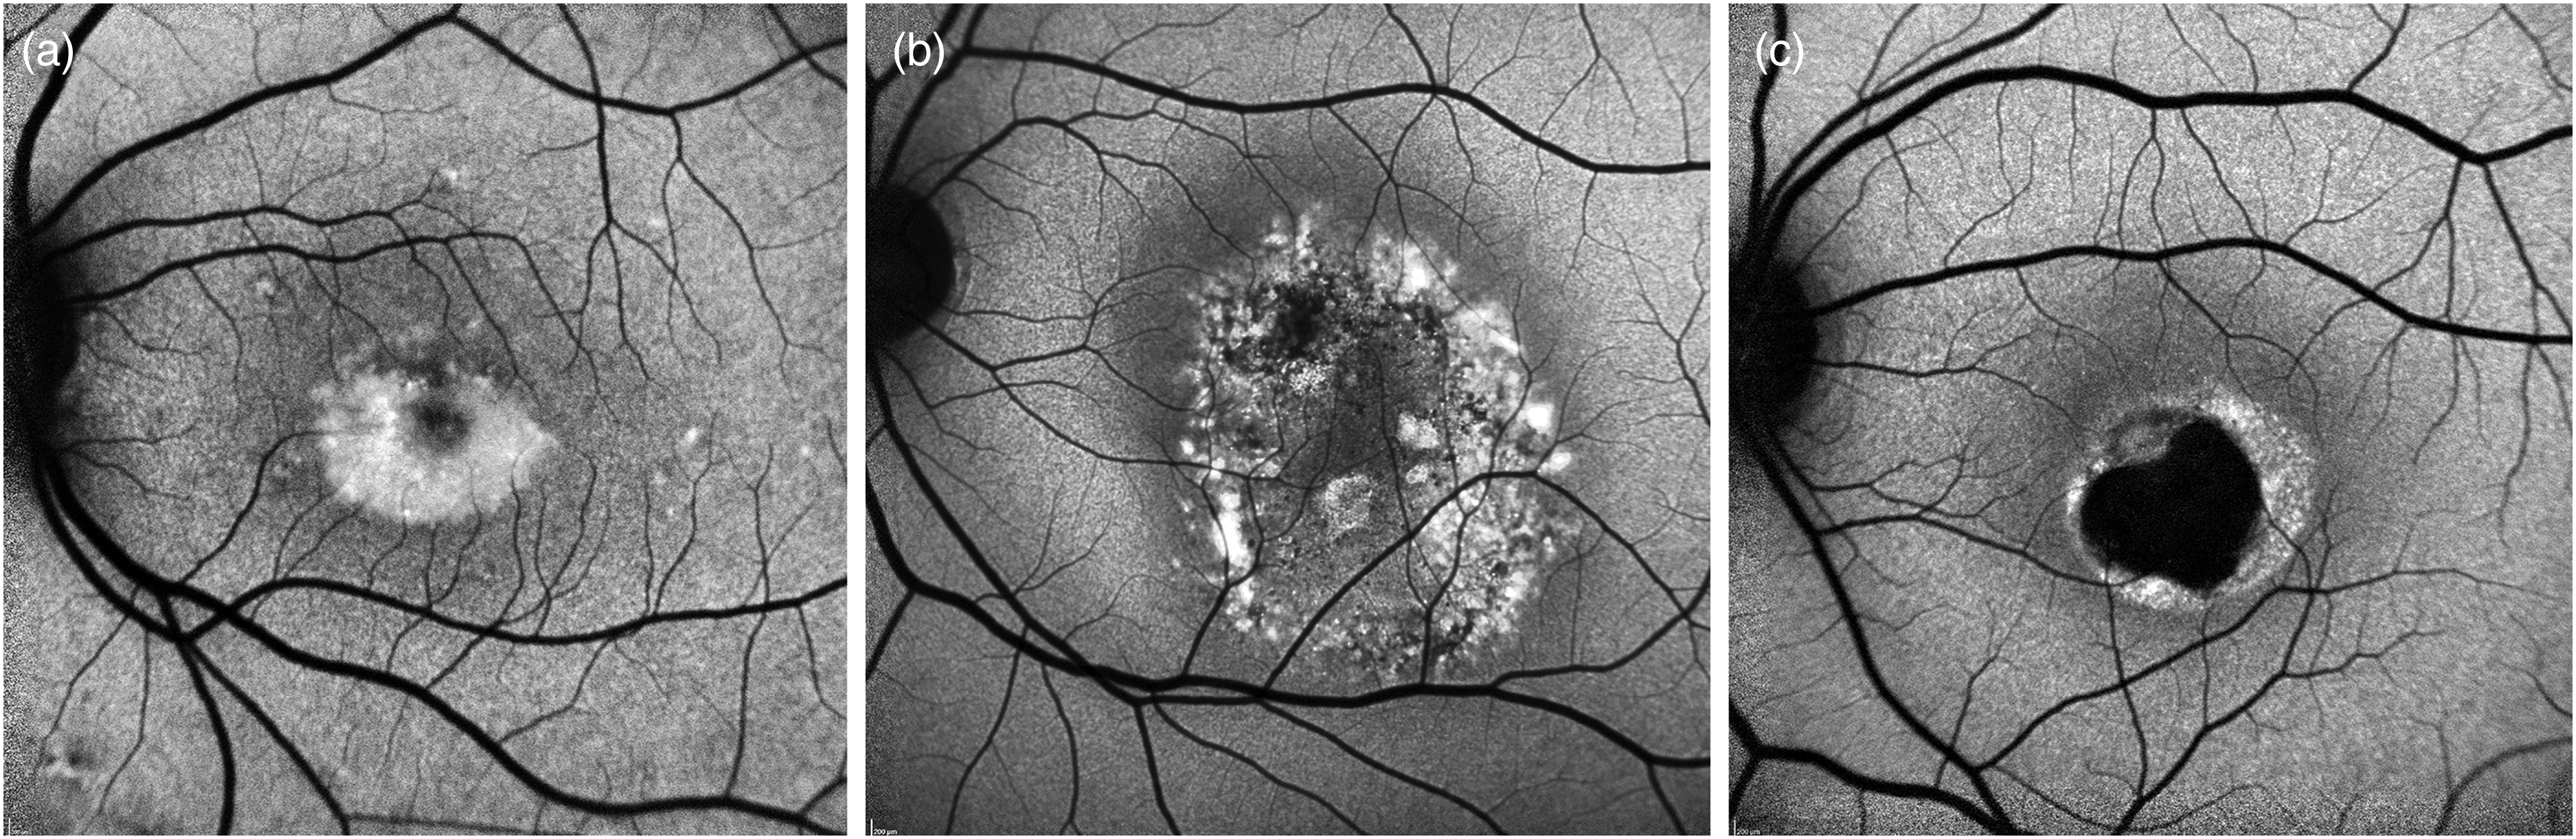
Blue-light autofluorescence patterns of Best Vitelliform Macular Dystrophy lesions. (a) Hyperautofluorescent. (b) Patchy. (c) Hypoautofluorescent.
A tiny foveal hypoautofluorescent spot on NIR-FAF was described in 2014 as a distinctive feature of subclinical BVMD. 23 This abnormal response in the NIR-FAF signal was identified in all the eyes with subclinical BVMD and without evidence of a lesion in BL-FAF images (Figure 4).19,24 A recent study about multimodal imaging in subclinical BVMD revealed that this finding corresponded to a significant reflectivity attenuation of outer retinal bands on enface OCT and an increase in choriocapillaris (CC) porosity on OCT-Angiography. 25 Moreover, mean retinal sensitivity measured by microperimetry was reported to be suppressed within 2 to 4 degrees eccentricity, overlapping the hypoautofluorescent area detected by NIR-FAF. 23 Therefore, the subclinical stage of BVMD appears to be characterized by significant alterations of melanin fluorescent signal, outer retinal bands, and the CC, with morphological and functional correspondence. 25
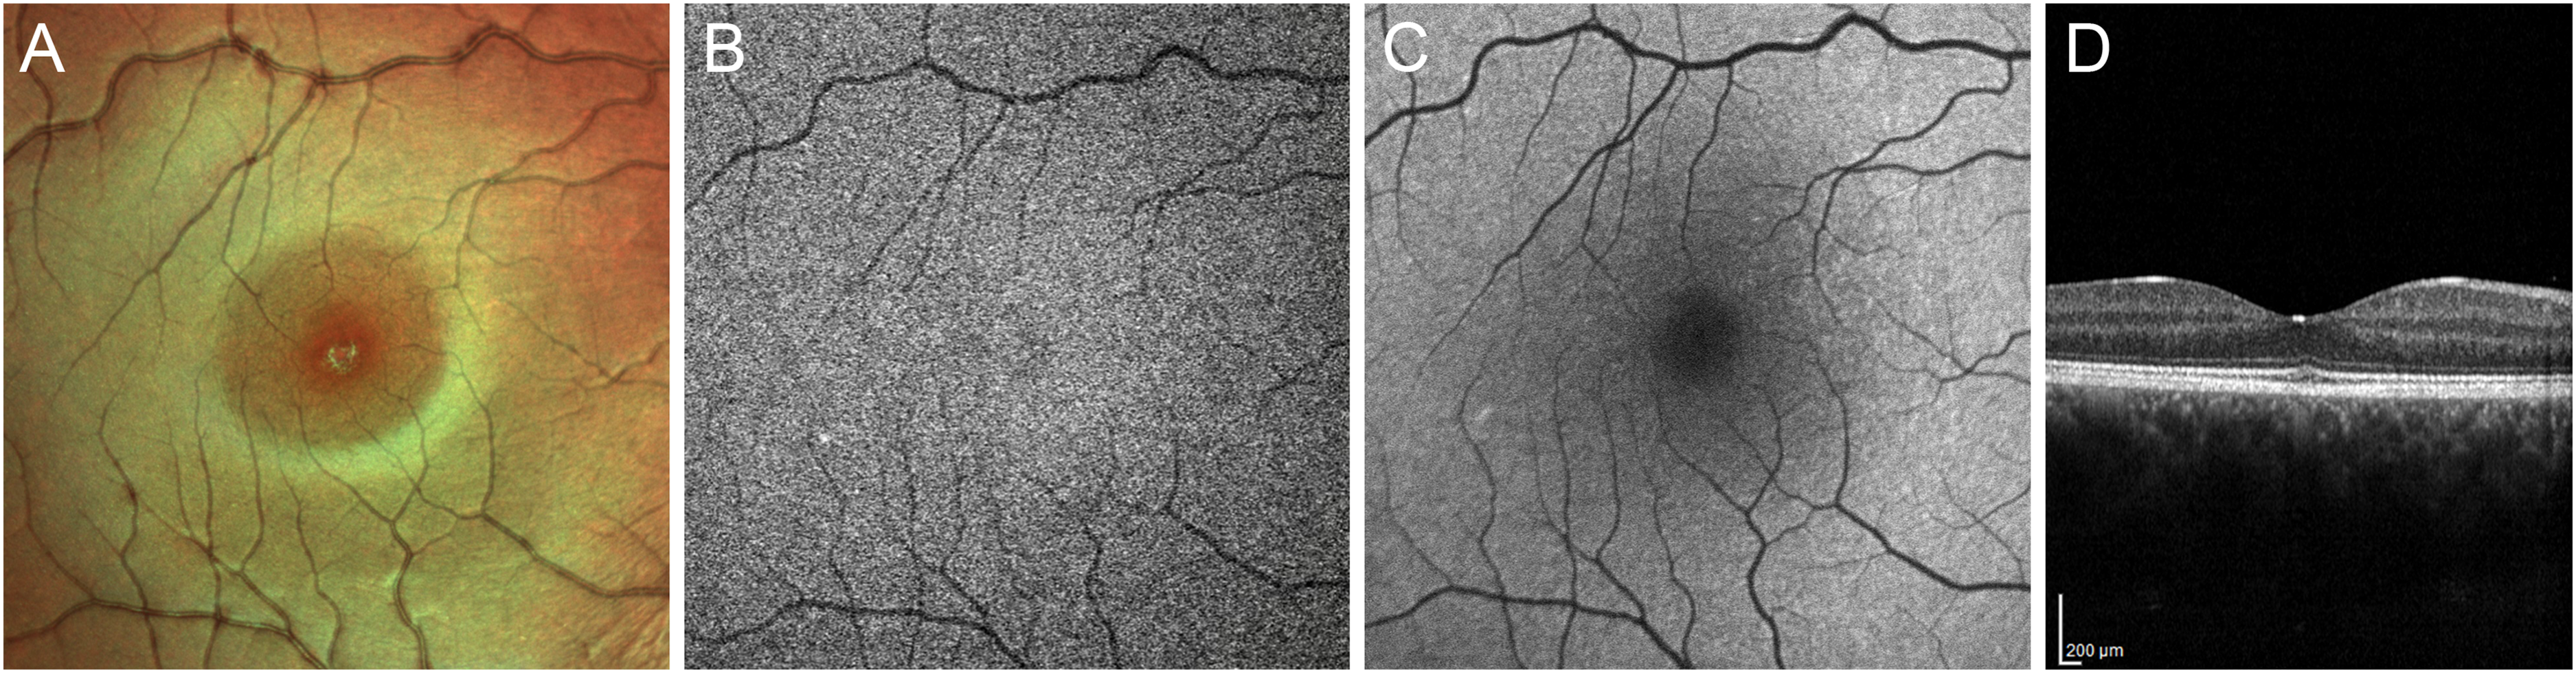
Multimodal imaging features of the subclinical stage of Best Vitelliform Macular Dystrophy. (a) Foveal granularity can be detected using Heidelberg Spectralis Multicolor imaging. (b) Near-infrared autofluorescence shows a tiny central hypoautofluorescent spot, which does not match with any alteration on blue-light autofluorescence (c). On the other hand, a subtle attenuation of the ellipsoid zone and thickening of the interdigitation zone can be observed at the fovea using Optical Coherence Tomography.
A new BL-FAF method, named quantitative autofluorescent (qAF), has recently been described and employs an internal fluorescent reference to account for variable laser power and detector sensitivity, allowing a quantitative assessment of images. 26 Studies on qAF in BVMD concluded that in fundus areas outside the central lesion, lipofuscin levels are not increased.19,24 Thus, a generalized pan-retinal increase in RPE lipofuscin is unlikely to be the primary pathogenetic event in BVMD. Indeed, bisretinoid lipofuscin forms in POS before transfer to RPE thus is not necessary to assume that the autofluorescence within the vitelliform lesion is emitted from RPE. Moreover, these two studies demonstrated that the fluorescent signal is elevated also in fluid-filled lesions, corroborating the hypothesis that increased autofluorescence reflects the inability of RPE to phagocytose POS due to neurosensorial detachment.19,24 Therefore, the formation of the dome-shaped accumulation of POS debris is not due to an intrinsic inability of the RPE to phagocytose but to a physical separation of photoreceptors from the RPE layer. In one sentence, the hyperautofluorescence of the vitelliform lesion is unlikely to be a primary disease feature but rather a secondary consequence of the fluid-filled macular detachment. At this point, we speculate that the intensity of the BL-FAF signal within a vitelliform lesion may indicate that viable photoreceptors are still present.
Optical coherence tomography (OCT)
OCT generates cross-sectional images of the macula with histological resolution. In the subclinical/previtelliform stage, the only perceptible alteration on OCT in about 40% of cases is a thickening of the interdigitation zone of cones and RPE apical processes, perhaps as a result of defective phagocytosis of shed POS (Figure 4).23,27 The egg-yolk lesion, typical of the vitelliform stage, appears as a dome-shaped hyperreflective lesion in the subretinal space. On the other hand, pseudohypopyon and vitelliruptive stages show reabsorption of the hyperreflective material and substitution with subretinal fluid, as well as elongation of POS. The last stage is characterized by atrophy of the outer retinal layers and RPE, but also by fibrotic scarring. 28 Although the presence of the classic vitelliform lesion is generally associated with good vision, clinical stages II, III and IV are generally quite similar in terms of visual acuity and retinal sensitivity.29,30 Therefore, many studies focused on finding OCT biomarkers that could assess disease severity and predict progression. The most important source of heterogeneity in intermediate clinical stages is the presence subretinal fluid separating photoreceptors and RPE, which is more common in stages III and IV but approximately 20% of eyes in vitelliform stage have this feature. The presence of subretinal fluid is associated to a best corrected visual acuity (BCVA) of 0.2 LogMAR or worse, while the persistence of vitelliform material to a higher BCVA. 29 Duncker et al. demonstrated that in BVMD abnormalities in retinal layers are limited to the outer retina as inner nuclear layers are within normal limits. 24 The subfoveal RPE-Bruch's membrane complex thickness is thinner in patients with BVMD albeit the status of the EZ, 31 defined as the hyperreflective band lying just posterior to the external limiting membrane and corresponding to the junction between the inner and outer segment of photoreceptors that is packed with mitochondria,32,33 is the factor most associated with visual acuity loss.31,34,35 A prospective study by Romano et al. shown that the reflectivity of the EZ is attenuated both in the lesion and peri-lesion areas at baseline examination in patients showing disease progression at the end of follow-up. This phenomenon may signify that an alteration in metabolic status of photoreceptors signals progression to more advanced stages and may be a useful biomarker to screen eyes in the vitelliform stage that are more likely to behave as “rapid progressors” from those with a more stable and slower course of the disease. 34 Recently, another study about short-term modifications of EZ in BVMD confirmed that the subset of patients who disclose an enlargement of the area of EZ disruption is more likely to have a deterioration of BCVA when compared with patients showing a stable or regressing EZ damage. Moreover, many eyes show a central area with preserved EZ (defined as “optically preserved islet, OPI”), associated with better visual outcomes. 35
However, the EZ loss is a phenomenon found in later stages and associated with already severe visual impairment; moreover, it is difficult to quantify due to the presence of vitelliform material and/or subretinal fluid. Many studies reported that in BVMD, outer nuclear layer (ONL) thickness is decreased.24,36 The ONL contains photoreceptor bodies, and its thinning may reflect early photoreceptor degeneration. Augstburger et al. reported that, regardless of clinical stage, ONL thickness was significantly lower in BVMD patients compared to control subjects. Moreover, BCVA and retinal sensitivity correlate with ONL thickness.37,38 Therefore, ONL thickness may be a more useful quantitative metric to assess anatomic loss of photoreceptors and decay of macular function.
Microperimetry has recently been used to investigate associations between multimodal imaging characteristics and retinal sensitivity in BVMD. Lesion types were classified on the basis of their composition on OCT: vitelliform type, mixed type, subretinal fluid type and atrophy type (Figure 5). They proved that the factors most strongly associated with retinal sensitivity are OCT lesion type and ONL thickness, with a trend toward sensitivity decay as vitelliform material was reabsorbed and subretinal fluid accumulated. 38 These observations may have a therapeutic implication: any intervention designed to preserve visual function must precede the flattening of the vitelliform material and formation of subretinal fluid, which marks a deterioration in retinal sensitivity.
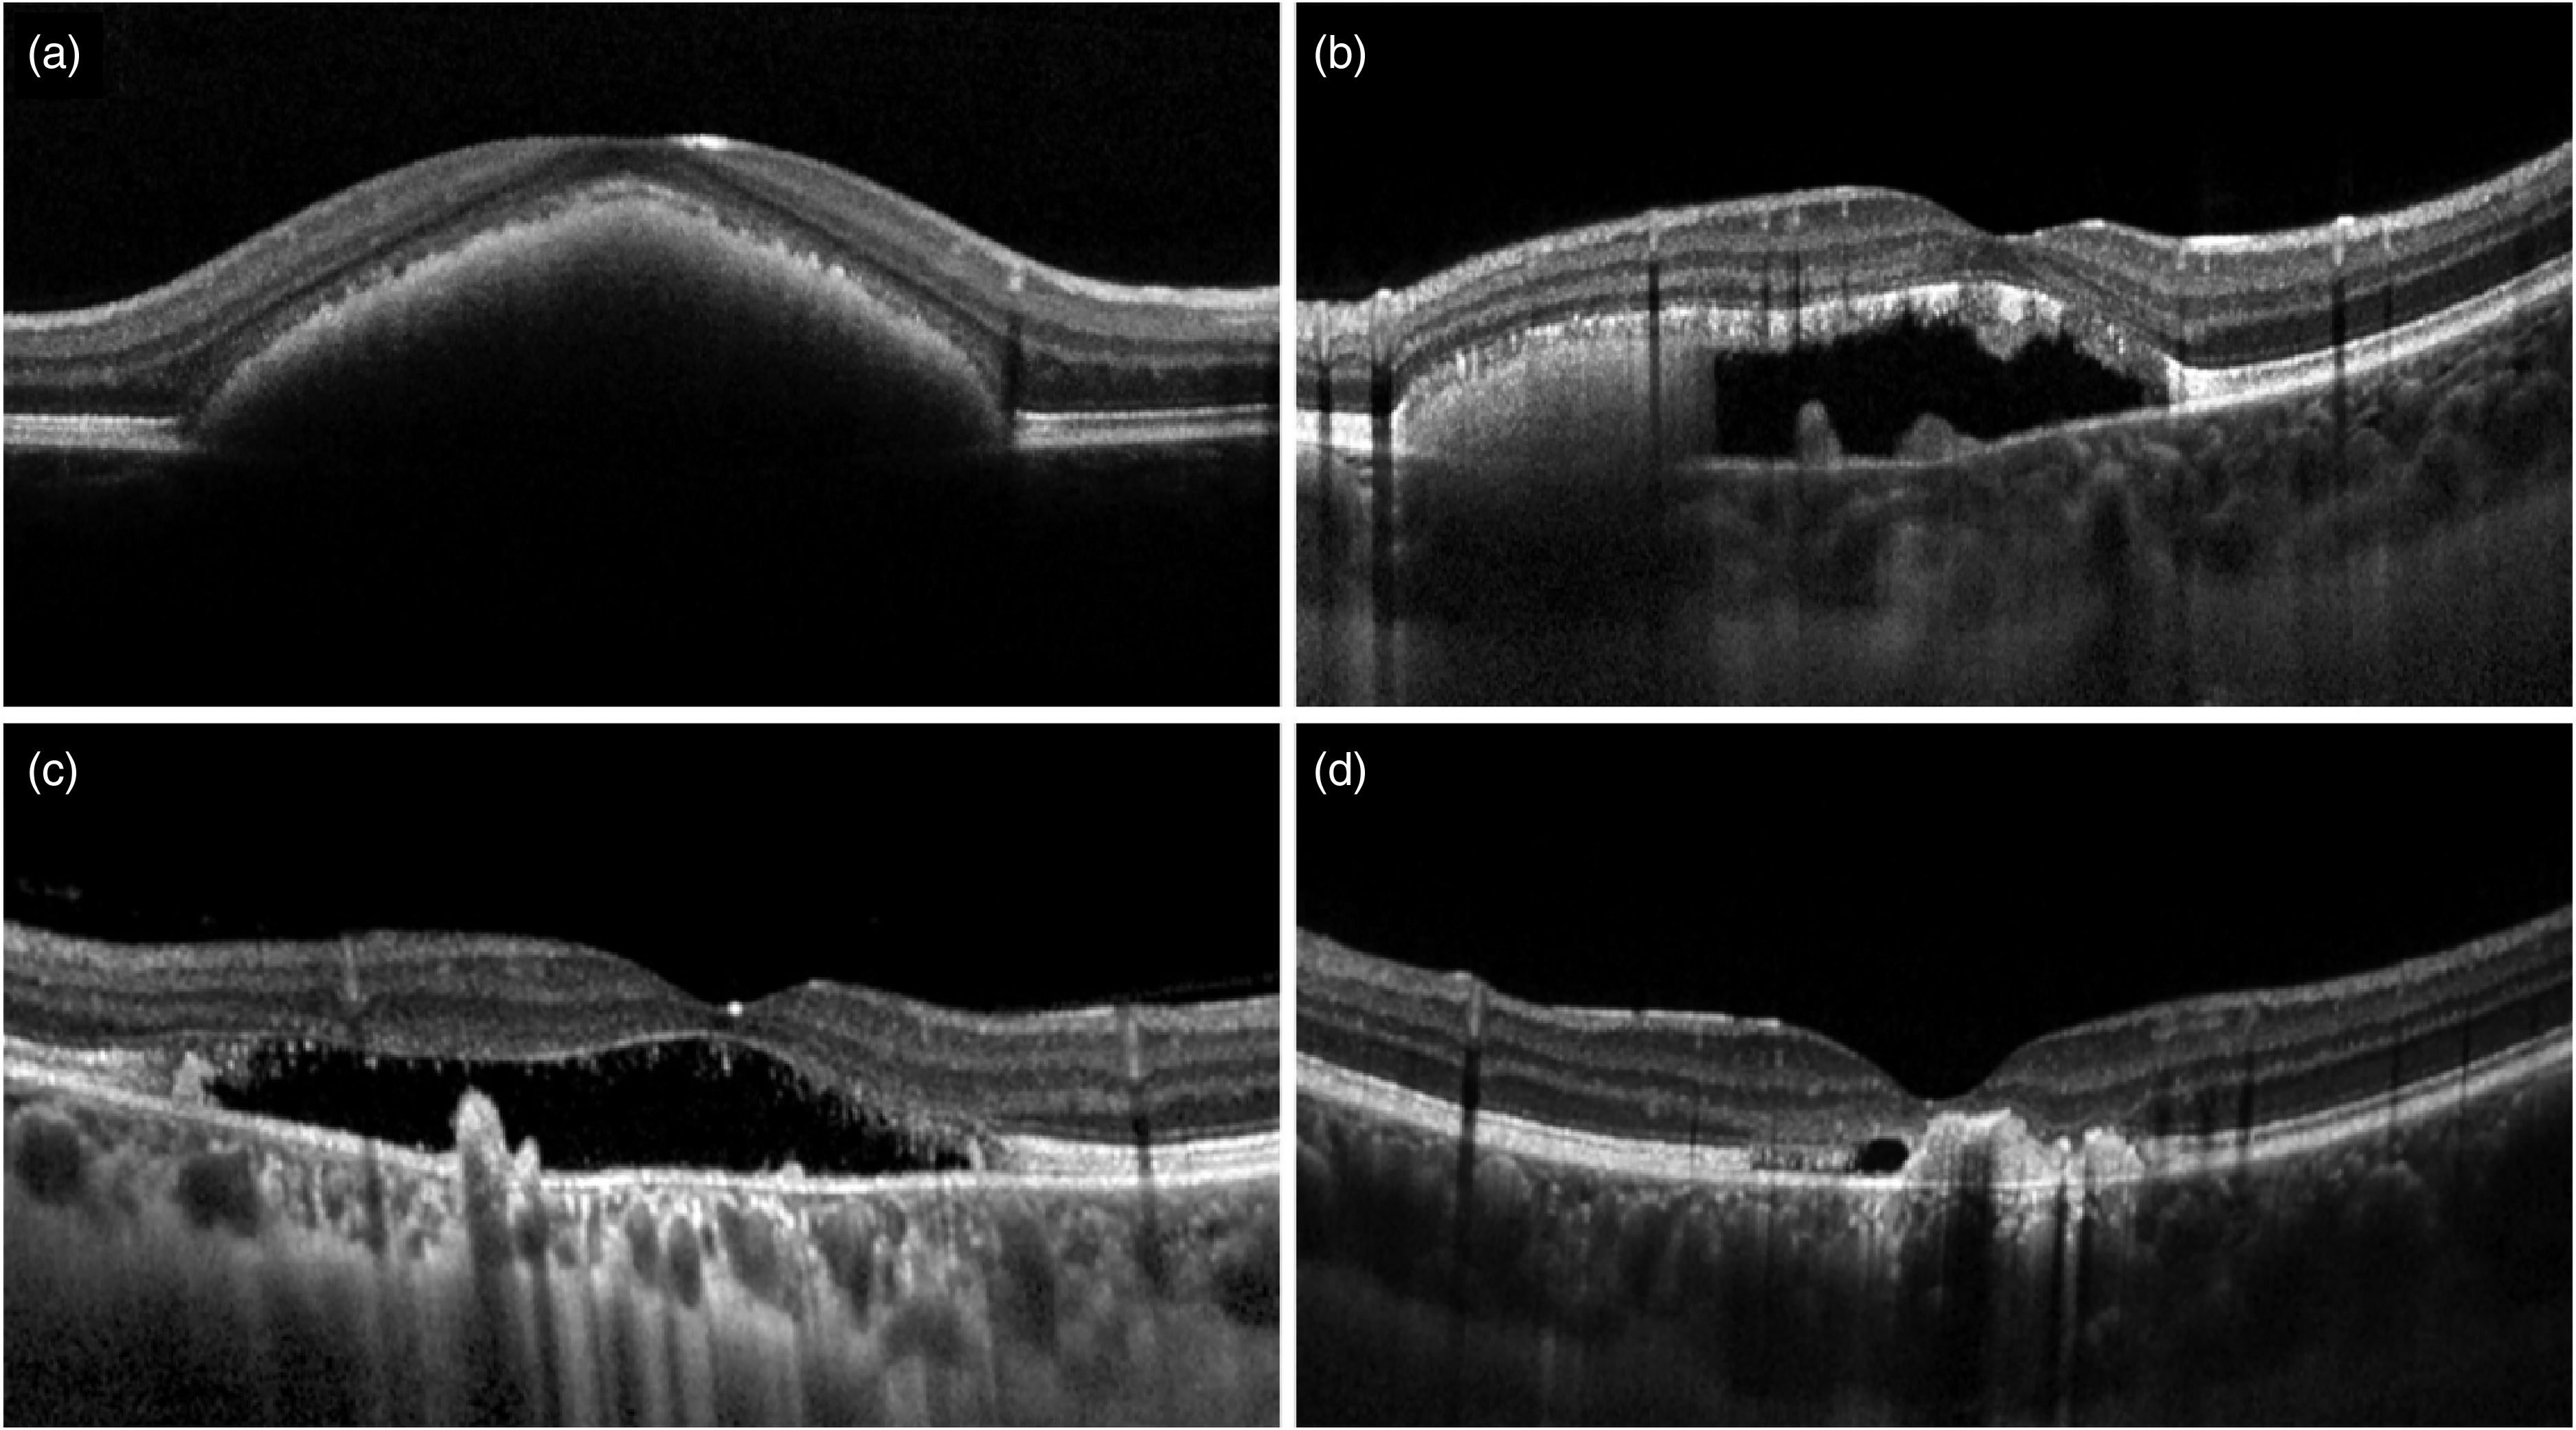
Proposed Optical Coherence Tomography classification of Best Vitelliform Macular Dystrophy lesion types. (a) Vitelliform type, characterized by hyperreflective material located in the subretinal space. (b) Mixed type, characterized by subretinal fluid with evidence of residual subretinal material. (c) Subretinal fluid type, characterized by the complete reabsorption of the vitelliform accumulation. (d) Atrophy type, characterized by a complete loss of outer retinal layers.
Retinal hyperreflective foci (HF) are small (<30 μm), punctiform lesions located mainly in the outer nuclear and plexiform layer on the neuroretina. A single study identified HF in BVMD and found that their number increases with stage progression and correlates with BCVA. 39 HF have been proposed to represent aggregates of microglial cells 40 or RPE cells that have detached from Bruch's membrane, migrated into the subretinal material, and eventually in the neuroretina. 41 This latter theory is supported by recent data acquired using polarization-sensitive OCT, a novel imaging technique that provides tissue-specific contrast, which demonstrated the presence of RPE cells in the vitelliform material and the neuroretina. 42 Therefore, HF appear to mirror the progression of the disease and may represent a useful biomarker in monitoring BVMD.
Biomarkers of choroidal angioarchitecture have also been studied in BVMD. A study assessed changes in choroidal thickness in different stages of BVMD and found that stages showing vitelliform deposition have a thicker choroid and atrophic/fibrotic stages a thinner with respect to healthy controls. The hypothesis was that the metabolic overload of the RPE and photoreceptor layers suffering from the accumulation of vitelliform material could lead to an increased blood flow and choroidal vessel dilation, resulting in an increased choroidal thickness; vice versa, end-stage outer retinal degeneration, and reduced flow request would be reflected by a lower choroidal thickness. 43 The positive rather than negative association between age and choroidal thickness in BVMD supports this hypothesis. 44 However, a more recent investigation found no difference in subfoveal choroidal thickness between BVMD and control eyes. 45 On the other hand, choroidal vascularity index, a novel biomarker that reflects the relative proportion of vascular to stromal choroidal component, 46 was significantly decreased in BVMD, albeit without difference between clinical stages. 45 Moreover, focal choroidal excavation (FCE) is a fairly common finding in BVMD,14,47,48 which may signal weakening of choroidal stroma and is associated with the development of macular neovascularization (MNV). 49 Thus, choroidal ischemia may have a role, albeit controversial, in the pathogenesis of BVMD, requiring further investigations. 50
Lastly, full-thickness macular hole is a rare but possible complication of BVMD,51,52 and recent research with OCT identified progressive retinal atrophy as the most probable cause for its development rather than vitreofoveal traction, which accounts for the majority of macular holes, or rupture of vitelliform cyst. 53 Such macular hole may also lead to retinal detachment in absence of high myopia, possibly due to a poor retinochoroidal adhesion in the macula because of the widespread primary RPE dysfunction.54–57
Adaptive optics (AO)
AO technology compensates for optical aberration in the human eye and can be applied to any ophthalmoscope modality, including fundus cameras, scanning laser ophthalmoloscope (SLO), and OCT devices, to allow visualization and optical access to individual retinal cells in living human eyes. 58
Kay et al. used OCT and AO-SLO to assess outer retinal structure in BVMD: disruption of the hyperreflective EZ identified by OCT corresponded to areas of cone disruption while the surrounding mosaic was found to be normal. Moreover, they found that the rarefaction of cone mosaic is evident in all stages of BVMD, suggesting that photoreceptor loss is an early finding in patients with BVMD. 59 A subsequent investigation confirmed that within clinically apparent lesions, cone photoreceptor inner segments are enlarged, and cone density is reduced while immediately adjacent to the lesions both density and appearance of cone inner segments return to normal. Early in the disease, the photoreceptor mosaic remains contiguous but with decreased density; later, after further cell loss has taken place, the photoreceptor packing no longer appears contiguous, but some cones remain although sparsely packed and with focal areas entirely devoid of photoreceptors. 60 More recently, Liu et al. investigated also RPE cell density using AO-ICG and found that RPE cells are generally more affected than cones in eyes with BVMD. All these findings support the paradigm of BEST1-associated retinal diseases being primarily driven by an RPE dysfunction and degeneration, which leads to the accumulation of toxic compounds in the subretinal space and then to a focal loss of photoreceptors. Qian et al. suggested that thinning and degeneration of RPE is the main reason for chronic subretinal fluid, and it occurs by altering the pump function located at the apical side of the RPE cells. 31 However, many patients with SRF have good visual acuity, even after several years of disease progression. Indeed, we can observe an elongation of the POS in the early phase, due to an incomplete phagocytic cycle by RPE.24,36,37 In the long term, the persistence of SRF leads to a loss of cell-to-cell contact between the photoreceptors and the RPE, causing a lack of renewal and apoptosis of cone cells. This agrees with the fact that the length of POS decreases with the progression of stages and correlates with BCVA. 37
Dye-based angiography
Fluorescein angiography (FA) is an excellent method of studying retinal circulation because tight junctions between retinal endothelial cells allow neither bound nor free fluorescein to pass through and diffuse in the extravascular space. Dye leakage originates from the disruption of the inner blood-retinal barrier or the formation of immature vascular networks lacking endothelial tight junctions above the RPE (such as in type 2 MNV). FA is of limited use in delineating the choroidal vasculature, mainly due to masking by the RPE. In contrast, the near-infrared light utilized in indocyanine green angiography (ICGA) allows penetration of retinal pigments, exudates, and hemorrhages. Moreover, this molecule is larger and more protein-bound in plasma than fluorescein, resulting in a slow leakage and extravascular fluorescence and thus making this technique a useful clinical diagnostic tool for imaging vascular networks lying beneath the RPE (such as in type 1 MNV).
On FA, the vitelliform stage is dominated by a well-defined area of hypofluorescence in the central macula due to a screen effect from the lesion, which is extremely hydrophobic and excludes fluorescein from the lesion, blocking the underlying choroidal fluorescence. Over time, the subretinal material reabsorbs and fluid progressively accumulates in the cavity, as observed in eyes in the pseudohypopyon stage: in this configuration, the serous component of the lesion shows dye pooling while remnants of the yellowish material block the fluorescent signal. As the disease progresses to vitelliruptive stage, a mixed pattern of hype- and hypofluorescence is generally seen. In the last stages of the disease, hyperfluorescence predominates, either due to a window effect in areas of retinal atrophy or to staining of fibrous scars. 61 However, the primary clinical use of FA in BVMD is to help differentiate non-neovascular alterations in lesion anatomy – such as irregular resorption of vitelliform material with accumulation of subretinal fluid – from actively exudating MNV in a patient complaining a decrease in visual acuity. In the latter case, dye leakage with early hyperfluorescence, increasing with time in both area and intensity, confirms the suspicion of a neovascular complication (Figure 6). 62 However, type 1 MNV may still go undiagnosed since the vitelliform lesion shows extensive staining on ICGA, hindering the visualization of indolent vascular networks arising beneath the RPE. 63
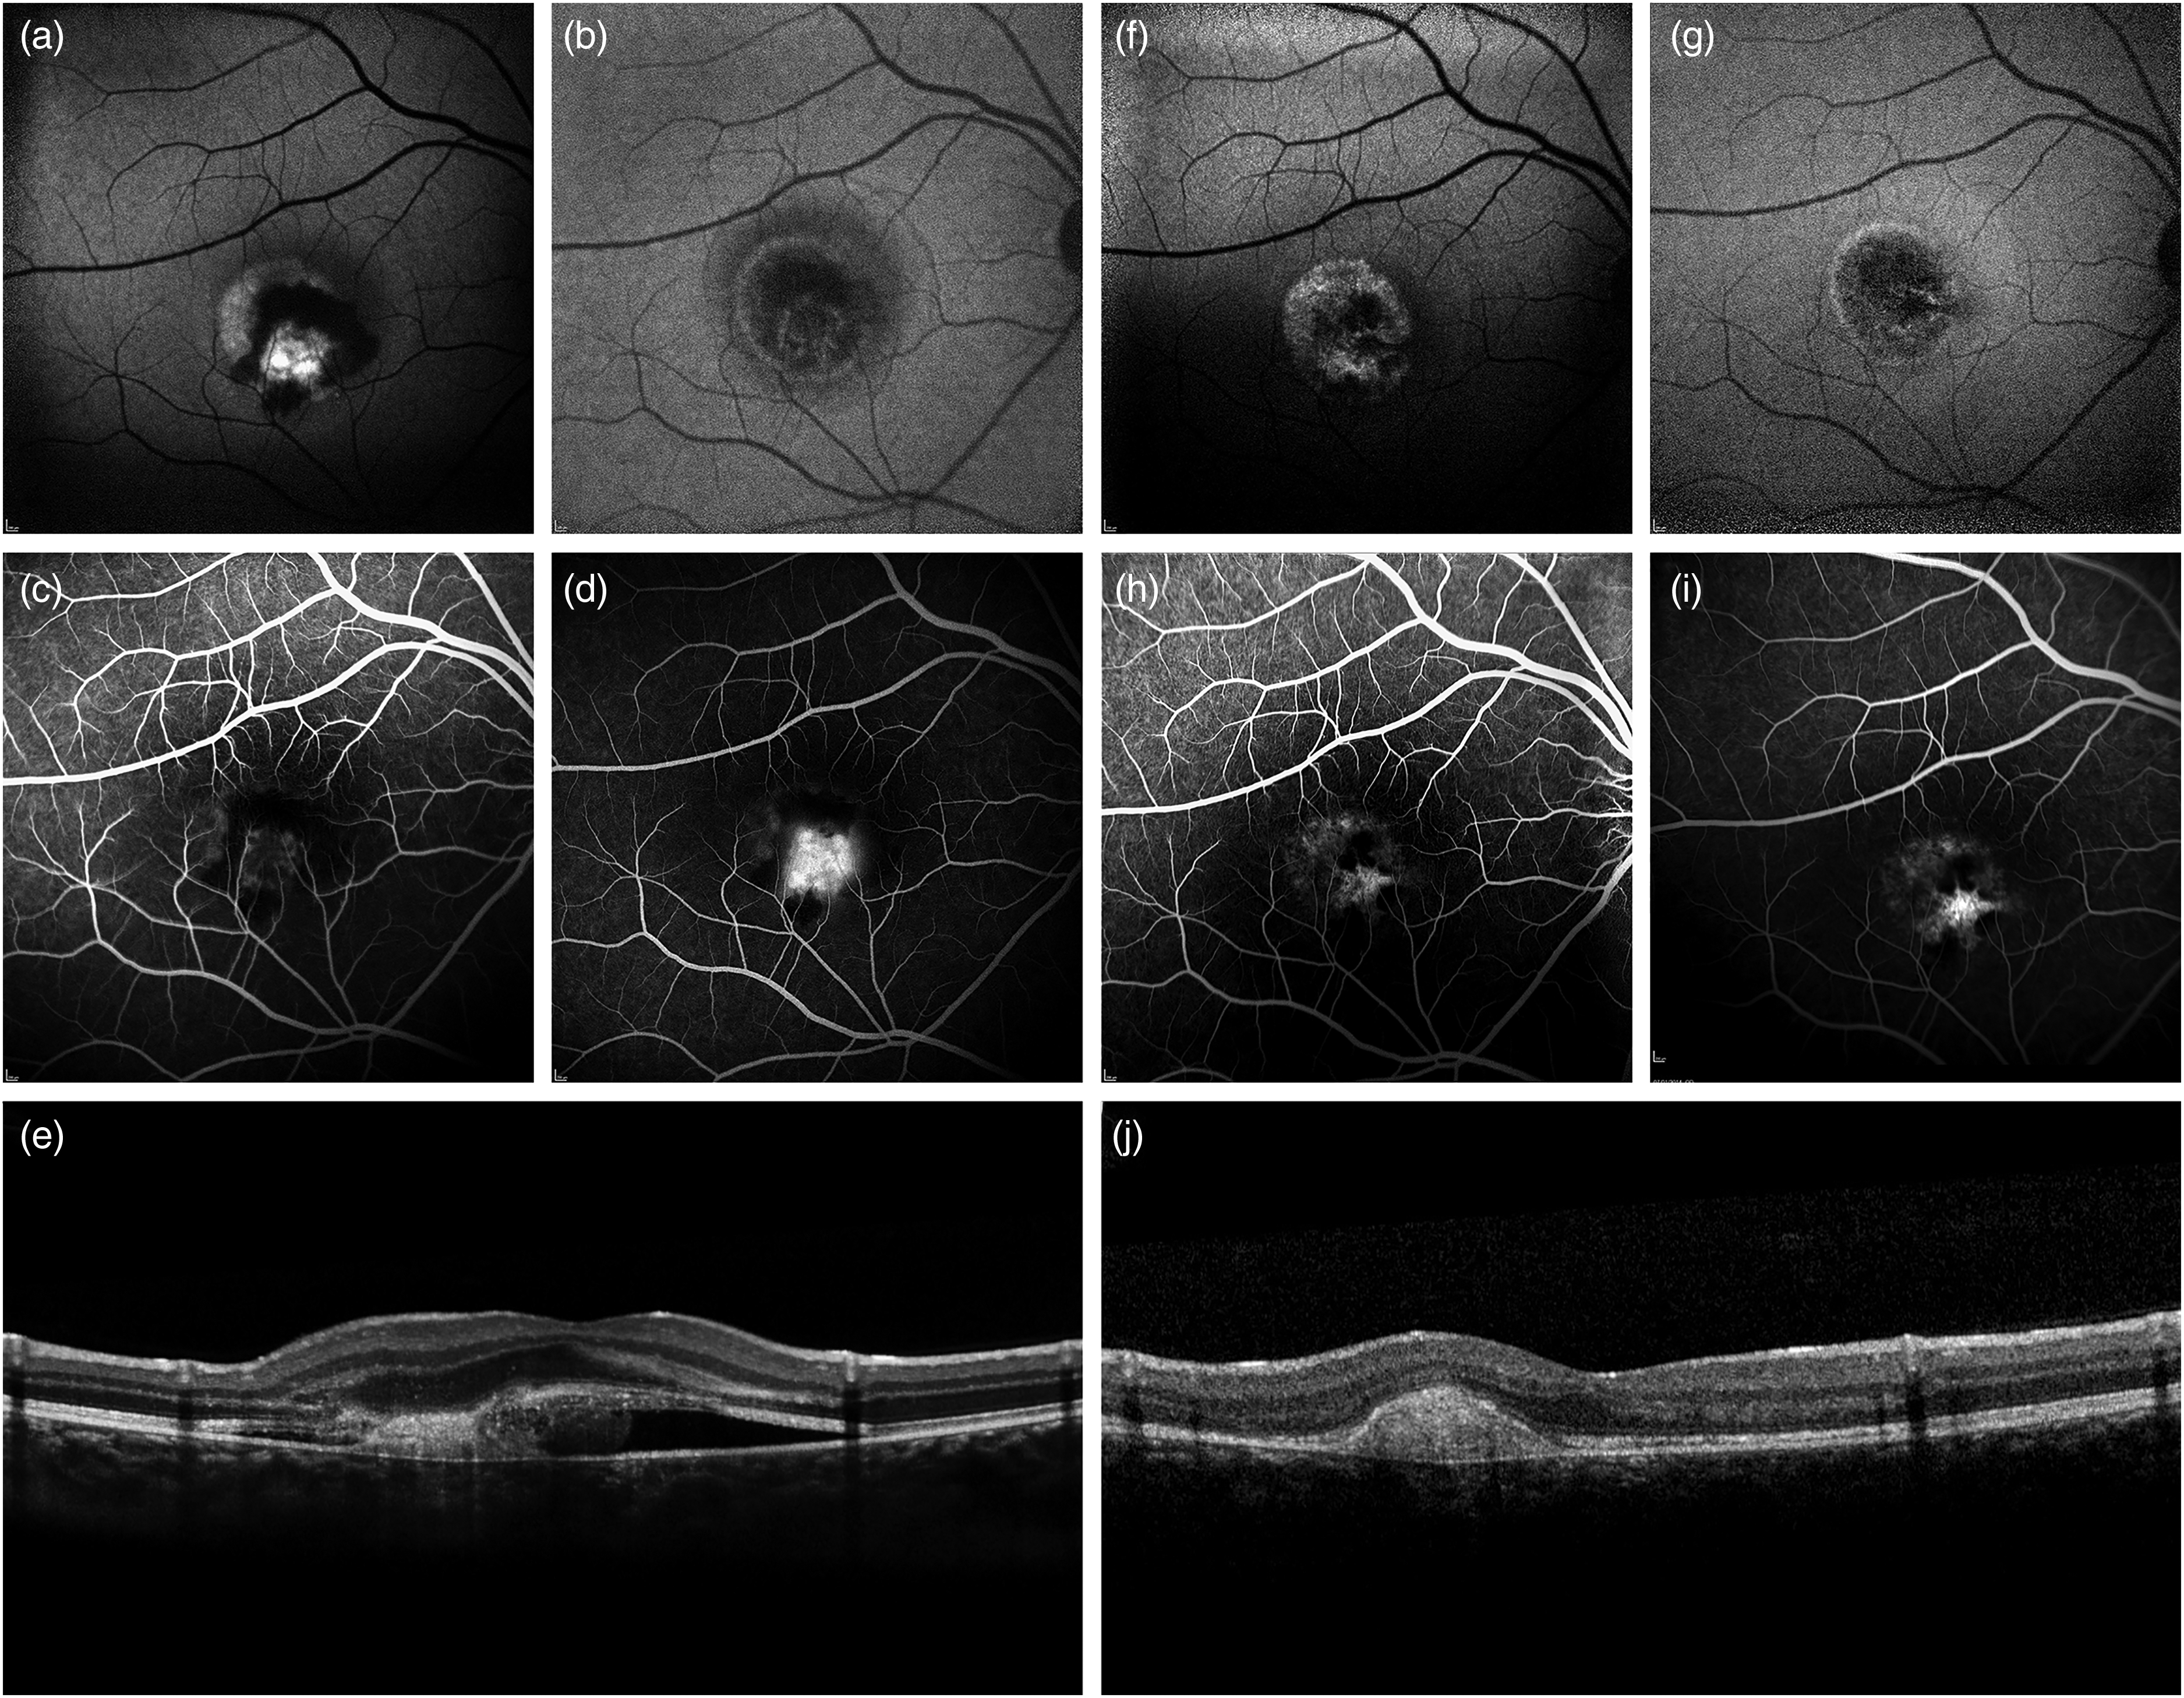
Fluorescein angiography (FA) in a 12-years-old male affected by Best Vitelliform Macular Dystrophy complicated by type 2 macular neovascularization (MNV). At baseline, blue-light autofluorescence (a) shows a macular hyperautofluorescent lesion partly masked by a circinate hemorrhage while near-infrared autofluorescence (b) highlights the boundaries of the exudation, which extends far beyond the outer margin vitelliform lesion. (c) Early- and (d) late-phases of FA at baseline are consistent with leakage partly blocked by a subretinal hemorrhage attributable to a type 2 MNV. A vertical Optical Coherence Tomography scan passing through the fovea (e) shows the presence of a subretinal hyperreflective lesion surrounded by fluid and surmounted by a severely irregular outer retina. After a single intravitreal injection of an anti-Vascular Endothelial Growth Factor (VEGF) agent, blue-light (f) and near-infrared (g) autofluorescence demonstrate partial resolution of hemorrhage and exudation. Moreover, the lesion acquired granular autofluorescence signal and developed an hypoautofluorescent notch in its nasal part, respectively corresponding to window defects and staining of the fibrovascular scar on (h) early- and (i) late-phases of FA at two months of follow-up. A vertical Optical Coherence Tomography scan passing through the fovea (J) confirms the presence of a hyperreflective fibrous scar without any further exudation.
OCT angiography (OCTA)
OCTA generates depth-resolved en-face images of retinal and choroidal vascular architecture, without the use of intravenous dye, allowing the analysis of deep retinal capillary plexus to assess for ischemia and identification of MNV morphology in the avascular outer retina.
In the past, MNV prevalence in BVMD was estimated at around 2–9% of cases,3,12,64 but many recent studies have found that it is actually more frequent than previously thought, up to 65% of eyes.65–69 This is probably due to the introduction of OCTA into clinical practice, which augmented the ability to diagnose this complication (Figure 7). Indeed, only a small fraction of MNVs eventually lead to exudative manifestations and clinical symptoms while the vast majority are subclinical and undetectable on either FA o ICGA due to masking or staining of the vitelliform deposits, as already stated above.67,70,71 In 2020 a study by Battaglia Parodi et al. indagated quantitatively the characteristics of MNVs in BVMD and identified two different MNV subtypes on OCTA: exudative and non-exudative. Exudative MNV is rare, more typical of early stages (II, III), and presents with bleeding and fluid formation; vice versa, non-exudative MNV develops very commonly in the advanced stages (IV, V). Anti-VEGF treatment for exudative MNV in BVMD is largely endorsed while the non-exudative forms remain stable without receiving any treatment, which may even accelerate atrophic changes with consequent functional deterioration.66,72 Quantitative OCTA analysis revealed that exudative MNV in BVMD is characterized by higher values of vessel tortuosity, a parameter that reflects vascular perfusion, and vessel dispersion, a parameter that provides information about the vascular network disorganization, with respect to non-exudative ones. 66 One may speculate that exudative MNV is associated with a rapidly growing neovascular network, possibly related to a cytokine/trophic factor imbalance triggered by the progressive accumulation of vitelliform material in the early stage of the disease; vice versa, non-exudative MNV develops more slowly, have lower vascular disorganization and support the augmented trophic demand the outer retina due to large lipofuscin accumulation impairing the normal metabolic exchanges between POS and RPE. 73
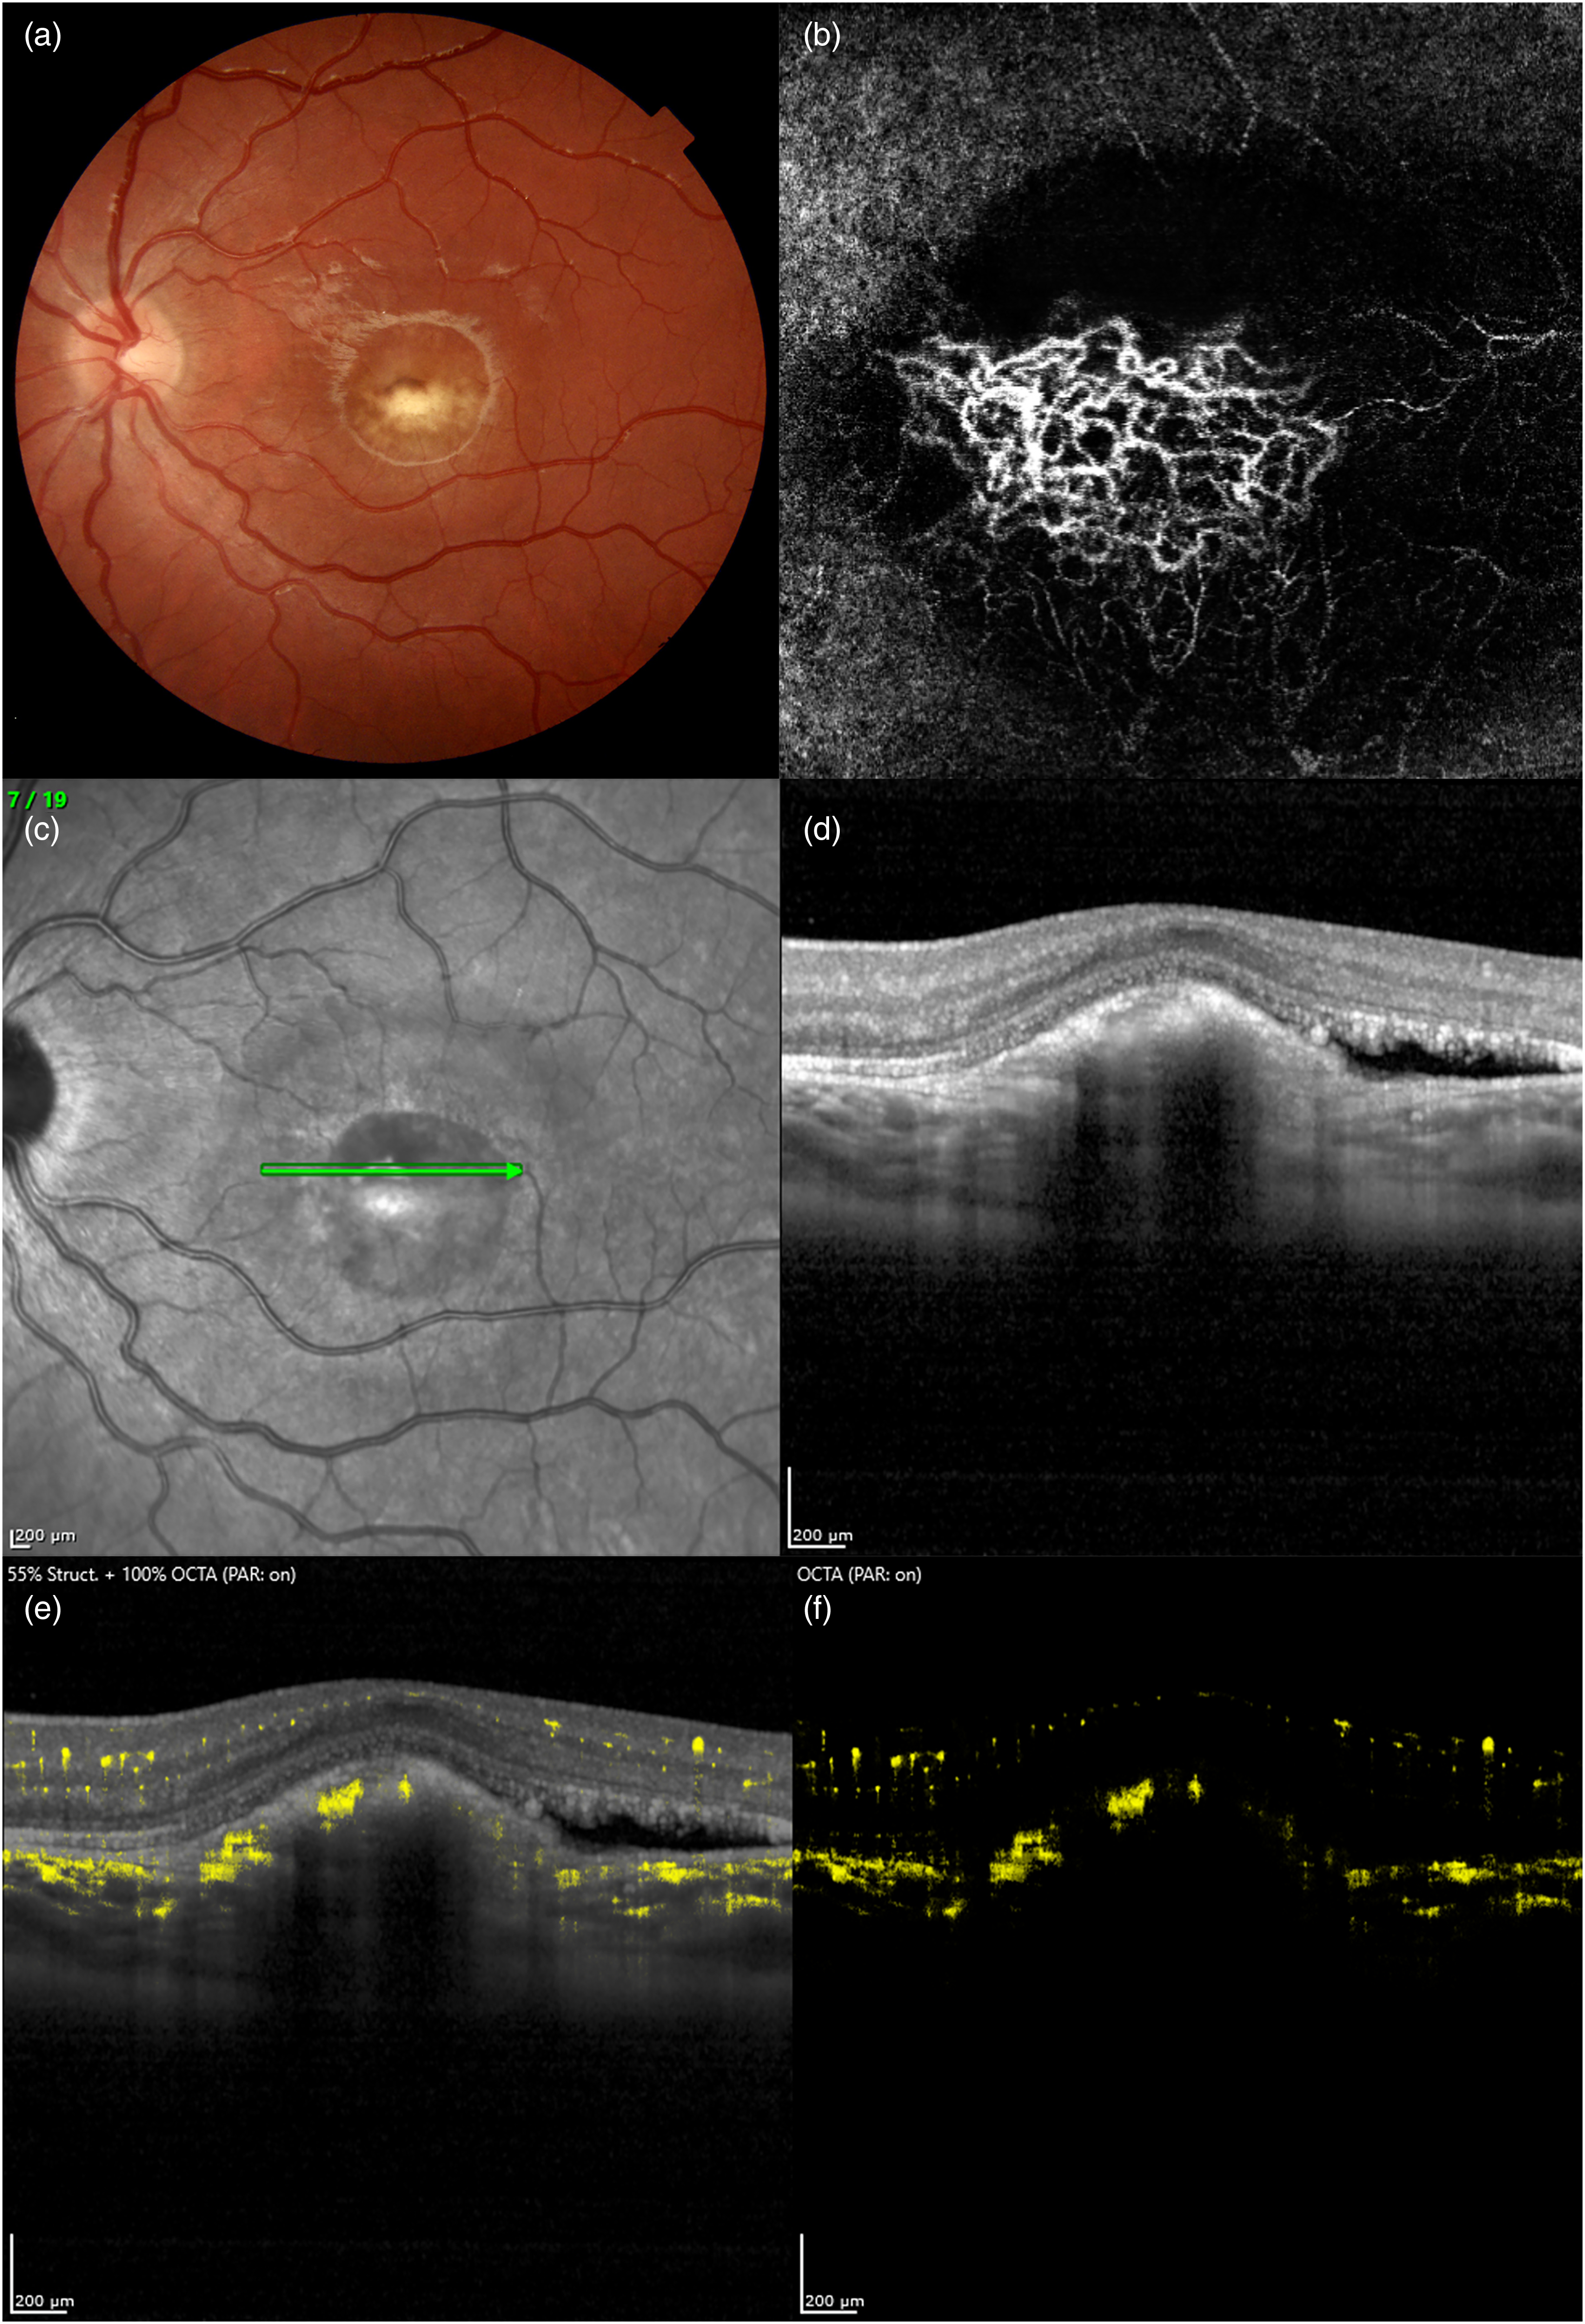
Optical Coherence Tomography Angiography (OCTA) findings of macular neovascularization (MNV) complicating Best Vitelliform Macular Dystrophy in a 9-years-old female. A prominent fibrotic nodule in the central macula can be detected on color fundus photograph (a), typical of stage V according to Gass’ classification. En-face OCTA (b) of the outer retinal slab shows a MNV with complex vascular architecture. Structural OCT B-scan (D) corresponding to the green arrow on near-infrared reflectance image (c) shows the presence of a prominent hyperreflective fibrotic lesion beneath the retinal pigment epithelium, along with a small amount of subretinal fluid. (e, f) Heidelberg Spectralis OCTA Dense ART (DART) is able to demonstrate extensive vascular flow within the hyperreflective lesion.
Quantitative analysis of retinal capillary networks in BVMD using OCTA showed significant vascular rarefaction and abnormal foveal avascular zone when compared to controls.65,67,74 More in detail, only stages III to V feature a vessel density reduction at the level of superficial capillary plexus (SCP), deep capillary plexus (DCP), and CC in the macular region; on the other hand, in early stages (I and II) the only alteration appears to be the presence of capillary dilations at DCP. 65 Therefore, it seems that vascular anatomy is spared in stages I and II while more advanced stages are progressively more involved. Furthermore, a lower vessel density at DCP was found to be associated with a rapid progression, confirming the involvement of the vascular system in the pathogenesis of BVMD. 34
Subsequent studies focused on the CC, which appears to be damaged as early as the subclinical stage. 25
Later in the disease course, CC shows an increased brightness and granularity in stage IV, progressing to overt atrophy with exposition of larger choroidal vessels in stage V.74,75 These modifications in CC are paralleled by the development of RPE atrophy, as detectable by BL-FAF and OCT. 75 However, OCTA cannot fully characterize the status of CC in stages II and III because of the masking effect attributable to the vitelliform lesion prevents visualization of choroidal vascular structures. Therefore, future research should clarify the role of CC degeneration in BVMD.
Conclusions
Bestrophin-1, the protein product of BEST1, is found only in the RPE and a loss of RPE pump function is likely the driving force behind photoreceptor changes observed in BVMD. qAF studies informed us that lipofuscin accumulation, the hallmark of bestrophinopathies, is unlikely to be a primary pathogenetic event, but rather a consequence. It could be due to a lack of apposition between the photoreceptors and the RPE in the macula with subsequent accumulation of shed POS over time. OCT and AO-SLO revealed that vitelliform lesions are characterized by progressive changes in the cone mosaic corresponding to a thinning of the ONL and then disruption of the EZ, which are associated to decreased sensitivity and visual acuity. Lack of POS renewal due to degeneration of cone cells would then cause the vitelliform material to be progressively substituted by subretinal fluid, which marks irreversible damage to the outer retina. Therefore, an OCT staging system based on lesion composition, thus reflecting disease evolution, has been recently developed.
Lastly, the emerging role of OCTA proved a greater prevalence of MNV, the majority of which are non-exudative and develop in late disease stages, presumably because the chronic persistence of lipofuscin accumulation or subretinal fluid impairs cell-to-cell contact between photoreceptors and RPE and normal metabolic exchanges with CC.
Footnotes
Declaration of conflicting interests
The author(s) declared no potential conflicts of interest with respect to the research, authorship, and/or publication of this article.
Funding
The author(s) received no financial support for the research, authorship, and/or publication of this article.
Patient consent
The patient was informed and consented to the use his medical records and data for research purposes.