
Abstract
Purpose
There is no valid medical treatment for diabetic retinopathy mostly because its pathogenesis remains largely unknown. Early stages of diabetic retinopathy, just like glaucoma, are characterized by the loss of retinal ganglion cells. Whether the two diseases may share a similar pathogenic background is unknown.
Methods
To clarify this issue the thickness of retinal nerve fiber layer was studied in vivo by optical coherence tomography in 10 Ins2Akita (diabetic) and 10 C57BL/6J (control) mice. The number of retinal ganglion cells and retina's surface covered by neurofilaments were quantified ex vivo in 12 normoglycemic DBA/2J (glaucoma) and 11 diabetic (alloxan-induced) DBA/2J mice (glaucoma + diabetes).
Results
At 16 weeks of age retinal nerve fiber layer was significantly thinner in Ins2Akita mice confirming the neurodegenerative impact of diabetes. Number of retinal ganglion cells and retina's surface covered by neurofilaments were similar in normoglycemic and diabetic DBA/2J mice with the exception of the superior quadrant where the number of retinal ganglion cells was increased in animals with glaucoma + diabetes.
Conclusions
In presence of glaucoma, diabetes is unable to induce further retinal ganglion cells loss. The hypothesis that the mechanism leading to retinal ganglion cells loss may be shared by the two diseases cannot be ruled out. Whether early diabetes-driven retinal neurodegeneration could be prevented by neuroprotective treatment proven to be effective in case of glaucoma, remains to be clarified.
Introduction
Glaucoma is an optic neuropathy characterized by the progressive damage of the optic nerve, death of retinal ganglion cells (RGCs) and ultimately reduction of visual field. 1 Glaucoma should be classified as a family of diseases rather than a single disorder.1,2 Increased Intraocular pressure (IOP) has been for long time considered the hallmark and at the same time the cause of the progression of the disease, but now we know that at least 30–40% of the patients develop glaucoma despite a normal ocular pressure. 3 The pathogenesis of glaucoma remains unclear even though different hypotheses, in particular based on mechanical or vascular dysfunctions, have been suggested to explain the development of the disease. 2
Whatever is the cause and the natural history of the disease, the specific target of glaucoma is represented by the RGCs that are slowly lost during the progression of the disease.1,2 Studies performed in animal models of glaucoma have shown that up to 70% of RGCs may be lost along time. 4
Recent evidences have clearly demonstrated the existence of a tight association between glaucoma and diabetes5,6 and, in particular, that diabetic patients are at increased risk to develop glaucoma.5,6 Of particular interest on this regard is the case of diabetic retinopathy (DR), the well established complication of both type 1 and type 2 diabetes. 7 Microaneurisms, microhemorrhages, diffuse ischemia and, finally, retinal neovascularization are the hallmarks of DR confirming the definition of microvascular complication of diabetes. 7
Recent evidences suggest however that the “microvascular stage” of DR could be preceded and, at least potentially, caused by a subclinical neurodegeneration of the retina involving, once again, the RGCs.
8
How diabetes, a disease characterized by metabolic disorders of carbohydrate metabolism,
9
may end up by causing the death of neurons such as RGCs remains unclear.
To clarify whether glaucoma and diabetes induce retinal toxicity through similar or independent pathways we first investigated in: A) a mouse model of spontaneous diabetes (Ins2Akita mouse)10,11 whether prolonged hyperglycemia (13 weeks of diabetes in animals of 16 weeks of age) eventually causes RGCs death. Finally, we verified in: B) a mouse model of glaucoma (DBA/2J)4,12,13 if the number of RGCs and neurofilaments can be significantly affected after the superimposition of a prolonged (18 weeks) hyperglycemia.
Methods
The experimental study strictly complied with the Association for Research in Vision and Ophthalmology (ARVO) Statement for the Use of Animals in Ophthalmic and Vision Research. The study was approved by the Institutional Animal Care and Use Committee (IACUC) of the IRCCS San Raffaele Scientific Institute in Milan, according to the National Legislation (D.L. 116/1992) and the European Directive (2010/63/EU) about the use of laboratory animals, and with the license of Italian Board of Health. Approval code: 632/2017-PR.
Diabetes study
The Ins2Akita mouse develops early hyperglycemia (approx. at 3–4 weeks of age) because of a spontaneous mutation of the insulin 2 gene.10,11 Only male Ins2Akita mice were considered in this study because, as previously demonstrated, progression of diabetes in female mice is less uniform and slower over time. 14 10 male heterozygous Ins2Akita mice (purchased from the Jackson Laboratory) and 10 age-matched non diabetic siblings (wild type, C57BL/6J) were used in the study. The animals were housed in cages in a temperature-controlled room with a twelve to twelve light–dark cycle and free access to standard food and tap water. Blood glucose levels were checked on a weekly basis and insulin shots were administered in case of physical decay (more than 5% weight loss in one week), that was however uncommon. At 16 weeks of age the thickness of the retinal nerve fiber layer (RNFL, the layer that in the mouse contains the fibers of RGCs that will converge to form the optic nerve 15 ) was measured in vivo by means of optical coherence tomography (OCT). In brief, the animals were anesthetized with intraperitoneal injection of 80 mg/kg Ketamine, 10 mg/kg Xylazine (Sigma- Aldrich, Munich, Germany). Mydriasis was induced by instilling a drop of tropicamide 0.5% (Visumidriatic, Tibilux Pharma, Italy) in each eye.
The retina was analyzed using Micron IV together with Image-Guided 830nm OCT (Phoenix Research Laboratories, Pleasanton, CA, USA). A 550μm diameter circular bidimensional OCT scan (B-scan) was performed around the optic nerve head. Both eyes were studied and the results were averaged. Segmentation and quantification of retinal layers was performed using Insight software (Phoenix Research Laboratories).
Diabetes + glaucoma study
The DBA/2J mouse is an established model of glaucoma4,12,13 It develops spontaneously an elevated IOP and is characterized by the loss of RGCs and the excavation of optic disc, two specific features of glaucoma. This animal model develops iris pigment dispersion around 4 months of age that progress into iris atrophy and anterior synechia (adhesion of the iris to the cornea), leading to an increase of the IOP at 9 months of age and at 1 year of age approximately 60% of the RGCs are eventually lost.4,13
12 normoglycemic DBA/2J and 11 diabetic DBA/2J mice were included in the study. Diabetes was induced at 8 months of age in DBA/2J mice through an intravenous injection of alloxan (72mg/kg, Sigma, Munich, Germany), as previously described. 16 The animals were treated as described above. At 1 year of age (four months of duration of diabetes) the mice were supposed to undergo OCT analysis but because of the heavy intraocular iris exfoliation and pigmentation that characterizes this animal model, 17 the examination was not possible as the inner side of the cornea had lost transparency. The animals were therefore sacrificed, the retina was carefully removed and organized in a flat-mount: the retina was opened in four quadrants by four evenly spaced radial cuts from the retinal periphery toward the center. The cuts were used to flatten the retina taking advantage of a special brush. Immunofluorescences for RGCs nuclear antigen Brn3a (Santa Cruz, Santa Cruz, CA, USA) 18 and for neurofilaments (major elements of the cytoskeleton supporting the axon cytoplasm) marker NFM (Abcam, Cambridge, MA, USA) 19 were performed on the retinal flat-mounts. For each retina considered, the number of RGCs was counted in four rectangular areas (dimensions of each area: 300 × 400µm, distance from the head of the optic nerve: 600µm), one area for each retinal quadrant (superior, inferior, nasal and temporal).
For each retina considered, the percentage of area covered by neurofilaments was calculated in four rectangular areas (dimensions 300 × 400 µm, distance from the head of the optic nerve: 600µm), one area for each retinal quadrant (superior, inferior, nasal and temporal).
Number of RGCs and percentage of area covered by neurofilaments were quantified by an independent investigator blinded on the origin of the retinas.
Intraocular pressure (IOP) measurement
IOP was measured at the end of the study using a rebound tonometer (Icare Tonolab, Vantaa, Finland), the procedure was performed within 5 min after performing general anesthesia as described by Saleh et al., 4 six consecutive IOP readings were taken and averaged.
Statistical analysis
Data are shown as arithmetical means ± SE. Parametric (ANOVA) and non-parametric (Mann–Whitney) analyses were carried out, as appropriate, to compare the groups. p < .05 was considered statistically significant. Analyses were performed using JMP software for the Apple Macintosh; SAS Institute, Cary, NC, USA.
Results
Diabetes study
At 16 weeks of age (approximately 13 weeks of duration of diabetes), Ins2Akita mice had a higher blood glucose level (581.5 ± 32.3 vs 172.3 ± 22.4 mg/dl, mean ± SE, p < 0.0001) when compared to control animals and a slightly, but significantly lower body weight (22.4 ± 2.2 vs 27.7 ± 3.5 grams, p < 0.05) as expected in mice with heavy glycosuria. As shown in Figure 1(a), the thickness of RNFL as measured by OCT was significantly reduced in Ins2Akita mice (Figure 1(b)) when compared to controls (18.6 ± 1.2 vs 22.1 ± 1.4 micron, p < 0.02). Taking into account that the thickness of RNFL was shown to be directly correlated with the number of RGCs, 20 these results confirm the neurodegenerative effect of diabetes on RGCs. Of interest, the thicknesses of Inner Retinal Layer (IRL, consisting of Inner Nuclear Layer + Inner plexiform layer) and Outer Retinal Layer (ORL, consisting of Outer Nuclear Layer + Outer Plexiform Layer) (Figure 1(a)) were also measured and did not differ between diabetic and control animals (data not shown) confirming the notion present in the literature that RNFL, and therefore RGCs, are the specific target of diabetes. 21
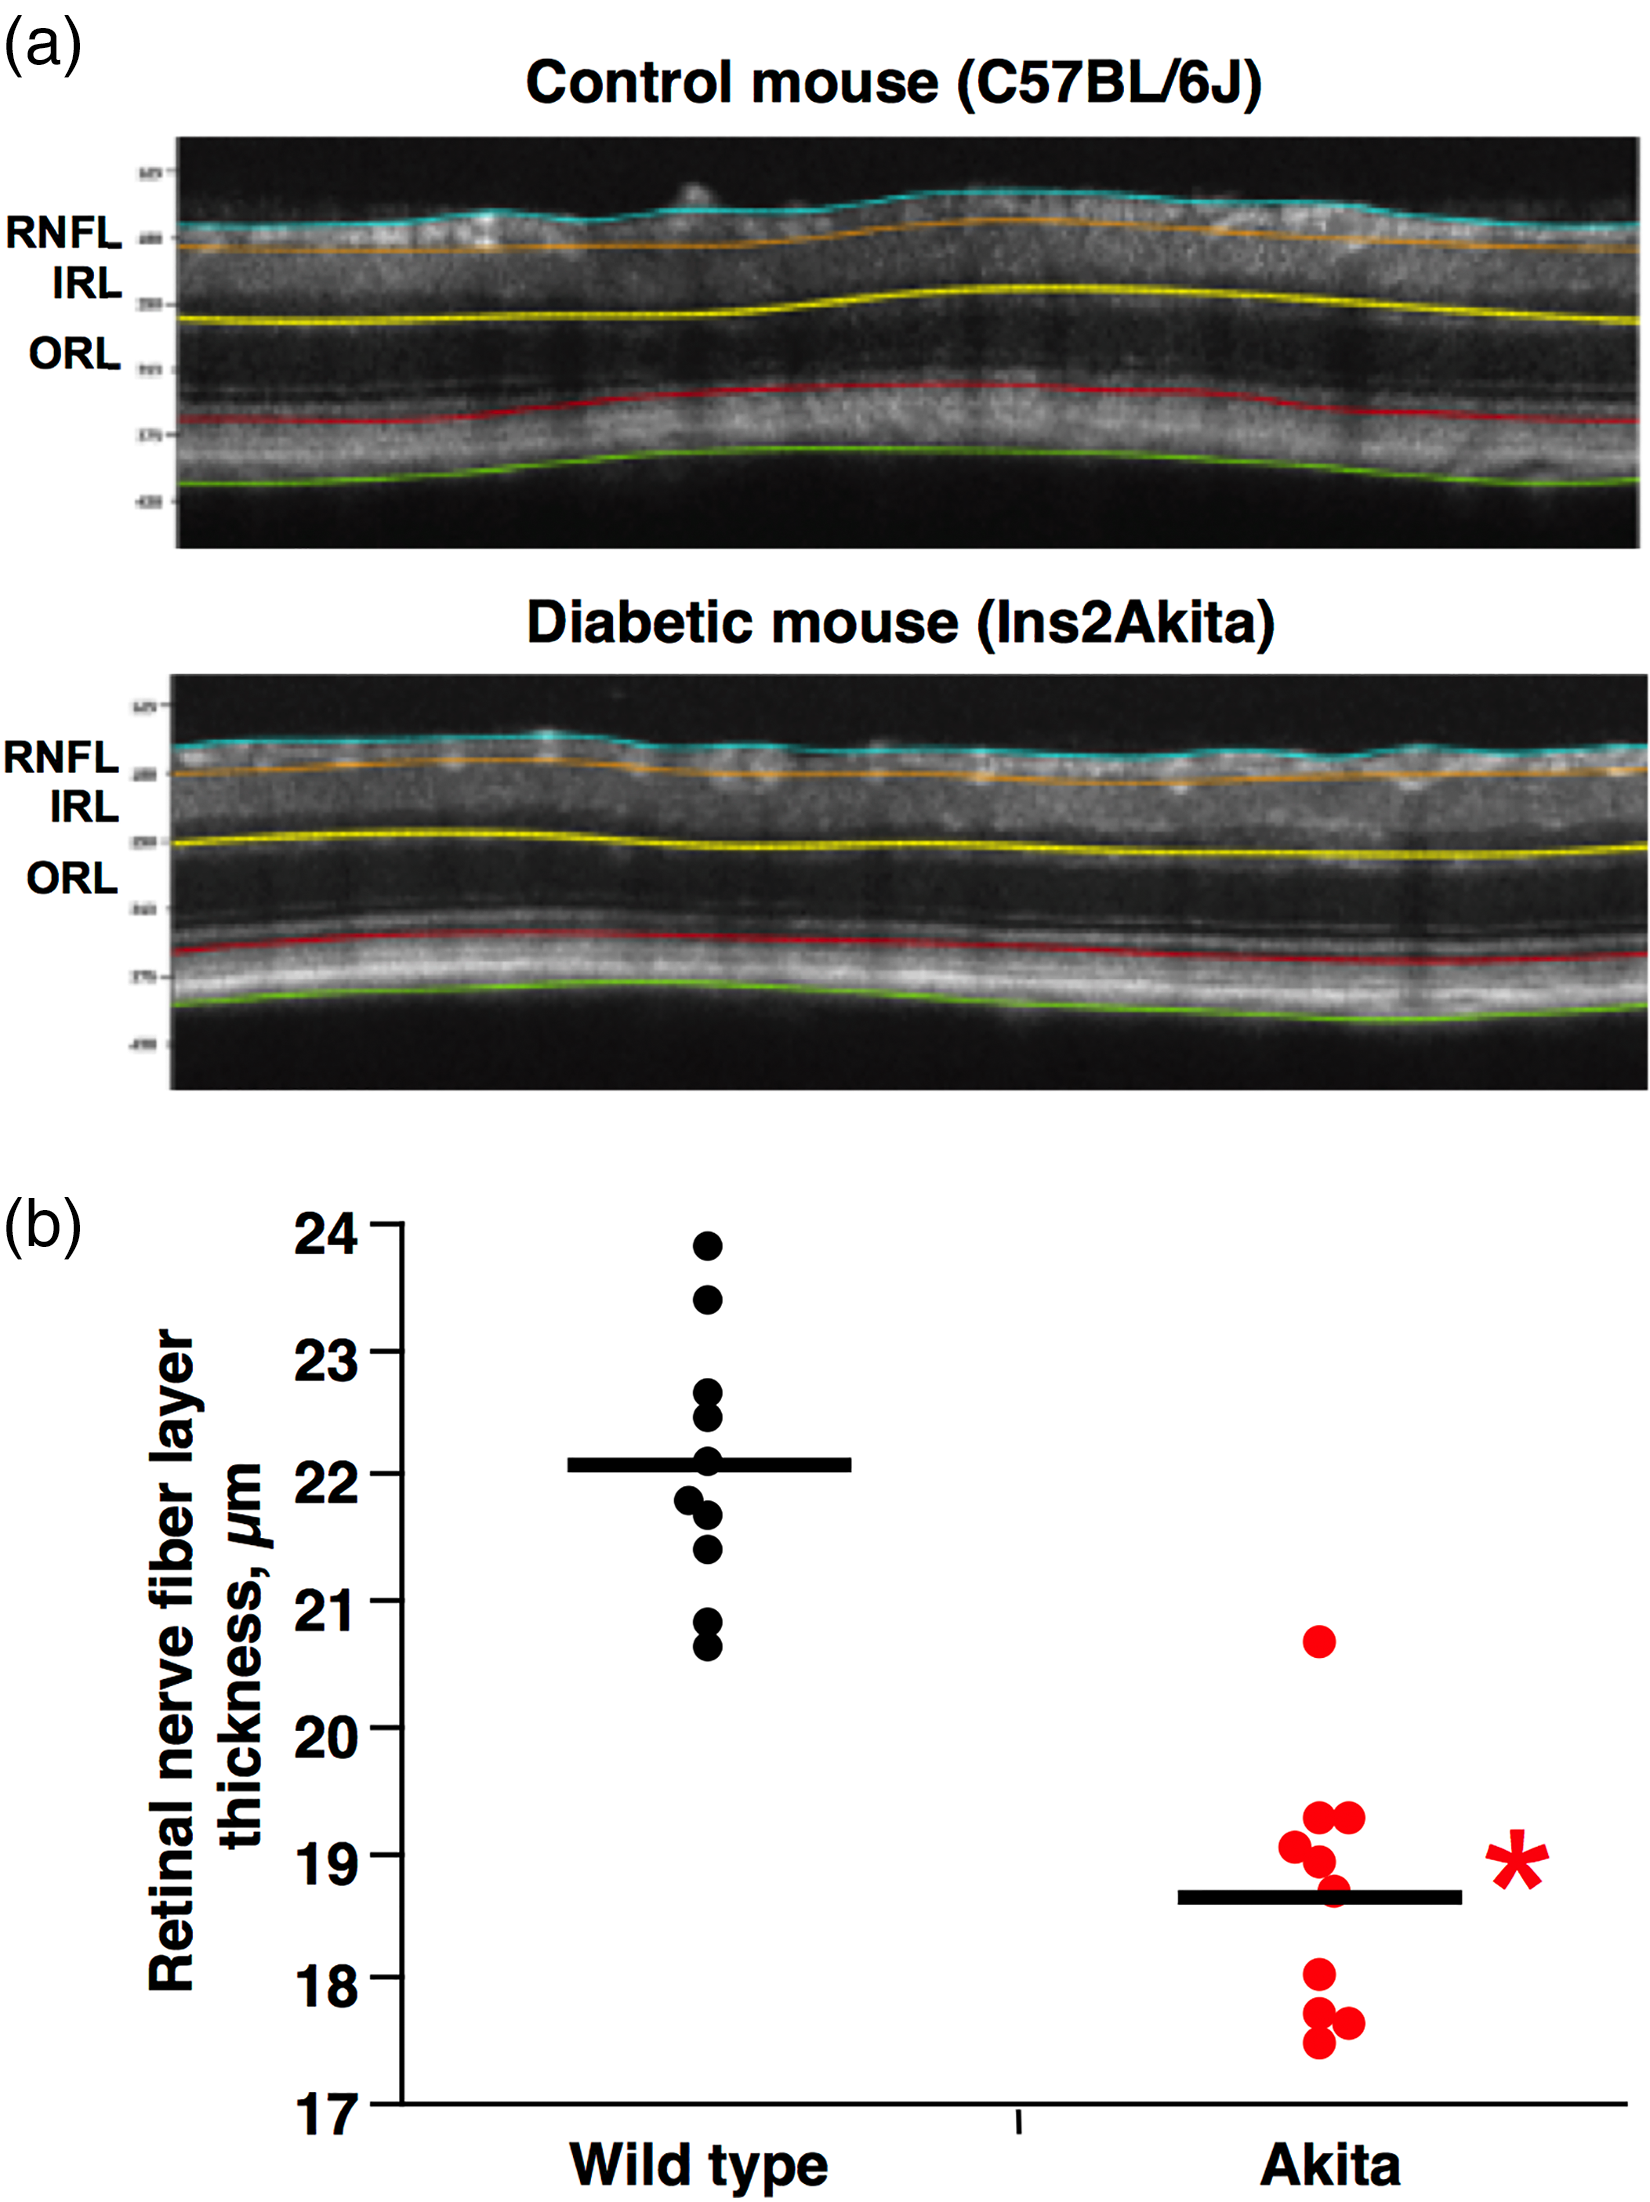
Reduced RNFL thickness in Ins2Akita mice. (a). OCT images of a control (C57BL/6J) and a diabetic (Ins2Akita) mouse. (b). At 16 weeks of age the thickness of RNFL, as measured by OCT, was significantly thinner in Ins2Akita mice than in age-matched controls. *p < 0.0001.
Diabetes + glaucoma study
The impact of diabetes on the glaucomatous retina was verified in DBA2J mice, 12 months of age, 18 weeks after the induction of diabetes. At this time, blood glucose level was significantly increased in alloxan-treated DBA2J mice (glaucoma + diabetes) when compared to untreated DBA2J (glaucoma alone) (567 ± 24.1 vs 167.6 ± 19.7 mg/dl, mean ± SE, p < 0.0001).
As shown in Figure 2(a) the nuclei of RGCs were detectable in the murine retina after specific Brn3a staining. The number of RGCs was therefore counted in the superior, inferior, nasal and temporal quadrants of the retina of DBA2J mice (glaucoma alone) and in alloxan-treated DBA2J mice (glaucoma + diabetes) (Figure 2(b)).
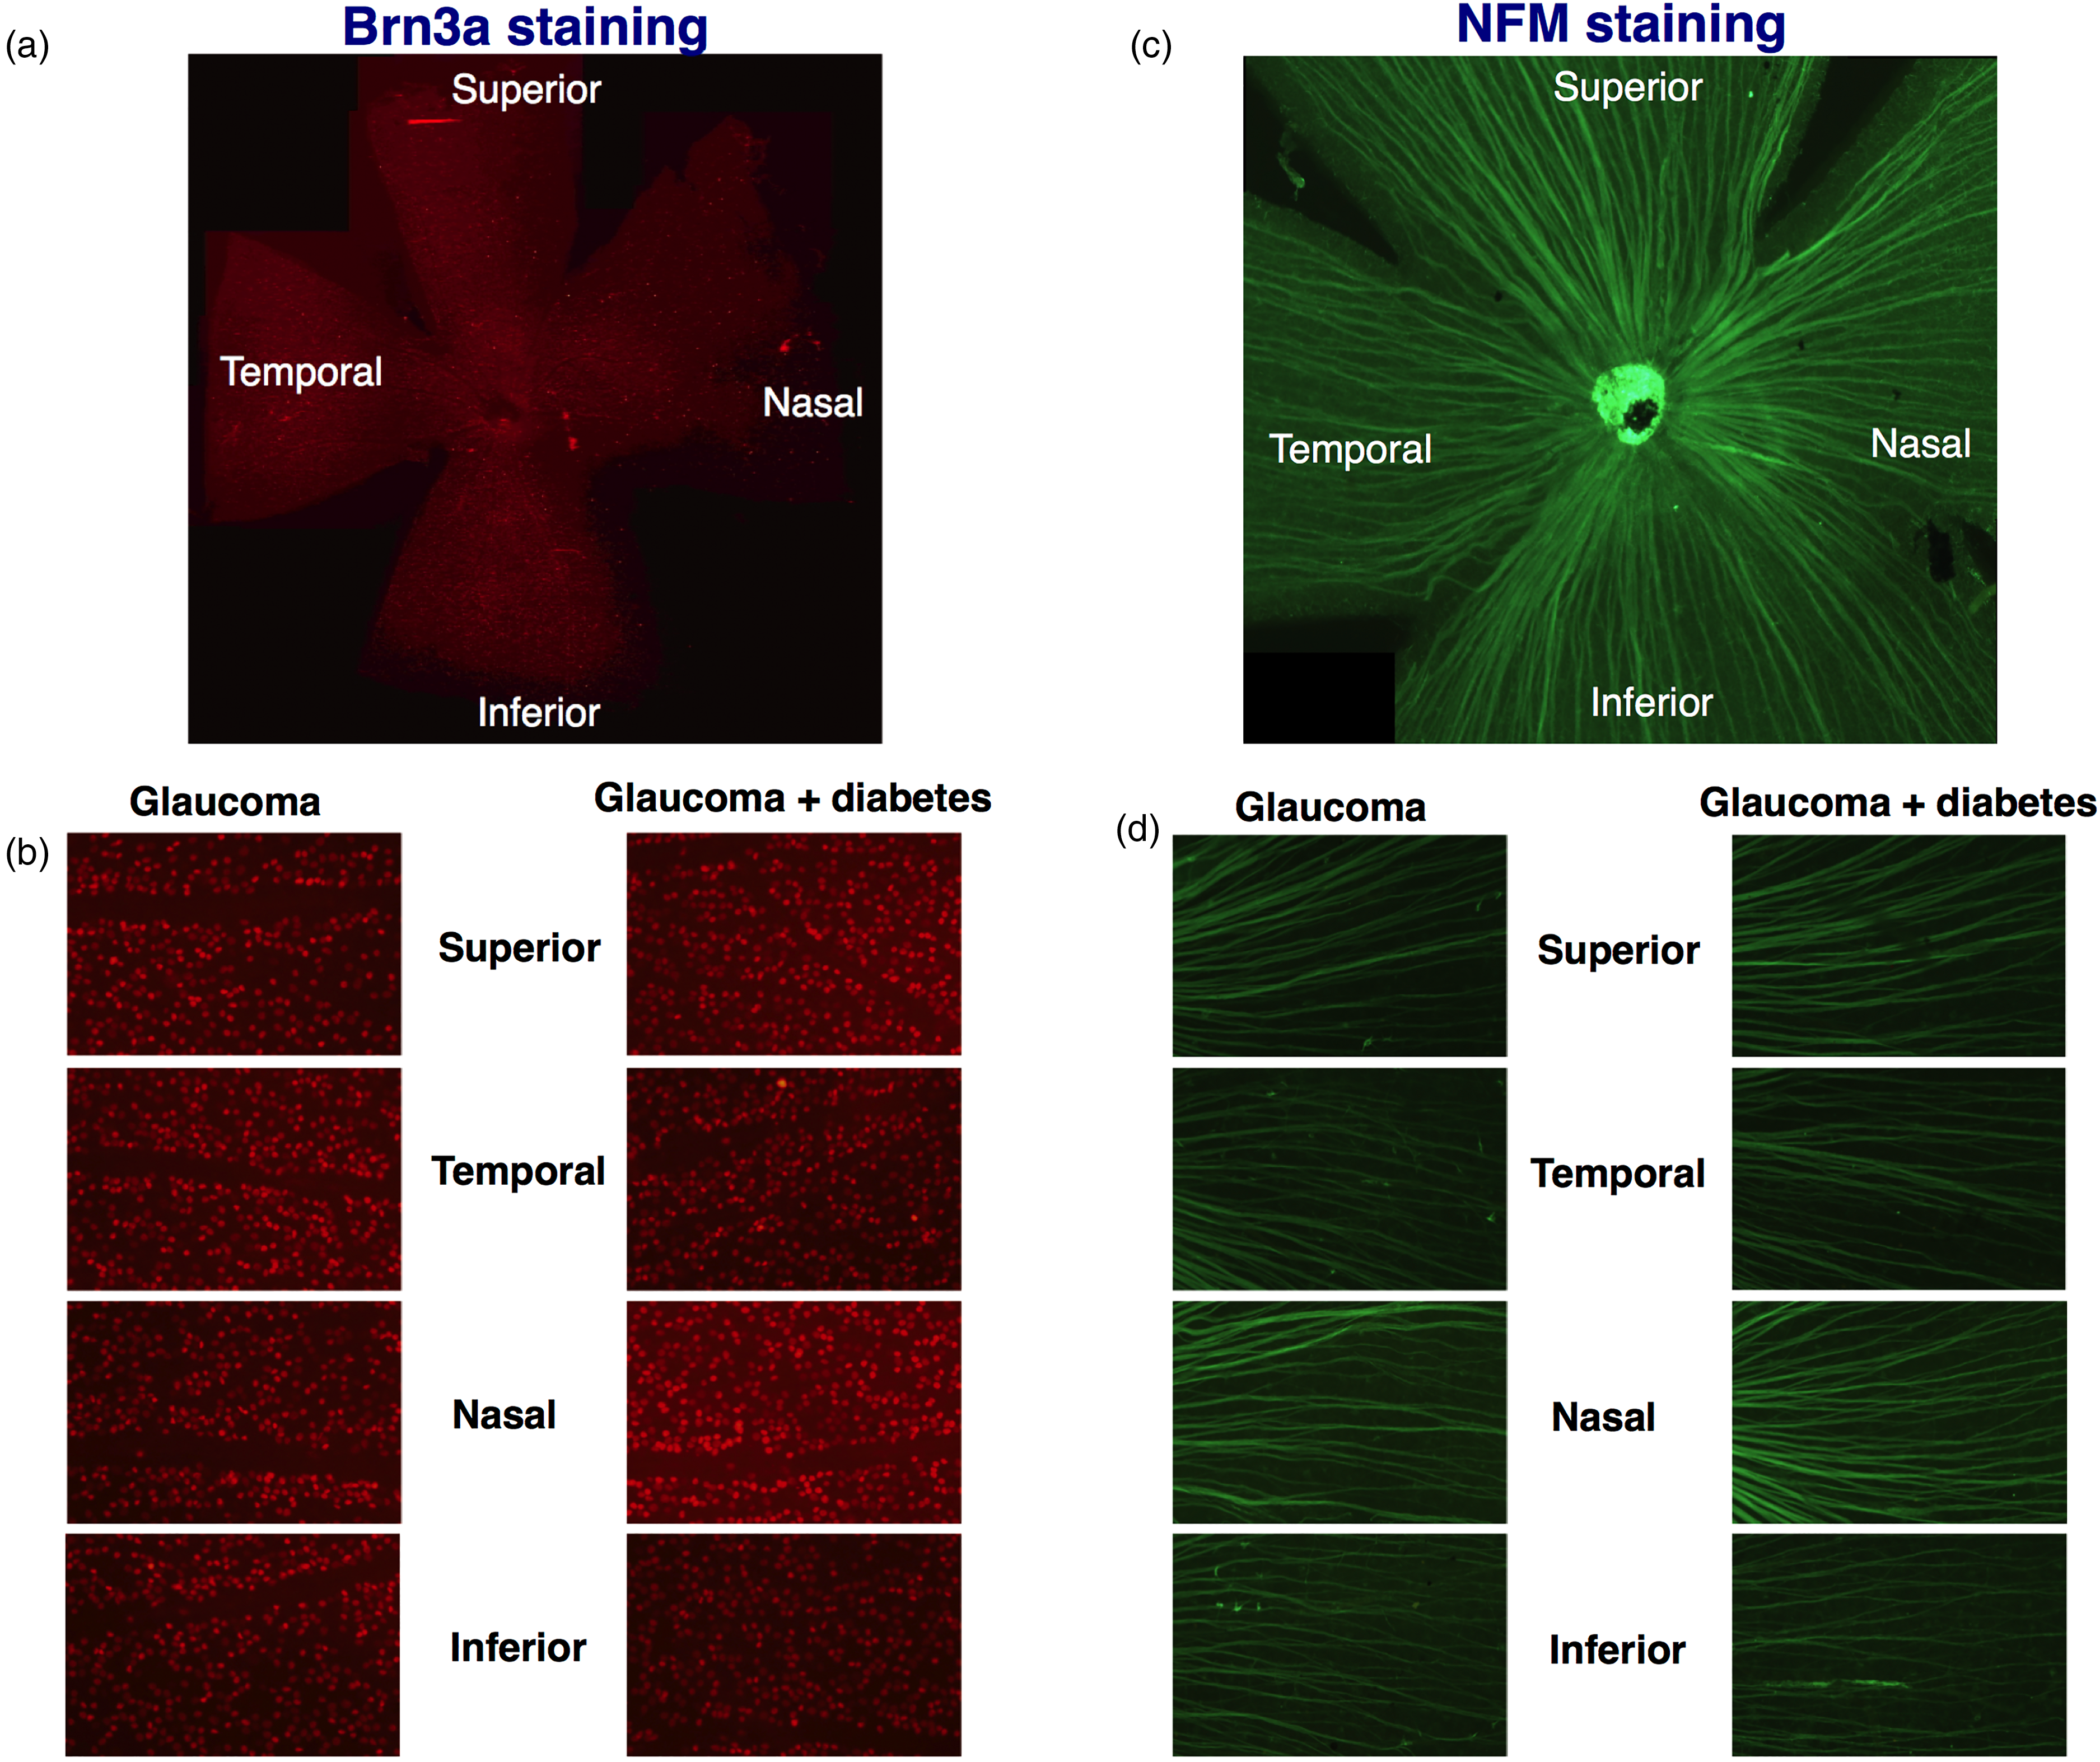
Immunofluorescences for Brn3a and NFM in retinas of mice with glaucoma and glaucoma + diabetes. (a). Immunofluorescence for Brn3a, the specific nuclear marker of retinal ganglion cells was performed on the entire retina (flat-mount of the retina of an animal with glaucoma). (b). Count of RGCs nuclei was performed in four retinal quadrants (superior, inferior, nasal and temporal) in four rectangular areas (dimensions 300 × 400 µm, distance from the head of the optic nerve: 600µm), one area for each retinal quadrant. (c). Immunofluorescence for NFM, the specific marker of neurofilaments was performed on the entire retina (flat-mount of the retina of an animal with glaucoma). (d). Quantification of the percentage of the retinal surface covered by RGC's neurofilaments was performed in four retinal quadrants (superior, inferior, nasal and temporal) in 4 rectangular areas (dimensions 300 × 400 µm, distance from the head of the optic nerve: 600µm), one area for each retinal quadrant.
As shown in Figure 2(c) neurofilaments were detectable in the murine retina after specific NFM staining. The percentage of retinal area covered by neurofilaments was therefore quantified in the superior, inferior, nasal and temporal quadrants of the retina of DBA2J mice (glaucoma alone) and in alloxan-treated DBA2J mice (glaucoma + diabetes) (Figure 2(d)).
As shown in Figure 3, the number of RGCs was similar in mice affected by glaucoma + diabetes when compared to mice with glaucoma alone in all the quadrants considered. Nasal: 38.8 ± 2.4 vs 34.9 ± 2.1 number of RGCs, mean ± SE, p = NS, as shown in Figure 3(b). Inferior: 41.1 ± 2.1 vs 35.5 ± 1.9, p = NS, as shown in Figure 3(c). Temporal: 38.9 ± 3.4 vs 33.7 ± 2.7, p = NS, as shown in Figure 3(d) with the exception of the superior quadrant (Figure 3(a)) where the number of RGCs was significantly increased in animals with glaucoma + diabetes (44.7 ± 2.3 vs 35.8 ± 2.0, p < 0.01).
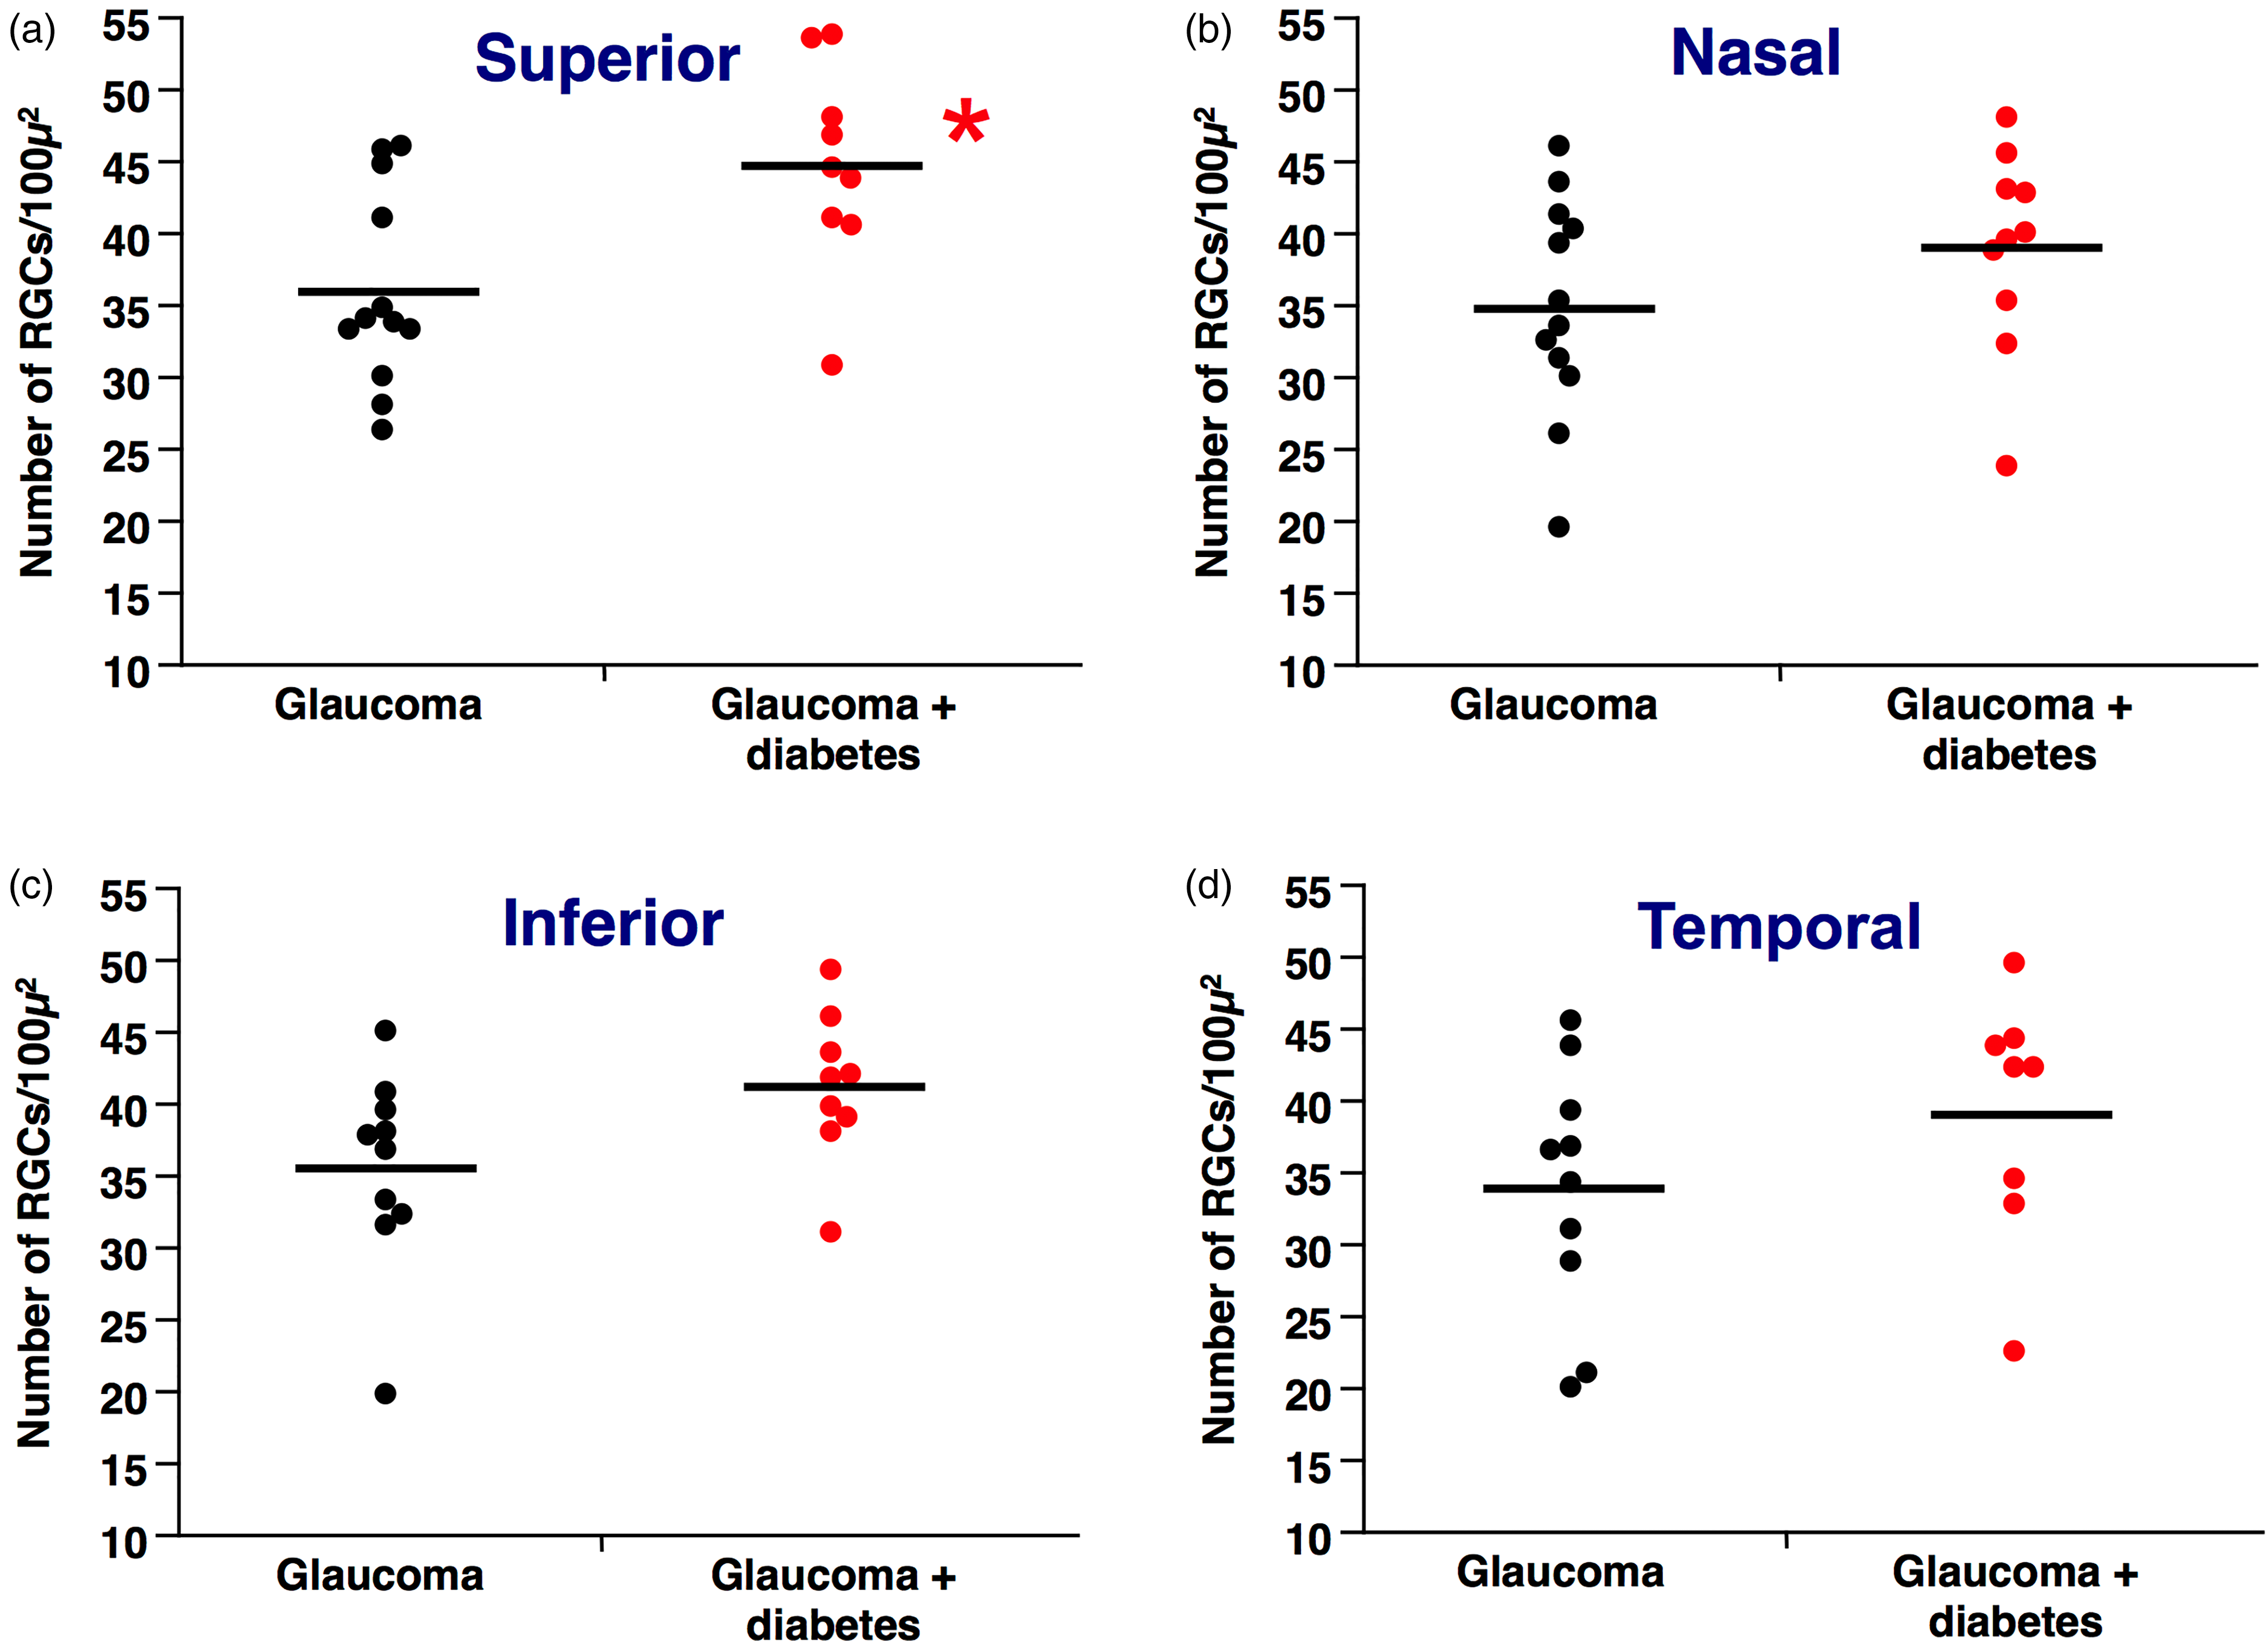
RGCs count in retinas of mice with glaucoma and glaucoma + diabetes after staining for the nuclear marker Brn3a. (a). The number of RGCs in the superior section of the retina is significantly increased in glaucoma + diabetes when compared to glaucoma alone. *p = 0.008. (b). The number of RGCs in the nasal section of the retina is similar between glaucoma + diabetes and glaucoma alone. (c). The number of RGCs in the inferior section of the retina is similar between glaucoma + diabetes and glaucoma alone. (d). The number of RGCs in the temporal section of the retina is similar between glaucoma + diabetes and glaucoma alone.
As shown in Figure 4, the percentage of retinal area covered by neurofilaments was similar in mice affected by glaucoma + diabetes when compared to mice with glaucoma alone in all the quadrants considered. Superior: 36.3 ± 3.6 vs 35.3 ± 3.8 percentage of area covered by neurofilaments, mean ± SE, p = NS, as shown in Figure 4(a). Nasal: 41.7 ± 4.3 vs 34.4 ± 4.6, p = NS, as shown in Figure 4(b). Inferior: 36.8 ± 3.7 vs 34.0 ± 3.9, p = NS, as shown in Figure 4(c). Temporal: 32.3 ± 4.2 vs 34.4 ± 4.4, p = NS, as shown in Figure 4(d), suggesting that diabetes did not give rise to an extra-toxic effect on neurofilaments when induced in an animal model of glaucoma.
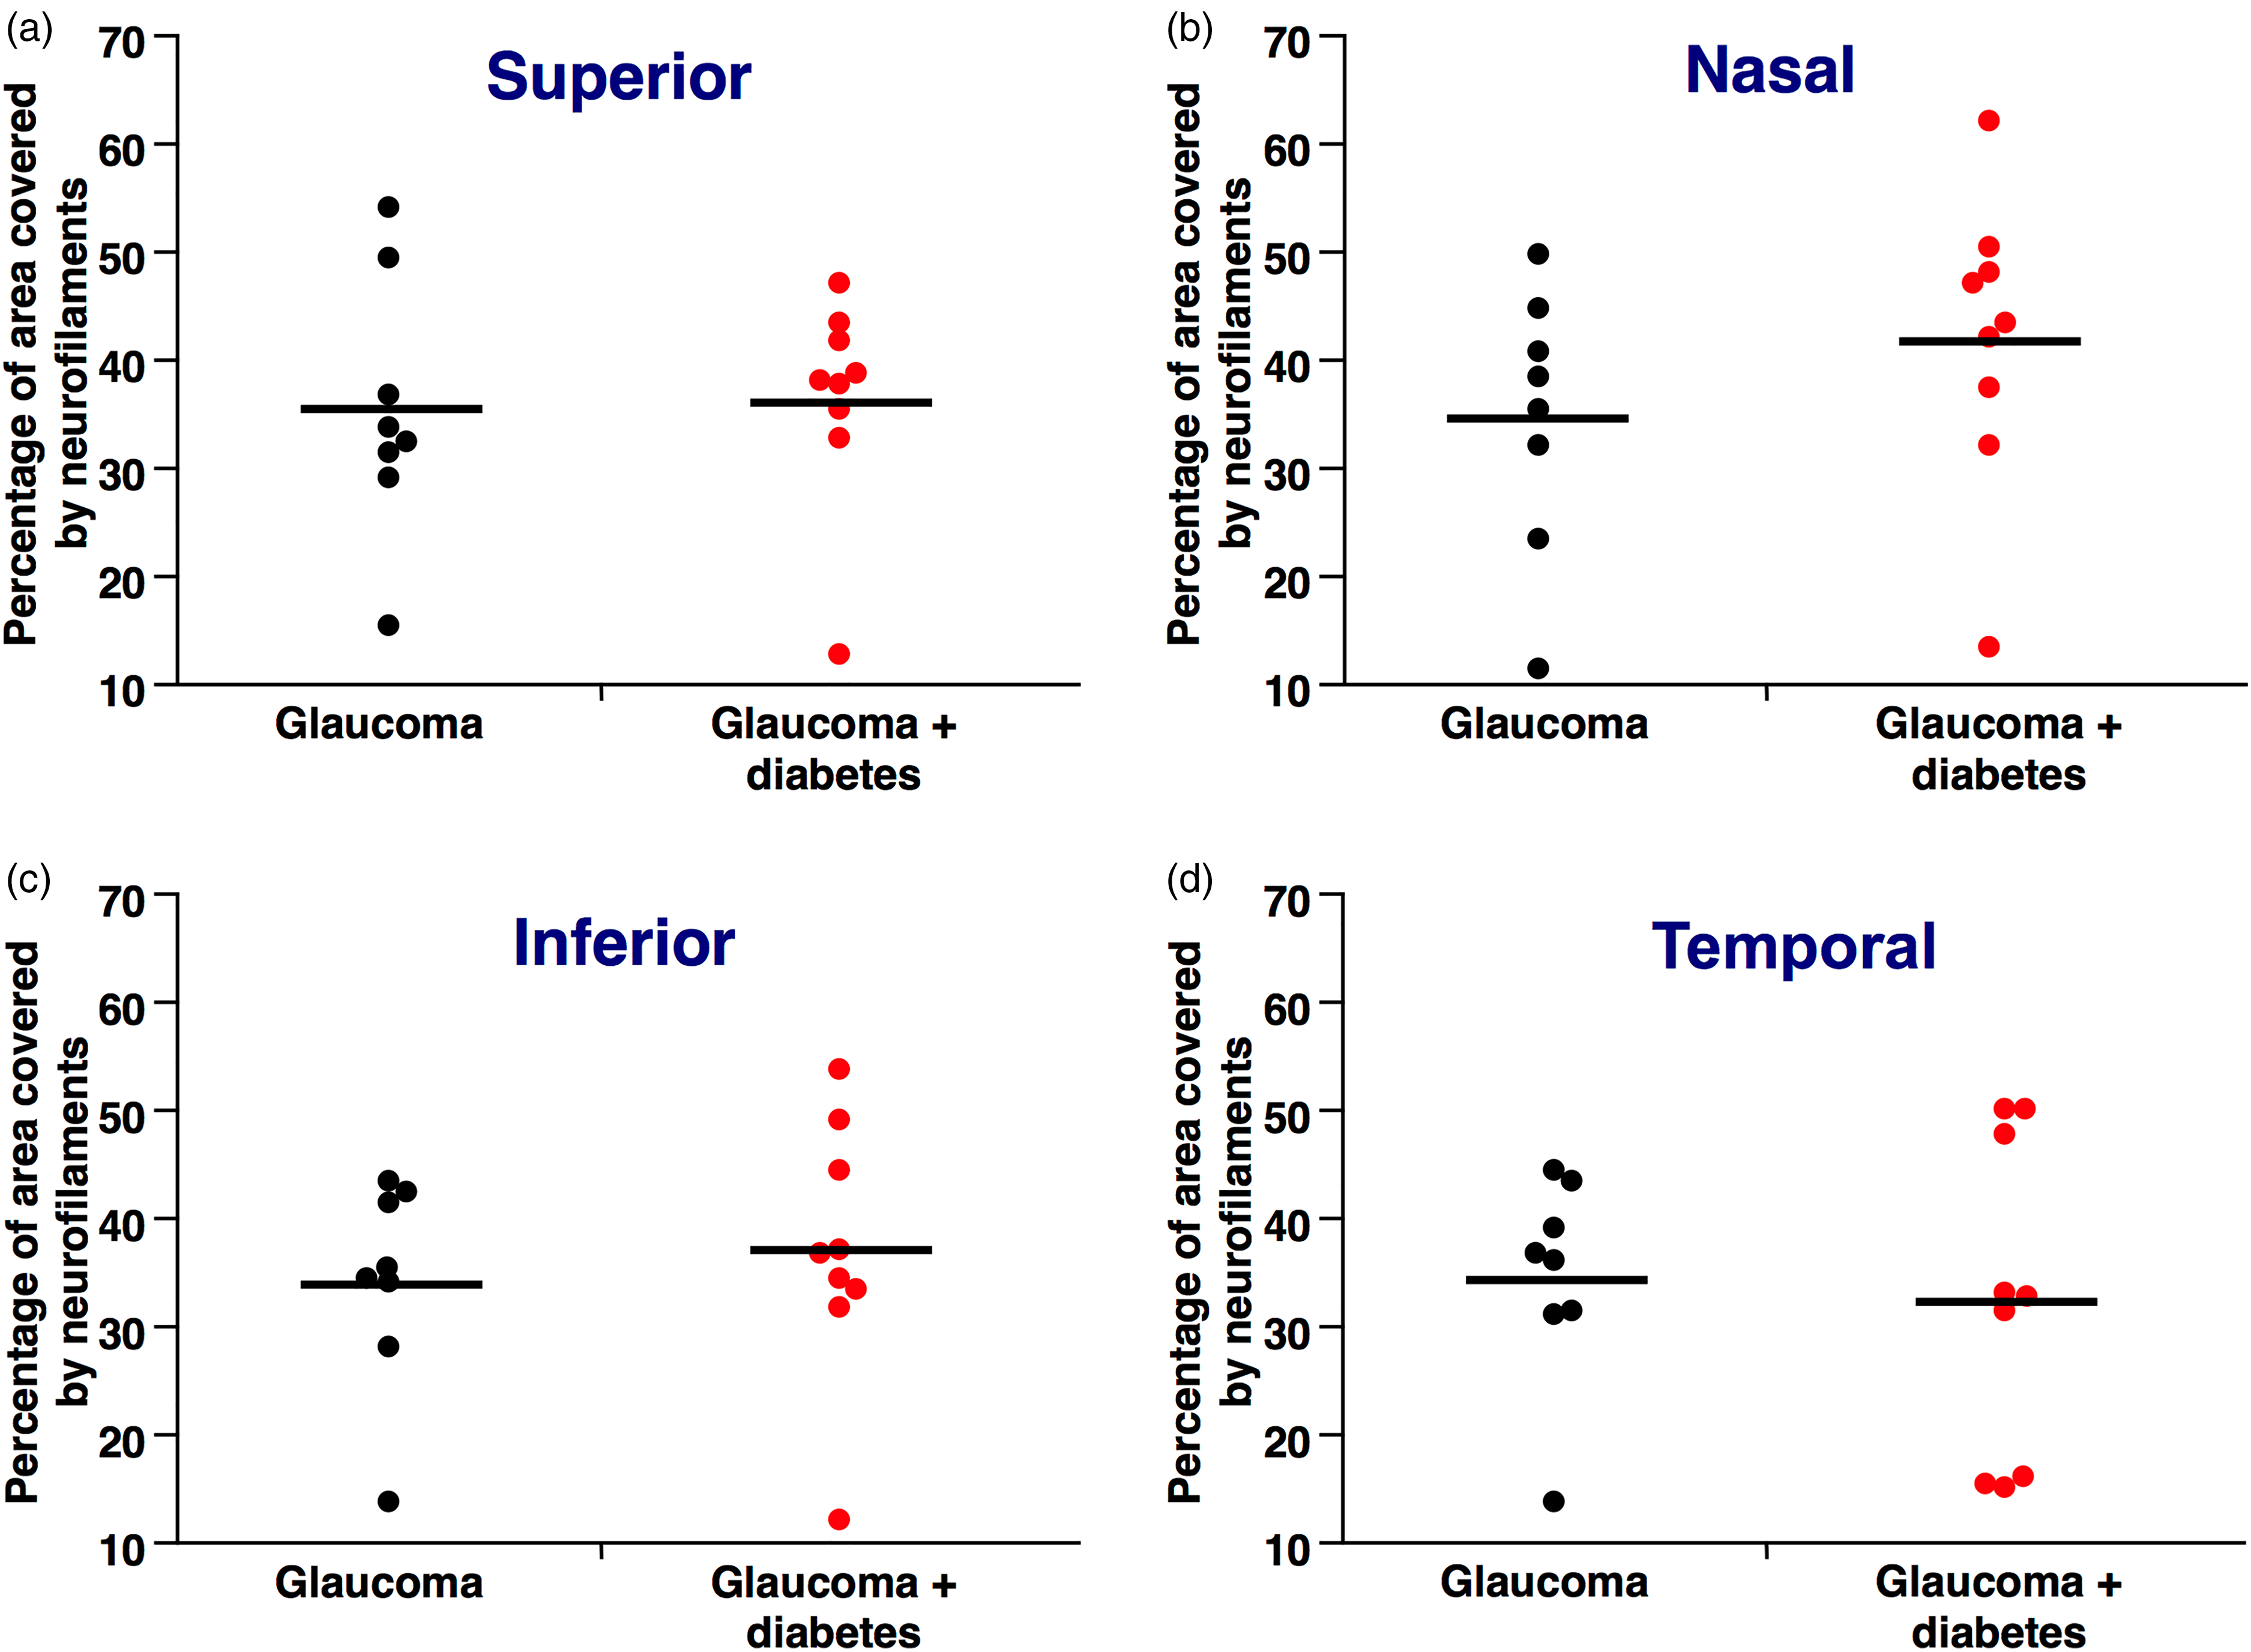
Quantification of the percentage of surface covered by neurofilaments (NFM) in retinas of mice with glaucoma and glaucoma + diabetes. (a). The percentage in the superior section of the retina is similar between glaucoma + diabetes and glaucoma alone. (b). The percentage in the nasal section of the retina is similar between glaucoma + diabetes and glaucoma alone. (c). The percentage in the inferior section of the retina is similar between glaucoma + diabetes and glaucoma alone. (d). The percentage in the temporal section of the retina is similar between glaucoma + diabetes and glaucoma alone.
Development of glaucoma was confirmed at the end of the experimental procedure by the measurement of IOP. IOP was significantly increased in glaucoma (DBA/2J) mice when compared to control (C57BL6J, n = 3, 1 year of age) mice (23.7 ± 0.8 vs 8.9 ± 0.9 mmHg, mean ± SE, p < 0.0001) and was also significantly increased in glaucoma + diabetes (DBA/2J) mice when compared to control (C57BL6J, n = 3, 1 year of age) mice (23.2 ± 0.9 vs 8.9 ± 0.9 mmHg, p < 0.0001). No difference of IOP (P = NS) could be demonstrated between glaucoma alone and glaucoma + diabetes mice.
Discussion
The results of this study confirm that diabetes (and hyperglycemia in particular) is in charge of the significant loss of RGCs (as shown by the thinning of RNFL) in Ins2Akita mice. When hyperglycemia (of similar degree as the one found in Ins2Akita mice) was instead induced by alloxan injection in an animal model of glaucoma, no impact on RGCs loss could be detected.
These results are of particular interest, the first one because shows that high ambient glucose can directly affect the viability of neurons (although in fact it is well known that diabetes on the long run may result in the development of peripheral neuropathy, 22 there are no reports concerning a similar glucotoxic effect on neuronal cells). The second result shows instead that the superimposition of diabetes on a mouse model of glaucoma does not have a further deleterious effect on the neuroretina and in fact, as described in Figure 3(b) to (d) there is no difference in RGCs number in the different quadrants of retinas coming from animals affected by glaucoma alone vs animals affected by glaucoma + diabetes. Actually, as shown in Figure 3(a), in the superior quadrant of the retina the number of RGCs in animals affected by glaucoma + diabetes significantly exceeds the same parameter when measured in animals affected by glaucoma alone. This finding might at first sight sound surprising but is in some way in line with part of the literature presently available suggesting that, even though diabetes by itself increases the risk to develop glaucoma5,6 it could, when present simultaneously with glaucoma, moderate in some way the tendency toward neurodegeneration.23,24
Similarly, as described in Figure 4(a) to (d) there is no difference in the percentage of surface covered by NFM in the different quadrants of retinas coming from animals affected by glaucoma alone vs animals affected by glaucoma + diabetes. Glaucoma is the well established “big killer” of RGCs1,2 and it is possible that the subset of RGCs that are “sensitive” to high glucose and therefore lost in case of diabetes, as seen in Figure 1, is also invariably lost also in case of glaucoma. In this case there would be no additive effect “glaucoma + diabetes” because the "glucose sensitive" subset of RGCs would be lost in case of diabetes alone, in case of glaucoma alone or in case of the simultaneous presence of both diseases.
DR is a quite different disease with respect to glaucoma, being a well known microvascular complication of diabetes characterized by a prolonged ischemic phase followed, fortunately only in a subset of cases, by a quite aggressive stage characterized by an incompetent neovascularization. 7 Despite great efforts aimed to find a medical treatment for the complication, so far only tight glycemic control during the initial phase of DR and laser photocoagulation (and/or intravitreal anti-vascular endothelial growth factor injections) in its final stage were shown to be effective in slowing down its progression.
Because of its pathogenesis: the onset of DR is preceded by a long silent phase and followed by a very low progression rate, DR should be prevented rather than treated once it has fully developed. Unfortunately there is presently no therapeutic approach that was shown to be effective on this regard. The demonstration that the silent phase that precedes the onset of the complication is, at least in some cases, 25 characterized by a neurodegenerative process, based on the loss of RGCs, 8 that is reasonably shared also by glaucoma1,2 raise the intriguing hypothesis that neuroprotective pharmacologic treatment(s) shown to be effective in case of glaucoma, 26 if applied in the early, subclinical neurodegenerative stage of DR could allow to stop the loss of RGCs.
In conclusion, our attempt to clarify the reciprocal interaction between DR and glaucoma ended up by showing that there is no additive effect of the two diseases on RGCs loss. Whether a similar pathogenic mechanism may cause RGCs loss in case of DR and glaucoma and, as a consequence, whether it can be prevented and/or treated by a similar pharmacologic approach remains to be verified by interventional studies.
Footnotes
Declaration of conflicting interests
The author(s) declared no potential conflicts of interest with respect to the research, authorship, and/or publication of this article.
Funding
The author(s) disclosed receipt of the following financial support for the research, authorship, and/or publication of this article: This research was funded by an unrestricted grant (prot. 0153/S/2015/I) from the Italian Society of Ophthalmology (SOI) to L.P.