
Abstract
The association between dry eye disease (DED) and psychiatric conditions is a highly researched topic. This work reviews the literature on this relationship, examining the prevalence and correlations of depression and anxiety with dry eye signs and symptoms. A comprehensive literature search of MEDLINE, EMBASE, PsycINFO, and gray literature was conducted, with keywords for dry eye and mood disorders, depression, anxiety, and suicide. Eligible studies underwent quality assessment using the Newcastle-Ottawa Scale. Meta-analysis was performed using STATA 15.0. Fixed- and random-effects models were computed based on the presence of heterogeneity. Thirty-two studies were included, with 31 reporting on depression and 19 on anxiety. Meta-analysis results found a depression prevalence of 40% (CI: [0.29, 0.52]) in DED patients, with 1.81 times higher odds of prevalence compared to controls (CI: [1.61, 2.02]). Prevalence of anxiety was 39% (CI: [0.15, 0.64]), with 2.32 times higher odds of prevalence compared to controls (CI: [1.67, 3.23]). Depression scores were significantly higher in patients with DED in all studies. Anxiety scores were significantly higher in DED patients in studies using all scales except the Hospital Anxiety and Depression Scale-Anxiety Subscale. DED symptom scores were significantly associated with depression (ES = 0.43; CI: [0.31, 0.55]) and anxiety (ES = 0.41; CI: [0.32, 0.50]) scores. In conclusion, depression and anxiety are more prevalent and severe in DED patients and are correlated with dry eye symptoms but not signs. These findings highlight the interrelationship between these disorders and have important implications for providing appropriate care to these patients.
Introduction
Dry eye disease (DED) is one of the most prevalent ocular diseases worldwide. It is defined by The Tear Film & Ocular Surface Society Dry Eye Workshop II (TFOS DEWS II) as “a multifactorial disease of the ocular surface characterized by a loss of homeostasis of the tear film, and accompanied by ocular symptoms, in which tear film instability and hyperosmolarity, ocular surface inflammation and damage, and neurosensory abnormalities play etiological roles”. 1 Individuals with DED may experience symptoms such as foreign-body sensation, ocular dryness, itching, and burning which can lead to ocular discomfort, visual disturbances, and even fatigue. These symptoms profoundly impact patients’ daily functioning.2,3 Although therapies are available for DED, symptoms may persist or even worsen, greatly impacting individuals’ mental health and quality of life.4,5
Many studies have examined the relationship between DED and psychological conditions, most often focusing on depression and anxiety. Previous research has reported a greater prevalence of depression and anxiety among DED patients compared to healthy controls.6–8 The literature also reflects the reverse relationship, with depression as a risk factor for DED.9,10 Furthermore, there is evidence that patients’ psychological state affects their perception of DED symptoms, resulting in poor correlation between DED signs and symptoms.11–13 This interrelationship may have important implications for the diagnosis and treatment of DED, as well as for the treatment of depression and anxiety. The present research seeks to provide a comprehensive review of the current literature to further characterize the association of DED with depression and anxiety. It presents the prevalence and severity of these disorders in DED, analyzes the degree to which depression and anxiety correlate with DED symptoms and signs, and discusses the bidirectionality of this relationship.
Methods
Inclusion and exclusion criteria
In this review, we included English language studies that analyzed the association of DED with depression and/or anxiety. The review included studies that consider psychological symptoms in patients with DED, as well as DED symptoms in patients with depression or anxiety. Studies reporting on the association of depression and/or anxiety with objective and subjective measures of DED were also included. Studies of Sjogren's patients that made no specific mention of DED were excluded. Studies in which DED and psychological symptoms were evaluated only in the context of an additional variable, such as another medical condition, were also excluded. Review articles and case reports were also excluded. Economic studies, comparative studies, observational studies, cohort studies, case series, randomized control trials, clinical trials, and multi-center studies were included. Studies on human subjects aged 18 years and older with mild to severe DED were included.
Search strategy
The Ovid platform was used to conduct a comprehensive literature search of MEDLINE, EMBASE, and PsycINFO. A gray literature search was performed using the annual meeting databases of the Canadian Ophthalmological Society, the Association for Research in Vision and Ophthalmology, and the European Society of Ophthalmology. These searches included keywords for DED and mood disorders, depression, anxiety, and suicide. The search strategy was modified to complement the specific database and platform. The full search strategy is presented in Supplementary Appendix 1. The search was limited to publications after May 5, 2015, and the final search was conducted on June 17, 2019. The review was limited to studies published after May 5, 2015, to prevent overlap with a previously conducted review. 8 Studies were limited to those including human subjects and published in English. No limitations were placed on the study location or design to ensure the comprehensiveness of the search. In this research, we adhered to the Preferred Items for Systematic Reviews and Meta-Analyses (PRISMA) guidelines.
Screening
Duplicated articles were removed before screening using the Ovid platform. Screening was performed by two independent reviewers. Level 1 screening included title and abstract screening. Potentially eligible studies continued to level 2 screening and full-text articles were retrieved. Cohen's kappa was 0.60 for level 1 screening and 0.81 for level 2 screening. All discrepancies between reviewers were resolved by discussion to determine the final set of eligible studies.
Quality assessment
The Newcastle-Ottawa Scale was used to assess the quality of included studies with full-text articles available by one author independently. 14 This scale consists of eight assessment criteria, with a maximum score of 9 points for case control studies. A maximum of 3 points was possible for all other types of studies, as some criteria were only applicable to case control studies. Studies for which only an abstract was available were not assessed using the Newcastle-Ottawa Scale and were assumed to be of low quality. Refer to Supplementary Appendix 2 for further details.
Data extraction
Data were extracted from included studies using a standardized form by one author independently. Recorded data included author, year of publication, study country and design, population characteristics including sample size, age, and percentage of female participants, number of events in sample(s), DED symptom scale and scores, DED sign scores (tear break-up time (TBUT), Schirmer I Test, and Corneal Fluorescein Staining (CFS)), depression and/or anxiety scale and scores, correlation between depression and/or anxiety score and DED symptom severity, and correlation between depression and/or anxiety score and DED signs, as available.
Data synthesis
Data on depression and anxiety were separately tabulated. Study results were grouped according to the following outcomes: prevalence of depression in DED and control patients, prevalence of anxiety in DED and control patients, depression scale scores in DED and control patients, anxiety scale scores in DED and control patients, correlations between depression and DED symptom severity and signs, correlations between anxiety and DED symptom severity and DED signs.
Statistical analysis
Meta-analysis was performed using STATA v. 15.0 (STATA Corporation, College Station, TX, USA). The main outcomes of interest were the adjusted hazard ratio (HR), odds ratio (OR), and prevalence. For categorical, dichotomous, or binary outcomes, the OR was calculated as the treatment effect or effect size.
For continuous outcomes, the prevalence and standardized mean difference (SMD) were calculated as the effect size since it is a mean difference standardized across all studies. To compute SMD for each study, the difference between the mean values for each outcome measure (i.e. depression score and anxiety score) was divided by the SD for that same outcome measure. Weights were assigned to each SMD according to the inverse of its variance and then the average was computed.
For correlation outcomes, the correlation coefficient was calculated as the effect size. Effect size such as OR, SMD, or correlation coefficient for each study was then aggregated using the fixed or random-effect model based on the presence of heterogeneity to estimate the summary effect.
To test heterogeneity, I2 statistics, Z-value, and χ2 statistics were computed. An I2 value of less than 50% implies low heterogeneity, and in these cases, a fixed-effect model was used. An I2 statistic of 50% or more represents high heterogeneity, and in these cases, a random-effects model was calculated. Additionally, a high Z-value, a low p-value (<0.01), and a large χ2 value imply significant heterogeneity and therefore, a random-effect model using DerSimonian and Laird methods was computed. Forest plots were also generated for each case. Funnel plots were generated to check publication bias. Causes of heterogeneity were also explored.
Results
Study selection results
The process of study selection is presented in the PRISMA diagram in Figure 1. The search of all databases on Ovid yielded 186 results, with 119 from EMBASE, 61 from MEDLINE, and 6 from PsycINFO. An additional five results were found through a gray literature search. After duplicates were removed, 120 studies remained. Seventy-three studies were excluded through level 1 title and abstract screening: 37 did not have an association between DED and depression or anxiety as an outcome, 26 were review articles, case series, and a book chapter, and 10 had participants that did not have DED and depression or anxiety. We excluded an additional 15 articles through level 2 full-text screening, for reasons shown in Figure 1. In total, 32 studies were included in the review, consisting of 25 articles and 7 abstracts.15–46 Sixteen articles were included in the quantitative analysis.
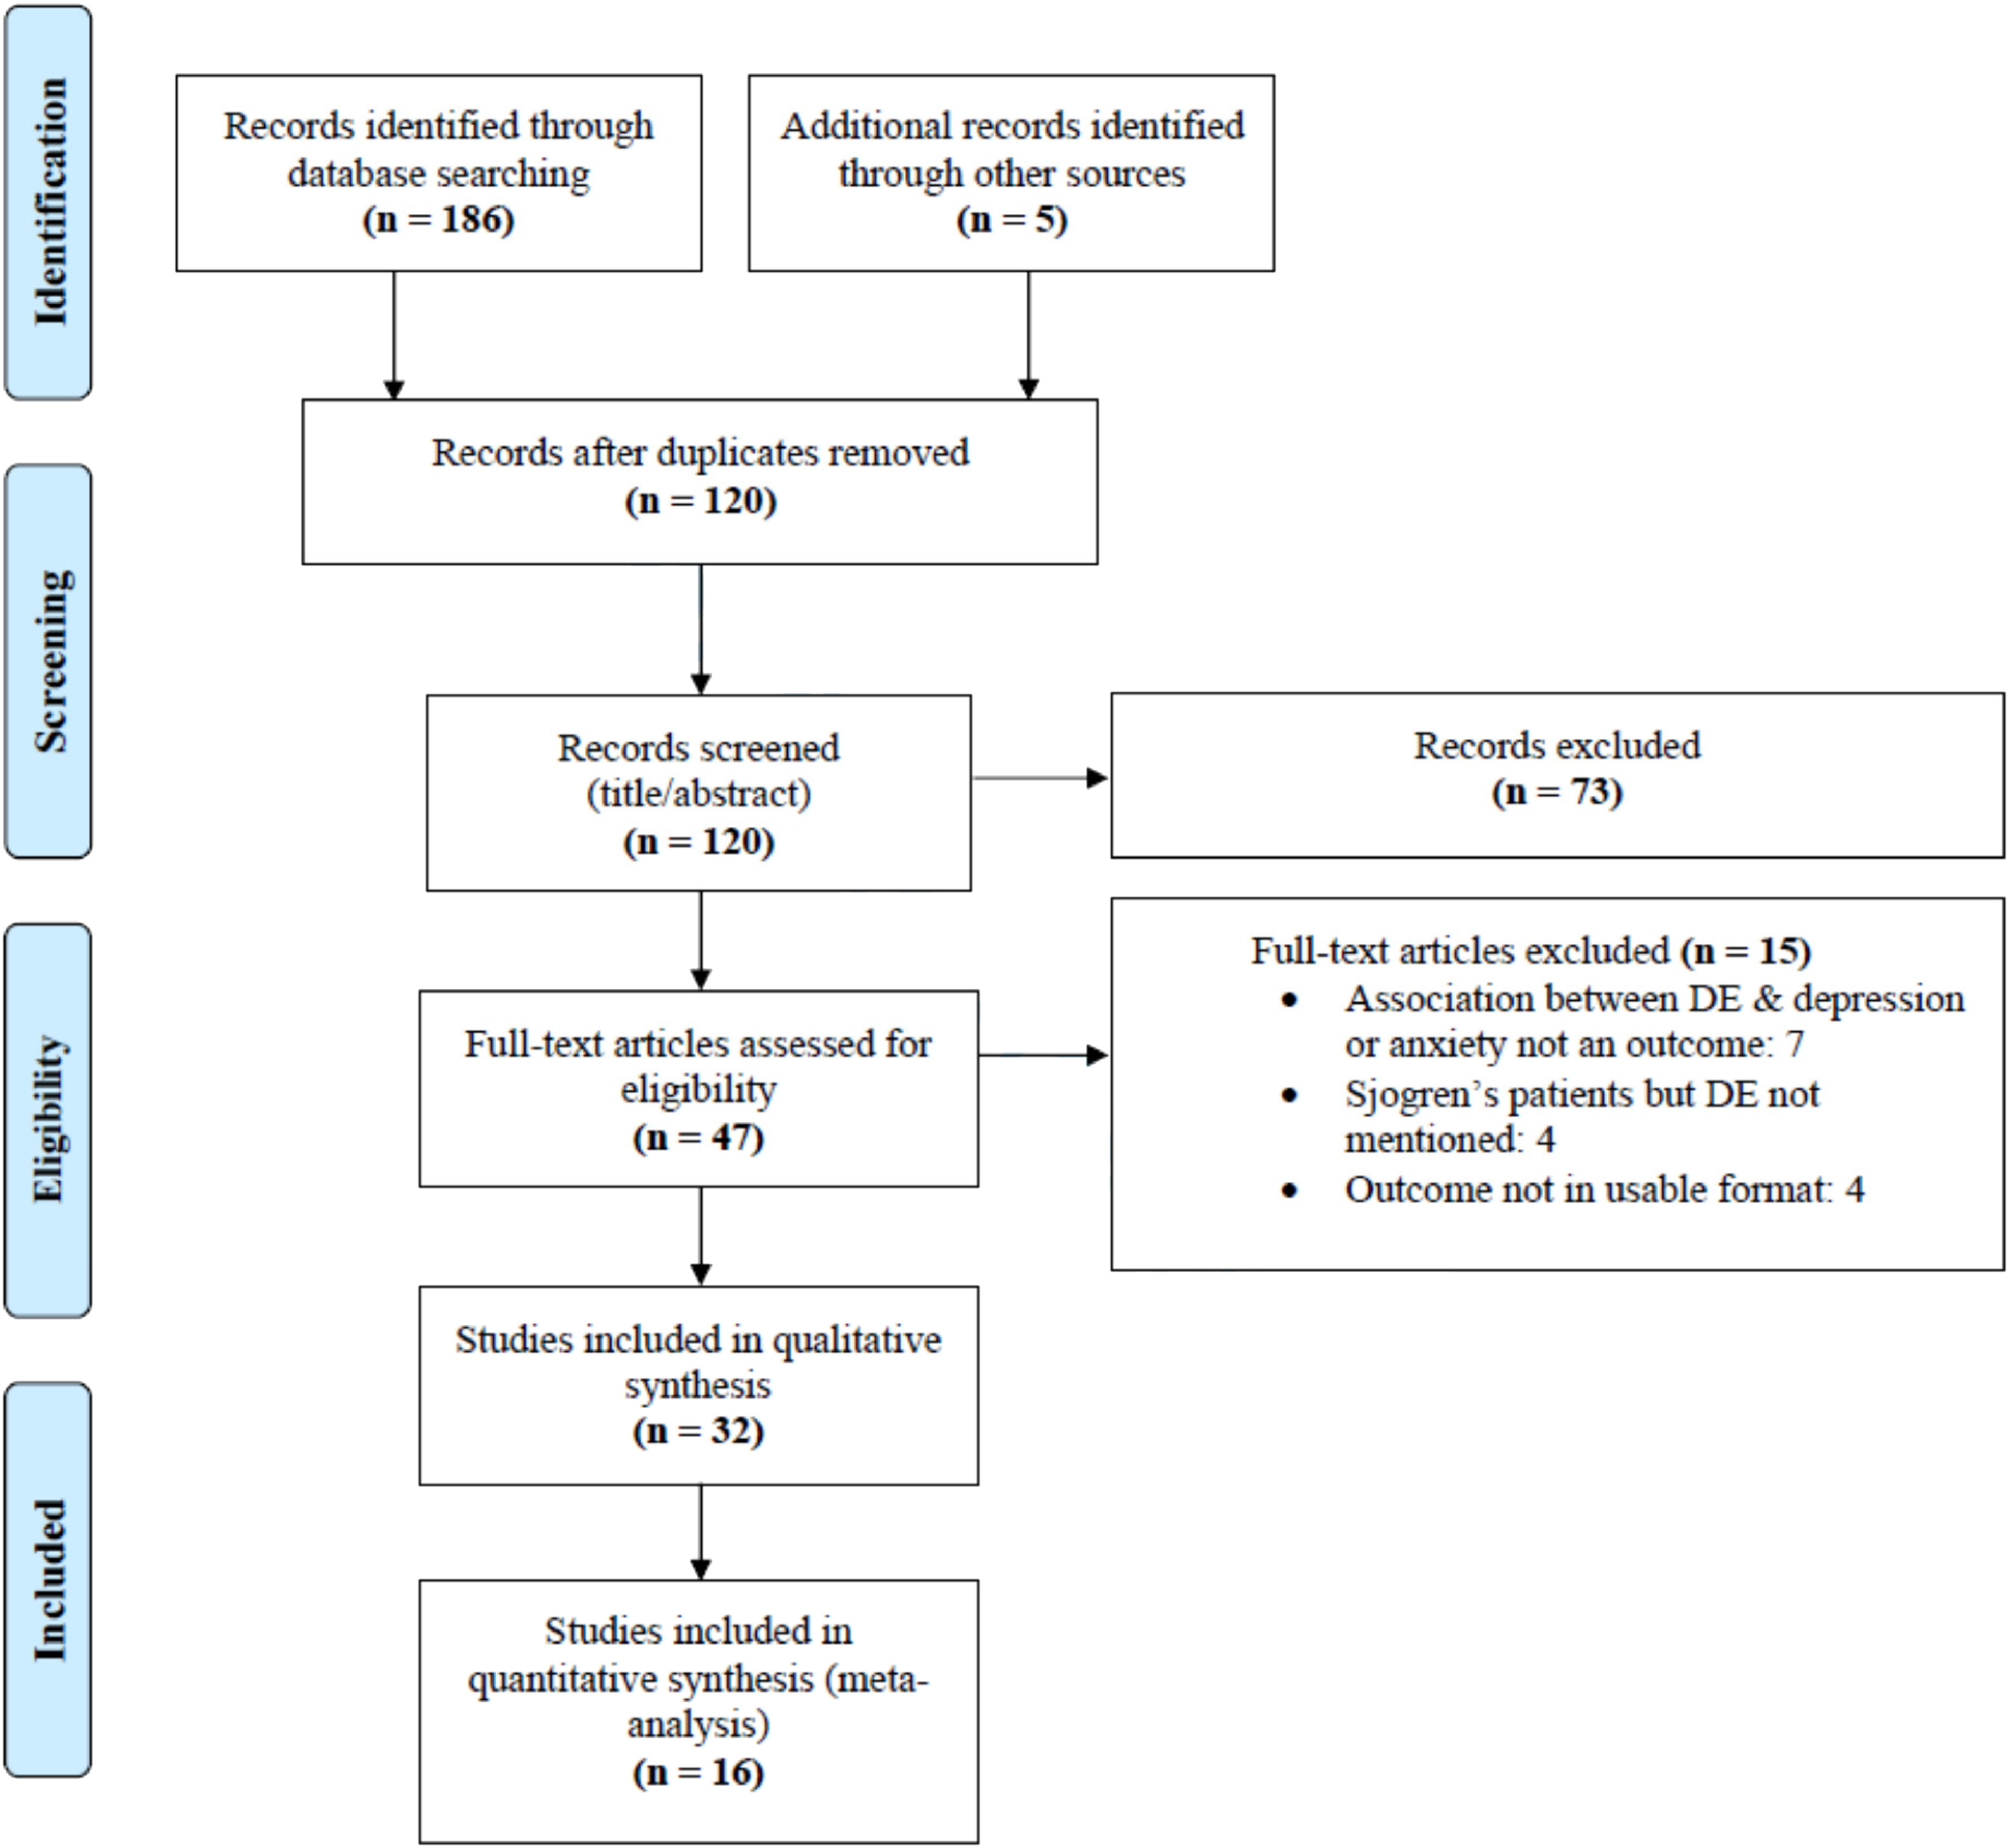
PRISMA diagram illustrating search strategy and study selection.
Study characteristics
The characteristics of the included studies are presented in Table 1. All studies were published between 2015 and 2019. Fourteen studies were conducted in Asia, 11 in North America, 6 in Europe, and 1 in Africa. Fifteen studies were cross-sectional, 12 were case-control, and 5 were longitudinal. A number of depression and anxiety measures were used in the studies. Most studies used self-report questionnaires, with the Patient Health Questionnaire (PHQ-8/9) and the Hospital Anxiety and Depression Scale (HADS) being the most common. Three studies used a clinical diagnosis to determine depression status. Thirty-one of the included studies reported on depression and 19 reported on anxiety. Twelve studies reported on the prevalence of depression in DED, seven of which also reported on prevalence in a corresponding control group (Table 2). Seven studies reported on the prevalence of anxiety in DED, four of which also reported on prevalence in a corresponding control group (Table 2). Nine studies reported depression scale scores in DED and control patients and eight studies reported anxiety scale scores (Table 3). Nine studies reported on the correlation between depression and DED symptom severity (Table 3) and seven reported on the correlation between depression and DED signs (Table 4). Seven studies reported on the correlation between anxiety and DED symptom severity (Table 3) and six reported the correlation between anxiety and DED signs (Table 4). Two studies focused on DED in patients diagnosed with depression and/or anxiety.
Characteristics of included studies.
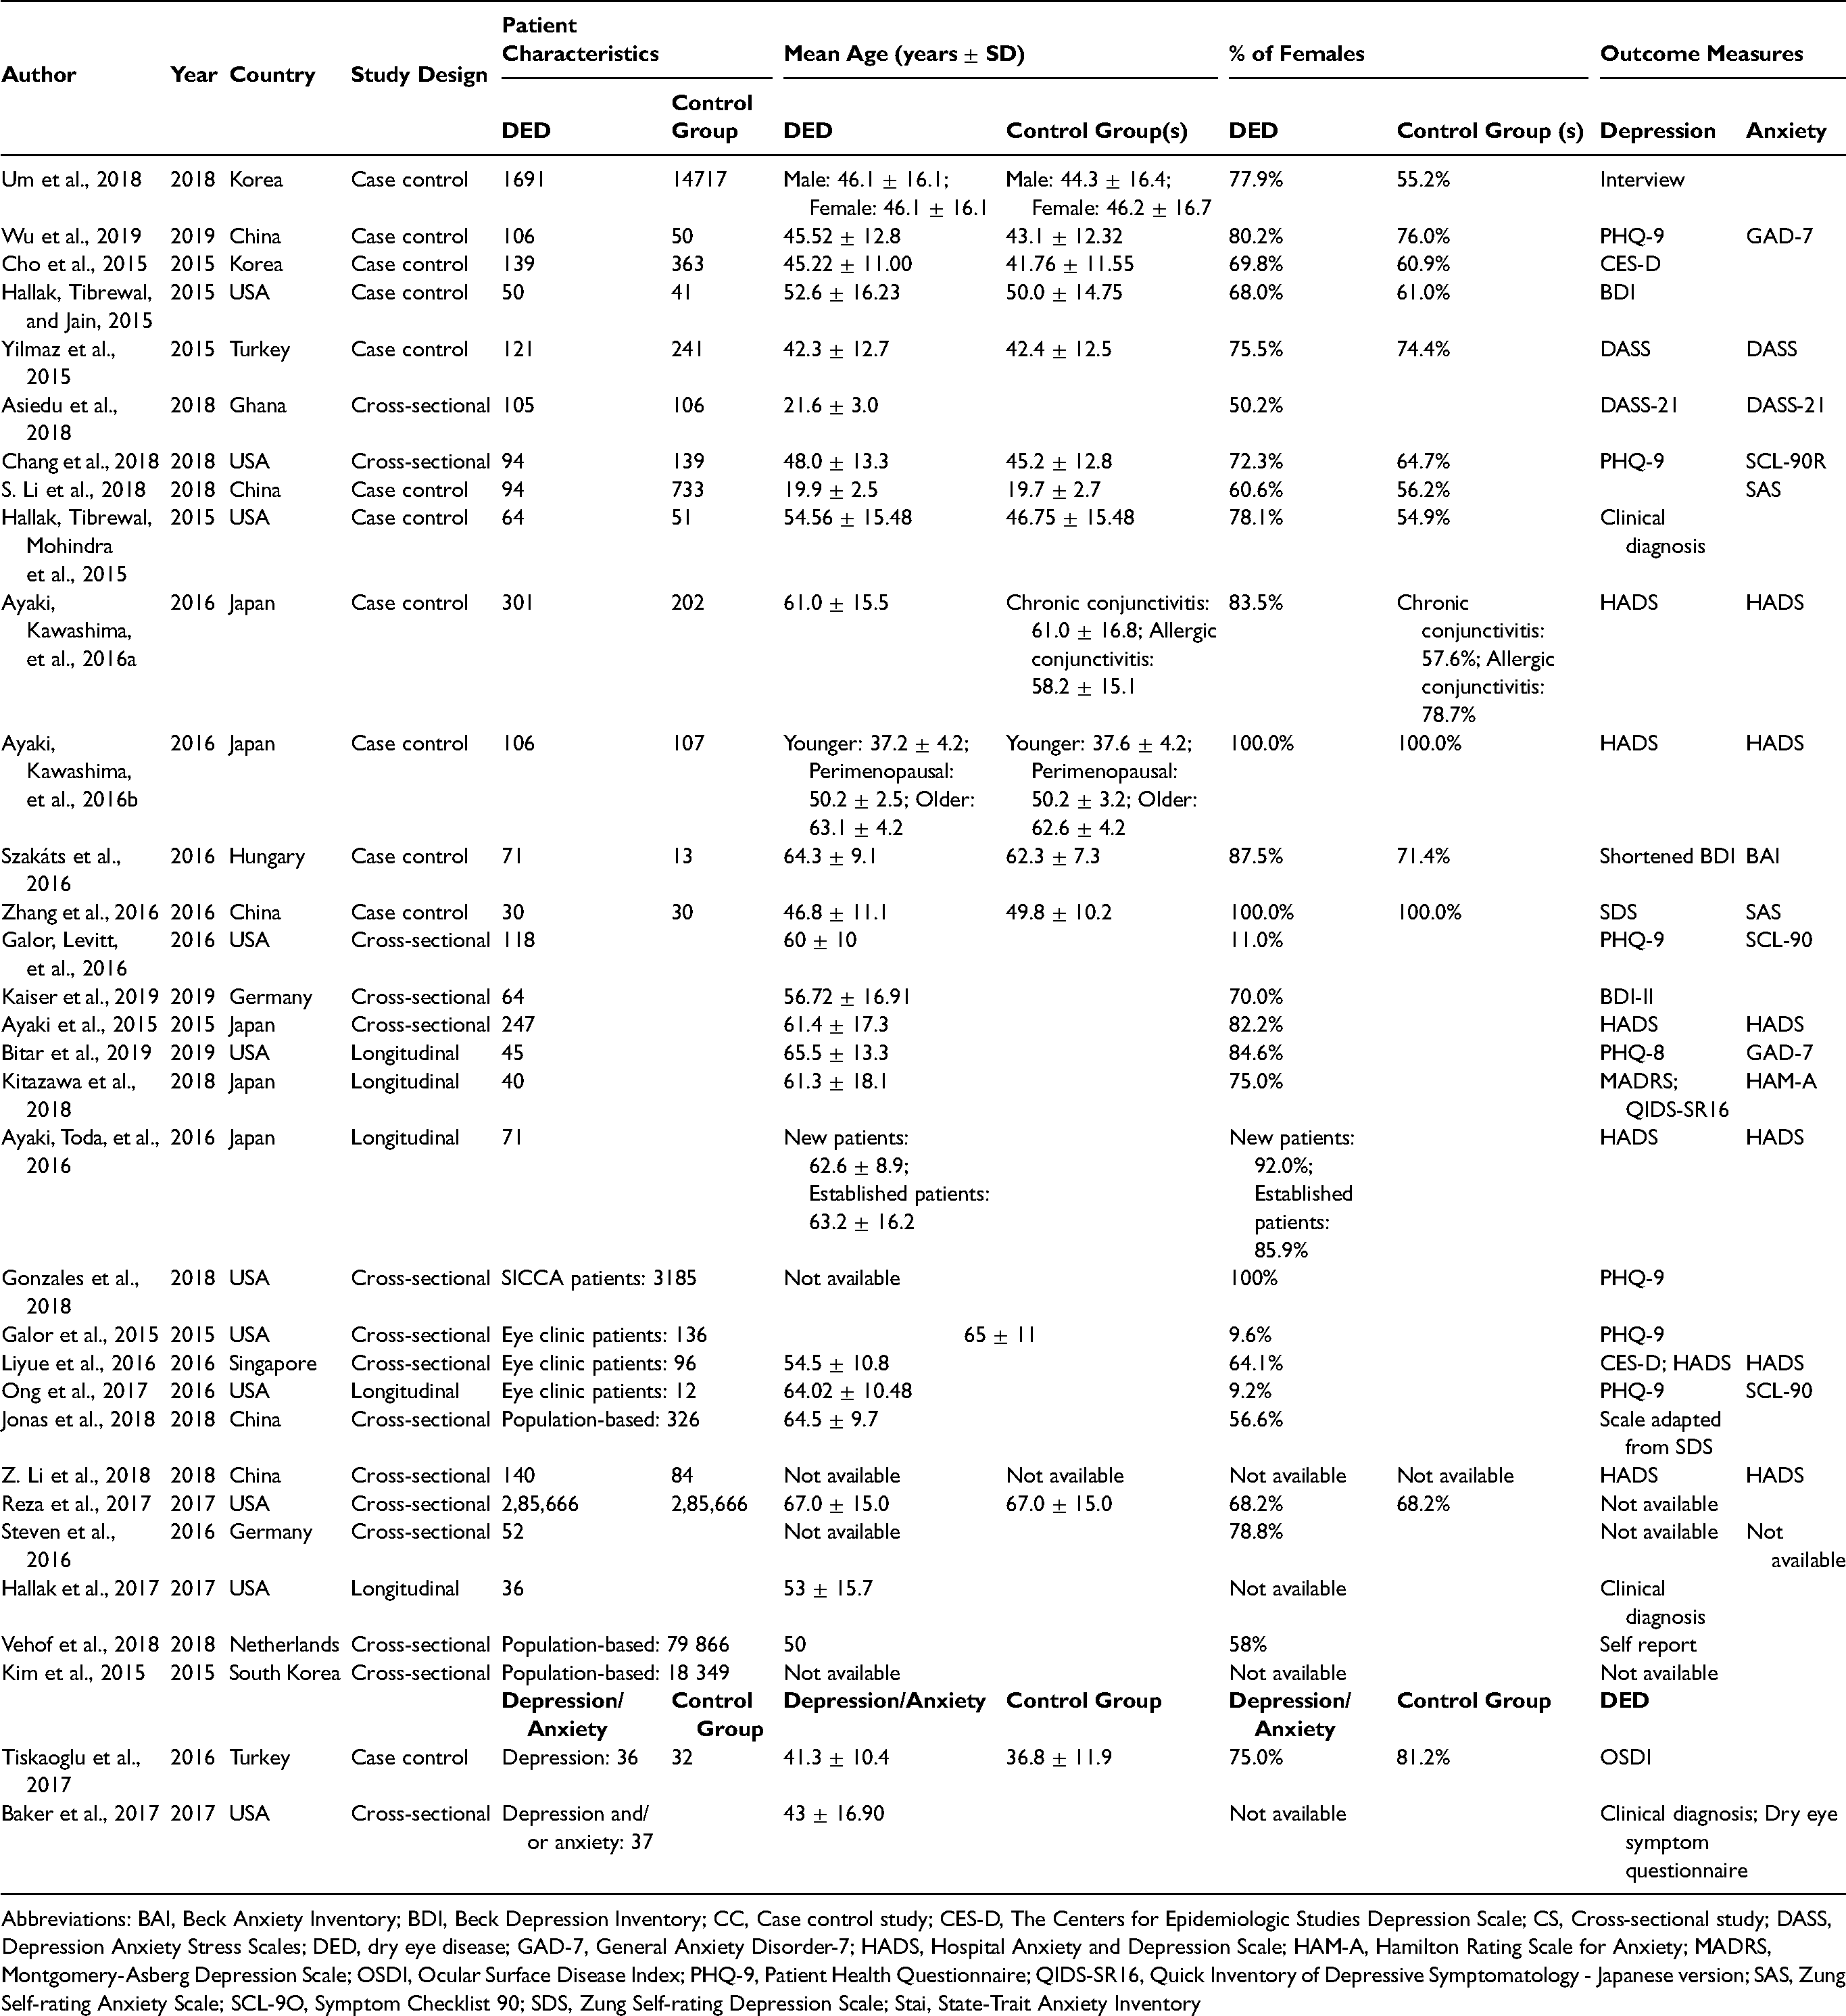
Abbreviations: BAI, Beck Anxiety Inventory; BDI, Beck Depression Inventory; CC, Case control study; CES-D, The Centers for Epidemiologic Studies Depression Scale; CS, Cross-sectional study; DASS, Depression Anxiety Stress Scales; DED, dry eye disease; GAD-7, General Anxiety Disorder-7; HADS, Hospital Anxiety and Depression Scale; HAM-A, Hamilton Rating Scale for Anxiety; MADRS, Montgomery-Asberg Depression Scale; OSDI, Ocular Surface Disease Index; PHQ-9, Patient Health Questionnaire; QIDS-SR16, Quick Inventory of Depressive Symptomatology - Japanese version; SAS, Zung Self-rating Anxiety Scale; SCL-9O, Symptom Checklist 90; SDS, Zung Self-rating Depression Scale; Stai, State-Trait Anxiety Inventory
Prevalence of depression and anxiety in DED.
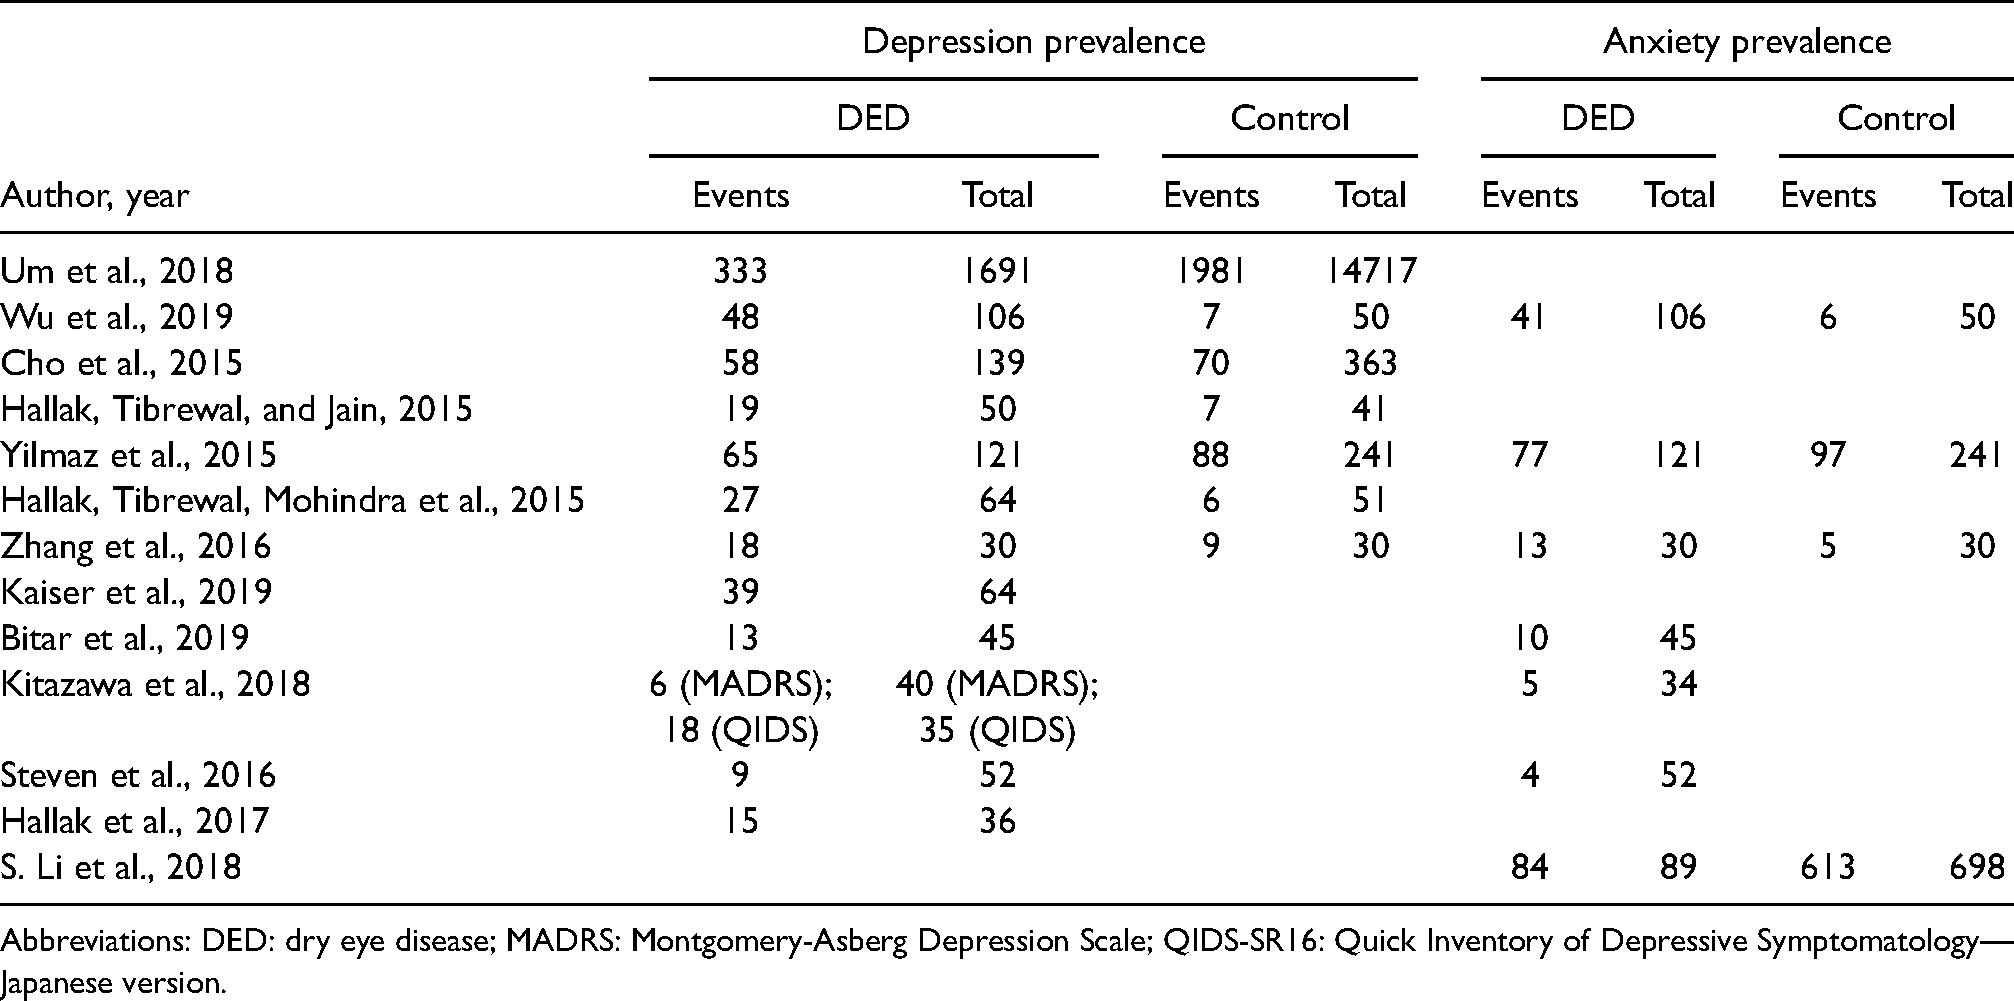
Abbreviations: DED: dry eye disease; MADRS: Montgomery-Asberg Depression Scale; QIDS-SR16: Quick Inventory of Depressive Symptomatology—Japanese version.
Severity of DED symptoms, depression, and anxiety and correlation between DED symptoms and depression/anxiety.
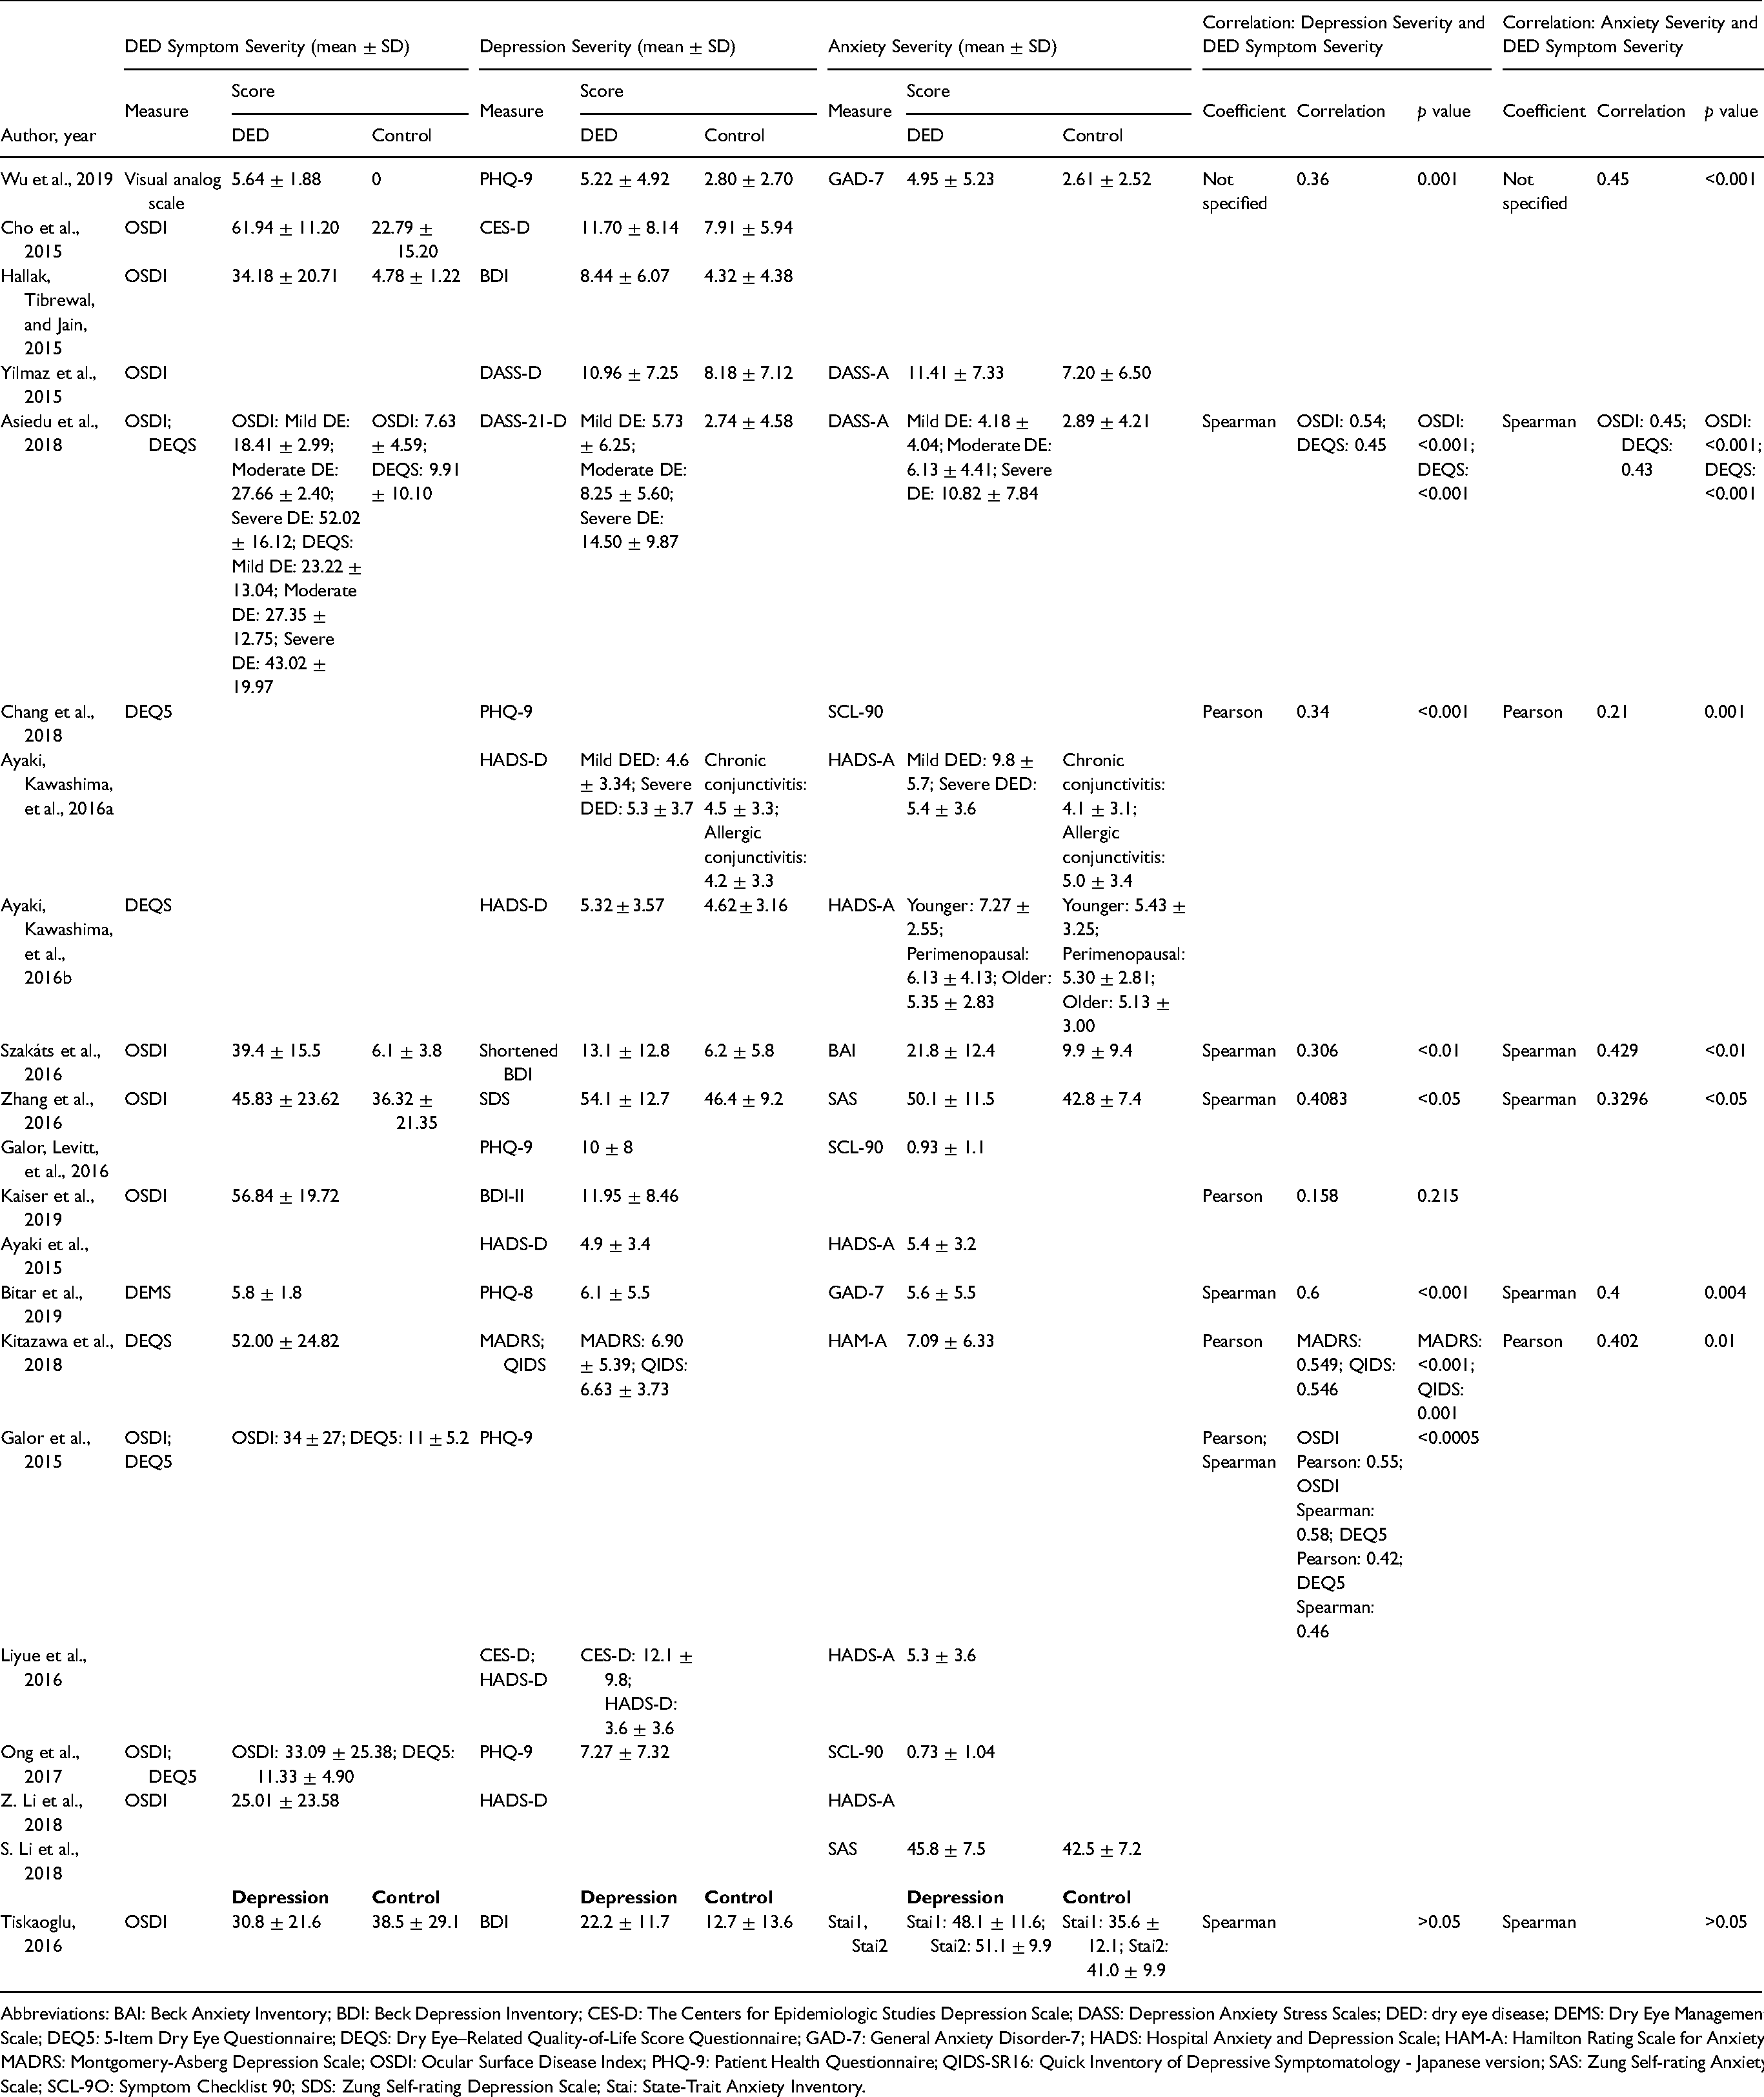
Abbreviations: BAI: Beck Anxiety Inventory; BDI: Beck Depression Inventory; CES-D: The Centers for Epidemiologic Studies Depression Scale; DASS: Depression Anxiety Stress Scales; DED: dry eye disease; DEMS: Dry Eye Management Scale; DEQ5: 5-Item Dry Eye Questionnaire; DEQS: Dry Eye–Related Quality-of-Life Score Questionnaire; GAD-7: General Anxiety Disorder-7; HADS: Hospital Anxiety and Depression Scale; HAM-A: Hamilton Rating Scale for Anxiety; MADRS: Montgomery-Asberg Depression Scale; OSDI: Ocular Surface Disease Index; PHQ-9: Patient Health Questionnaire; QIDS-SR16: Quick Inventory of Depressive Symptomatology - Japanese version; SAS: Zung Self-rating Anxiety Scale; SCL-9O: Symptom Checklist 90; SDS: Zung Self-rating Depression Scale; Stai: State-Trait Anxiety Inventory.
Correlation between DED signs and depression/anxiety.
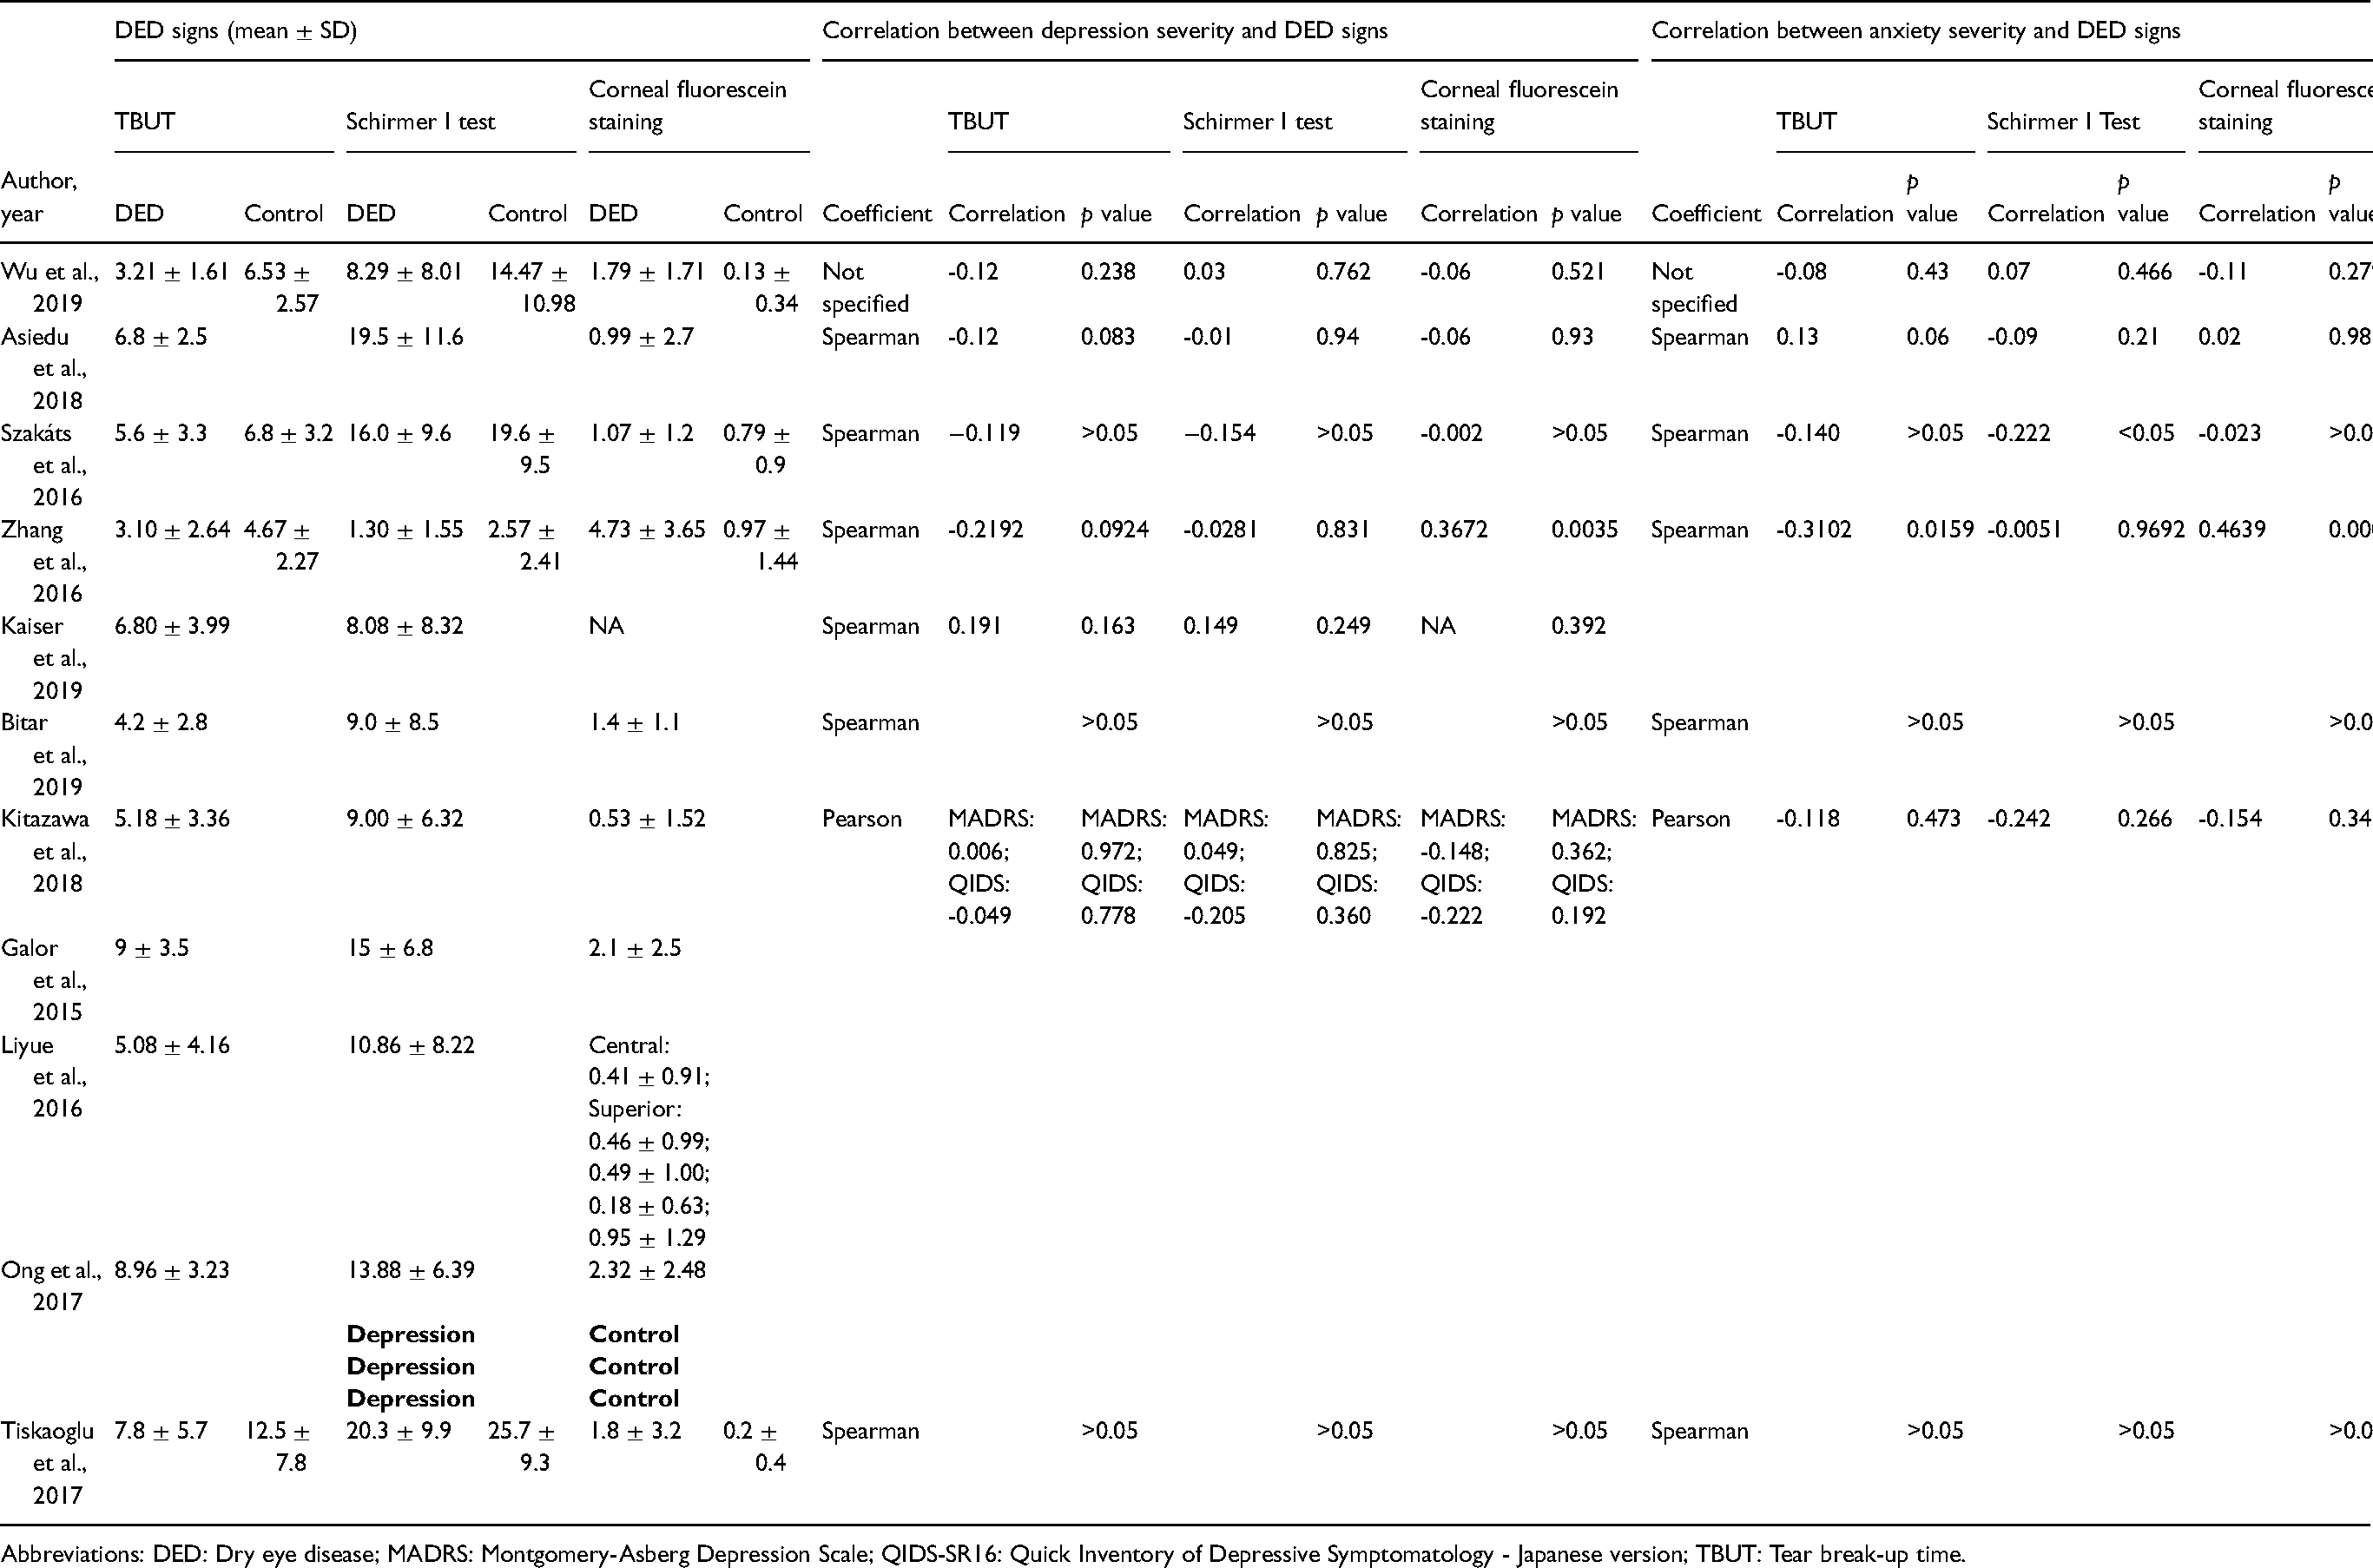
Abbreviations: DED: Dry eye disease; MADRS: Montgomery-Asberg Depression Scale; QIDS-SR16: Quick Inventory of Depressive Symptomatology - Japanese version; TBUT: Tear break-up time.
Quality assessment scores
The quality assessment conducted for each study using the Newcastle-Ottawa Scale can be found in Supplementary Appendix 2. For case-control studies, the quality assessment scores ranged from 3 to 8 with an average of 5. For all other studies, quality assessment scores ranged from 0 to 3 with an average of 1.2. All studies were included in the review regardless of the score.
Risk of publication bias
Figure 2A represents a funnel plot for studies reporting the depression prevalence in DED. Visual inspection of the plot shows studies scattered from top center of the plot to bottom right of the plot. One study is at the top left along the central line of the plot and other studies are scattered from middle to bottom right of the plot. Figure 2B represents a funnel plot for studies reporting the prevalence of depression in DED compared to controls. Visual inspection of the plot shows studies scattered along the central line to bottom right of the plot. Figure 2C represents a funnel plot for studies reporting the anxiety prevalence in DED. Visual inspection of the plot shows studies scattered across the middle of the plot. Figure 2D represents a funnel plot for studies reporting the anxiety prevalence in DED compared to controls. Studies were scattered from middle left to bottom right of the plot. Figure 2E represents a funnel plot for studies reporting depression scale score in DED compared to controls. Visual inspection of the plot shows studies scattered from top left along the central line to bottom right of the plot. Figure 2F represents a funnel plot for studies reporting anxiety scale scores in DED compared to controls. Visual inspection of the plot shows studies scattered towards the top central line of the plot to bottom right of the plot. In the funnel plots, few studies at the bottom of the plot imply that small studies with non-significant results may not be published. However, publication bias is only one of the numerous possible explanations for funnel plot asymmetry. Therefore, publication bias could not be concluded.
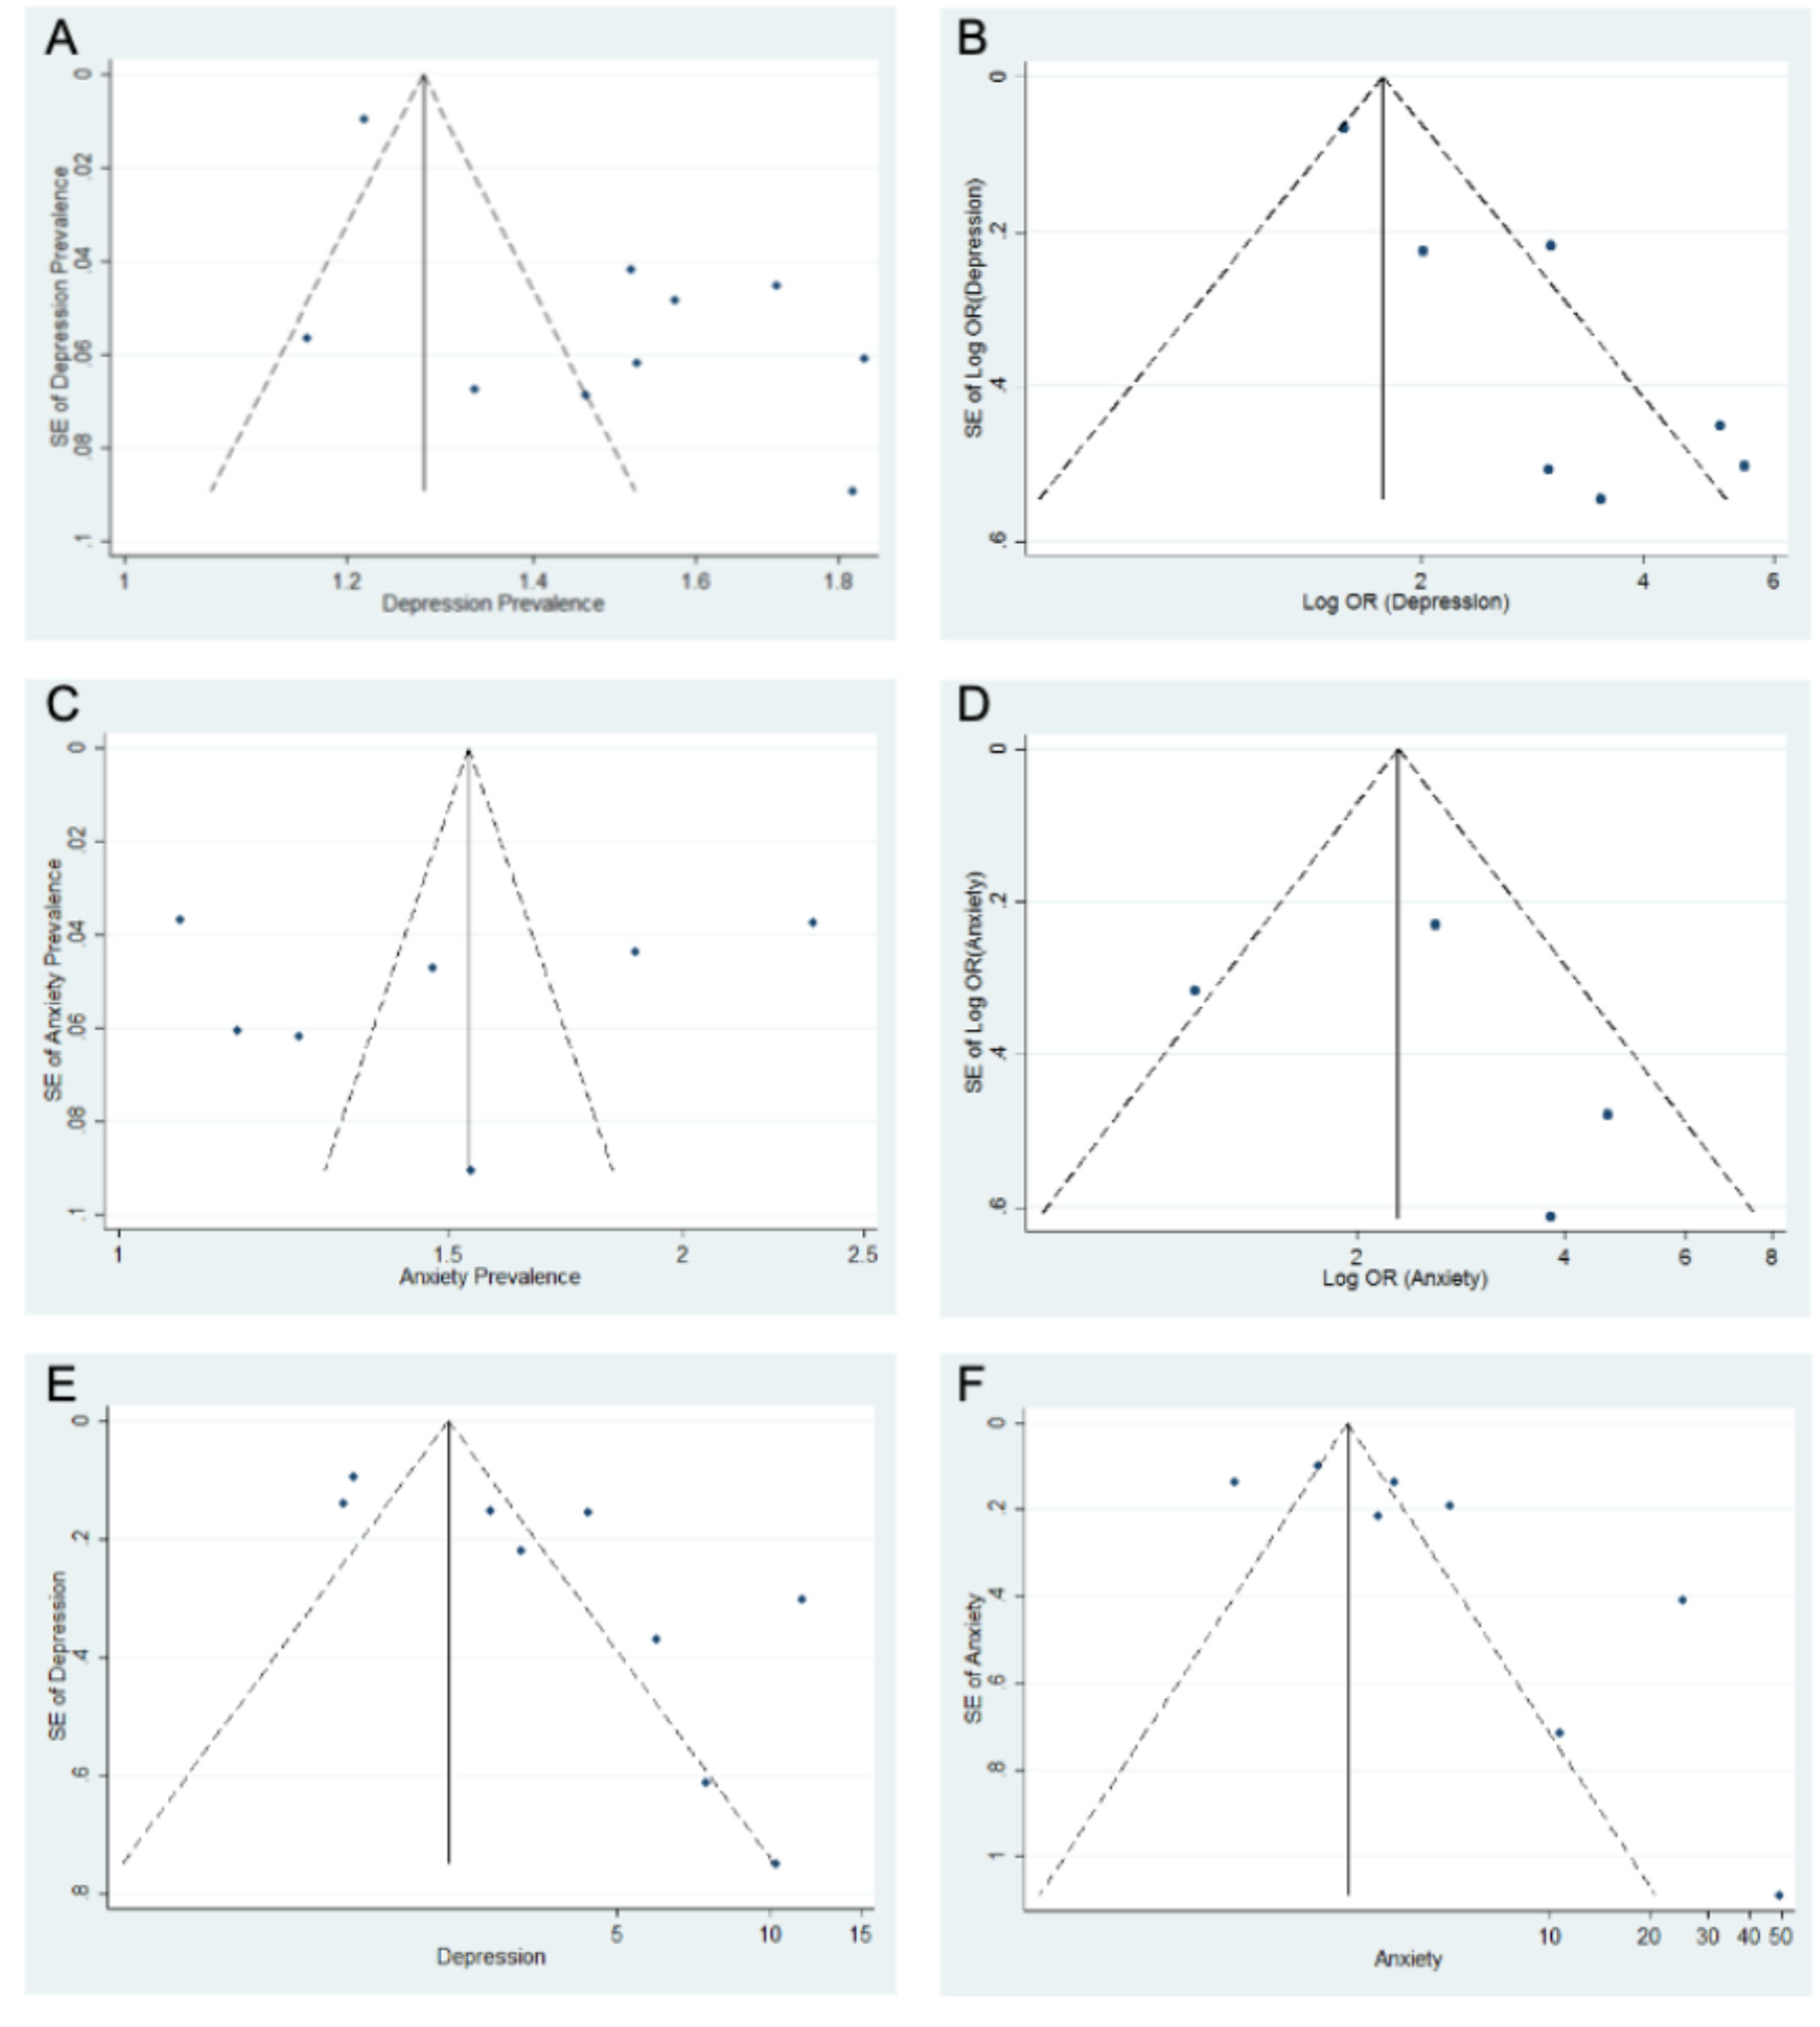
Funnel plots including studies reporting (A) Depression prevalence in dry eye disease (DED), (B) Prevalence of depression in DED compared to controls, (C) Anxiety prevalence in DED, (D) Anxiety prevalence in DED compared to controls, (E) Depression scale score in DED compared to controls, (F) Anxiety scale scores in DED compared to controls. Dashed lines indicate the 95% confidence intervals.
Prevalence of depression
Figure 3 synthesizes data for the prevalence of depression in DED, with 10 studies included in the quantitative analysis. There was significant heterogeneity between studies (I2 = 94.7%, p value = 0.000). Therefore, a random-effects model was computed using Dersimonian and Laird (D+L) method. Results showed a significant prevalence of depression in DED patients (ES = 0.40; CI: [0.29, 0.52]). DED patients have a 40% prevalence of depression.
Forest plot for the prevalence of depression in dry eye disease (DED) patients.
Figure 4 synthesizes data comparing the prevalence of depression between DED and control patients, with seven studies included in the quantitative analysis. There was significant heterogeneity between studies (I2 = 73.3%, p value = 0.001). There were significant odds of depression prevalence among DED patients (OR = 1.81, CI: [1.61, 2.02]) compared to control patients. Results indicate that DED patients had 1.81 times higher odds of depression compared to controls.
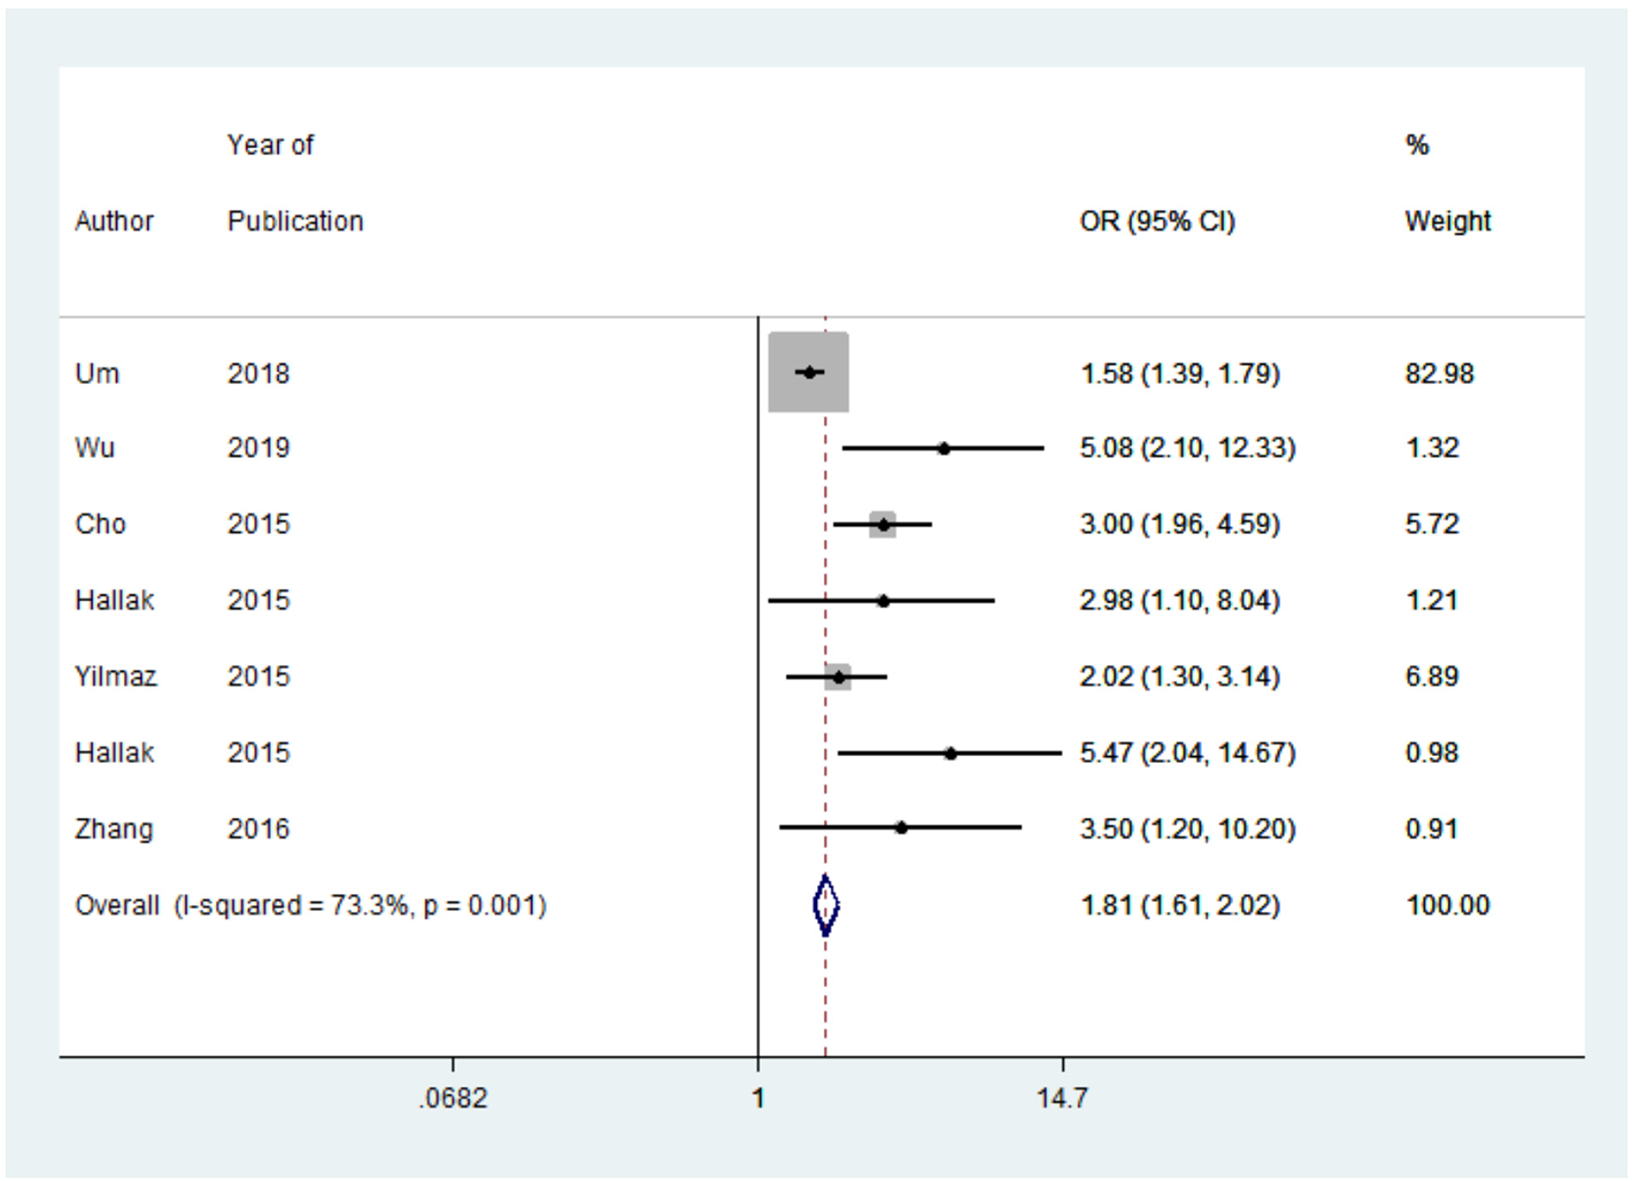
Forest plot for the odds ratio (OR) of depression prevalence in dry eye disease (DED) patients compared to controls. A positive OR of depression prevalence indicates that DED patients have a higher prevalence of depression compared to controls.
Prevalence of anxiety
Figure 5 synthesizes data for the prevalence of anxiety in DED, with seven studies included in the quantitative analysis. There was significant heterogeneity between studies (I2 = 97.8%, p value < 0.001). Therefore, a random-effects model was computed. Results showed a significant prevalence of anxiety in DED (ES = 0.39; CI: [0.15, 0.64]). The prevalence of anxiety in DED is 39%.
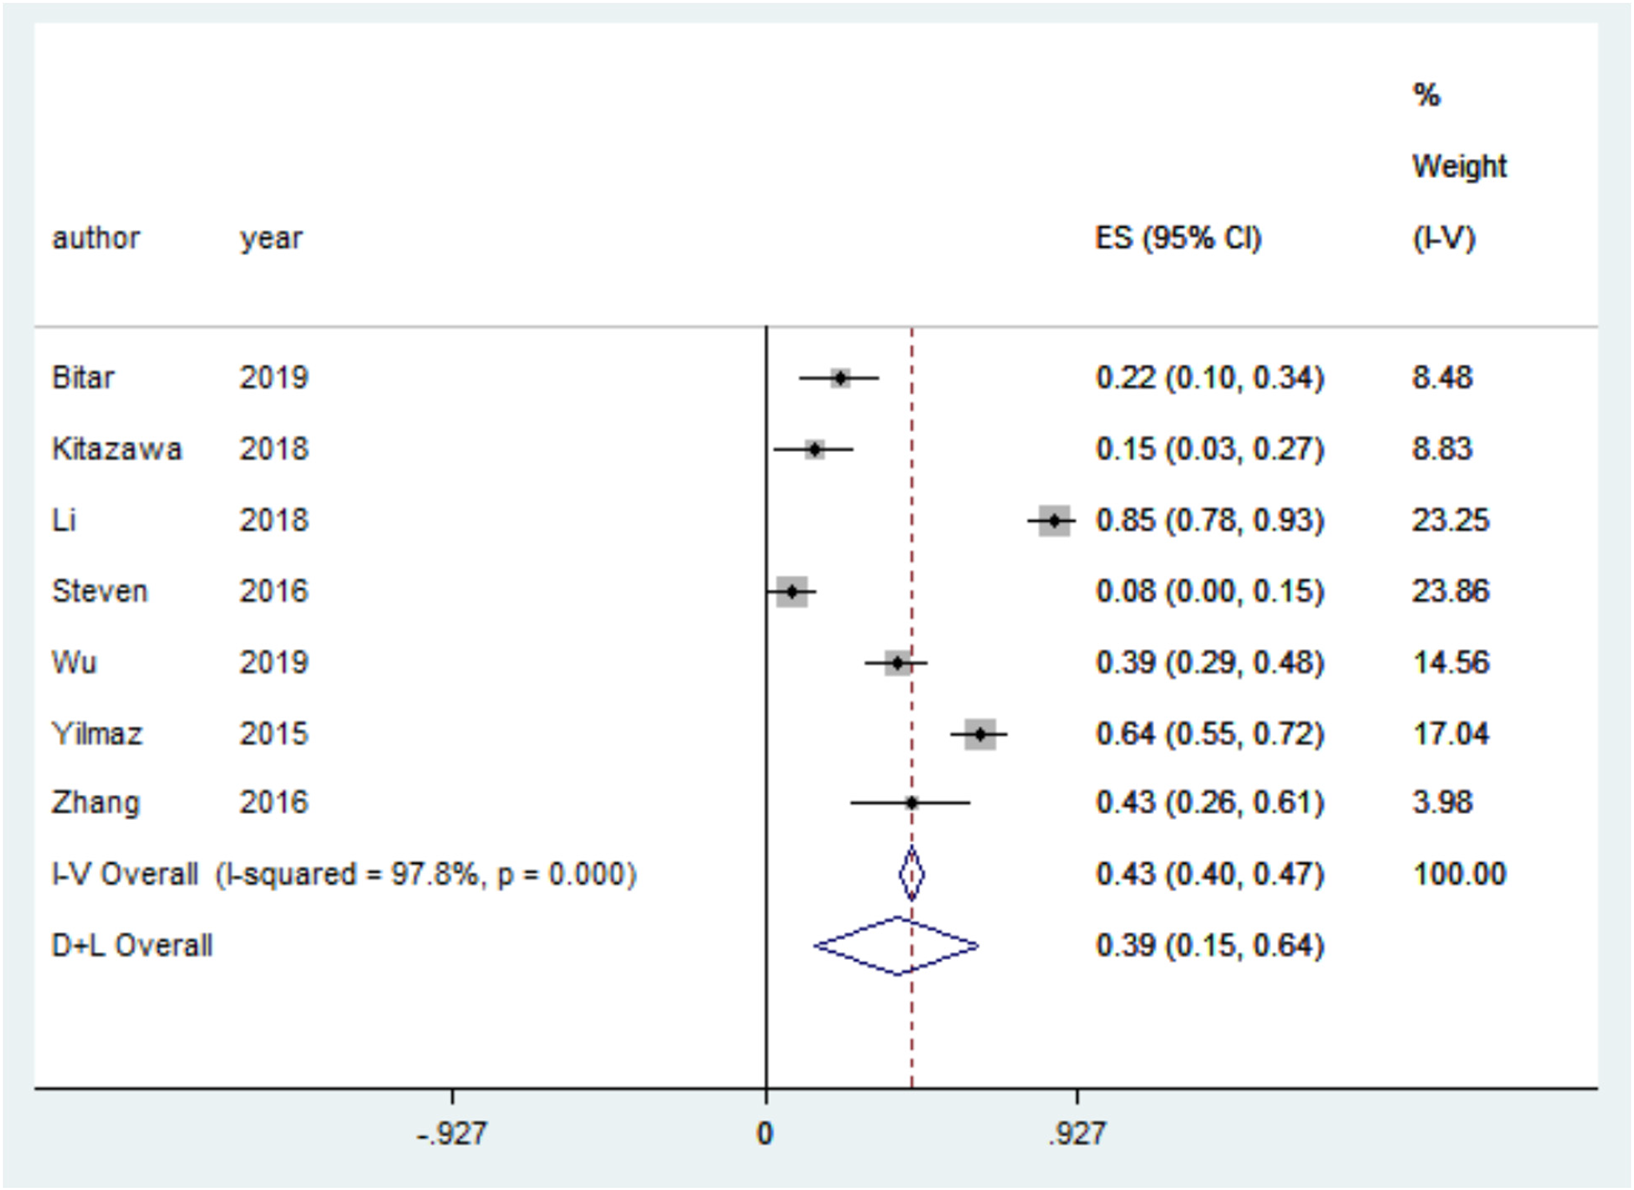
Forest plot for the prevalence of anxiety in dry eye disease (DED) patients.
Figure 6 synthesizes data comparing the prevalence of anxiety between DED and control patients, with four studies included in the quantitative analysis. There was no significant heterogeneity between studies (I2 = 61.1%, p value = 0.052). There were significant odds of anxiety prevalence among DED patients (OR = 2.32, CI: [1.67, 3.23]) compared to control patients. Results indicate 2.32 times higher odds of anxiety prevalence in DED patients compared to controls.
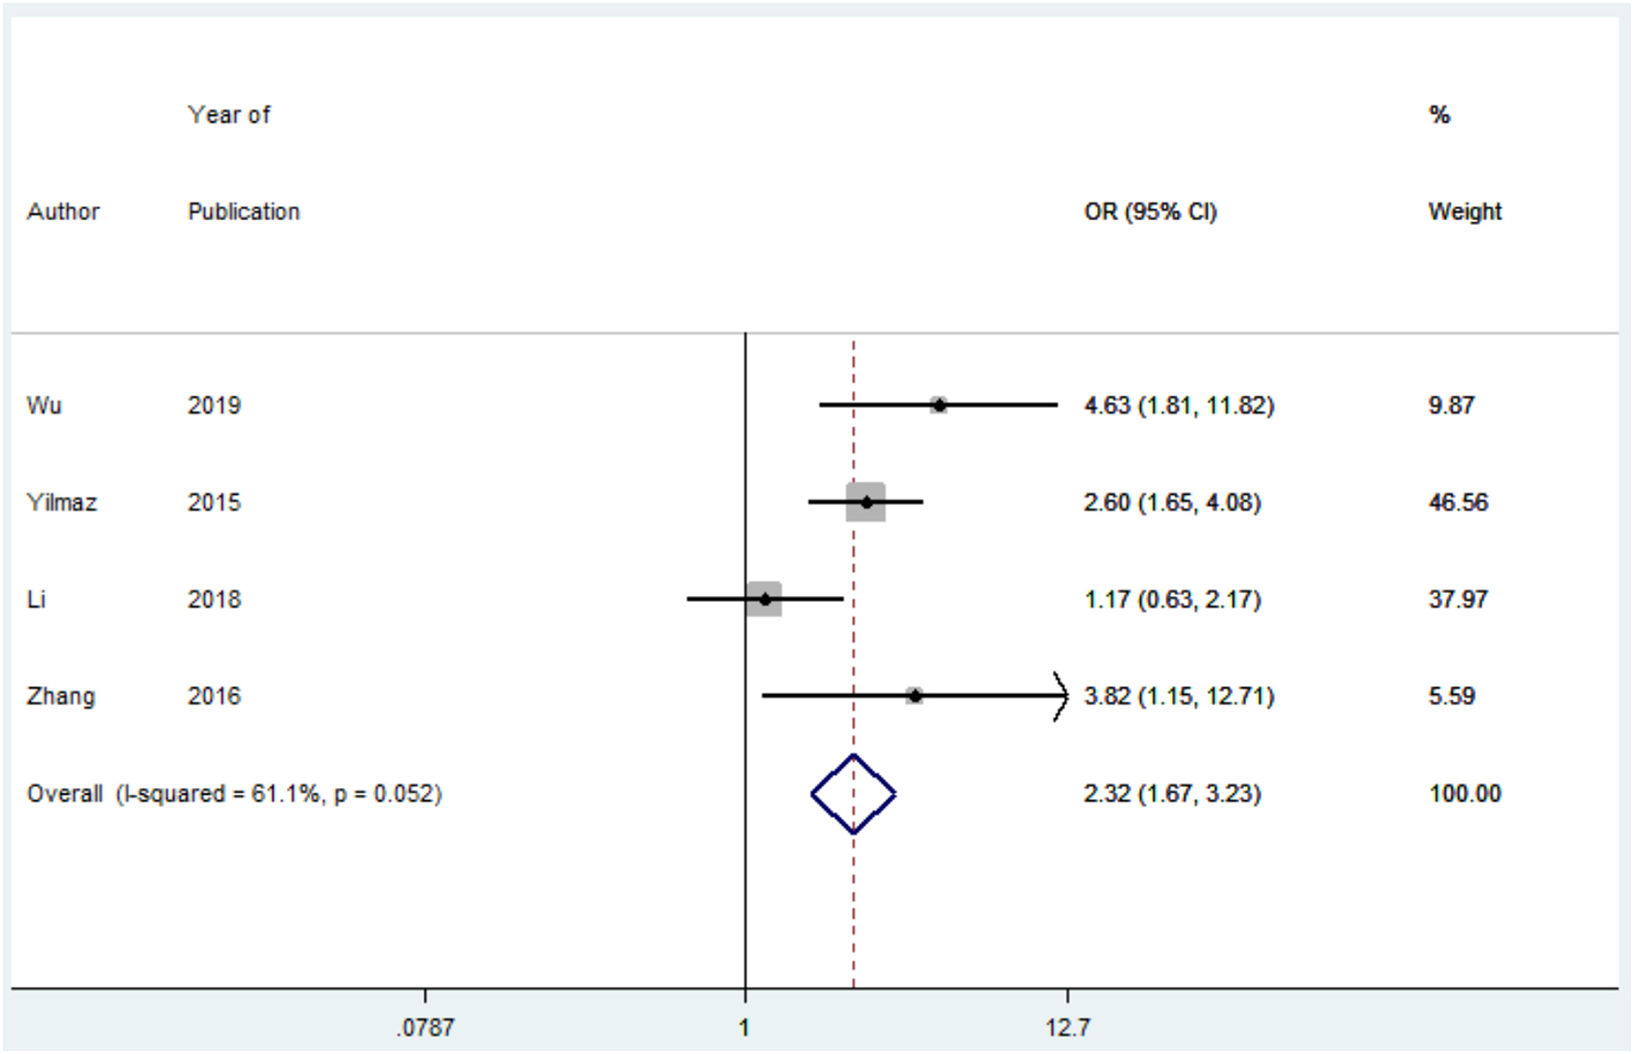
Forest plot for the odds ratio (OR) of anxiety prevalence in dry eye disease (DED) patients compared to controls. A positive OR of anxiety prevalence indicates that DED patients have a higher prevalence of anxiety compared to controls.
Depression scale score
Figure 7 synthesizes data for the difference in depression scale score between DED and control patients. The Patient Health Questionnaire (PHQ-8/9), The Centers for Epidemiologic Studies Depression Scale (CES-D), and the Zung Self-rating Depression Scale (SDS) were each reported by one study, and the Beck Depression Inventory (BDI), the Depression Anxiety Stress Scales- Depression scale (DASS-D), and the Hospital Anxiety and Depression Scale- Depression scale (HADS-D) were each reported by two studies included in the quantitative analysis. There was significant heterogeneity between studies using DASS-D (I2 = 92.8%, p value = 0.000), but nonsignificant heterogeneity between studies using BDI (I2 = 0.0%, p value = 0.607) and HADS-D (I2 = 0.0%, p value = 0.913). A random-effects model was used due to higher heterogeneity. Figure 7 demonstrates that depression scale scores are significantly higher in DED patients than controls in studies using PHQ-9 (SMD = 0.56; CI: [0.22, 0.90]), CES-D (SMD = 0.57; CI: [0.37, 0.77]), BDI (SMD = 0.70; CI: [0.35, 1.05]), DASS-D (SMD = 0.73; CI: [0.05, 1.40]), HADS-D (SMD = 0.22; CI: [0.07, 0.37]), and SDS (SMD = 0.69; CI: [0.17, 1.22]). Results indicate a significantly higher depression severity among DED patients compared to controls.
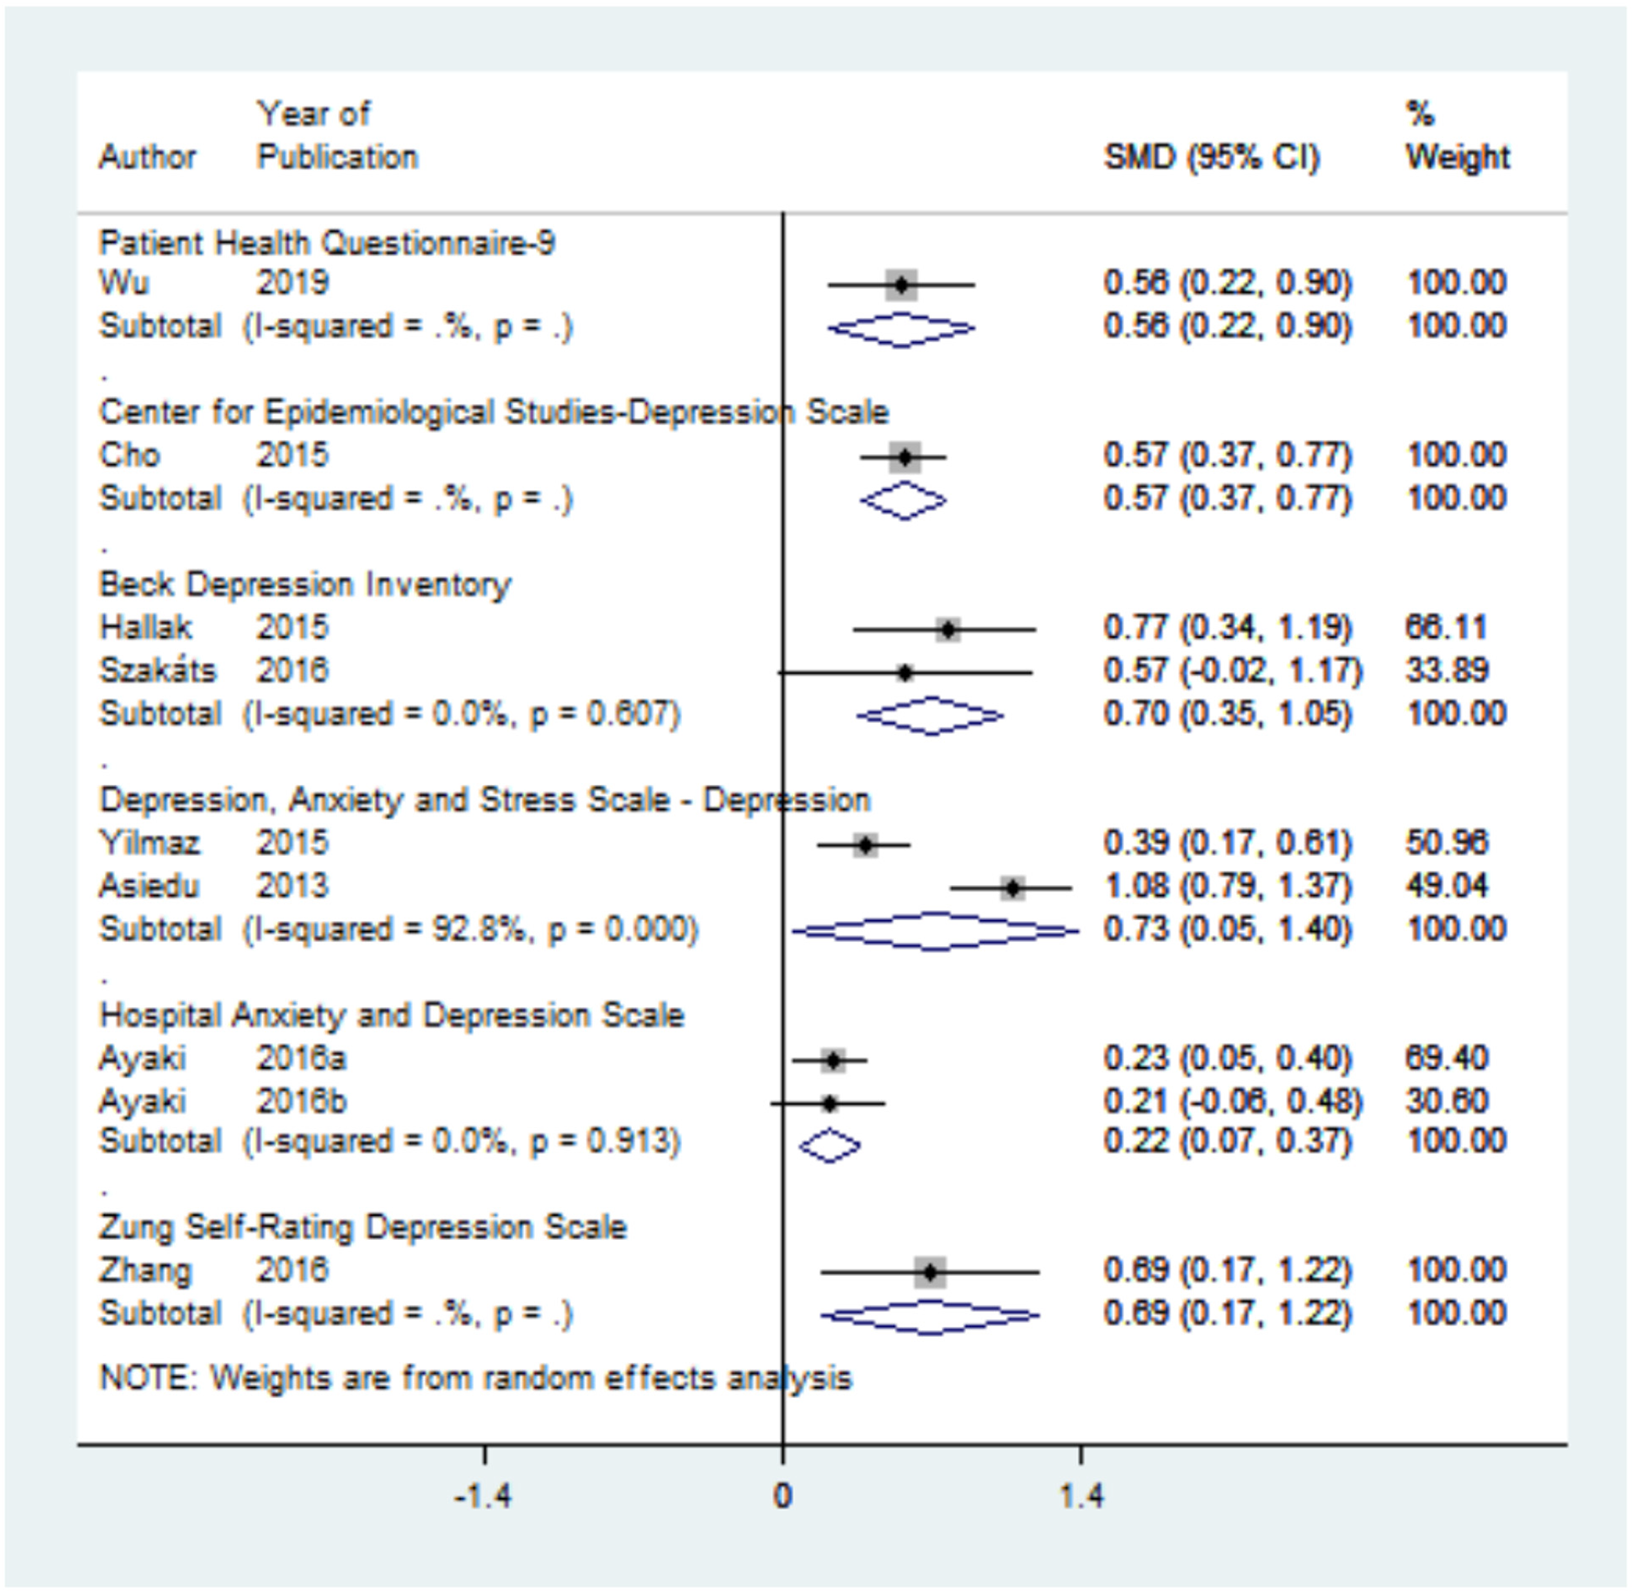
Forest plot for the standard mean difference (SMD) of depression scale score in dry eye disease (DED) patients compared to controls. Positive SMD indicates that DED patients have higher depression scores compared to controls.
Anxiety scale score
Figure 8 synthesizes data for the difference in anxiety scale score between DED and control patients. The General Anxiety Disorder-7 (GAD-7) and the Beck Anxiety Inventory (BAI) were each reported by one study, and the Depression Anxiety Stress Scales- Anxiety scale (DASS-A), the Zung Self-rating Anxiety Scale (SAS), and the Hospital Anxiety and Depression Scale- Anxiety scale (HADS-A) were each reported by two studies included in the quantitative analysis. There was significant heterogeneity between studies using DASS-A (I2 = 91.3%, p value = 0.001), but nonsignificant heterogeneity between studies using SAS (I2 = 6.2%, p value = 0.302) and HADS-A (I2 = 70.9%, p value = 0.064). Figure 8 demonstrates that anxiety scale scores are significantly higher in DED patients than controls in studies using GAD-7 (SMD = 0.51; CI: [0.17, 0.86]), DASS-A (SMD = 0.93; CI: [0.30, 1.56]), SAS (SMD = 0.51; CI: [0.29, 0.72]), and BAI (SMD = 1.11; CI: [0.49, 1.72]). There was no significant difference in anxiety scale scores in studies using HADS-A (SMD = 0.25; CI: [-0.05, 0.54]).
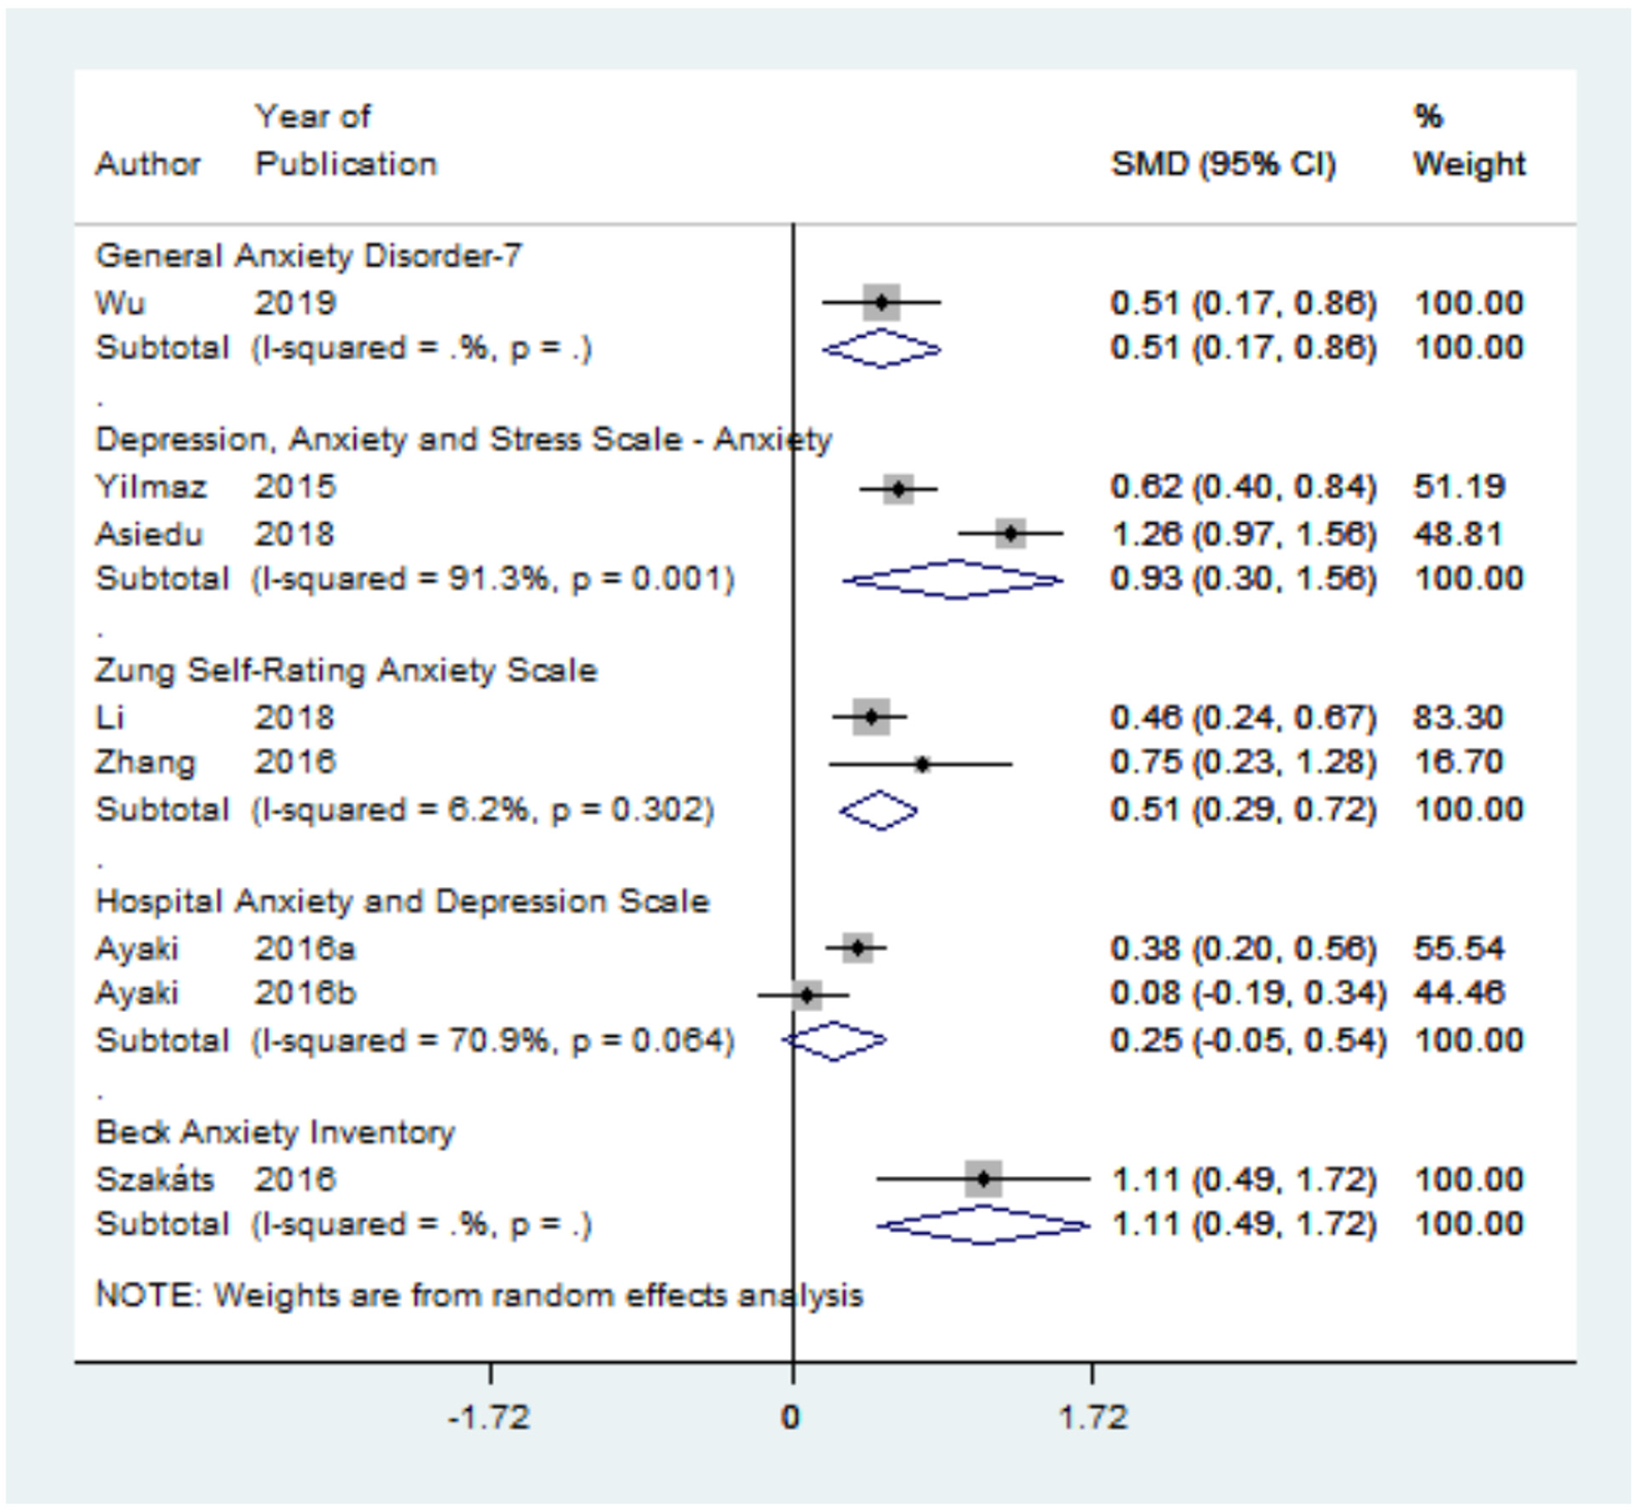
Forest plot for the standard mean difference (SMD) of anxiety scale score in dry eye disease (DED) patients compared to controls. A positive SMD indicates that DED patients have higher anxiety scores compared to controls.
DED symptoms and depression/anxiety severity
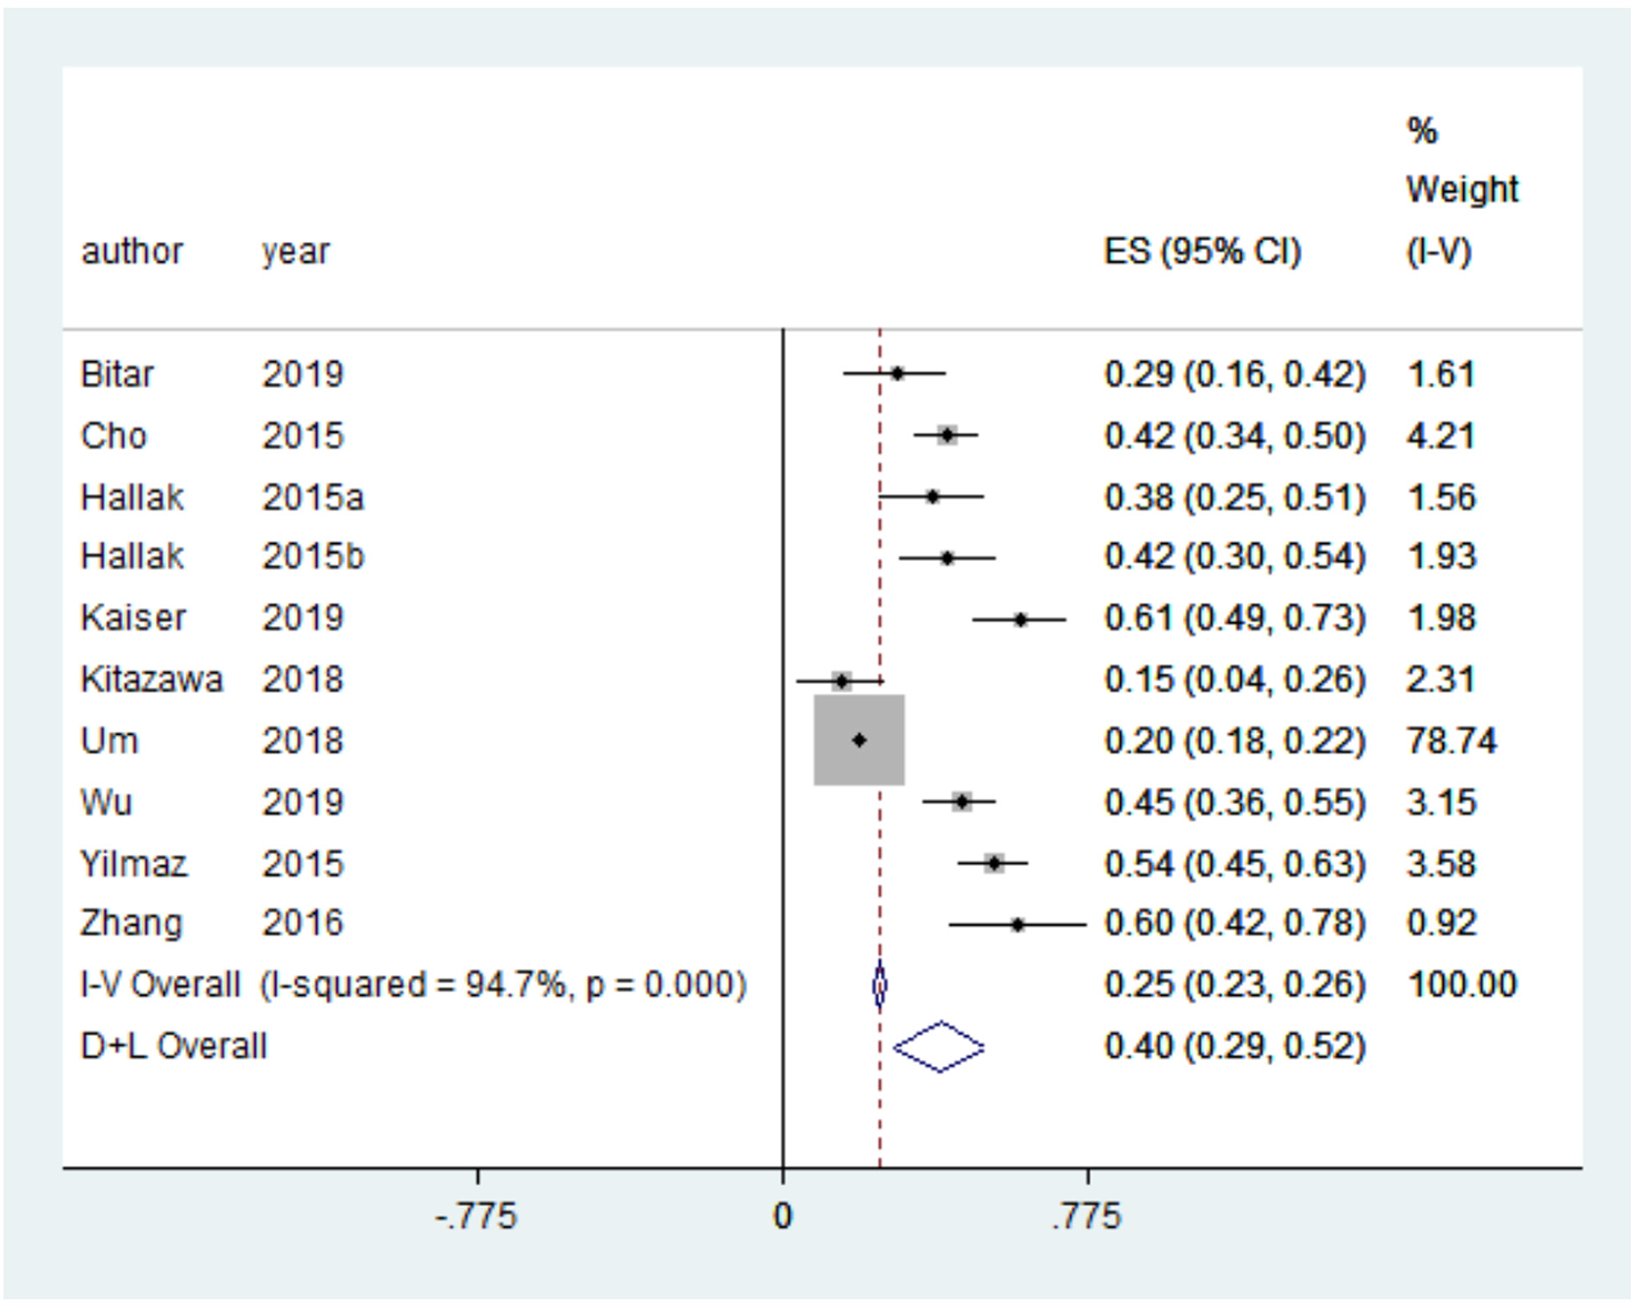
Figure 9 synthesizes data for the correlation between DED symptoms and depression severity, with eight studies included in the quantitative analysis. There was no significant heterogeneity between studies (I2 = 47.8%, p value = 0.063). The correlation between DED symptoms and depression severity was significant (ES = 0.43; CI: [0.31, 0.55]). Results indicate that significant DED symptoms are associated with severe depression.
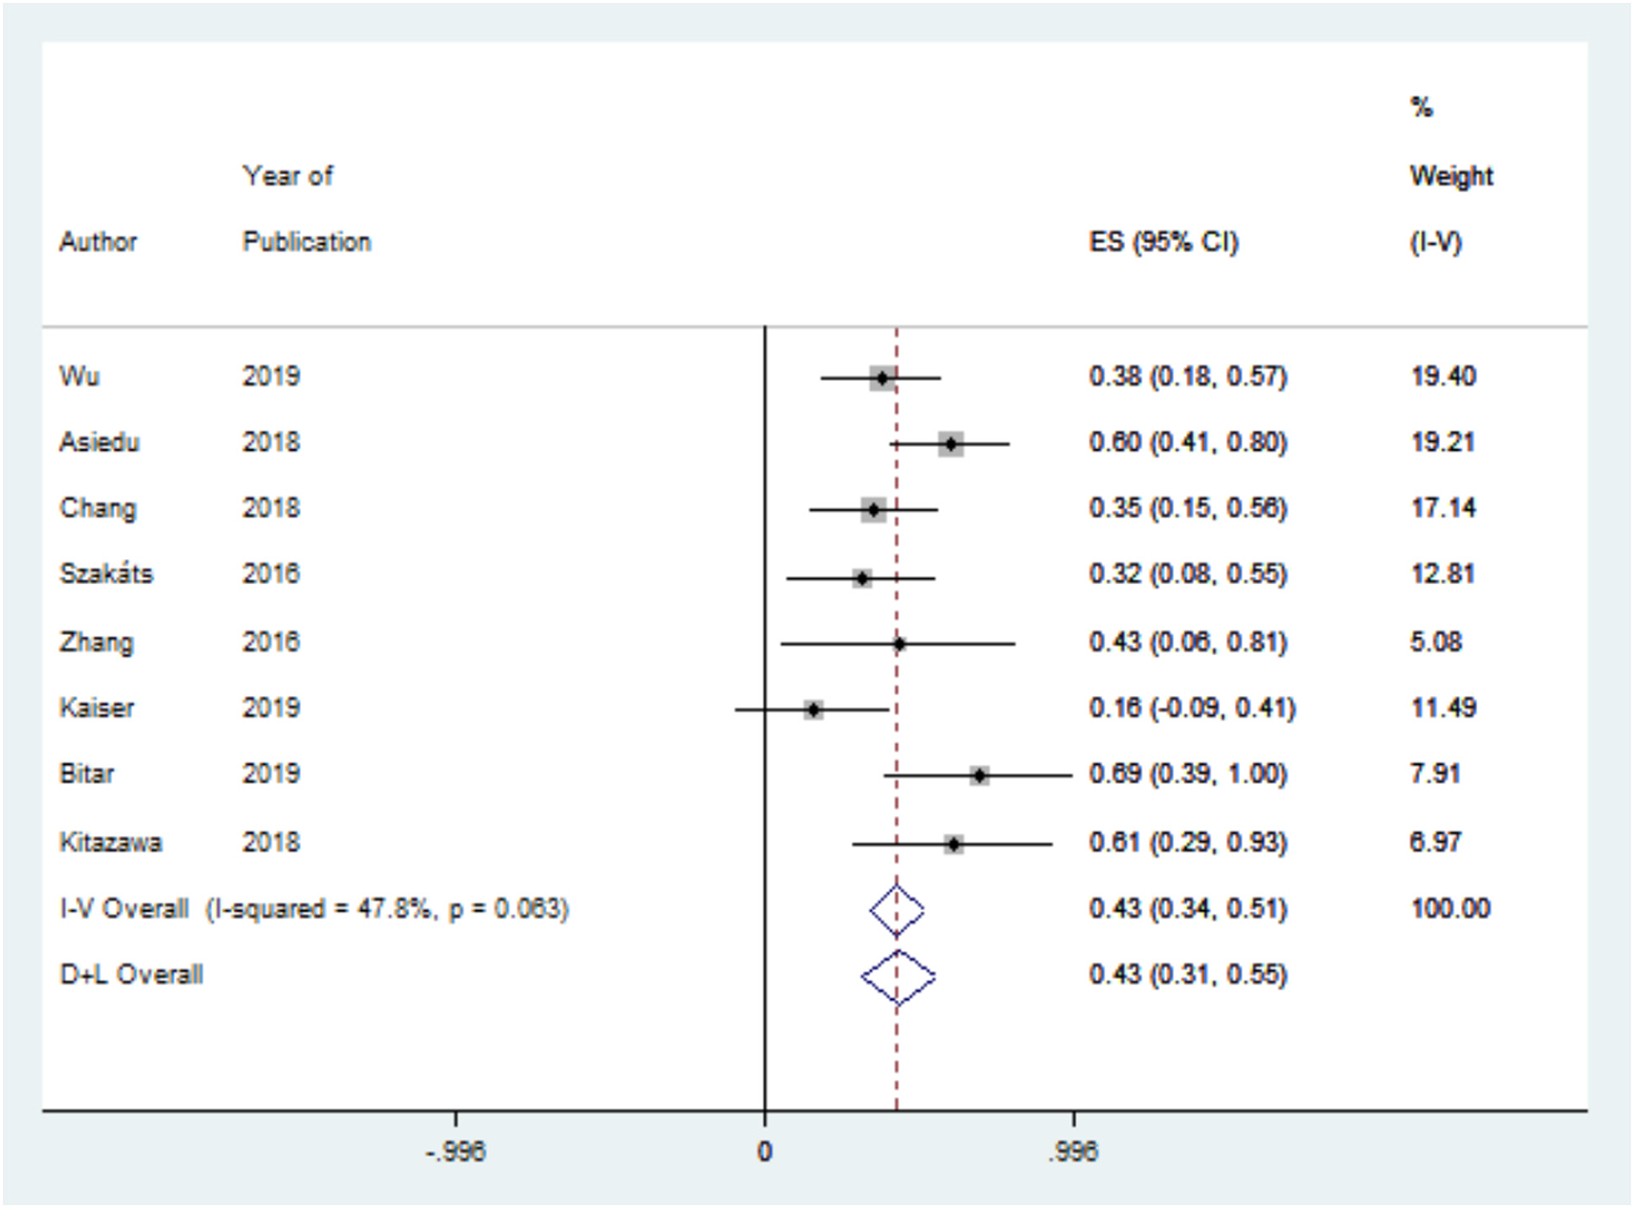
Forest plot for the correlation between depression scale scores and dry eye symptom scores.
Figure 10 synthesizes data for the correlation between DED symptoms and anxiety severity, with seven studies included in the quantitative analysis. There was non-significant heterogeneity between studies (I2 = 0.0%, p value = 0.548). The correlation between DED symptoms and anxiety severity was significant (ES = 0.41; CI: [0.32, 0.50]). Results indicate that significant DED symptoms are associated with severe anxiety.
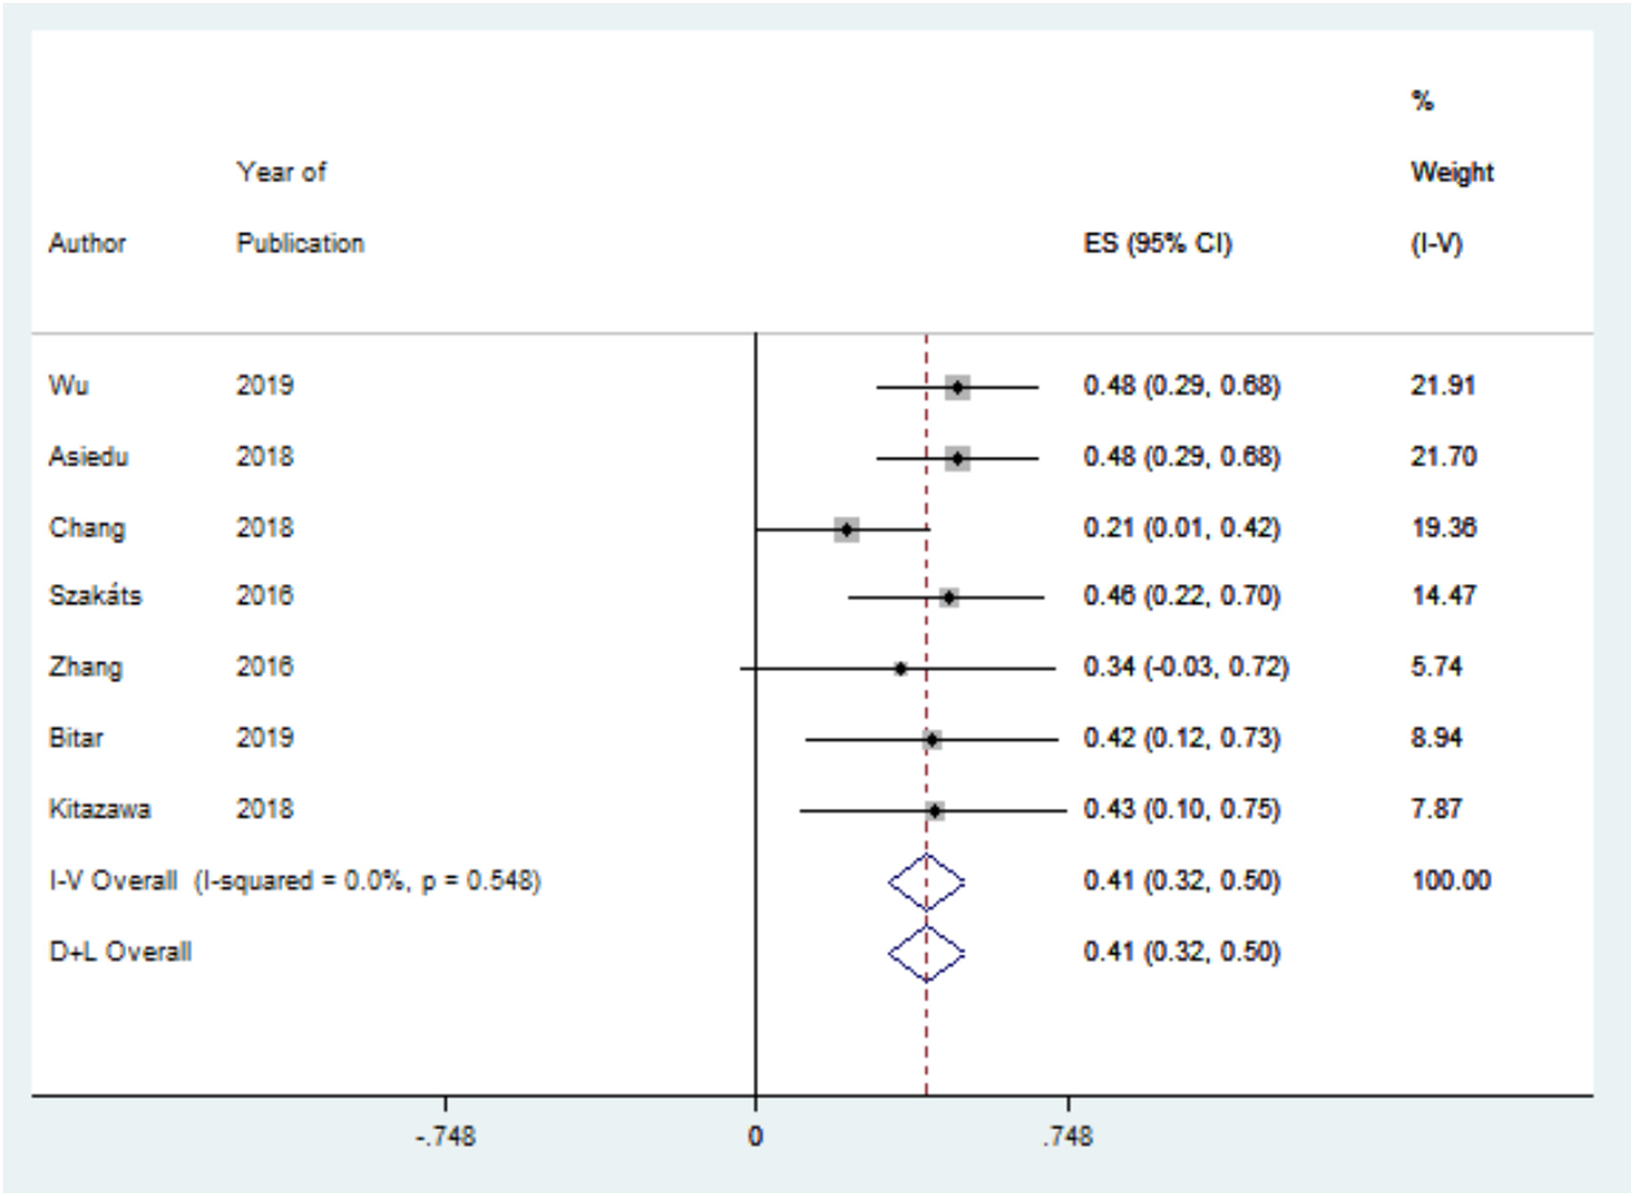
Forest plot for the correlation between anxiety scale scores and dry eye symptom scores.
DED signs and depression/anxiety severity
Meta-analysis found that depression and anxiety severity were not significantly correlated with DED signs. All seven studies reported no significant correlation between depression scores and tear break-up time (TBUT) or Schirmer's test and six of seven studies reported no significant correlation with corneal fluorescein staining. A similar trend was found for anxiety scores and DED signs, with five of six studies reporting no significant correlation with TBUT, Schirmer's test, or corneal fluorescein staining.
Qualitative analysis
Sixteen studies were included in the qualitative analysis. Ayaki, Toda, et al. found that 56.5% of patients with newly diagnosed DED and 51.1% of patients with established DED had anxiety or depression. 33 In a study by Hallak et al., 42% of DED patients had a clinical diagnosis of depression. 42 Reza et al. found depression prevalence to be significantly higher in DED patients (14.6%) than non-DED patients (9.2%). 40 In a study of patients with a number of eye diseases, mood disorders (including both depression and anxiety) were most prevalent in DED patients, with 43.5% having a possible mood disorder (HADS ≥ 10) and 8% having a clinically significant mood disorder (HADS ≥ 20). 30 Regression analysis found the presence of DED to be significantly correlated with depression and anxiety severity score (β = 0.08, p = 0.03). 30 In a study by Steven et al. of therapy-refractive patients with DED symptoms but not signs, 17.3% had depression and 7.7% had anxiety. 41 In a large population-based study by Vehof et al., DED was associated with major depressive disorder (OR = 1.71, CI: [1.48, 2.00]). 43 A large population-based study by Kim et al. similarly found a significant association between DED diagnosis and depression (OR = 1.21, CI not available, p<0.0001). 44 A study by Gonzales et al. of women enrolled in the SICCA (Sjögren's International Collaborative Clinical Alliance) registry reported a significant association between dry eye complaints and depression (OR = 1.82, CI: [1.38, 2.40]). 34
Z. Li et al. reported that primary Sjogren Syndrome patients with DED had more severe depression and anxiety than those without DED. 39 In Galor et al., DED symptom questionnaires were significantly correlated with depression symptom score, with correlations ranging from 0.42-0.58. 35 In a population-based study by Jonas et al., regression analysis found that depression score was significantly associated with number of days with dry eye feeling (β = 0.09, CI: [0.12, 0.29]). 38 Using linear regression, Liyue et al. found no association between HADS depression or anxiety scores and DED signs. 36 In that same study, Schirmer's test was found to be weakly associated with CES-D depression scores, but TBUT and corneal fluorescein staining were not associated. 36 Li et al. found that anxiety was not significantly associated with DED or fluorescein staining, but patients with DED were found to have worse anxiety status. 22
DED in patients with depression and anxiety
Two studies considered DED in patients with depression compared to control patients. Tiskaoglu et al. found that patients with depression had significantly lower TBUT and Schirmer's test scores and higher Oxford scores (corneal fluorescein staining). 45 Another study of patients with depression and anxiety found that 30% had been diagnosed with DED and another 22% reported constant eye dryness and irritation but were undiagnosed. 46
Longitudinal studies
Three studies used a longitudinal design to characterize the interaction of DED with depression and anxiety over time. Ong et al. found depression to be a risk factor for severe DED symptoms at a 1-year follow-up, reporting an odds ratio of 1.09 (CI: [1.02, 1.16], p = 0.006). 37 A study by Kitazawa et al. found that patients with depressive and anxiety symptoms have higher DED symptom scores on cross-sectional examination. 32 However, the change in DED symptom scores over the course of DED treatment did not differ between patients with and without psychiatric symptoms. The authors suggested that no difference may have been found on longitudinal examination due to the ceiling effect of DED treatment, as most participants were long-term DED patients.
Bitar et al. conducted a study of patients treated for DED for 3 to 6 months. 31 Signs and symptoms of DED, depression, and anxiety were assessed before and after treatment. In patients with no prior diagnosis of depression or anxiety, DED symptom scores improved, with changes in symptom scores correlating with changes in depression and anxiety scale scores. However, in patients with a prior diagnosis of depression or anxiety, DED symptom scores did not improve and there was no correlation between changes in DED symptom scores and changes in depression and anxiety scores.
Discussion
DED is one of the most prevalent ocular diseases worldwide, with the prevalence ranging from 5-50%. Likewise, depression and anxiety disorders are very common, with over 264 million people affected globally. 47 This study confirmed the previously reported association of DED with depression and anxiety. In this study, depression had a prevalence of 40% and anxiety had a prevalence of 39% in DED patients. Both depression and anxiety were found to be more prevalent in patients with DED compared to control patients, with odds of depression being 1.81 times higher and odds of anxiety being 2.32 times higher. Additionally, depression and anxiety scale scores were significantly higher in DED patients. A previous systematic review on studies published prior to 2015 found similar results, with the odds of depression and anxiety being 2.92 and 2.80 times higher in DED patients, respectively. 8 Another systematic review studying depression in multiple ocular conditions including DED, glaucoma, age-related macular degeneration, and cataracts reported that DED patients had the greatest prevalence of depression, at 29%. 48
The relationship between DED and psychiatric disorders is a complex one. Although a strong association has repeatedly been found between these disorders, the interaction between them is still not clearly defined. The relationship is most likely a bidirectional one. Importantly, this research was, to our best knowledge, the first systematic review and meta-analysis reporting on the relationship of depression and anxiety to DED symptoms and to DED signs. Depression and anxiety were found to be significantly correlated with DED symptoms. In contrast, depression and anxiety were not related to DED signs (TBUT, Schirmer's test, corneal fluorescein staining). These findings make an important contribution to the discussion on the directionality and mechanism of this relationship.
It is likely that depression and anxiety can be causes as well as effects of DED. The ocular discomfort and eye fatigue of DED can be distressing to patients, limiting their functioning and leading to changes in mood.3,49,50 Patients with DED experience impairments in workplace performance as well as in many other daily activities such as reading, driving, cooking, using a computer, and watching TV.3,49–53 Notably, a longitudinal study of patients with no diagnosis of depression or anxiety prior to receiving a diagnosis of DED found that with DED treatment, improvements in DED symptoms correlated with improvements in psychological symptoms. 31 In these patients whose psychological symptoms improved when their DED symptoms improved, the burden of living with DED symptoms may have been contributing to their depression and anxiety. This may suggest that some patients with new-onset depression or anxiety symptoms following DED diagnosis may benefit from counselling about the association of these conditions, in addition to DED therapy and appropriate medical management for mental health conditions.
In that same longitudinal study, however, patients who had a diagnosis of depression or anxiety before receiving a diagnosis of DED did not experience improvements, perhaps reflecting an alternative mechanism by which DED and psychiatric conditions are related. 31 In agreement with previous studies,7,54,55 this current research found a strong association between psychological symptoms and DED symptoms but not DED signs. Other studies have reported that DED signs and DED symptoms are poorly correlated to each other, with depression as a predictor of greater symptoms than signs.11–13,56,57 Furthermore, DED symptoms are more strongly associated with depression than tear film parameters. 35 In a study examining the factors that contribute to a poor response to dry eye therapy, patients reporting no or partial improvement in ocular pain had significantly higher depression scores, levels of neuropathic ocular pain symptoms, and systemic pain scores than those reporting complete improvement. 58 One proposed explanation for these findings is that DED, depression, and anxiety may together be manifestations of a systemic chronic pain syndrome, in which altered central pain processing causes heightened sensitivity to pain.59–62
In studies assessing objective DED measures in patients with newly diagnosed depression and anxiety, DED signs were significantly different in patients with depression and anxiety compared to controls.45,63 This may suggest another level on which these disorders interact. The authors suggested that dysregulation of serotonin may contribute to DED in patients with depression. 45 The meibomian glands and conjunctiva are known to have serotonin receptor mRNA and serotonin has been shown to regulate lacrimal gland secretion.64–66 It has also been suggested that elevated levels of inflammatory cytokines in patients with depression may play a role in the development of DED. 67 Prospective studies on DED presenting in patients with psychological disorders are needed to further elucidate the mechanisms underlying this association.
The findings of this review highlight the complexity of providing care for patients with DED comorbid with depression or anxiety. Clinicians should consider DED screening in patients with depression or anxiety as well as screening for depression and anxiety in patients with DED. It is important to consider their interrelationship to optimize management for each individual patient. Furthermore, special consideration should be given to patients presenting with discordant DED symptoms and signs, especially if no improvement is achieved with conventional DED therapy. These patients may find additional benefit from the management of their psychological symptoms. Although symptomatic treatment is important, exploring and managing these comorbidities will yield better long-term outcomes for patients. Interdisciplinary collaboration in these cases is valuable for ensuring that appropriate care is provided.
Limitations
Since this review included patients with all types of DED etiology, producing significant heterogeneity in the study population, random-effects model was computed to synthesize the outcomes. This may limit the generalizability of the results when applying them to specific subpopulations of DED patients. Furthermore, most of the studies utilized self-report questionnaires to determine depression status rather than the gold standard of clinical evaluation. These questionnaires are often used to screen for depression, but they may overestimate its prevalence. 68 Additionally, several different scales for DED symptoms, depression, and anxiety were used across the studies with varying cut-off thresholds. Although this may be a limitation, it also suggests that the identified association is robust, as it can be detected regardless of the scale utilized. This review was also limited in its analysis of patients with depression or anxiety that develop DED. Few studies explored this question, so no meta-analysis of results could be conducted. More studies are needed to make conclusions about this aspect of the relationship between DED and depression.
Conclusions
Depression and anxiety are more prevalent and severe in patients with DED compared to control patients. Depression and anxiety were found to be correlated with DED symptoms but not signs. These findings highlight the interrelationship between DED and psychiatric disorders and suggest that depression and anxiety may modulate how patients with DED present. This has important implications for providing appropriate care to patients with these disorders, in terms of both diagnostics and treatment. Further research is needed to elucidate the directionality and mechanism of the association of DED with depression and anxiety.
Footnotes
Author contributions
Monali S. Malvankar-Mehta: Conceptualization, Methodology, Validation, Formal analysis, Resources, Writing-Reviewing and Editing, and Project administration. Amy Basilious: Methodology, Investigation, Data curation, Writing- Original Draft, Reviewing and Editing. Cathy Xu: Investigation, Data curation, Writing- Reviewing and Editing.
Authors’ note
Study concept and design: AB, MM; Acquisition, analysis, or interpretation of data: All authors; Statistical analysis: MM; Drafting of the manuscript: AB; Critical revision of the manuscript for important intellectual content: All authors. This review was not registered and no protocol was prepared. All data are available in the manuscript text, figures, tables, and supplementary materials.
Declaration of conflicting interests
The author(s) declared no potential conflicts of interest with respect to the research, authorship, and/or publication of this article.
Funding
The author(s) received no financial support for the research, authorship, and/or publication of this article.