
Abstract
Introduction
Sleep patterns tend to change with aging, and many older people complain of various sleep issues such as difficulty falling asleep, waking up more frequently during the night, and getting up earlier in the morning (Schroeck et al., 1986; Li et al., 2018; Gulia & Kumar, 2018). The transition between falling asleep and waking up is often abrupt, which makes older people feel like they are lighter sleepers than when they were younger. Older people wake up on average 3 to 4 times each night due to causes including the need to get up to urinate (nocturia), anxiety and discomfort, and pain from long-term (chronic) illnesses. The most common sleep disorder in older adults is insomnia (Cybulski et al., 2019). While the prevalence of insomnia in the general population has been estimated at 10–20%, studies in older adults have found higher frequencies (Bloom et al., 2009). In international research, the prevalence rates of insomnia in older adults range from 12% to 40% (Montgomery et al., 2002). In a study conducted by Foley et al. (1995) of more than 9000 adults over 65 years of age, 42% of the participants had difficulty both falling asleep and staying asleep. The prevalence was higher in older adults in poor health who were taking drugs due to comorbidities. In older individuals, chronic insomnia is a major cause of falls, metabolic diseases and depression (Irwin et al., 2022). Because older people’s sleep is lighter and they wake up more frequently, they may feel sleep deprived, even if their total time asleep has not changed. Sleep problems are also a common symptom of depression, and depressive symptoms are quite prevalent in the older population (Vieira et al., 2014; Wilkinson et al., 2018) and in individuals with sleep problems (Fang et al., 2019).
While the relationship between sleep and inflammation is likely bidirectional, systemic inflammation may also mediate the association between sleep dysfunction and adverse clinical outcomes (Besedovsky et al., 2019; Petrov et al., 2020). Both longer sleep (>8 h; hypersomnia) and insomnia associated with higher levels of inflammation (Dowd et al., 2011; Irwin et al., 2016; Pak et al., 2022), suggesting that both short and long sleep duration and sleep quality are associated with peripheral inflammation. However, other studies have failed to find an association between sleep characteristics and peripheral markers of inflammation (Irwin et al., 2016; Patel et al., 2009).
Among the inflammatory cytokine IL-1β play a crucial role in sleep regulation and it is bidirectional (Krueger et al., 1983; 1998). The somnogenic effects of IL-1β have been demonstrated in several animal models (Krueger et al., 1983, 1984, 1998, 2017). However, after high doses, sleep is disrupted i.e., administration of higher doses of Il-1β decreases in sleep rather than increases (Opp et al., 1991).
In humans, blood levels of IL-1β vary with the sleep-wake cycle. Peak levels of IL-1β occur at the onset of sleep (Moldofsky et al., 1986). Blood levels of IL-1β also increase during sleep deprivation (Hohagen et al., 1993; Uthgenannt et al., 1994). These results are consistent with those in the study by Rethorst et al. (2015), where lower baseline blood IL-1β levels were predictive of greater improvements in insomnia. Similarly, in one of the studies published by Bjorvatn et al. (2020), who measured the influence of shift work on immunological biomarkers, IL-1beta blood levels were higher after both a day shift (14% increase) and a night shift (75% increase) compared to levels after a night’s sleep.
Saliva analysis is a non-invasive method for detecting inflammatory markers in response to emotional states in natural social contexts, and different salivary markers have been investigated in sleep research (Ibañez-del Valle et al., 2021). Collecting saliva also enables easy analysis of biological parameters that change throughout the day. In addition, salivary samples can be collected by studying the participants in their environment, thereby reducing the bias introduced by laboratory-based sampling conditions (Granger et al., 2012).
Correlational studies examining IL-1β levels in saliva and blood yielded different results (La Fratta et al., 2018; Parkin et al., 2023). Specifically, in the work by Lafratta et al. (2018), different immunological biomarkers were detectable in plasma and saliva before and after socio-cognitive stress, and their salivary concentration was significantly and positively associated with variation in the plasmatic concentration of IL-1β, IL-18, and IL-6. Another study (Riis et al., 2015) also showed a significant serum–saliva association in healthy adolescent girls. Indeed, serum–saliva correlations for several inflammatory cytokines in older individuals has been recently studied by Parkin et al. (2023) and found no correlation between IL-1β concentrations in these two biological fluids. Regarding the association between sleep disorders and altered levels of inflammatory cytokines measured in saliva, a recent review by Ibáñez-Del Valle et al. (2021) analysed the relationship between sleep and IL-1β levels in saliva. Interestingly, seven studies analysing IL-1β and sleep were unable to draw any clear conclusions, although these studies were performed in a young population or in patients with sleep apnoea.
This current study was based on the hypothesis that sleep quality is associated with lifestyle health habits, symptoms of depression, and use of hypnotic drugs in community-dwelling individuals. Given the proposed association of some salivary cytokines with sleep quality, we hypothesised that salivary IL-1β concentration could be a potential biomarker for poor sleep quality and could be used to evaluate and specifically discriminate individuals with insomnia. The aims of this study were: (1) to analyse insomnia in community-dwelling older individuals and the role of several factors (depressive symptoms, intake of hypnotics, drinking beverages containing caffeine, smoking and alcohol intake) in sleep regulation; (2) to evaluate whether salivary IL-1β concentration associated with insomnia and the discrimination accuracy of these cytokines can classify individuals with or without insomnia.
Materials and Methods
Study design and population
The research project is based on a cross-sectional study conducted between September 2021 and June 2022. The study population consisted of individuals aged 60 years and older residing in the city of Valencia (Spain) attending the Municipal Activity Centers for the Elderly of Valencia (Centro de Mayores) administered by the Department of Active Aging of Valencia City Council.
This research was conducted according to the requirements of the Declaration of Helsinki, and the entire study protocol was approved by the University of Valencia (Spain) ethical committee (protocol number 1232539, released on 21 May 2020).
Study sample
The study population or target population is made up of people over 60 years of age who were members of the community in the year 2021–2022, attending various leisure and activity centres (Centro de Mayores) for older adults in Valencia (Spain). The sample was obtained by means of non-probabilistic convenience sampling, in which participants were selected according to their accessibility. Once the research team members knew the schedule of activities at the different centres, they presented study the objectives, in a general way, to the individuals participating in these activities. Their collaboration was requested, the assured anonymity of their information was confirmed, and the participants signed their informed consent to participation.
The sample size was calculated using the population estimation, considering the total amount of older adults doing these activities (attending workshops and activities in municipal centres for older people) in Valencia City Council’s centres (N = 901 June 2021-June 2022). A sample size of 282 participants was sufficient to estimate the population of community-dwelling older individuals attending the municipal centres, with an estimation of insomnia symptoms considered to be around 40% (Foley et al., 1995), a 95% confidence interval, and precision of ± 5% units. A replacement rate of 10% has been anticipated. The sample was composed of community-dwelling individuals of both genders aged 60 years and over (unemployed or retired), because they have access to the activities available at these municipal centres from this age onwards.
Information Collection Procedure
For the purposes of data collection, an assessment instrument composed of socio-demographic variables (age, gender, marital status, educational level), the Spanish versions of the Athens insomnia scale (AIS) (Gómez-Benito et al., 2011), the Yesavage Geriatric Depression Scale (GDS) (Sheikh & Yesavage, 1986) was administered to evaluate sleep quality and depressive symptoms, respectively. In order to evaluate the intake of drinks that can influence sleep, we asked the participants to report a mean daily intake of cups of coffee (small coffee (café solo or cortado), coffee with milk (café con leche), American coffee, cups of tea and cola drinks or other energy drinks. In addition, we asked the study participants about their intake of drugs to assist sleep or other psychotropic drugs, and if the answer was affirmative, we asked for the name of the drugs and the intake frequency on a weekly base. We also asked if they used a device with continuous positive airway pressure for sleeping (for obstructive sleep apnoea syndrome). The Alcohol Use Disorders Identification Test-Concise (AUDIT-C) is a brief alcohol screening instrument that reliably identifies individuals who are hazardous drinkers or who have active alcohol use disorders (including alcohol abuse or dependence). The AUDIT-C has 3 questions and is scored on a scale of 0-12 (Bradley et al., 2003). Each AUDIT-C question has 5 possible answers rated from 0 points to 4 points. A score of 4 or more is considered positive for men, and optimal for identifying hazardous drinking or active alcohol use disorders. A score of 3 or more is considered positive in women.
Evaluation of sleep quality and depressive symptoms
The AIS is a psychometrically valid self-assessment instrument designed to quantify sleep difficulty according to ICD-10 criteria. The AIS evaluated 8 qualitative variables, with four dimensions, each assessed by a score between 0 and 3: 0-No problem; 1-Minor problem; 2-Substantial problem; 3-Major problem. The first five AIS items refer to sleep induction, awakening during the night, final awakening, total sleep duration and sleep quality, while the last three refer to well-being, ability to function and daytime sleepiness. For these reasons, we analysed the total AIS score (0-24 score), difficulty in sleeping (0-15 score) and daytime consequences of sleep (0-9 score). A cut-off score of ≥6 on the AIS is used to establish a diagnosis of insomnia (Soldatos et al., 2000). The AIS can be utilized in clinical practice and research, not only as an instrument to measure the intensity of sleep-related problems, but also as a screening tool for reliably establishing the diagnosis of insomnia (Soldatos et al., 2003; Okajima et al., 2020).
The short version of the Geriatric Depression Scale (Yesavage scale, GDS-15) is a widely used depression rating scale for older adults. It has 15 dichotomous items (score 0-15, the higher score the more depressive symptoms), 10 of which indicate the presence of depression when answered positively, while the other 5 are indicative of depression when answered negatively. A score of 0-4 is considered normal; scores of 5 and over indicate possible clinical symptoms of depression, ranging from mild depression to severe depression with the highest scores.
Saliva Collection
The participants were asked to refrain from smoking, eating, drinking, or oral hygiene procedures for at least 1 h prior to the sample collection. The saliva samples were collected between 10 am and 4 pm using the using the Salivette® system (Sarstedt, Germany). The samples were collected from the participants when they went to healthy ageing centres, where several programs/activities for older adults are organised by the Valencia City Hall (Spain). The saliva samples were then transported to the lab at 4°C in cool boxes with ice packs and were processed within 2 hours from the time of collection. Each sample was centrifuged to remove mucins, insoluble material and cellular debris and the supernatant was aliquoted into Eppendorf tubes and frozen (−80°C) until further analysis. The samples (100uL) were brought to room temperature, and immunoassay ELISA analysis was performed using the High Sensitivity Human Elisa Kit for IL-1β (Ab214025, Abcam, Netherlands) according to the manufacturer’s instructions. Changes in colour intensity and absorbance at 450 nm and 490 nm were read using an ELISA microplate reader (LT-5000MS, LabTech company, Sorisole, BG, Italy), and a standard curve was prepared by plotting absorbance readings of standards against their concentrations. The sensitivity of the commercial kit was 5.64 pg/ml. and the lower and upper limits of detection were 14.06–900 pg/ml. The intra and inter-assay coefficients of variance were 4.8% and 5.6%, respectively.
Statistical Analysis
Descriptive statistics, including measurements of the central tendency (mean), standard error of the mean (SEM), and range values were used to describe all the quantitative variables. The normal distribution of each variable was estimated with the Kolmogorov-Smirnov test. The Mann-Whitney U and Kruskal-Wallis tests were used to compare means between the quantitative variables, and the Chi-square test to compare proportions. Spearman’s linear correlation coefficient was used to establish the correlation between the quantitative variables. Logistic regression was performed to try to determine which variables were related to insomnia by making a predictive model of insomnia symptoms including variables that had been significant in the bivariate analysis. This technique can be used to simultaneously assess several factors presumed but necessarily related to the dependent variable, in our case insomnia symptoms (AIS≥6 and AIS≥9). Thus, we obtained measurements (odds ratios) of the association between each variable adjusted to all the other variables to detect possible interactions between them and the effect studied. The regression model was repeated twice using the two different AIS cut-off points (AIS≥6 and AIS≥9).
The discrimination accuracy of the predictive model for salivary IL-1β concentration between insomnia versus no insomnia or no insomnia/mild insomnia versus moderate/severe insomnia were calculated using C-statistics (the area under the receiver operating characteristic curve (ROC); AUC) and the Youden index, J. The sensitivity, specificity, and Youden’s J were calculated for each IL-beta score. Youden’s J is the maximum vertical distance from the ROC curve to the line between (0, 0) and (1, 1). When sensitivity and specificity are equally weighted, the optimal cut-off point is the point with the highest value of J, calculated according to the formula (sensitivity + specificity – 1) (Perkins & Schisterman, 2006). Statistical significance was set at p < 0.05. The statistical analysis was performed using the SPSS 28.0 software package (SPSS Inc., Chicago, IL, USA).
Results
Characteristics of the Study Sample
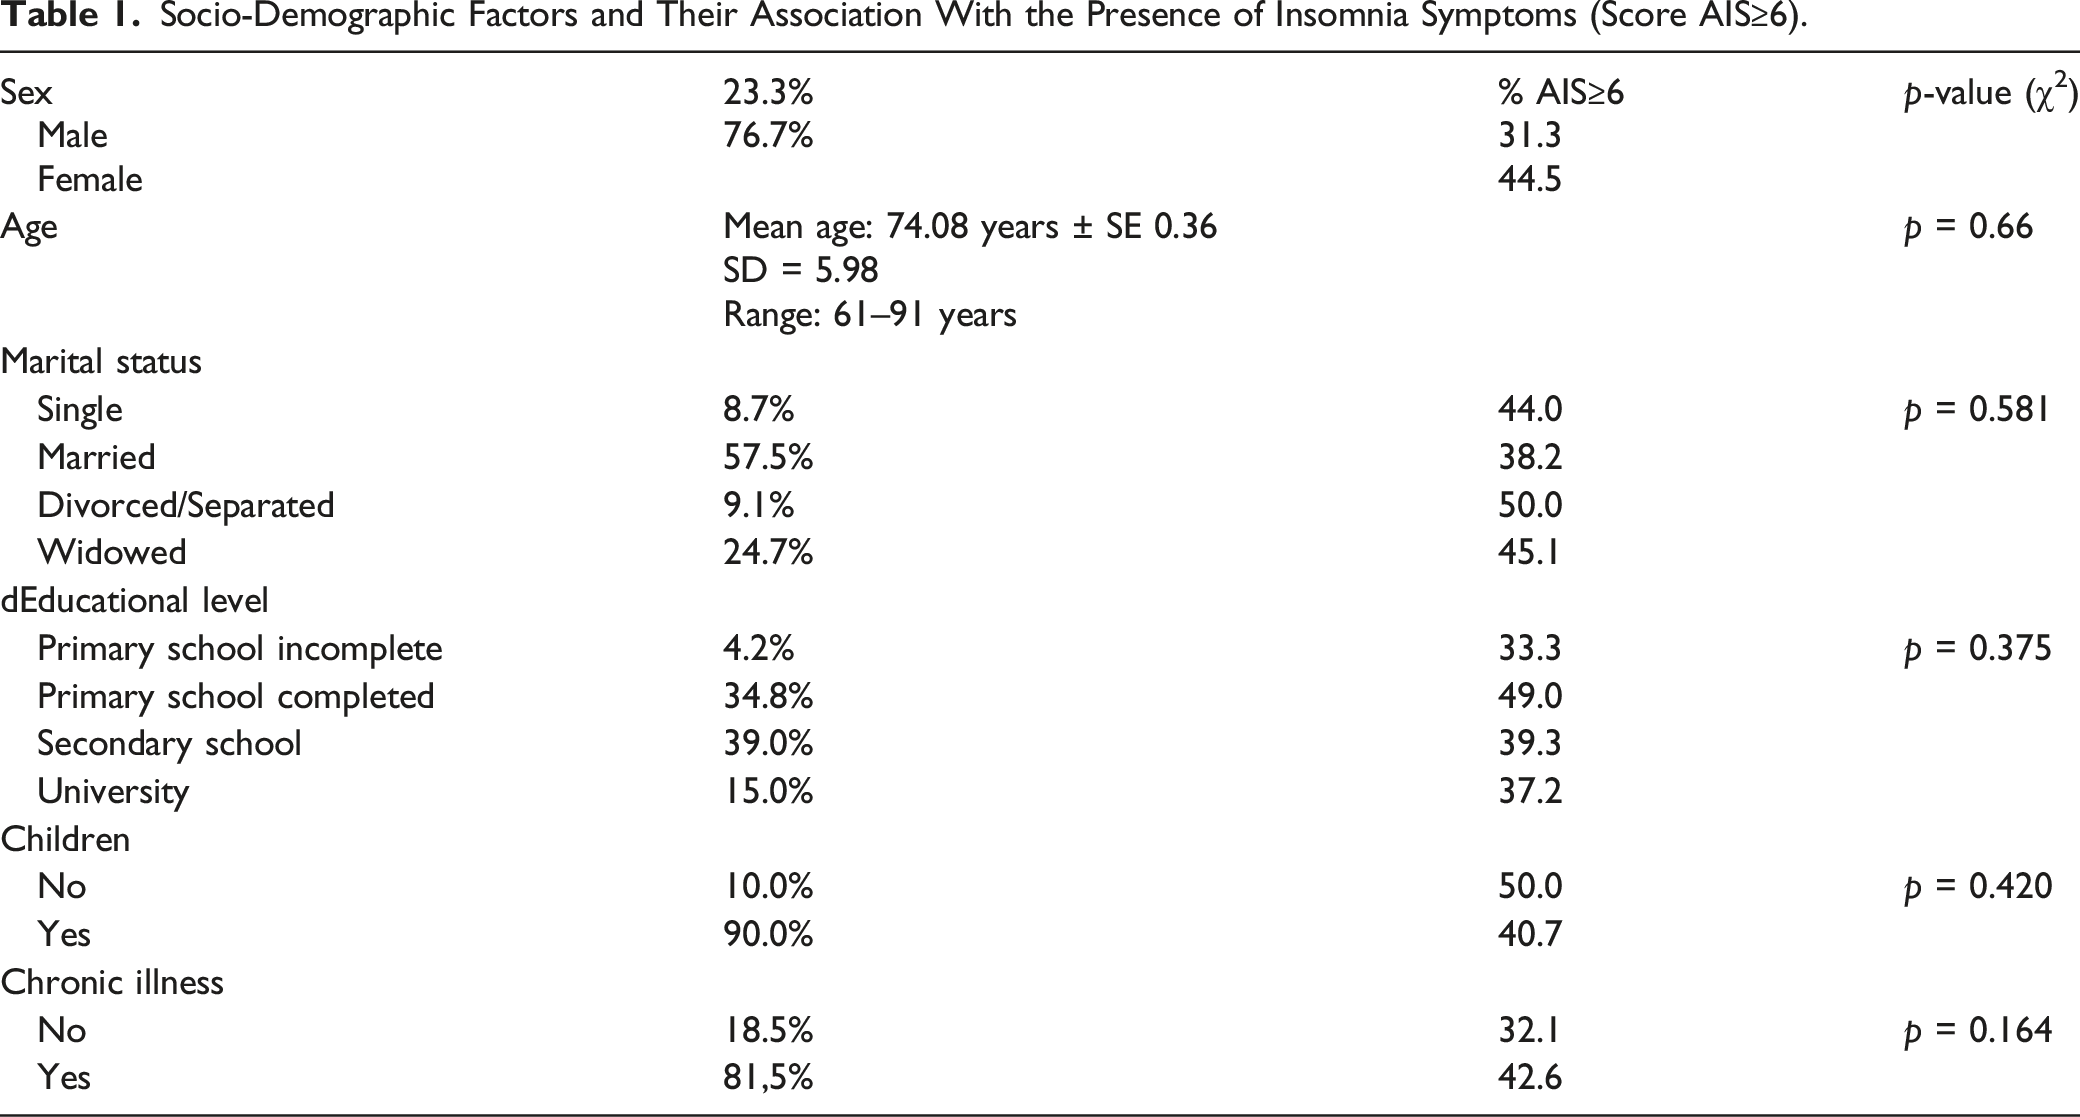
The sample studied was composed of 287 older adults (mean age 74.08 ± 0.36 years (age range 61–91 years). Women accounted for 76.7% (n = 220) of the sample. The marital status of the sample was the following: Single (8.7%), Married (57.5%), Divorced/Separated (9.1%) and Widow/er (24.7%). Regarding the educational level, 4.2% of the participants had not completed primary school, 34.8% had completed primary school, 39.0% had completed secondary school, and 15.0% had completed university. Finally, 7.0% of the sample did not answer this question. 81.5% of the sample (n = 234) reported suffering from at least from one chronic disease.
Coffee, Tea, Cola and Alcohol Consumption
41.8% did not drink coffee, 32.1% drank a cup of coffee a day, 20.2% drank it twice a day, and 5.7% drank it three times a day. 87.8% did not drink tea, 10.5% drank a cup of tea per day, and 1.7% drank it twice a day. 96.9% did not drink cola drinks and 3.1% drink them 1-2 times a day. Only 3.8% were smokers. 70.0% did not drink any alcoholic beverage. Based on their AUDIT-C cut-off score (men ≥ 5 and women ≥4), 14.3% (n = 41) of the sample had a risky alcohol intake.
Sleep Quality, Depressive Symptoms and Psychotropic Drug Use
Socio-Demographic Factors and Their Association With the Presence of Insomnia Symptoms (Score AIS≥6).
The total AIS score was significantly higher in individuals taking drugs for sleeping comparing with those not taking those drugs (p < 0.001, Mann-Whitney test) (Figure 1a). Women had significantly higher AIS scores (more insomnia symptoms) compared with men (p = 0.025, Mann-Whitney test) (Figure 1b). No significant correlation was found between AIS score and age (p = 0.553, Spearman’s correlation test). There was no significant difference in AIS scores based on marital status (p = 0.12, Kruskal-Wallis test) or educational level (p = 0.23, Kruskal-Wallis test). There was no significant difference between smokers and non-smokers for the AIS score (p = 0.603, Mann-Whitney test). There was a significant difference for the AIS score according to coffee intake (p = 0.030, Kruskal-Wallis test) (Figure 1c), but no significant differences according to the intake of cups of tea (p = 0.051, Kruskal-Wallis test), or cola drinks (p = 0.513, Kruskal-Wallis test). There were significant differences in AIS scores between individuals who drink alcohol (any intake) compared with those did not (p = 0.005, Mann-Whitney test). For the AUDIT-C cut-off score for risk alcohol intake (men ≥ score 5 and women ≥ score 4), there was a significant difference in insomnia symptoms between individuals who had risky alcohol intake compared to other individuals (p = 0.019, Mann-Whitney test) (Figure 1d). Insomnia symptoms depending on use of drugs for sleeping (a); gender (b); Coffee intake (c); Alcohol intake (d). * p < 0.05 ** p< 0.001.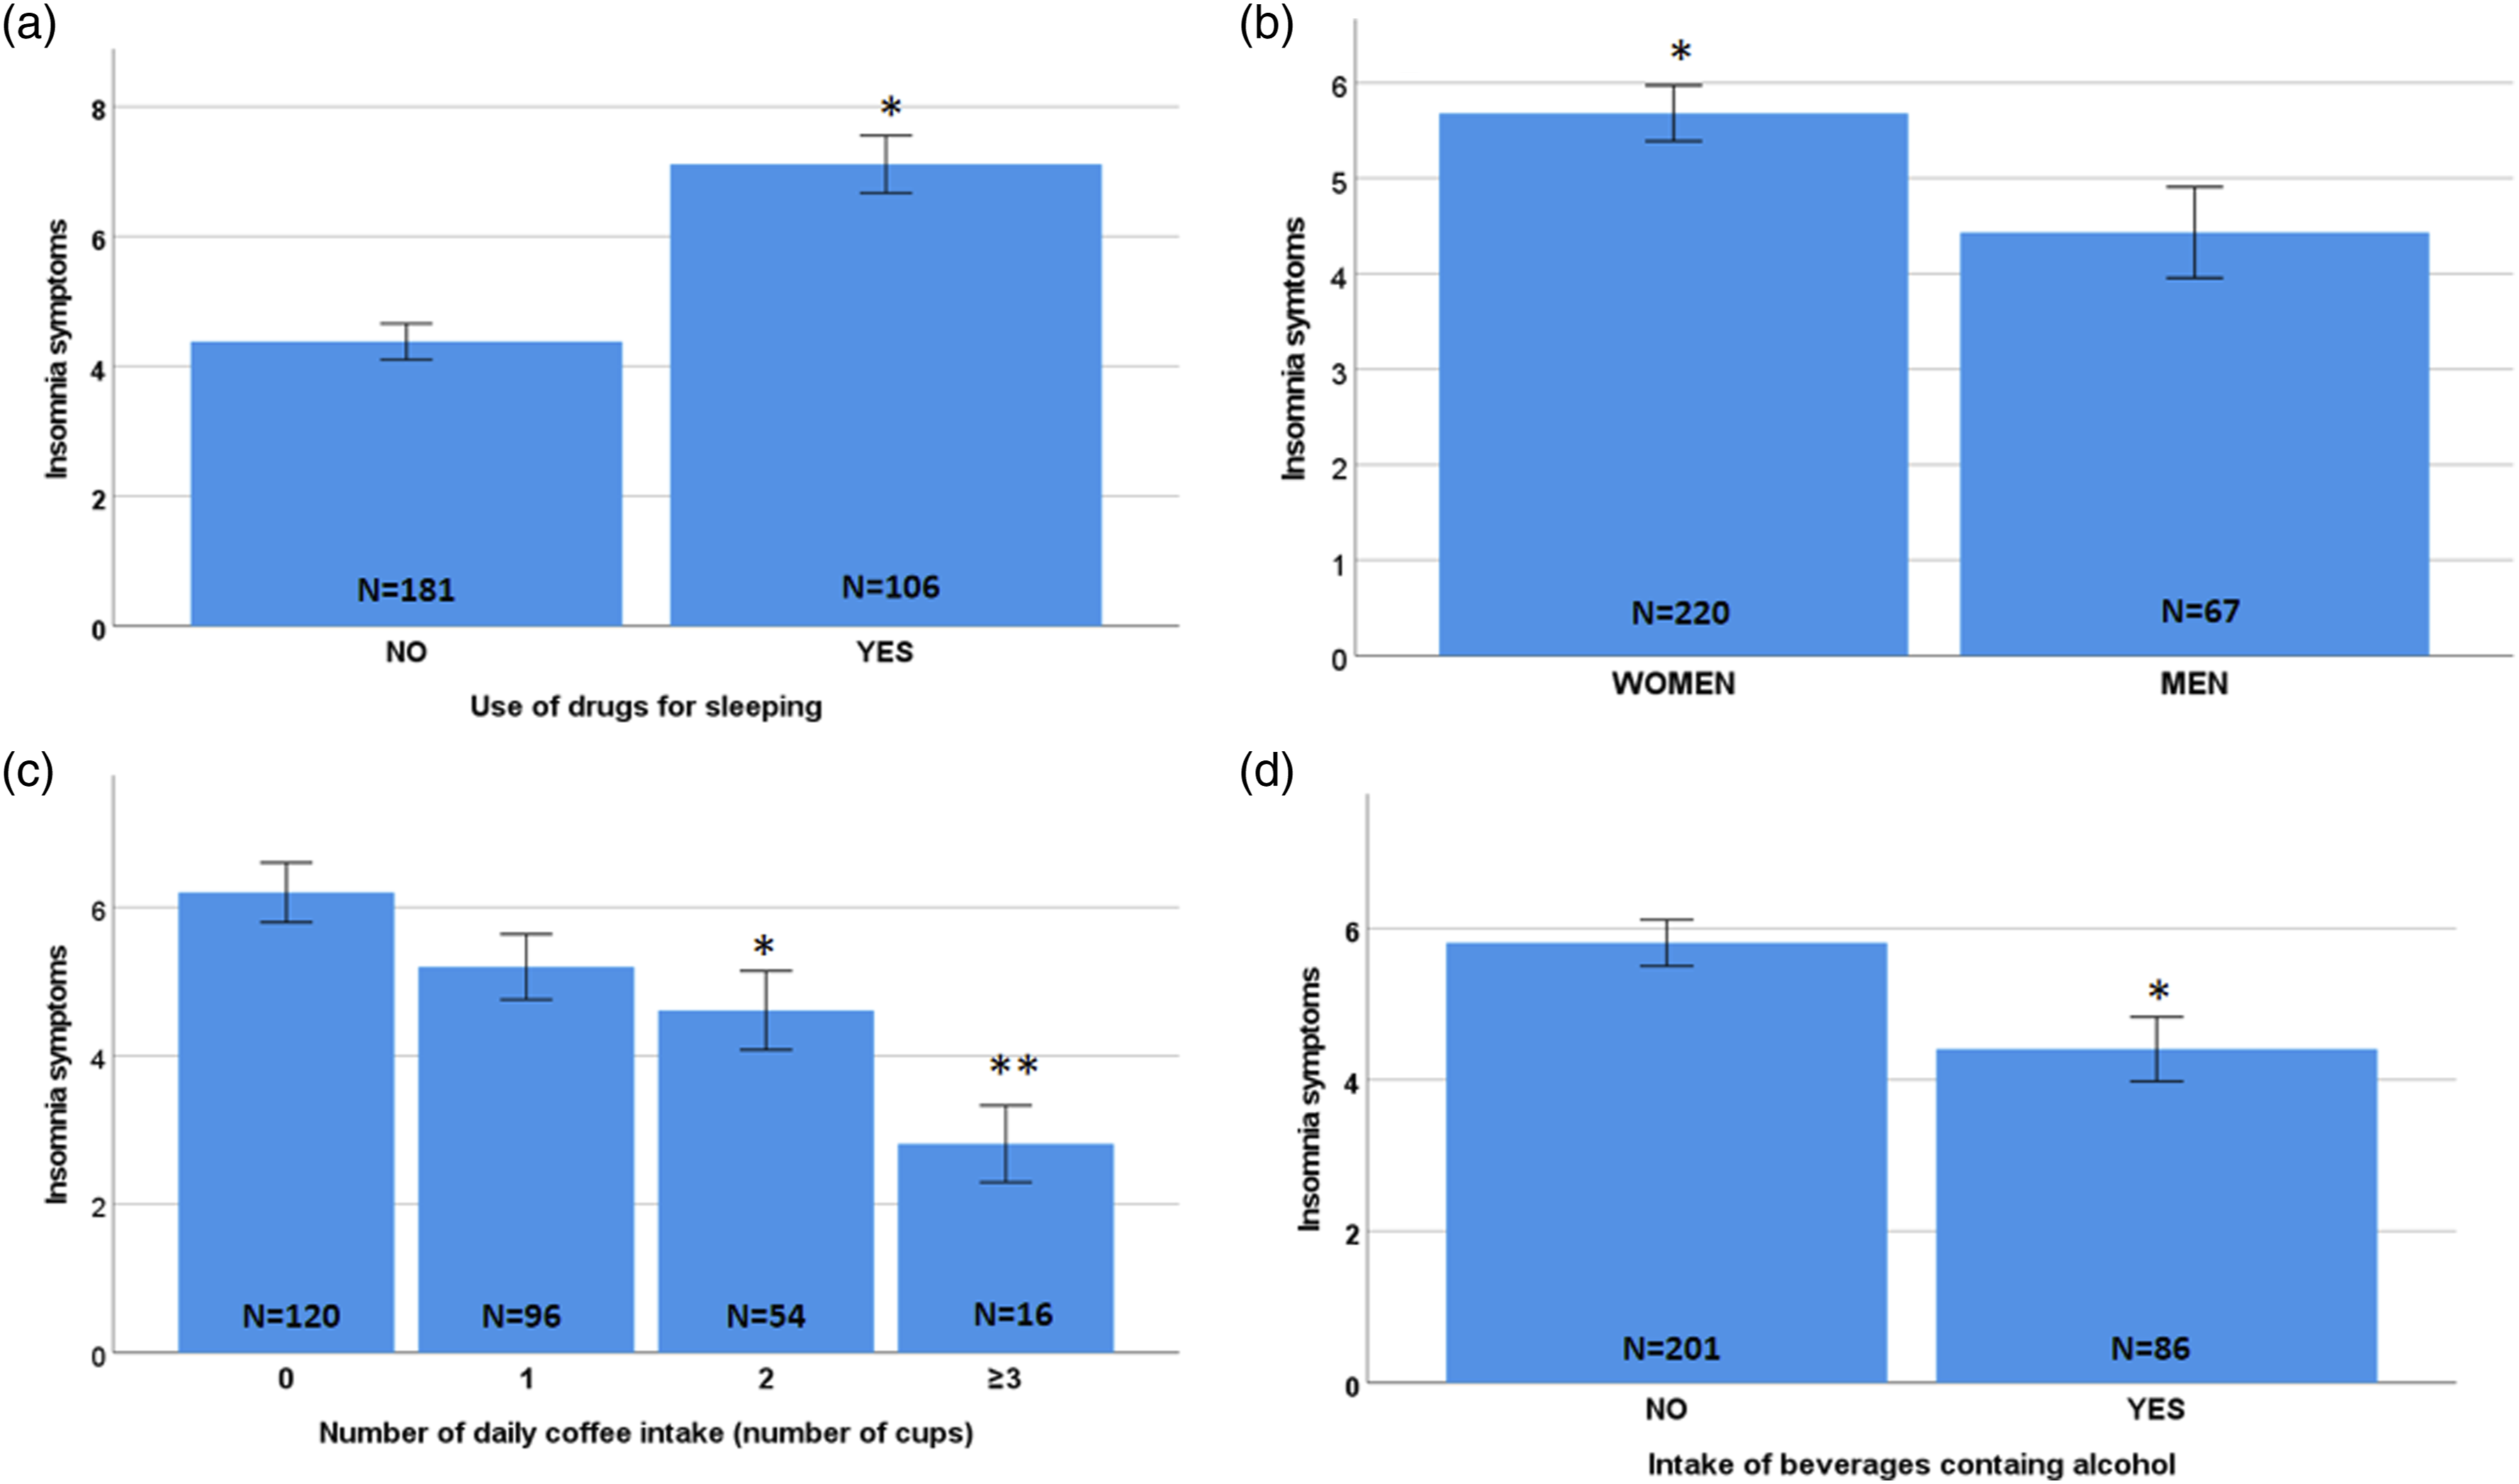
For depressive symptoms, the mean GDS score was 4.28 ± 0.15. Based on the suggested cut-off of 5, we found that 32.4% of participants (n = 93) had relevant depressive symptoms. There was no significant difference in GDS scores based on genders (p = 0.10, Mann-Whitney test), marital status (p = 0.65, Kruskal-Wallis test) or educational level (p = 0.26, Kruskal-Wallis test). No significant correlation was found between GDS score and age (p = 0.675, Spearman’s correlation test). There was no significant difference between smokers and non-smokers for GDS scores (p = 0.225, Mann-Whitney test), or for the number of daily cups of coffee (p = 0.674, Kruskal-Wallis test), or tea (p = 0.620, Kruskal-Wallis test), or cola drinks (p = 0.601, Kruskal-Wallis test) or between individuals who drank alcohol compared with those who did not (p = 0.163, Mann-Whitney test).
There was a significant direct correlation between GDS and total AIS insomnia (rho = 0.225, p < 0.001), and with the sleeping difficulty domain (rho = 0.352, p < 0.001) and the daytime sleepiness domain (rho = 0.352, p < 0.001). Confirming this, individuals with GDS score ≥ 5 had significantly higher scores for insomnia symptoms than individuals with a GDS score < 5 (p < 0.001, Mann-Whitney test).
Salivary IL-1 Beta Concentration and Its Relationship With Insomnia and Depressive Symptoms and Hypnotic Drug Use
Mean salivary IL-1β concentration was 1.34 ± 0.06 pg/µL (0.17-3.97 range). Fifty participants out of 287 had missing values for IL-1β due to xerostomia (41 individuals), which led to low levels of saliva volume, or because the concentration of IL-1β was below the limit of detection (9 individuals). There was a significant correlation between the IL-1β and the total AIS score (rho = −0.302, p < 0.001, Spearman’s correlation test), the sleep difficulty subdomain (rho = −0.259, p < 0.001, Spearman’s correlation test), and the daytime sleepiness subdomain (rho = −0.322, p < 0.001, Spearman’s correlation test). Based on the cut-off AIS score of 6, there was a significantly lower IL-1β concentration in individuals with insomnia compared to those without (1.14 ± 0.085 pg/µL and 1.50 ± 0.08 pg/µL, respectively; p = 0.001, Mann-Whitney test). When comparing individuals without insomnia with those with insomnia, we found that IL-1β levels were significantly lower in those with moderate or severe insomnia compared to those with no or mild insomnia (p < 0.001, Kruskal-Wallis test; Figure 2a). Dunnett’s post-hoc test revealed that individuals with moderate or severe insomnia had significantly lower concentrations of IL-1β than individuals with no insomnia or mild insomnia (p < 0.05 in each comparison). Next, we analyzed whether salivary IL-1β concentrations differed based on the variables with a significant effect on the AIS score. No differences were found in IL-1β concentrations between genders (p = 0.259, Mann-Whitney test), or according to daily coffee intake (p = 0.271, Kruskal-Wallis test), or between individuals who drank alcohol and those did not (p = 0.876, Mann-Whitney test). Salivary IL-1β concentration was significantly lower in individuals taking drugs for sleeping comparing with those who were not (1.11 ± 0.09 pg/µL and 1.48 ± 0.08 pg/µL, respectively; p = 0.001, Mann-Whitney test; Figure 2b). Salivary IL-1 beta concentration depending on insomnia symptoms severity (a) and use of drugs for sleeping (b). * p < 0.05.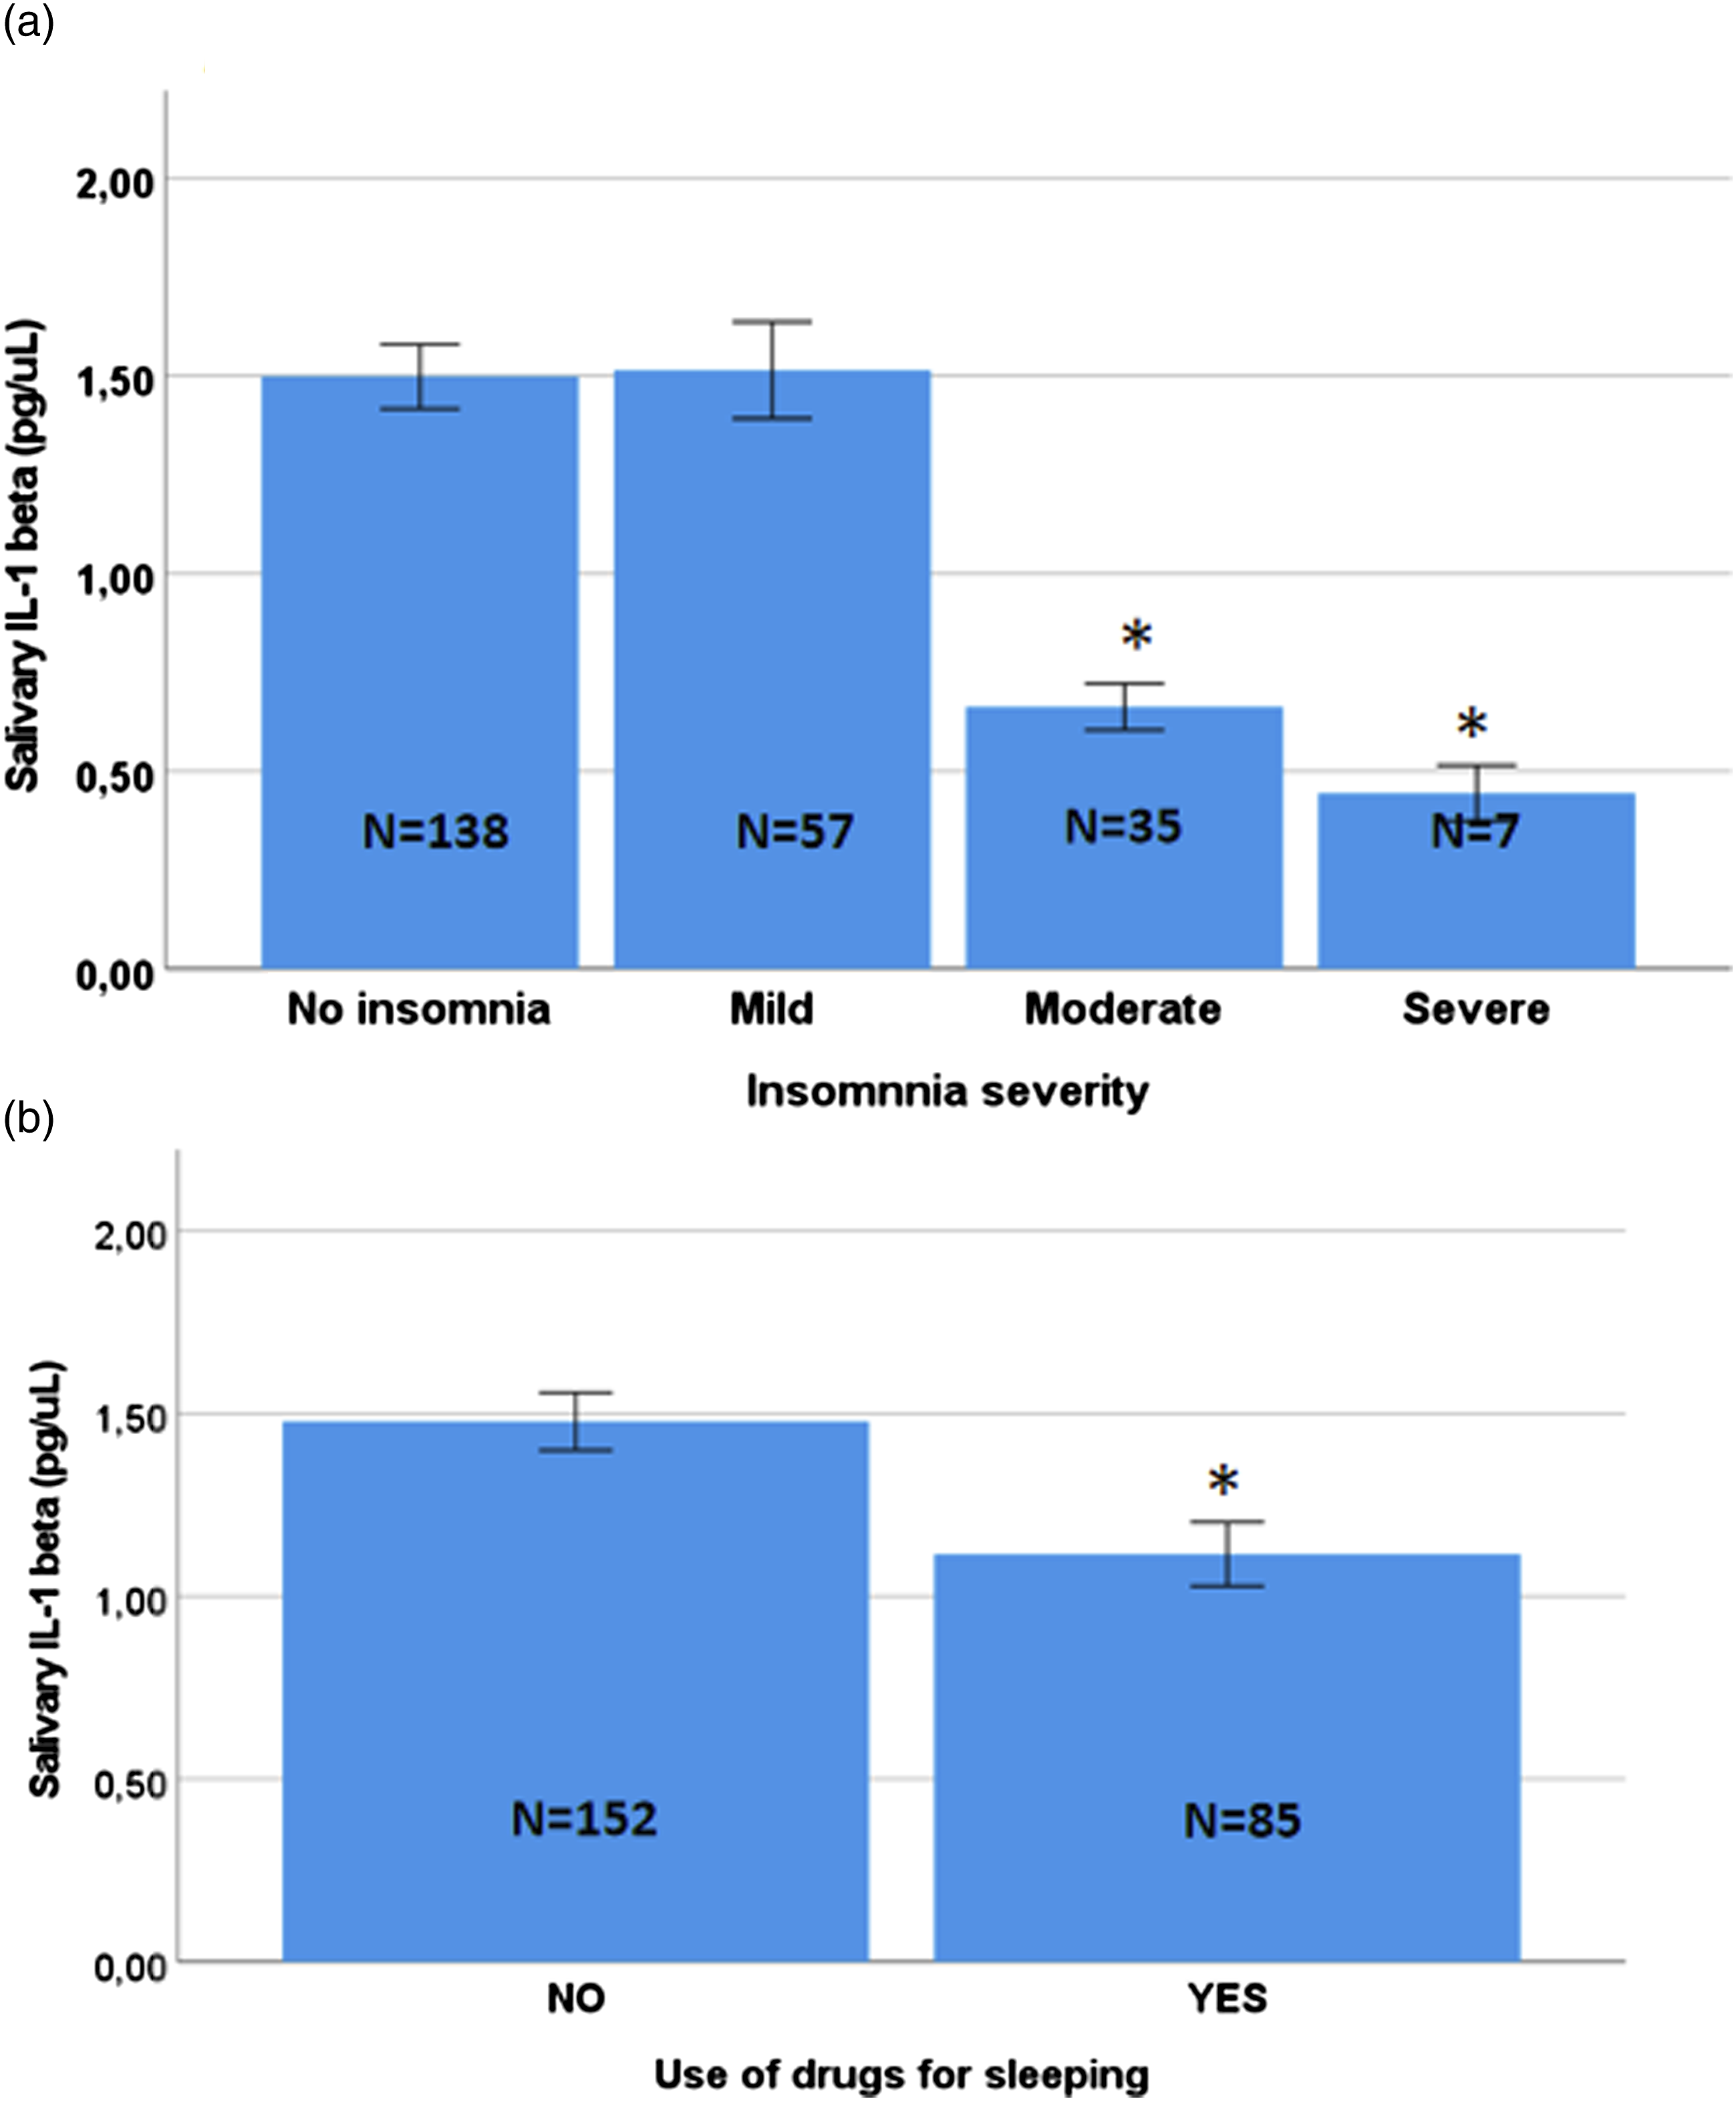
No significant correlation was found between salivary IL-1β concentration and GDS scores (rho = −0.076, p = 0.244, Spearman’s correlation test). Based on the suggested cut-off of GDS, individuals with a GDS score ≥ 5 had similar concentrations of IL-1β to individuals with a GDS score < 5 (1.35 ± 0.11 pg/µL and 1.35 ± 0.07 pg/µL, respectively; p = 0.535, Mann-Whitney test).
Variables associated with insomnia: logistic regression analysis
Explanatory Variables Included in the Initial Model.
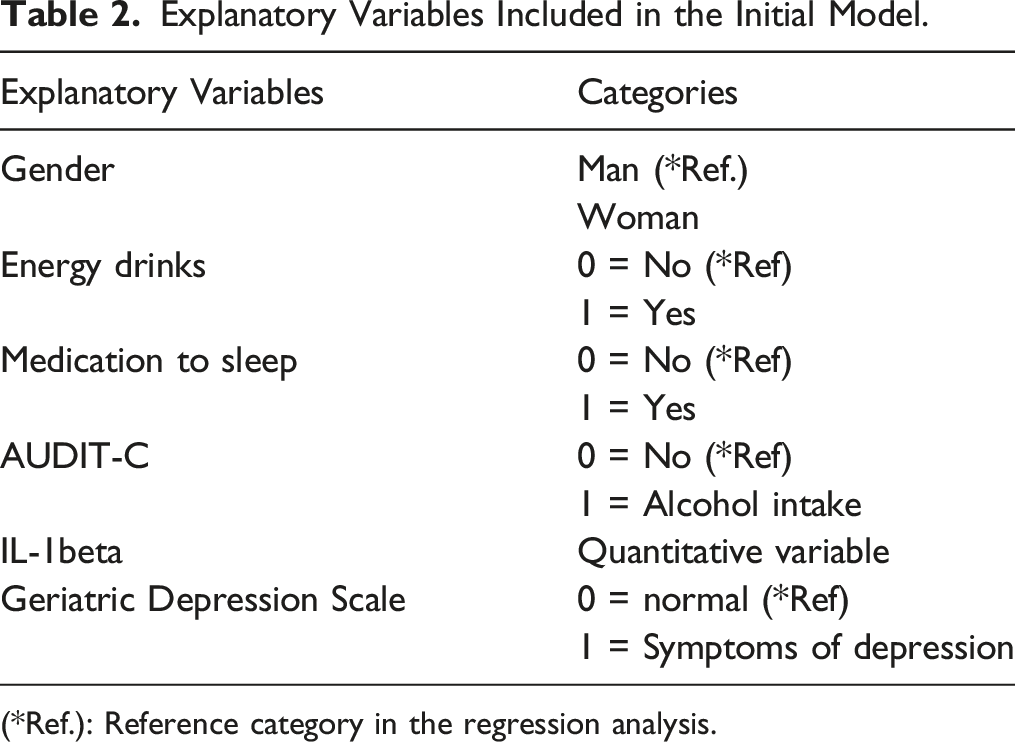
(*Ref.): Reference category in the regression analysis.
Final Logistic Regression Model: Variables Associated With Insomnia (AIS≥6 and AIS≥9).
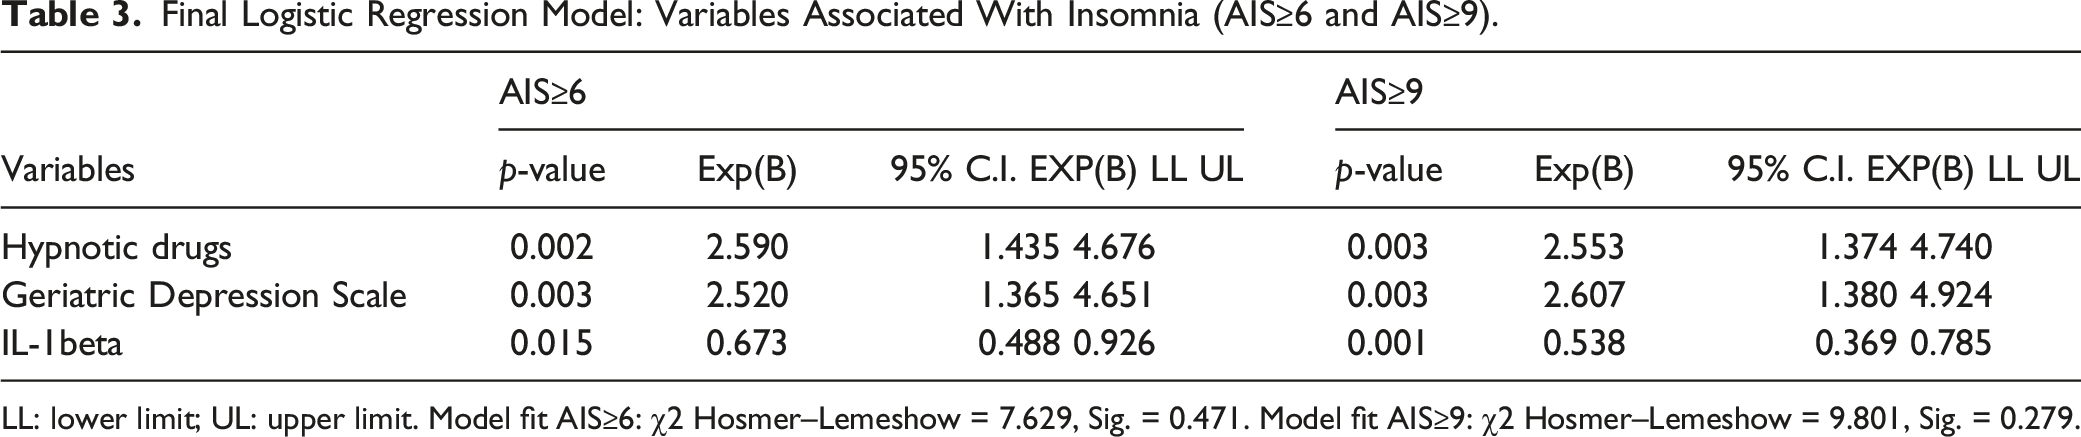
LL: lower limit; UL: upper limit. Model fit AIS≥6: χ2 Hosmer–Lemeshow = 7.629, Sig. = 0.471. Model fit AIS≥9: χ2 Hosmer–Lemeshow = 9.801, Sig. = 0.279.
The consumption of hypnotic medications was related to whether the participants had insomnia (AIS≥6) or not, with the risk of having problems sleeping being 2.590-fold among participants who did use these medications. The Geriatric Depression Scale score was also related to insomnia, with the presence of symptoms of depression (GDS≥5) increasing the risk of insomnia by 2.520 times. Similarly, IL-1β levels were also related to insomnia (OR = 0.673). Moreover, the results were similar when the AIS ≥9 cut-off was used.
ROC Analysis, Specificity and Sensitivity and Youden J of Salivary IL-Beta Concentration for Insomnia
We used a receiver operating characteristic curve (ROC) as a useful tool for evaluating the diagnostic power of salivary Il-1β for detecting insomnia, categorized as no insomnia versus insomnia symptoms, and no insomnia/mild insomnia symptoms versus moderate/severe insomnia. This analysis provided an exhaustive perspective on the trend of sensitivity for all cut-offs, and thus provided information about the relationship between the sensitivity and the specificity, by selecting the dichotomous variable of the Athens Scale “no insomnia 0-5 points and insomnia ≥6 points” as the dependent variable. The value of the area under the curve was 0.65, with a 95% CI of 0.57 to 0.72 with acceptable values, and with a cut-off value of 0.98 it had a sensitivity of 58.1% and a specificity of 67.5% (Figure 3a). We found significant effects with IL-1β concentration (p < 0.001), OR = 2.44 (95% CI 1.48–4.01). As with the dichotomous Athens Scale (no insomnia, mild insomnia score 0-8 and moderate and severe insomnia score > 9), a significant association was found with the concentration of IL-1β (p < 0.001), OR = 4.95 (95% CI 2.60–9.04) (Figure 3b). The value of the area under the curve was 0.78, with a 95% CI of 0.71 to 0.85 with acceptable values, and with a cut-off value of 0.83 it had a sensitivity of 70.3% and a specificity of 69.8%. This means that the probability of correctly detecting people with moderate/severe insomnia by measuring salivary IL-1β was 70.3% (sensitivity) while the probability of correctly diagnosing a person without moderate/severe insomnia was 69.8% (specificity). ROC analyses for sensitivity and specificity of IL-1 beta to discriminate individuals with no insomnia versus insomnia (a) and individuals with no insomnia or mild insomnia versus moderate/severe insomnia symptoms.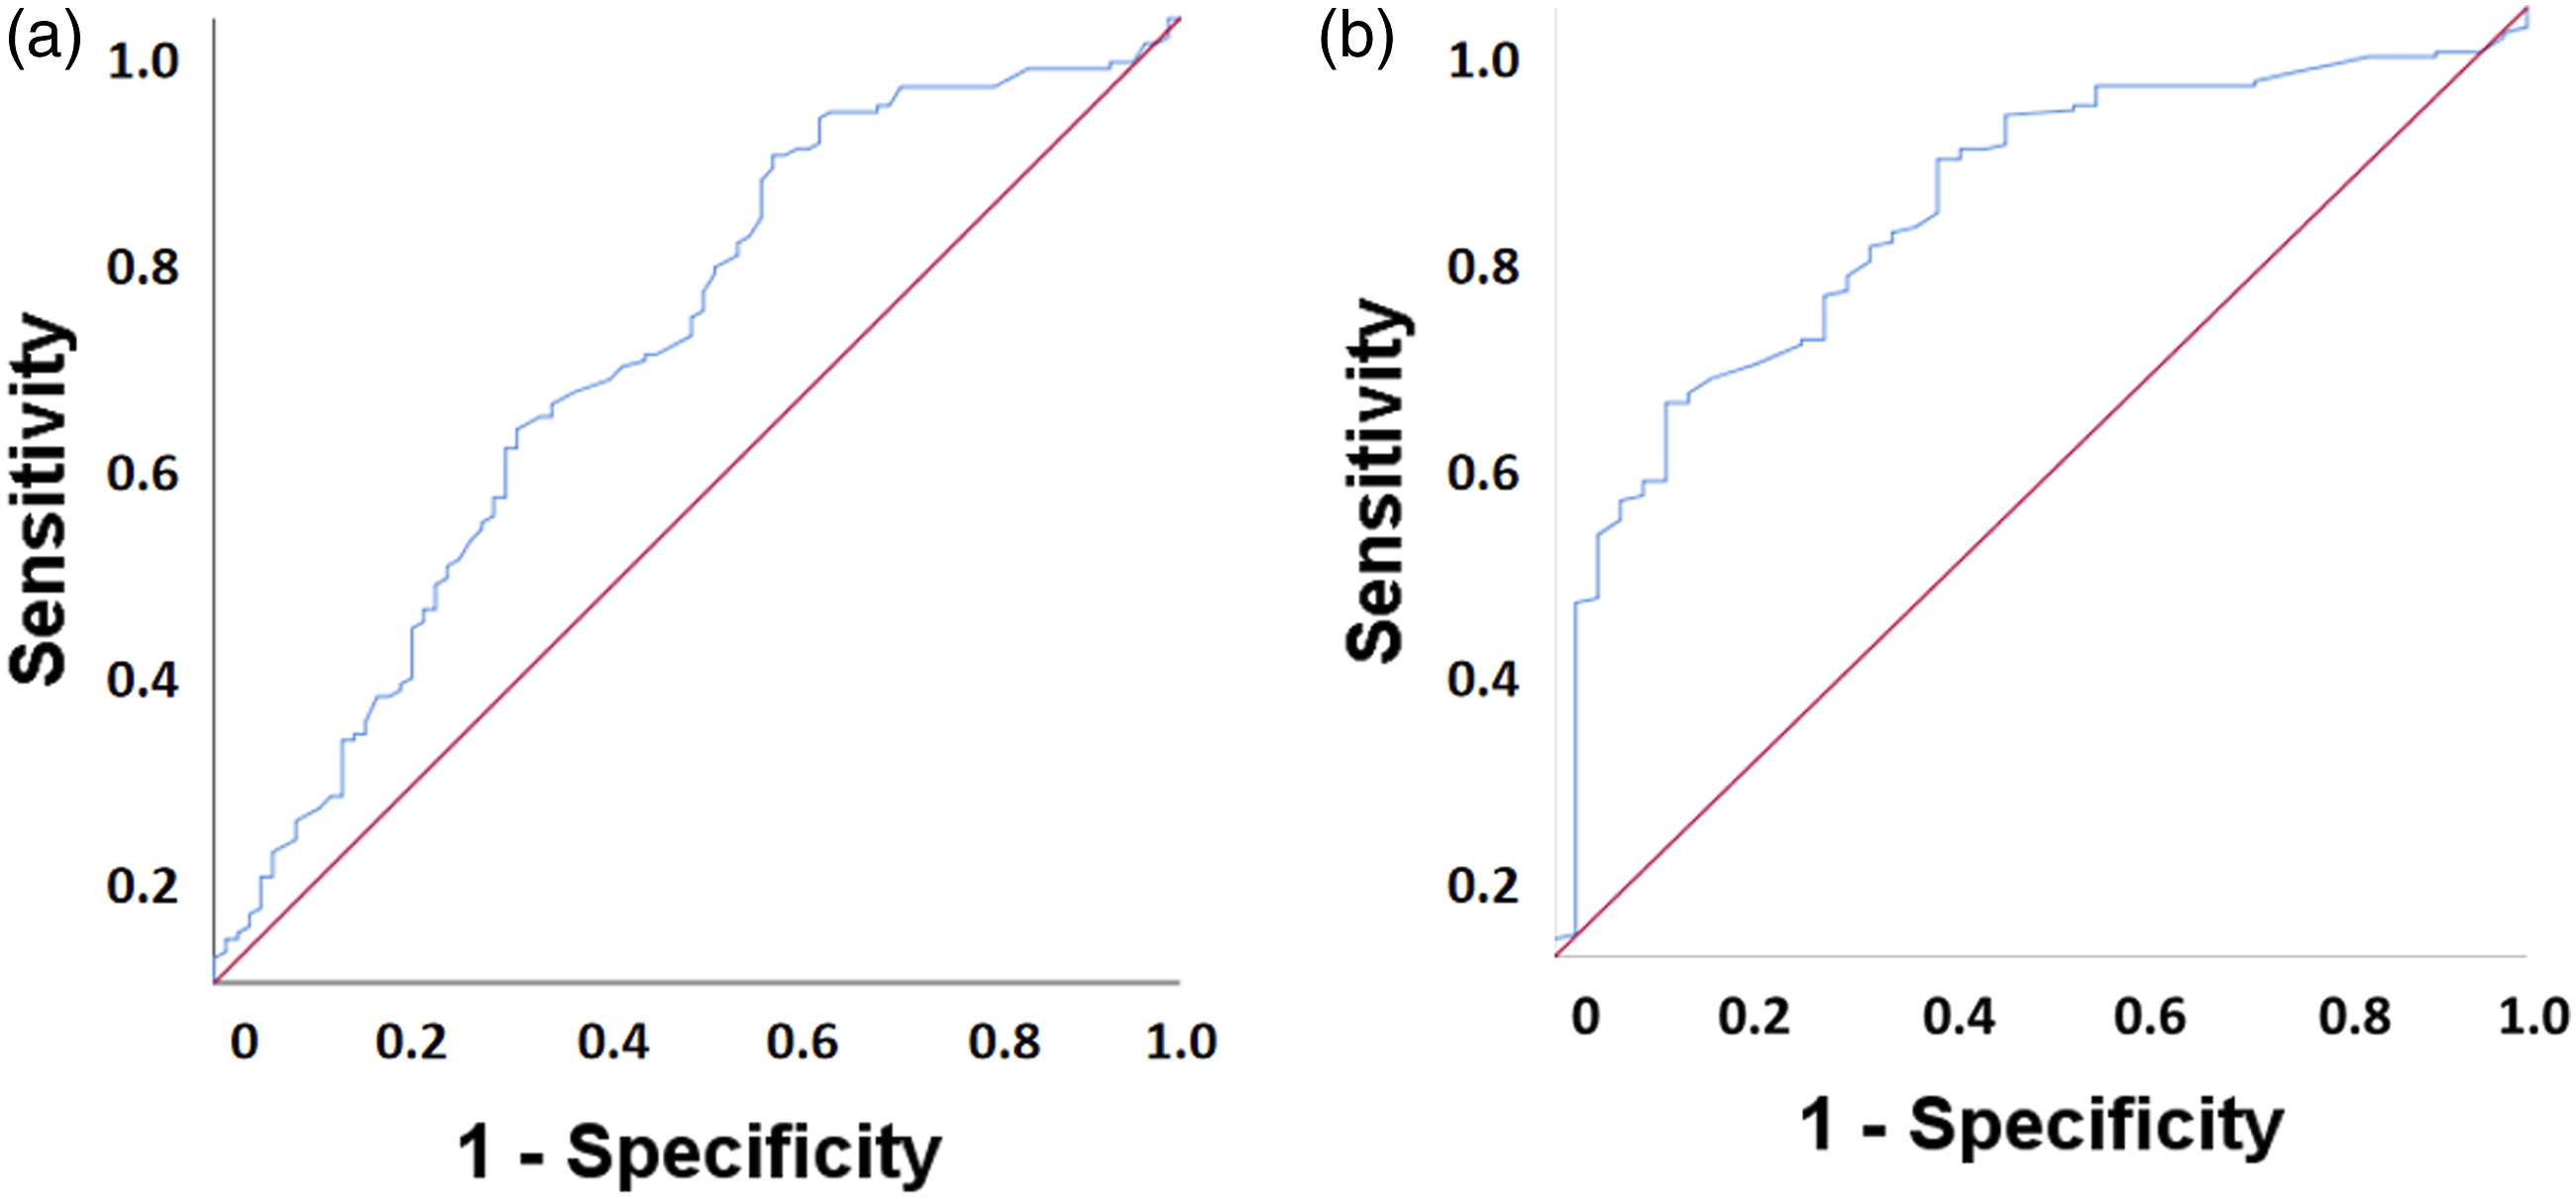
In order to identify the most appropriate cut-off point value for IL-1β in saliva, the sensitivity and specificity for each of the IL-1beta values on the dichotomous Athens Scale score was calculated, with two possible cut-off points: “no insomnia 0-5 points and insomnia ≥6 points” and “no insomnia, mild insomnia score 0-9 and moderate and severe insomnia score > 9", as well as the Youden index. It was established that the cut-off point would be the IL-1beta value equivalent to the highest value of the Youden index. In the first dichotomization of the insomnia variable (“no insomnia 0-5 points and insomnia ≥6 points) was established at an IL-1beta value of 0.6450 (a Youden’s J of 0.2798). In contrast, taking 9 points on the Athens scale as the cut-off (no insomnia, mild insomnia score 0-9 and moderate and severe insomnia score > 9), the cut-off point was set at IL-1β value 0.9750 (a Youden’s J value of 0.4683).
Discussion
The main results of this study show how poor sleep quality is highly prevalent in a sample of community-dwelling older adults. Difficulty sleeping is common in older adults and is frequently attributed to changes that age causes in sleep architecture. However, these changes do not necessarily imply sleep disturbances and lead to insomnia (Gras et al., 2009). As in other studies (Patel et al., 2018), our results show a high prevalence of insomnia symptoms in those over 60 years of age who live in the community, where 41.5% of the participants presented symptoms of insomnia. Difficulty initiating sleep, followed by daytime sleepiness, were the most commonly reported insomnia symptoms in our sample. These findings are similar to those published in previous studies (Rodrigues et al., 2022). Due to the high prevalence of this disorder and its influence on quality of life, in the context of an aging population, poor sleep quality is a problem with important medical and social repercussions (Clement-Carbonell et al., 2021; Chattu et al., 2018). This study showed that several factors e.g., gender, depressive symptoms, intake of hypnotic drugs and consumption of beverages containing caffeine and alcohol are associated with insomnia symptoms at these ages.
Community-dwelling older women reported insomnia symptoms to a greater extent than men (Guidozzi, 2015), as also reported previously in the general population of Spain in a representative sample of 4065 individuals aged 15 years or older (Ohayon & Sagales, 2010). More insomnia symptoms and the consequent poorer sleep quality in women could be due to multiple factors, such as hormonal changes (menopause) (Patel et al., 2018) and greater susceptibility to stressful changes associated with life trajectories (Arroll et al., 2012). There are also biological factors, such as the production rate of serotonin, the precursor of the key-inducing sleeping hormone melatonin, which is lower in women than in men (Cahill, 2006; Nishizawa et al., 1997).
As for the relationship between sleep quality and lifestyles, we found that the intake of alcoholic beverages (and even low intakes) can positively influence insomnia symptoms, so that individuals who drank alcohol-containing beverages presented fewer insomnia symptoms compared to those who did not. It is therefore possible that a low intake of alcohol-containing beverages in the evening may help with falling asleep due to its hypnotic effect. Interestingly, 14% of the study’s participants had a risky alcohol intake as assessed by the AUDIT-C screening tool, confirming recent trends about increased alcohol consumption in old age over the last decade (Keyes et al., 2019). This represents a challenge for healthcare professionals and researchers as regards assessments of insomnia symptoms and alcohol intake among older adults in future studies, as this issue has an enormous social and health impact. For coffee consumption, we found that individuals consuming 3 or 4 cups of coffee a day had fewer insomnia symptoms compared to individuals that did not drink coffee, probably due to tolerance of its effects in the former group (Weibel et al., 2020; 2021), or it may be plausible that older people with poor sleep quality are aware of the stimulatory effects of caffeine and therefore limit their intake of drinks containing caffeine (Curless et al., 1993). The adverse effects of caffeine on insomnia symptoms can be more severe in people who only use caffeine occasionally compared with those who use it every day. Indeed, at a population level the association between caffeine use and insomnia symptoms depends on habitual sleep duration (Chaudhary et al., 2016). In our study, more than one third of the participants referred intake of prescription drugs for sleep problems, with benzodiazepines being the most commonly consumed (33.1% of the entire study sample), confirming previous reports concerning the Spanish older population from a decade ago (Ohayon & Sagales, 2010). We found that insomnia symptoms were more common in individuals taking hypnotic drugs than in those not taking those drugs. Similarly, a study conducted in Sweden by Hägg et al. (2014) of older adults between the ages of 60 and 93 years-old reported that the use of hypnotic drugs did not improve sleep in many older adults. A study by Castelló-Doménech et al. (2016) conducted in institutionalized older adults in Spain, found no significant differences in sleep quality between participants who took hypnotic or psychotropic drugs and those who did not. These results point to new clinical considerations, because if the effect of sedative-hypnotics on sleep is low, the use of these drugs should be re-evaluated (Diem et al., 2014).
The present study is also one of the first to explore associations between the level of IL-1β measured in saliva and sleep quality in older people. In general, increases in inflammation are thought to detrimentally affect sleep quality (Besedovsky et al., 2022). However, evidence shows that in addition to being a product of the peripheral immune system, IL-1β and its receptors are also expressed in the central nervous system (CNS) (Manfridi et al., 2003). Likewise, the CNS not only responds to changes in the peripheral concentrations of these cytokines, but they are also produced and act in the CNS, thereby supporting the idea that these cytokines have functions beyond immune responses (Imeri & Opp, 2009) including the modulation of memory, mood, and sleep (Clinton et al., 2011). In this regard, IL-1β has been implicated in regulating sleep and non-rapid eye movement (NREM) sleep in several animal species (Krueger & Majde, 2003).
Our results support a role for IL-1β in the regulation of physiological sleep because lower levels of salivary IL-1β were observed among participants who reported more symptoms of insomnia. Likewise, the salivary concentration of IL-1β was significantly lower in individuals taking medications to aid their sleep who, in turn, had more symptoms of insomnia. It should be noted that negative life events or those perceived as such, can stimulate the hypothalamic-pituitary-adrenocortical (HPA) axis and consequent production of cortisol. The latter generates an anti-inflammatory response that downregulates IL-1β production (Zefferino et al., 2021). Therefore, HPA axis hyperactivity could be a biologically plausible mechanism to explain the association between sleep disturbance and decreased IL-1β production. However, it is also possible that more sustained activation of the immune system leads to increased IL-1β release and consequently, improved sleep duration and efficiency. Hence, the association with IL-1β, sleep, and other inflammatory markers should be further evaluated.
Within the framework of biomarker analysis, ROC curves are the most popular graphical tool for evaluating the diagnostic power of biomarkers (Swets, 1996; Zou et al., 2007; Florkowski, 2008). This type of analysis defines both the diagnostic accuracy of the potential biomarker and its optimal cut-off value (Swets, 1996; Unal, 2017). In our case, ROC analysis demonstrated that IL-1β concentration could discriminate individuals with moderate/severe insomnia from those with mild or no insomnia. Furthermore, we obtained an AUC value of 0.78, where scores ≥0.70 represent an acceptable discrimination index (Fischer et al., 2003). Thus, our work suggests that there was a 78% chance that the IL-1β value would correctly distinguish a given person with moderate/severe insomnia. We used a cut-off value of 0.83 pg/µL for IL-1β in saliva, which had an acceptable sensitivity of 70.3% and a specificity of 69.8% for the diagnosis of moderate/severe insomnia. These results suggest that salivary IL-1β levels should be investigated further as a biomarker of insomnia, which would help, for instance, to identify individuals with insomnia or to evaluate their biological response after interventions designed to improve their insomnia.
It has also been reported that the improvement in NREM sleep induced by IL-1β could be due in part to the inhibition of serotonergic neurons in the dorsal raphe nucleus that promote wakefulness (Manfridi et al., 2003), so that the mood could be altered in people with poor quality sleep. However, in our study, although the participants with worse moods reported more insomnia symptoms, salivary IL-1β levels were not associated with a worse GDS score. These results suggest that possible common neural mechanisms between depressive and insomnia symptoms are probably not mediated by the effect of IL-1β. Insomnia and depression are related in a complex and bidirectional way. Both insomnia and depression may be the “common end of a path” or the expression of numerous and different but possibly concurrent etiologies, among which lifestyle and stressful situations play a significant role (Sevillano-García et al., 2007).
While several studies have linked blood cytokine levels to the sleep/wake cycle, to the best of our knowledge, the current study is the first to assess the relationship between salivary IL-1 levels and sleep quality in a population of older people living in the community. However, the present study has some limitations that require further study in order to assert its usefulness in detecting this cytokine in sleep disorders. Due to the cross-sectional study design, this study could not determine the direction of associations between insomnia symptoms and salivary levels of IL-1β. Likewise, it is important to consider that older adults enrolled in municipal activity centres for the elderly, merely by engaging in social and physical activities on a daily or weekly basis, may be healthier than other populations of older adults, which thus limits the generalisability of our results.
We used an instrument based on self-reported sleep quality, meaning there is a possibility that some of the participants had what is termed pseudo-insomnia or a misperception of their sleep state; in other words, the individual complains of insomnia in the absence of abnormalities in their sleep parameters (Salin-Pascual et al., 1992; báñez-Del Valle et al., 2018, 2021). In addition, although we collected the data when Spain was in an intermediate phase of the COVID-19 pandemic, the application of various prevention and control measures against SARS-CoV outbreaks had increased the prevalence of insomnia in this population, especially given its increased vulnerability to the virus (Wang et al., 2021). Oral and systemic inflammatory pathologies, which can influence salivary cytokine levels (Riis et al., 2015) should be taken into account as potential confounders. Another limitation of our study is how total caffeine intake was estimated using a generic “cups per day” question instead of determining the exact amount, or using a validated food frequency questionnaire to estimate total caffeine intake. A cup of coffee is equivalent to 80 grams of caffeine (Nehlig, 2016). In Spain, black, cortado and white coffees are standardized: they have different capacities, but they are prepared with the same amount of coffee and therefore have the same caffeine content (Era of we, 2023). Even though, IL-1β plays an important role as an inflammatory cytokine in human diseases, little is known about its steady state circadian rhythm in healthy individuals (Ghazali et al., 2017).
The work by Ghazali et al. (2017) established that the normal diurnal pattern of IL-1β fluctuates throughout the day, which agrees with previous findings for this molecule in blood samples. These researchers showed that the salivary IL-1β levels peaked immediately after awakening and then gradually decreased before starting to rise again at bedtime. In our work, we collected the samples between 10 am and 4 pm, i.e., during the period that IL-1β levels are higher in healthy young adults. Nevertheless, not having collected the samples at the same time in all the participants was a limitation of our work that should be considered when planning future research. Other limitations to our study were that the sample design included only older community dwelling-individuals who were mostly active and regularly attended activity centres. Furthermore, because aging-associated changes and morbidities are very heterogeneous and abnormal situations of frailty and dependence could have influenced the results, these findings cannot be generalised to the whole population of older individuals. Another limitation was that we did not analyse the influence of comorbid disease states and medications on particular pain syndromes and pain medications because these are strongly associated with insomnia and the symptoms of depression.
Among the self-administered methods for sleep assessment, subjective tools such as validated scales and questionnaires are easy to use and moreover, some of them need not be completed via a healthcare professional. Nevertheless, more objective measurements of sleep can help the diagnosis of sleep disorders and are very useful for individuals with mental health problems (Ibáñez et al., 2018). These may range from ageing-induced memory impairment to cognitive dementia, intellectual disability, or severe psychiatric disorders, in whom sleep assessment employing scales and questionnaires is difficult or even impossible. In such situations, it is also difficult to use other objective assessments such as actigraphy or polysomnography that require patients’ collaboration as well as assistance from health carers. Thus, in these situations, it is especially useful to measure salivary biomarkers to estimate insomnia. Saliva collection can take place in participants’ own context and has considerable economic and logistical advantages over venipuncture because it does not require immediate manipulations or access to specialised laboratory equipment and nursing staff (Lafratta et al., 2018). The identification of salivary biomarkers associated with poor sleep quality (Granger et al., 2012) contributes to improving the knowledge of the underlying pathophysiological mechanisms of insomnia by suggesting new studies on the potential role of salivary IL-1β as a suitable peripheral and non-invasive biomarker in sleep research.
Footnotes
Author Contributions
Ms has 3 tables and 3 figures Vanessa Ibánez-del-Valle contributed to conception contributed to acquisition, analysis, and interpretation drafted manuscript critically revised manuscript gave final approval agrees to be accountable for all aspects of work ensuring integrity and accuracy Marisa Ballestar-Tarín contributed to conception contributed to acquisition, analysis, and interpretation drafted manuscript critically revised manuscript gave final approval agrees to be accountable for all aspects of work ensuring integrity and accuracy Mayra Alejandra Mafla-España contributed to conception contributed to analysis and interpretation drafted manuscript critically revised manuscript gave final approval agrees to be accountable for all aspects of work ensuring integrity and accuracy Omar Cauli contributed to conception and design contributed to acquisition, analysis, and interpretation drafted manuscript critically revised manuscript gave final approval agrees to be accountable for all aspects of work ensuring integrity and accuracy Rut Navarro-Martinez contributed to conception contributed to acquisition, analysis, and interpretation drafted manuscript critically revised manuscript gave final approval agrees to be accountable for all aspects of work ensuring integrity and accuracy.
Declaration of Conflicting Interests
The author(s) declared no potential conflicts of interest with respect to the research, authorship, and/or publication of this article.
Funding
The author(s) disclosed receipt of the following financial support for the research, authorship, and/or publication of this article: This work was supported by the This research was funded by project Grups Emergents number GV/2021/137 from Conselleria de Sanitat-Generalitat Valenciana (Spain) (Principal Investigator Rut Navarro-Martínez) GV/2021/137).