
Abstract
The hybridization technique has recently been used to produce a new generation of composites called pseudo-ductile composites, which have shown higher failure strain compared to conventional composites, minimizing the risks of the occurrence of a catastrophic failure. The pseudo-ductility behavior in these composites is obtained by hybridization of fibers with high and low failure strains. In this study, a multi-scale finite element (FE) model incorporating micro and macro-scales is proposed to predict the failure behavior of pseudo-ductile composites. A micro-scale representative volume element (RVE), consisting of randomly distributed fibers, was generated using a Python code. Periodic boundary conditions (PBCs) were applied to the RVE generated with a periodic geometry. To account for fiber failure and ply fragmentation, the tensile strength of fibers was distributed based on the Weibull distribution function and a user-defined UMAT subroutine was developed. Tensile loading was then applied to the RVE to simulate the composite’s mechanical behavior. For validation, an RVE was developed based on experimental data from recent research on thinply and conventional thickness composites. Numerical results were compared to experimental data, demonstrating acceptable agreement. In the final step, following a sequential multi-scale modeling approach, a macro-scale model was constructed based on the outputs of the micro-scale model subjected to tensile and shear loads. The results were compared with experimental data, revealing good agreement. The proposed model allows for the optimization of pseudo-ductile composite structures to achieve a desired set of mechanical properties without the need for conducting extensive experimental material tests.
Introduction
In recent decades, unidirectional composites have been applied in different areas such as aerospace, civil engineering, and automotive industries. 1 However, these materials are usually brittle and may experience unexpected catastrophic failure which restricts their application. 2 Hybridization has been a solution to optimize the mechanical properties of composites while reducing the production costs.3–5 This technique has recently been used to produce pseudo-ductile composites which have shown higher failure strain compared to conventional composites. Thus, a sudden collapse after overloading is not observed in these materials which minimizes the risks of the occurrence of a catastrophic failure.6–8 The pseudo-ductility behavior in composites is obtained by hybridization of fibers with high and low failure strains, such as carbon and glass fibers, respectively.9–12 Due to the difference in strain energy between plies, the middle ply fails first and then the created crack propagates through other plies until the whole structure fails. This gradual failure results in a nonlinear behavior similar to that in ductile materials. To observe the pseudo-ductility behavior, the thin-ply method can be employed in which a very thin high strain ply (i.e. the component with high failure strain) is used for construction of the composite. 13 In the thin-ply method, the strength and failure strain of the pseudo-ductile composites can be improved by optimizing the sequence of fiber orientation of plies. 14 Fabrication of such thin ply composites is significantly more time consuming and expensive compared to composites with the conventional thickness. 15 A few research studies have been recently performed to produce pseudo-ductile composites with conventional thickness using carbon fibers with different elastic modulus and strain failure values.7,15 For instance, Sapozhnikov et al. 15 used pitch-based carbon fiber as the low failure strain, high elastic modulus fiber, and PAN-based carbon fiber, known for its high failure strain, as the high failure strain material. They manufactured various composite samples with different sequence layups, but a number of them exhibited a pseudo-ductile behavior. 15
The fabrication methods for pseudo-ductile composites are typically more expensive than those used for conventional composites, such as hand lay-up or vacuum infusion plastic (VIP), due to the requirement for specialized equipment. Therefore, it would be very expensive to experimentally optimize the structure of pseudo-ductile composites for a specific application using trial and error techniques. Thus, developing a numerical or analytical model that can predict the mechanical properties of these composites based on the properties of their components would be beneficial to obtain an optimized design before fabrication. The analytical model proposed in Jalalvan et al. study, 16 considers different failure possibilities of a pseudo-ductile composite and calculates the values of stress and strain in each scenario. Macro or micro-scale numerical models can also be developed to predict the mechanical behavior of pseudo-ductile composites. In a macro scale model, the exact geometry of each ply is considered and a cohesive-zone layer can be modeled between the plies to simulate the delamination damage. 17 However, to accurately analyze the failure mechanisms of different composite components, a microscale model would be beneficial.
Despite the critical need for accurate models to predict the mechanical behavior of pseudo-ductile composites, current research is limited, and no numerical models exist for predicting their failure response under tensile loading. Pseudo-ductility, primarily influenced by the damage progression in different composite plies, has only been observed in composites with specific carbon fiber types and layup sequences. 15 Determining the exact fiber and matrix characteristics that result in a pseudo-ductile response through trial and error experiments will be costly and inefficient. Therefore, the development of an experimentally validated computational framework that considers the micro-scale features of these composites will not only help in predicting accurate micro-mechanical failure, but will also aid in the optimization of the design of such composites.
This study aims to introduce a novel multi-scale FE model to predict damage progression in pseudo-ductile composites under tensile loads in the fiber direction, considering various material and geometric parameters. To this end, representative volume elements (RVEs) of three-ply all-carbon composite with varying fiber volume fractions in the low-strain ply were created at the micro-scale. Periodic boundary conditions were applied to the RVEs with periodic geometry and micro-mechanical simulations were performed on them. The accuracy of the micro-scale model was assessed by comparing the predicted tensile responses of both thin-ply and conventional thickness pseudo-ductile composites with those obtained from the experiments and an analytical model. 16 In the next step, the elastic constants and strength parameters obtained from the micro-scale models were used in a macro-scale model to simulate the homogenized tensile response using the Hashin damage criteria. 18 The tensile responses obtained from the initial micro-scale model and the subsequent multi-scale model were finally compared, and the advantages of each approach were discussed. The robust numerical tool developed in this study can be used for optimizing the mechanical behavior of pseudo-ductile composites, contributing to major advancements in the field of composite material engineering.
Pseudo-ductile composite
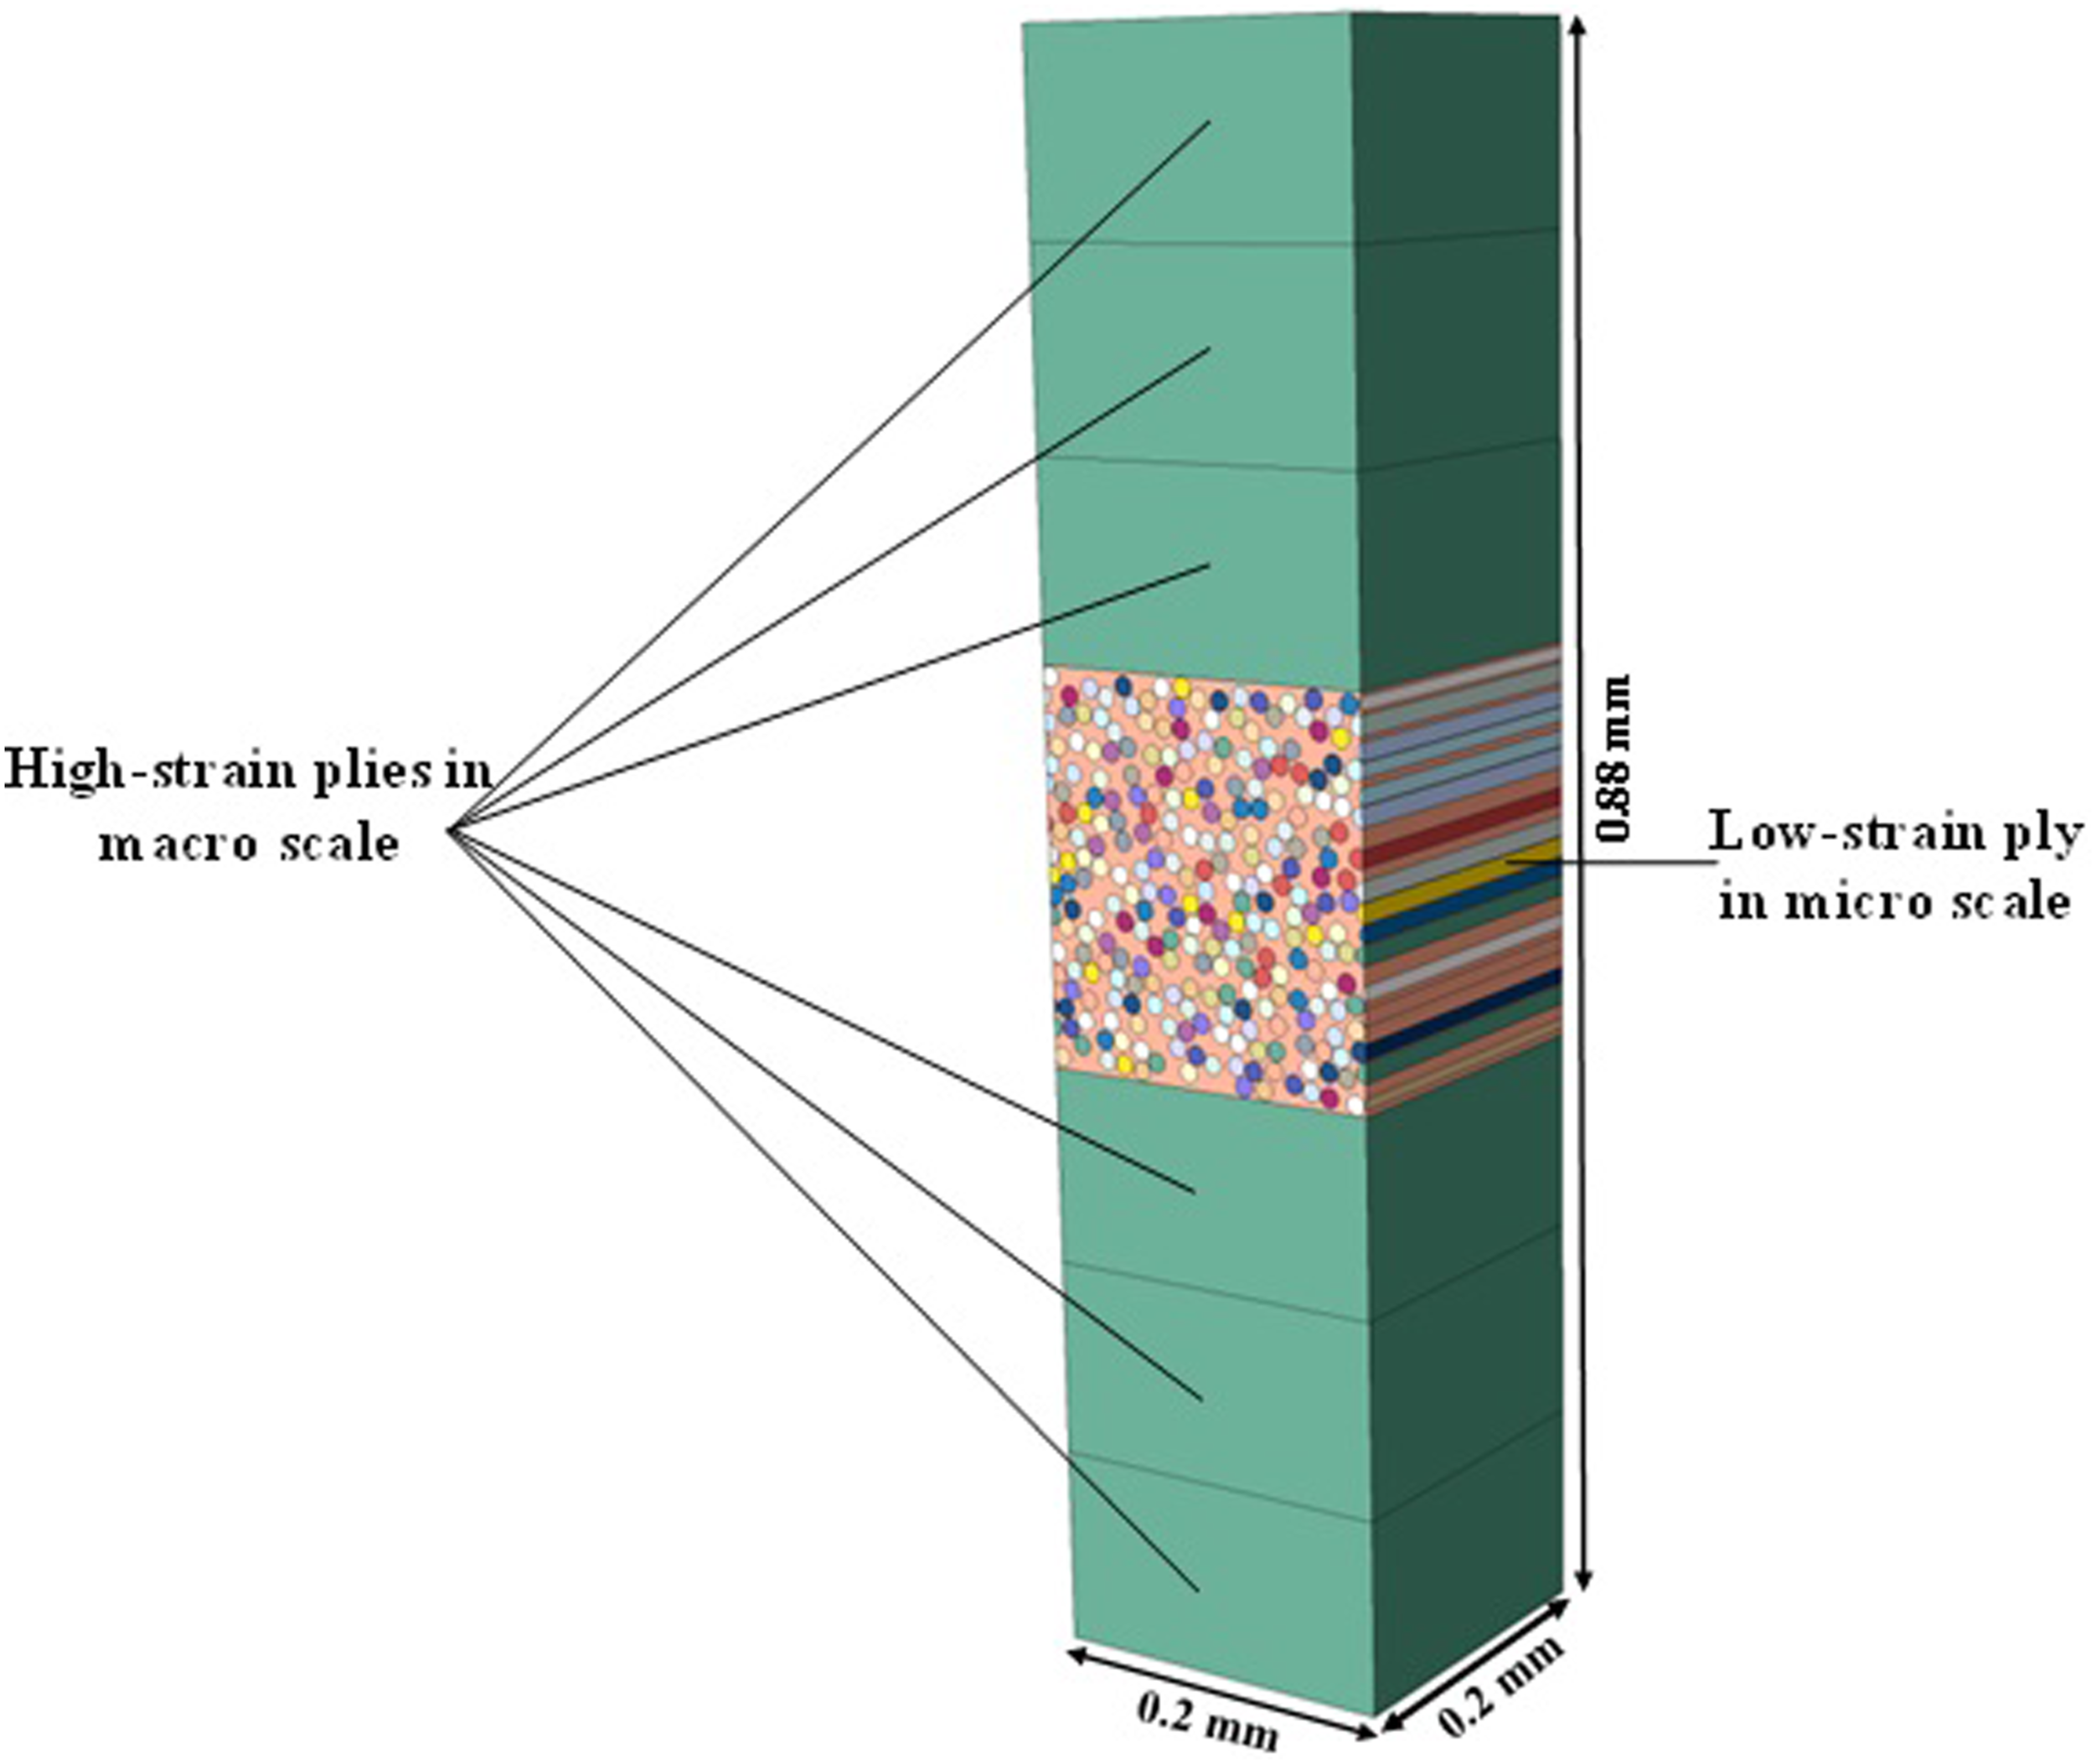
Pseudo-ductile composites include two different fibers with low and high failure strain as depicted in Figure 1. The high strain fibers used in the top and bottom layers (labeled as high-strain plies) have higher tensile strength and lower elastic modulus compared to the low strain fibers used in the middle ply of the composite (labeled as the low-strain ply). Gradual failure of the low-strain ply is the main reason for observing pseudo-ductile behavior in the composite. Two types of pseudo-ductile composite material systems exist, that is thin-ply composites and conventional thickness composites. To fabricate thin-ply composites, high pressure is applied during the manufacturing process, necessitating the use of an autoclave.
8
However, for manufacturing conventional thickness pseudo ductile composites which have been recently introduced, employing a hot press would be sufficient.
15
In this study, our focus is mainly on the latter type of composites due to their easier manufacturing process and also the mechanical disadvantages of the former type such as low impact resistance
19
and notch tensile strength.
20
However, to present the capabilities of the proposed computational model, the model’s accuracy is assessed for both types of pseudo-ductile composites. Each type of pseudo-ductile composite employs specific low-strain and high-strain fibers and epoxy matrices tailored to achieve optimal pseudo-ductility, the details of which are described in the following sections of the paper. Schematic figure of a three-ply composite considered in this study.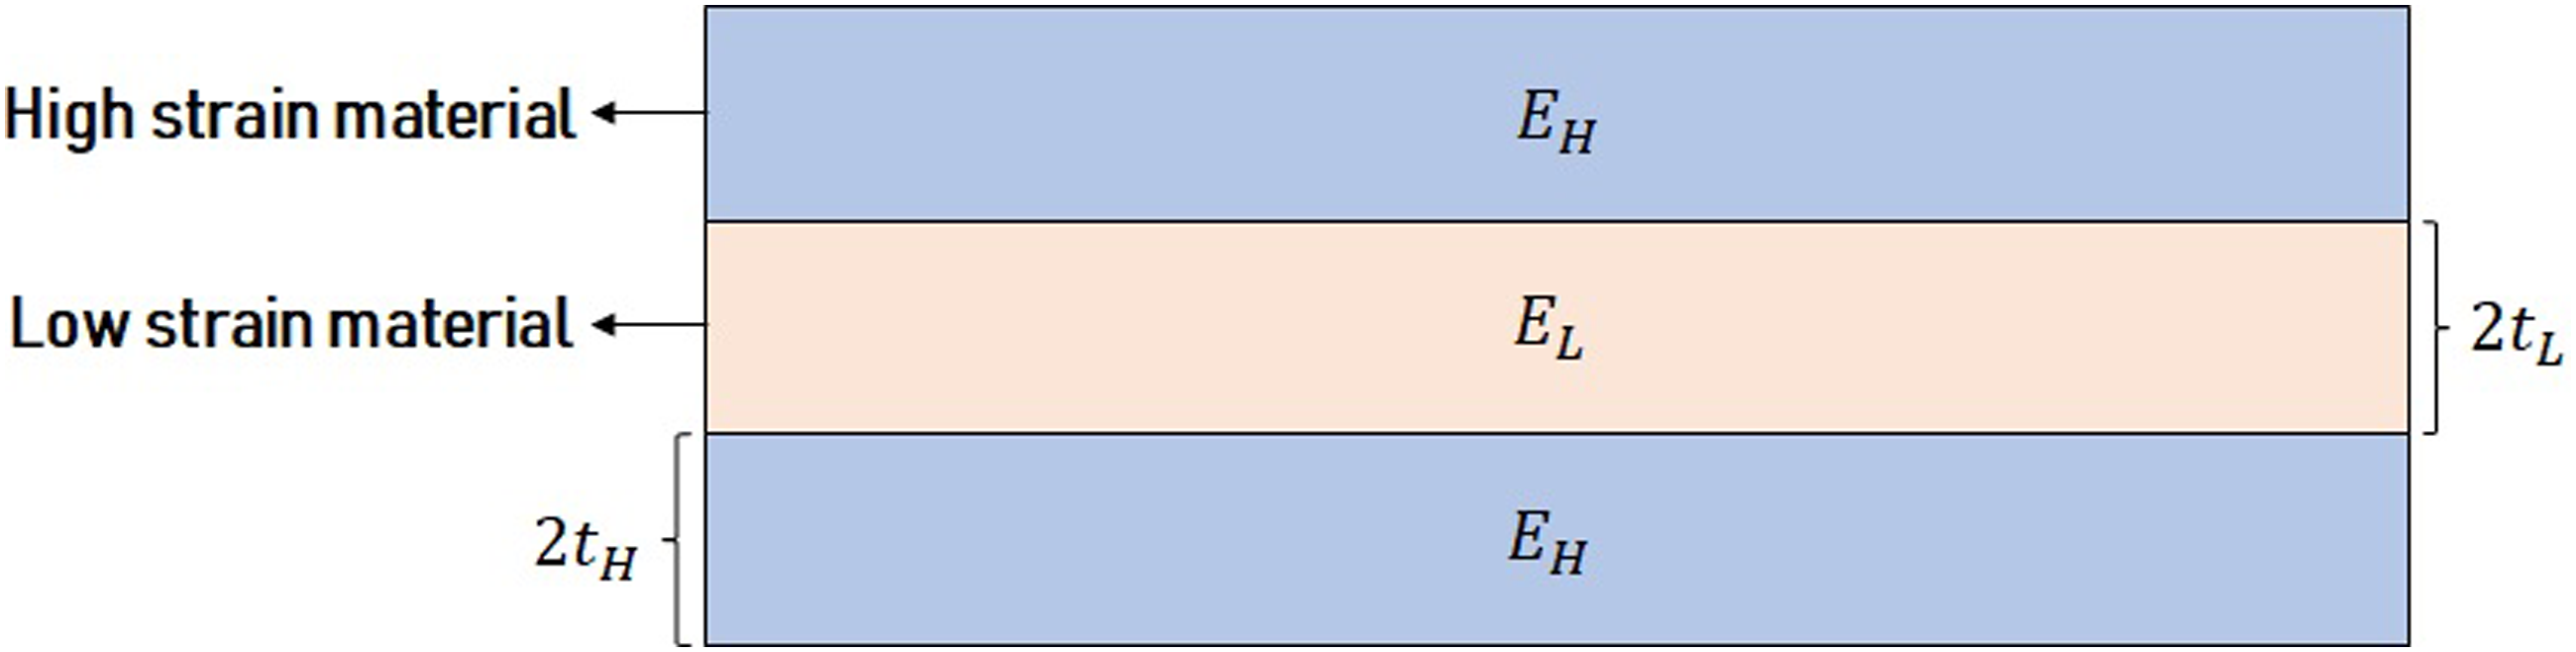
Finite element model
Generation of the representative volume element (RVE)
To perform the micro-mechanical analysis of the three-ply hybrid composite shown in Figure 1, an RVE of the composite is constructed in which fibers in the micro-scale are distributed randomly through each ply with a specific fiber volume fraction. The fibers can be distributed using two different techniques. The first technique is the hardcore method, where fibers are distributed based on a random function. However, with this technique, generating an RVE with a high fiber volume fraction, such as 60%, is challenging. 21 The second technique involves using the nearest neighbor algorithm. Following the initial random placement of the first fiber, subsequent fiber positions are determined with consideration for specific distance spacing and orientation relative to the first fiber. 22 This technique allows for the generation of an RVE with a high fiber volume fraction. In this study, a Python code was developed to create the RVE geometry based on both fiber distribution techniques.
Geometrical parameters of the model.
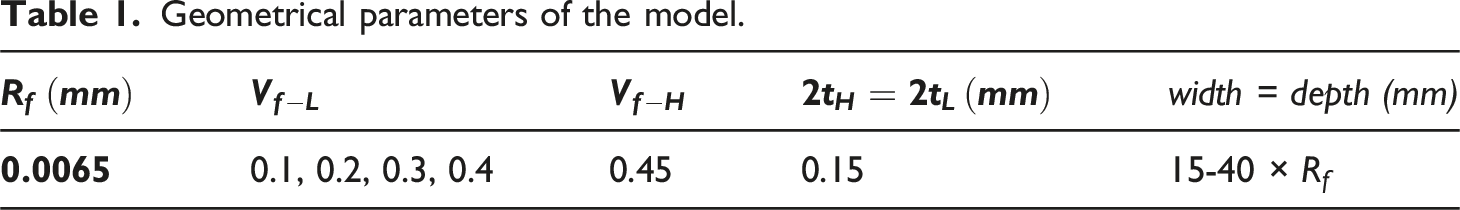
In this study, the effect of Vf−L on the pseudo-ductile behavior of the composite under tensile load was investigated by considering four different fiber volume fractions in the middle ply namely, 10%, 20%, 30%, and 40% (Figure 2). RVEs with different fiber volume fractions of low strain material: (a) 10%, (b) 20%, (c) 30%, (d) 40%.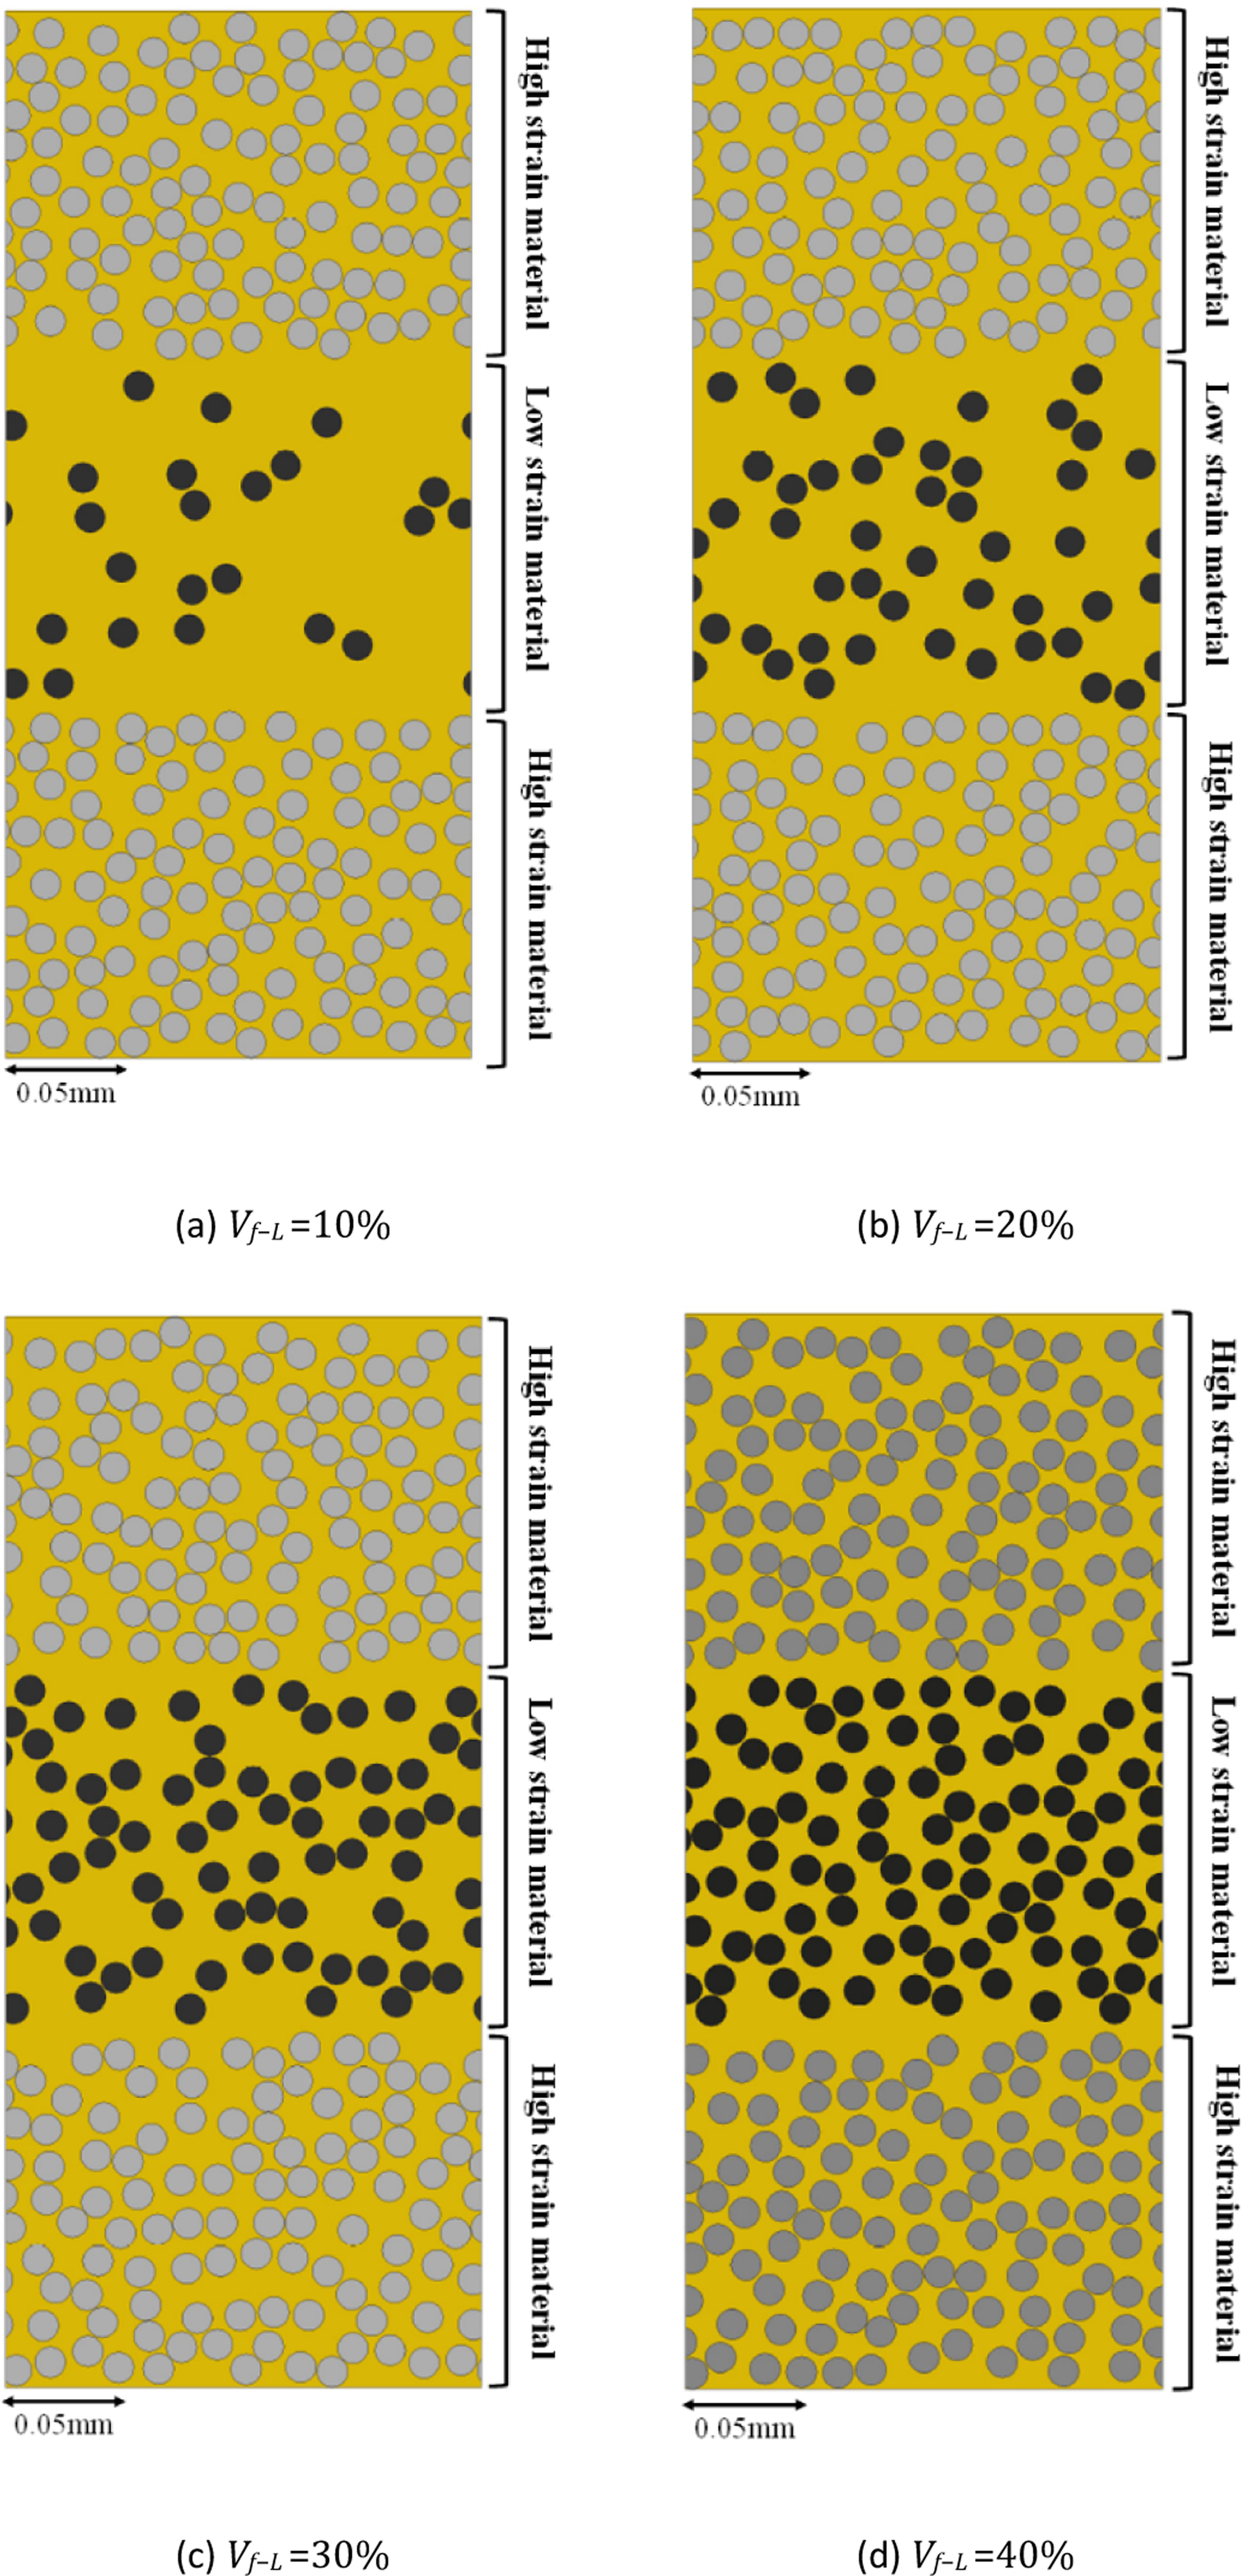
Material properties
On the fibers surface, some flaws exist which are made during the production process. Distribution of flaws on the surface of fibers can be different leading to a difference between the tensile strength of individual fibers. Thus, a suitable strength distribution function should be considered for the tensile strength of fibers. It has recently been shown that Weibull statistical function is suitable for distribution of the tensile strength of brittle fibers such as carbon and glass fibers.23–25 The Weibull modulus is a fundamental parameter within the Weibull function that governs the range of strength distribution. A low Weibull modulus indicates a significant degree of variability in fiber strengths, thereby resulting in a wide spectrum of failure behaviors. Conversely, a high Weibull modulus signifies a more uniform distribution of fiber strengths, leading to more predictable patterns of failure. In accordance with Weibull statistics, the strength of each fiber can be determined as follows: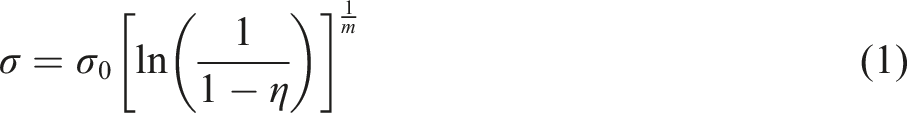
To model the failure behavior of each component of the composite, a user-defined material subroutine (UMAT) was developed in Fortran that can be linked with the ABAQUS software package
26
used for the FE analysis. In the UMAT code, the incremental stress and strain values are read from the ABAQUS FE solver and once the stress in each element exceeds the tensile strength value, the element is removed. The first step in the procedure involves updating the stress tensor,
To determine if an element should be deleted, the stress tensor components are compared with a predefined tensile strength limit,
A local damage variable, 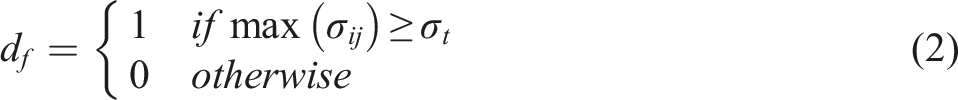
If the maximum stress exceeds 
This micro-scale stress adjustment ensures that once the element in each fiber reaches the tensile strength limit that is d f = 1, its contribution to the overall material stiffness and load-bearing capacity is nullified.
FE implementation
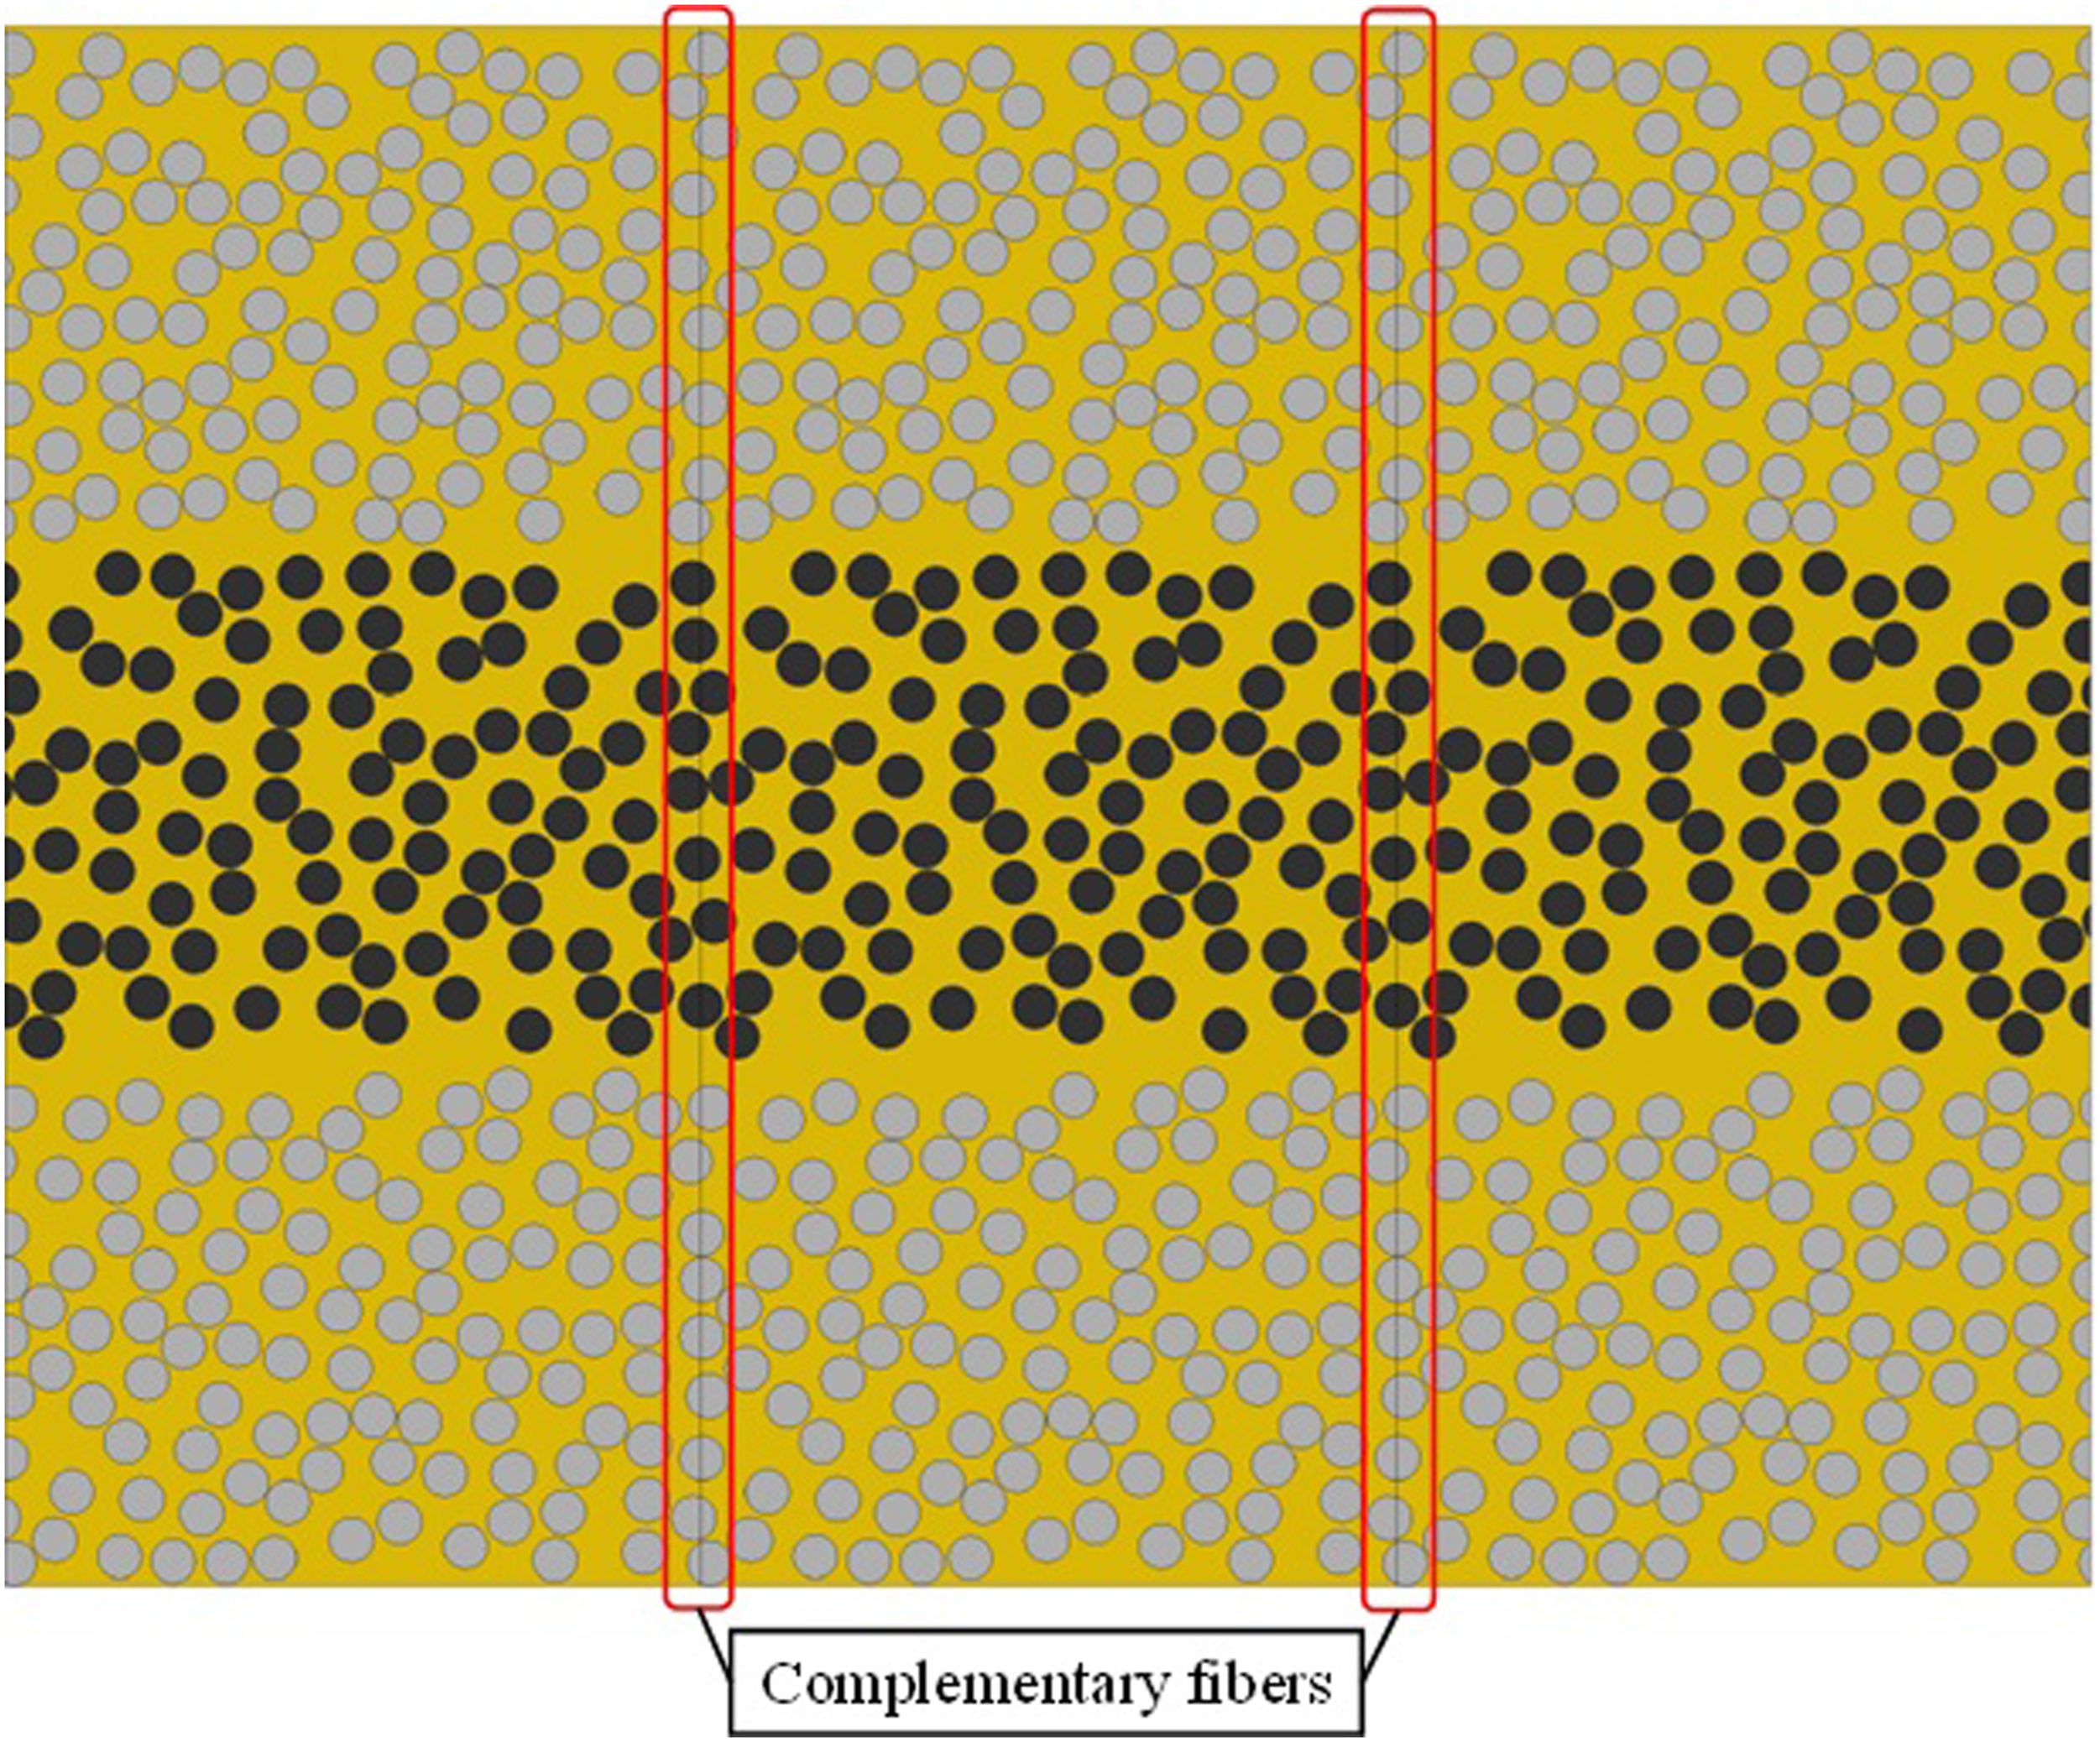
A composite structure consists of several RVEs that are in contact with each other, which means that the left, right, front, and back sides of an RVE are surrounded by other RVEs (see Figure 3). Thus, the displacement of nodes on each side of the RVE is controlled by that of the corresponding nodes on the parallel side. This can be simulated by applying periodic boundary conditions (PBCs) to the nodes on different sides of the RVE. It is important to note that the thickness of the RVE is the same as the thickness of the composite at the macro scale and thus PBCs are not assigned to the top and bottom sides of the RVE. To further clarify the concept behind a periodic RVE geometry, the two-dimensional surfaces of three similar RVEs stitched together are shown in Figure 4. It can be seen that the fibers on each edge of the middle RVE are complemented by those on the opposite edge and also all the fibers on the edges of the middle RVE form a complete fiber when RVEs are stitched together. Illustration of the Repeatable RVE and the periodic boundary conditions. Illustration of the periodic geometry of the RVE with complementary fibers.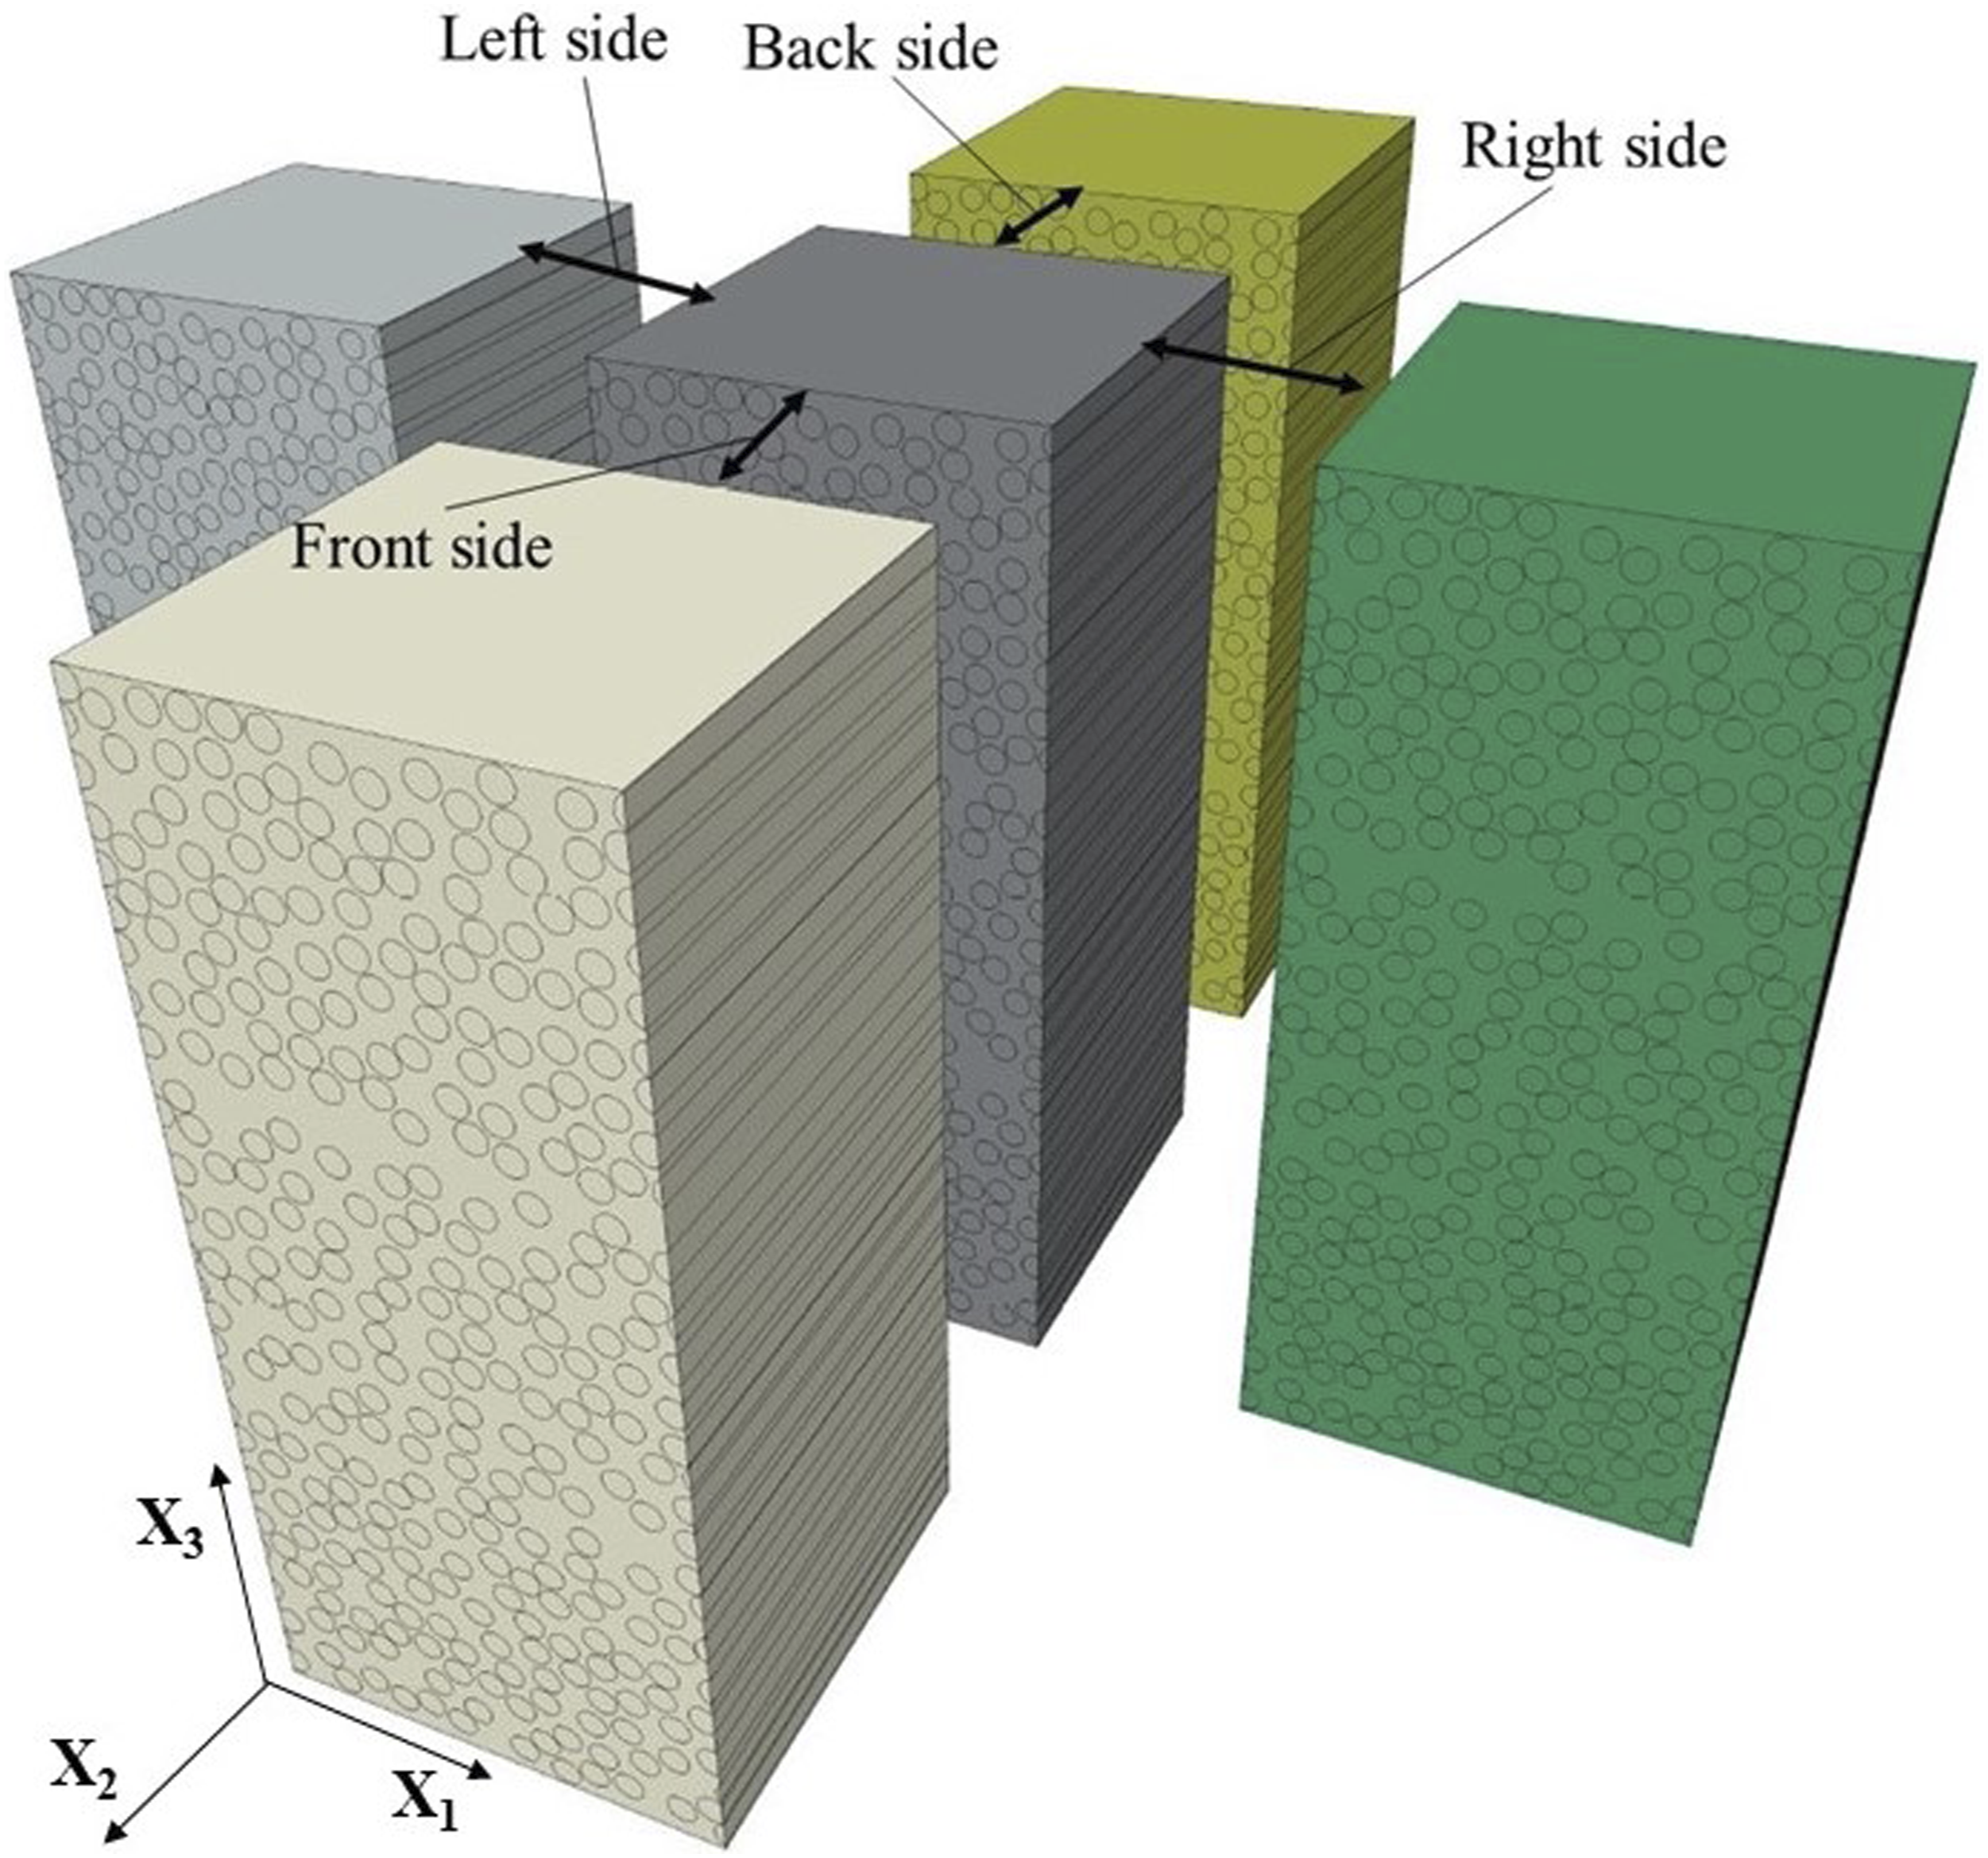
To apply the PBCs to the RVE, a displacement boundary condition, which specifies the displacement differences between each pair of nodes on parallel boundaries will be used as shown in equation (4):
Additionally, a displacement-controlled tensile load was applied to the RVE in the fiber direction. The RVE was then discretized into eight-node linear brick and reduced integration ABAQUS elements (C3D8R). In Section ’Mesh-sensitivity analysis’ the dependency of the results on the mesh size was evaluated through a mesh-sensitivity analysis and the element size length of 0.003 mm was selected to ensure a negligible difference between the results.
Convergence study
The tensile responses of several RVEs were simulated using the proposed numerical model to investigate the effect of RVE size, mesh size and the fiber volume fraction of the middle ply on the predicted results. results of these sensitivity analyses are discussed in the following sections.
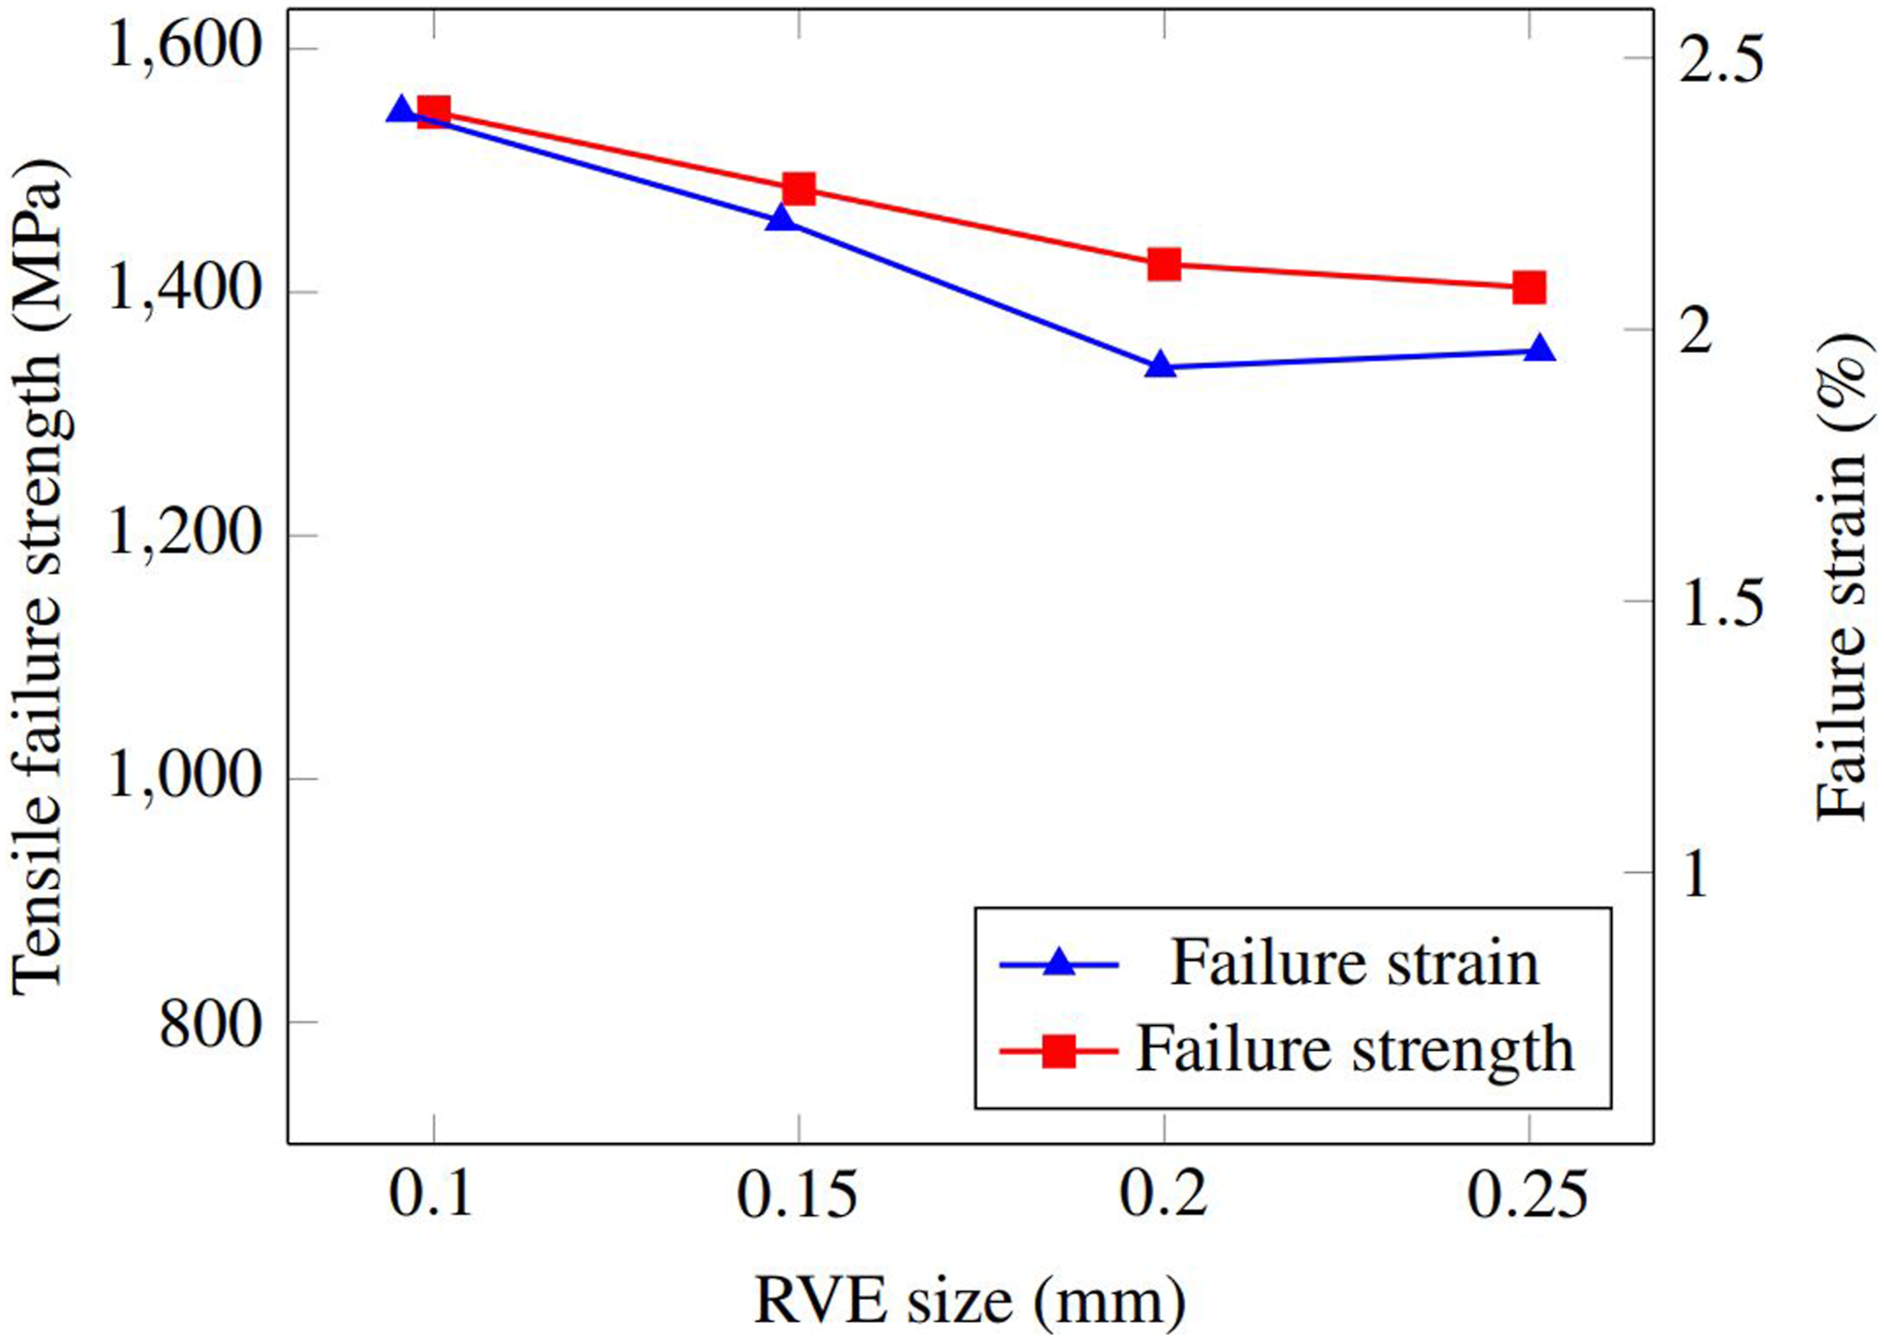
Effect of the RVE size: To investigate the effect of RVE size on the results of the proposed numerical model, four RVEs with different width and depth sizes ranging from 15R × 5R to shows the cross section view of these RVEs which contain 40% fiber volume 40 × R were constructed.27,28 Thickness of all RVEs is equal to 0.45 mm. Fraction in the middle ply. The failure strength and strain results obtained from the RVEs with different sizes (Figures 5 and 6) show that the RVE side length of 0.2 mm is large enough to have acceptable failure strength and strain. In the next step, this RVE size was considered to assess the mesh-sensitivity of the model. Cross section of the 3D RVEs with 40% fiber volume fraction in the middle ply and different sizes: (a) width = depth = 0.1 mm, (b) width = depth = 0.15 mm, (c) width-depth = 0.2 mm, (d) width = depth = 0.25 mm. Failure strength and strain predicted by the numerical model with different RVE sizes.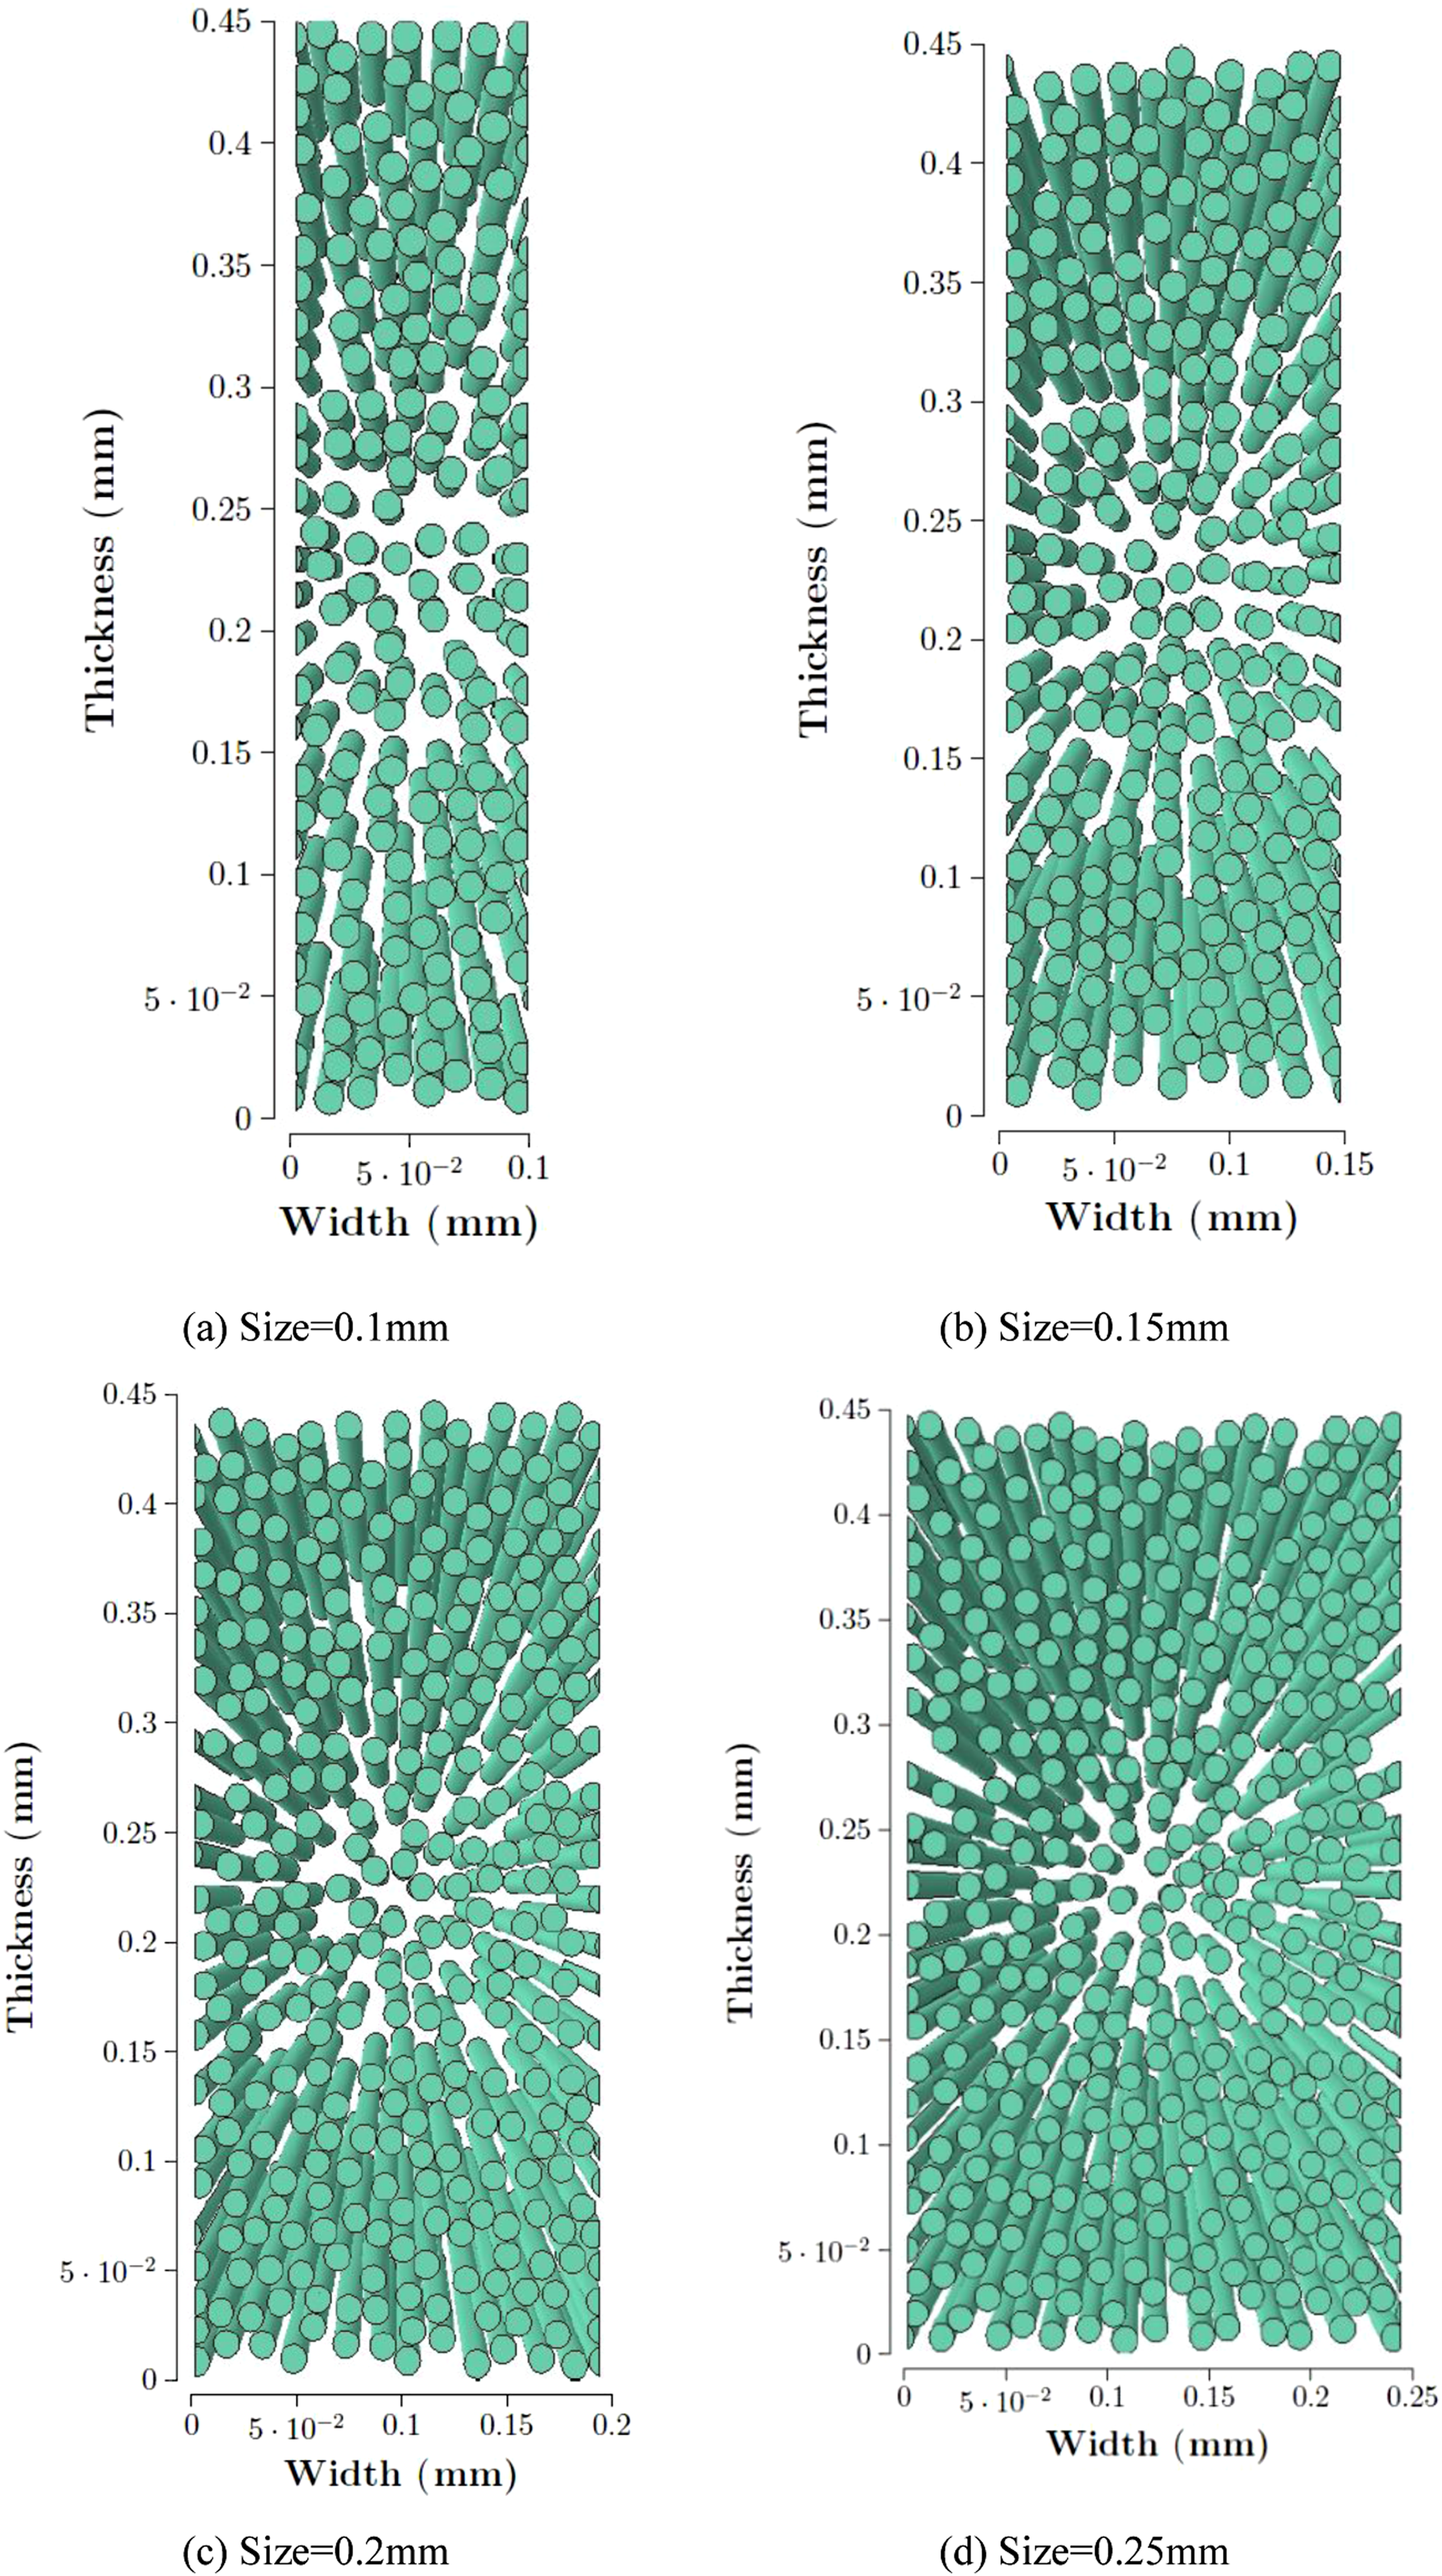
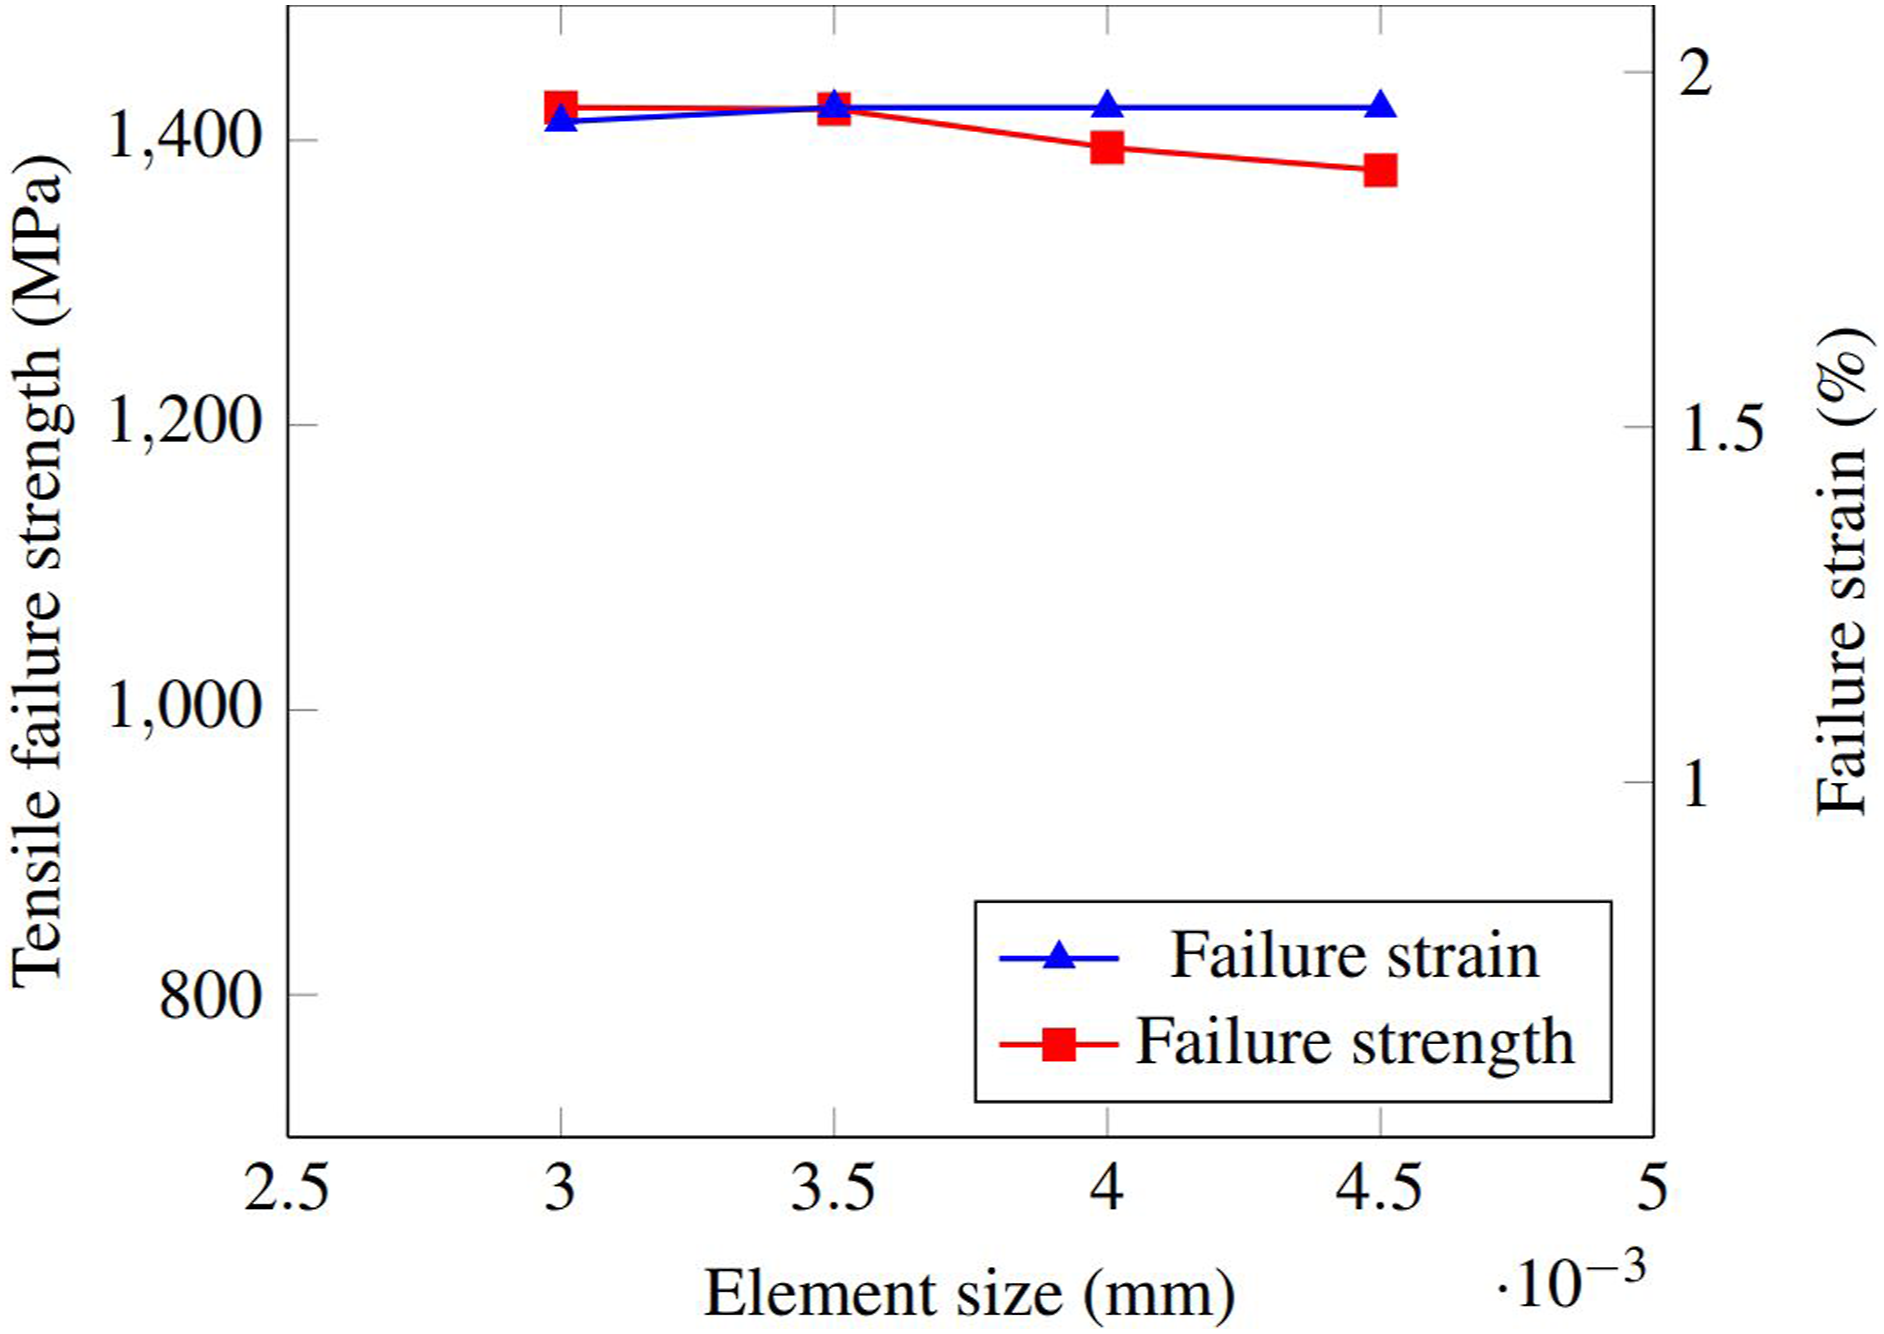
Mesh-sensitivity analysis: To determine the proper element size for meshing the RVE, four RVEs with element sizes of 0.0045 mm to 0.003 mm were simulated by the proposed numerical model (Figure 7). While the proposed model is not quite mesh sensitive, the tensile failure strength and strain predicted by RVEs meshed with different element sizes (Figure 8) indicate that elements with side length of 0.003 mm can be considered for mesh generation of the composite models. Cross section of 3D RVEs with Failure strength and strain of the numerical model with different element size.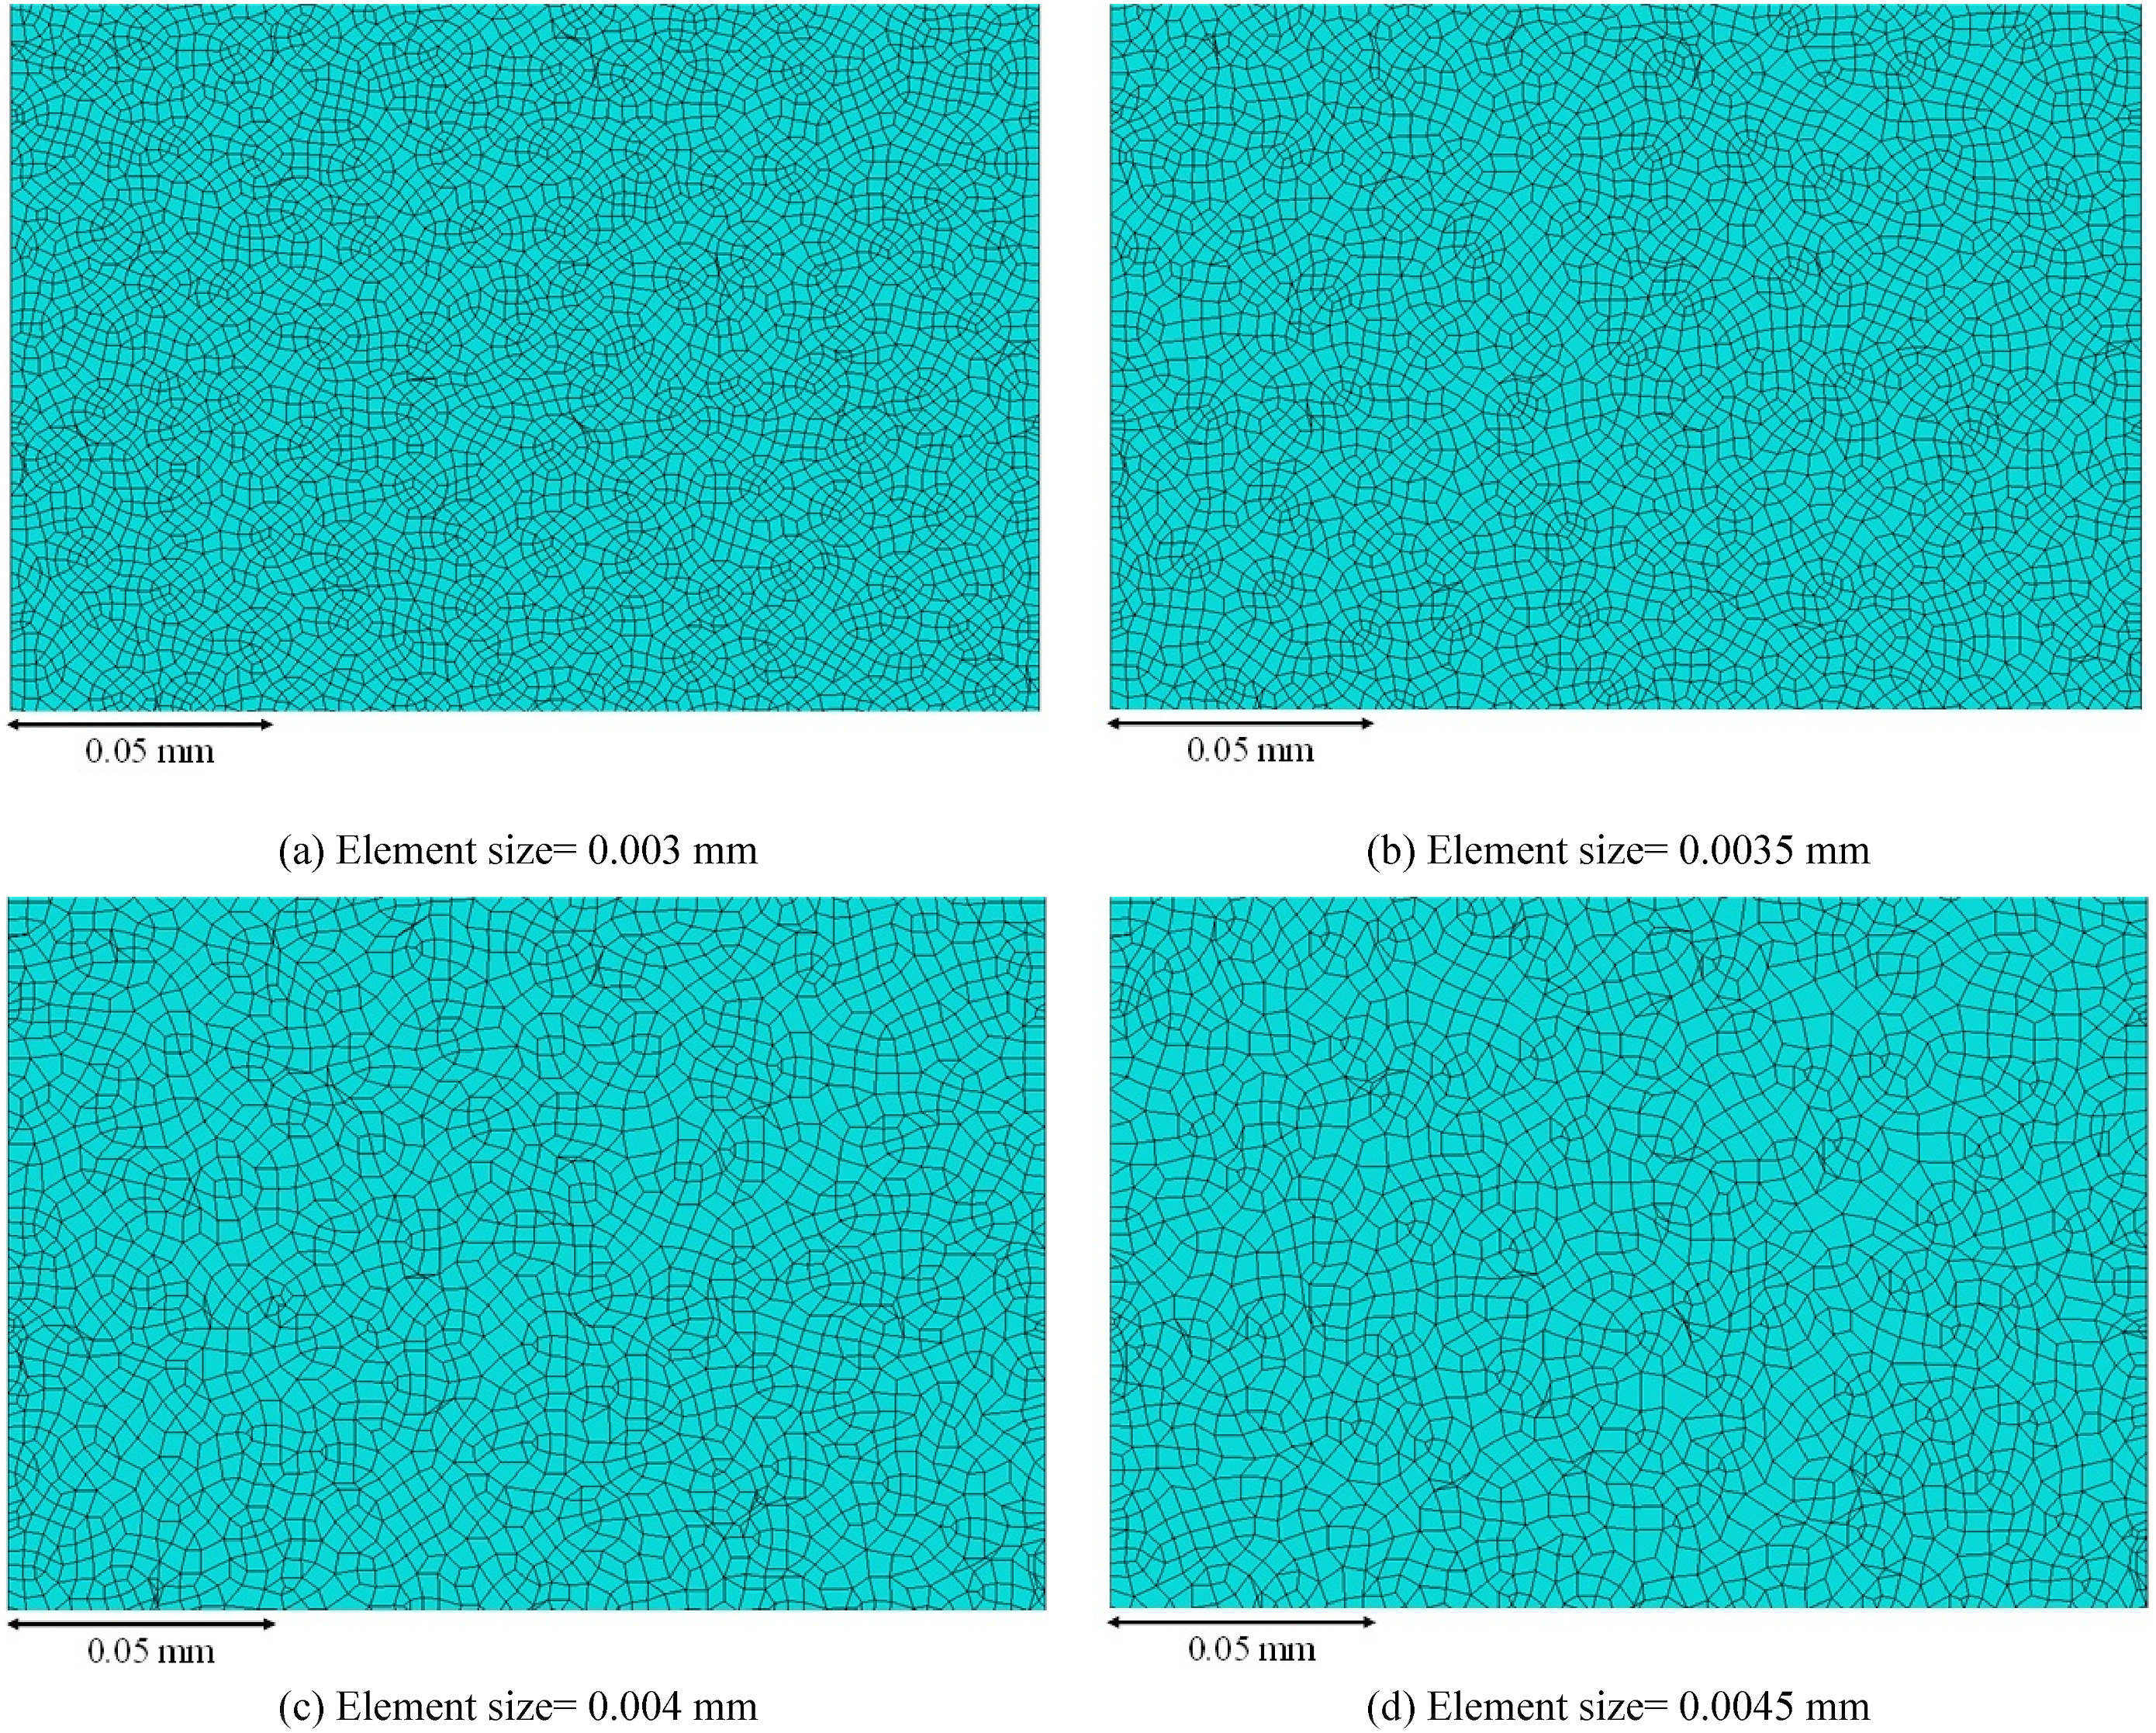
Results and discussion
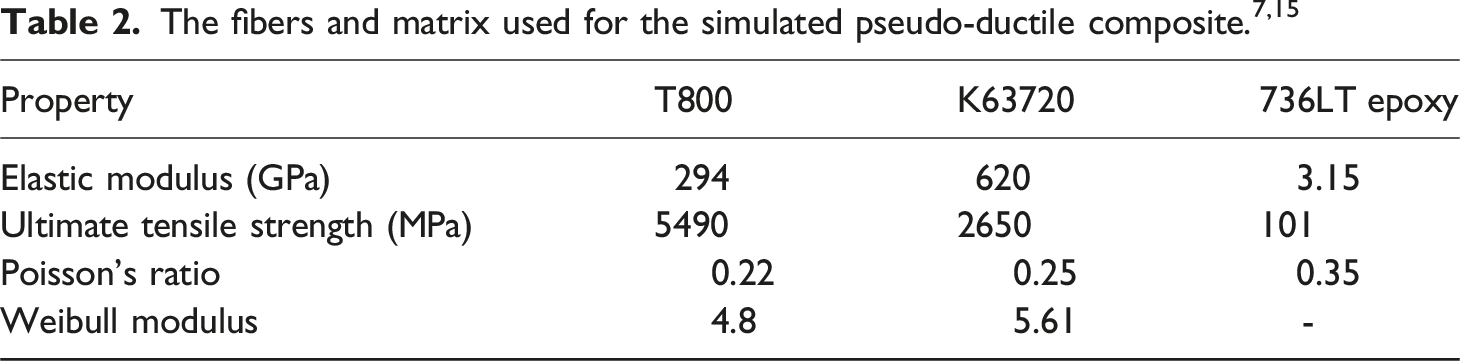
As mentioned, two types of carbon fiber (i.e. T800 and K63720) with the 736LT epoxy resin were utilized to simulate a three-ply pseudo-ductile composite. The subsequent section presents the results of the finite element (FE) model, which will be compared with the results of the analytical model introduced in Jalalvan et al. work. 16 Then, the accuracy of the model is assessed by simulating the tensile response of two distinct pseudo-ductile composites with thin-ply 14 and conventional thickness. 15 In the end, using a sequential multi-scale approach, the results of micro-mechanical simulations of RVEs subjected to tensile and shear loads were inputted to a macro-scale model to predict the tensile response of the conventional thickness pseudo-ductile composite based on the Hashin damage model. 18
Failure process of the composite
In order to observe pseudo-ductile behavior in a composite structure, fiber fragmentation must first occur in the low-strain ply which is primarily due to the varying failure strain in each ply. When the low-strain ply is subjected to tensile load, due to its higher elastic modulus compared to the top and bottom high strain plies, it experiences greater stress concentration. As a result of the low failure strain of fibers in the low-strain ply, these fibers begin to fail individually, leading to a nonlinear pseudo-ductile stress-strain curve in the composite.
In this section, the stress distribution and progression of damage within an RVE of a pseudo-ductile composite with middle-ply volume fraction of 40% and side length of 0.2 mm are discussed. Figure 9 shows the longitudinal stress distribution within this RVE at different stages of the displacement-controlled tensile loading. At tensile strain (ϵ22) of ϵ22 = 0.17% (Figure 9(a)) due to the elastic modulus difference between the middle and top/bottom plies of the pseudo-ductile composite, stress concentration occurs in the fibers of this ply. Figure 9(b) then shows that at ϵ22 = 0.58%, some fibers have failed sooner than the others, which is because of the tensile strength difference among fibers of the middle ply. Once the low-strain ply is completely failed, the stress shifts to the high-strain plies. At this stage of loading, where ϵ22 = 1.33% (Figure 9(c)), fibers of the high-strain plies indicate a significant reinforcement role against external loads. Finally, the high-strain plies begin to fail when the stress in fibers reaches the tensile strength (Figure 9(d)). Longitudinal stress distribution in an RVE including the middle ply fiber volume fraction of 40% at different stages of displacement-controlled tensile loading with tensile strain values of (a) ϵ22 = 0.17%, (b) ϵ22 = 0.58%, (c) ϵ22 = 1.33%, (d) ϵ22 = 2.53%.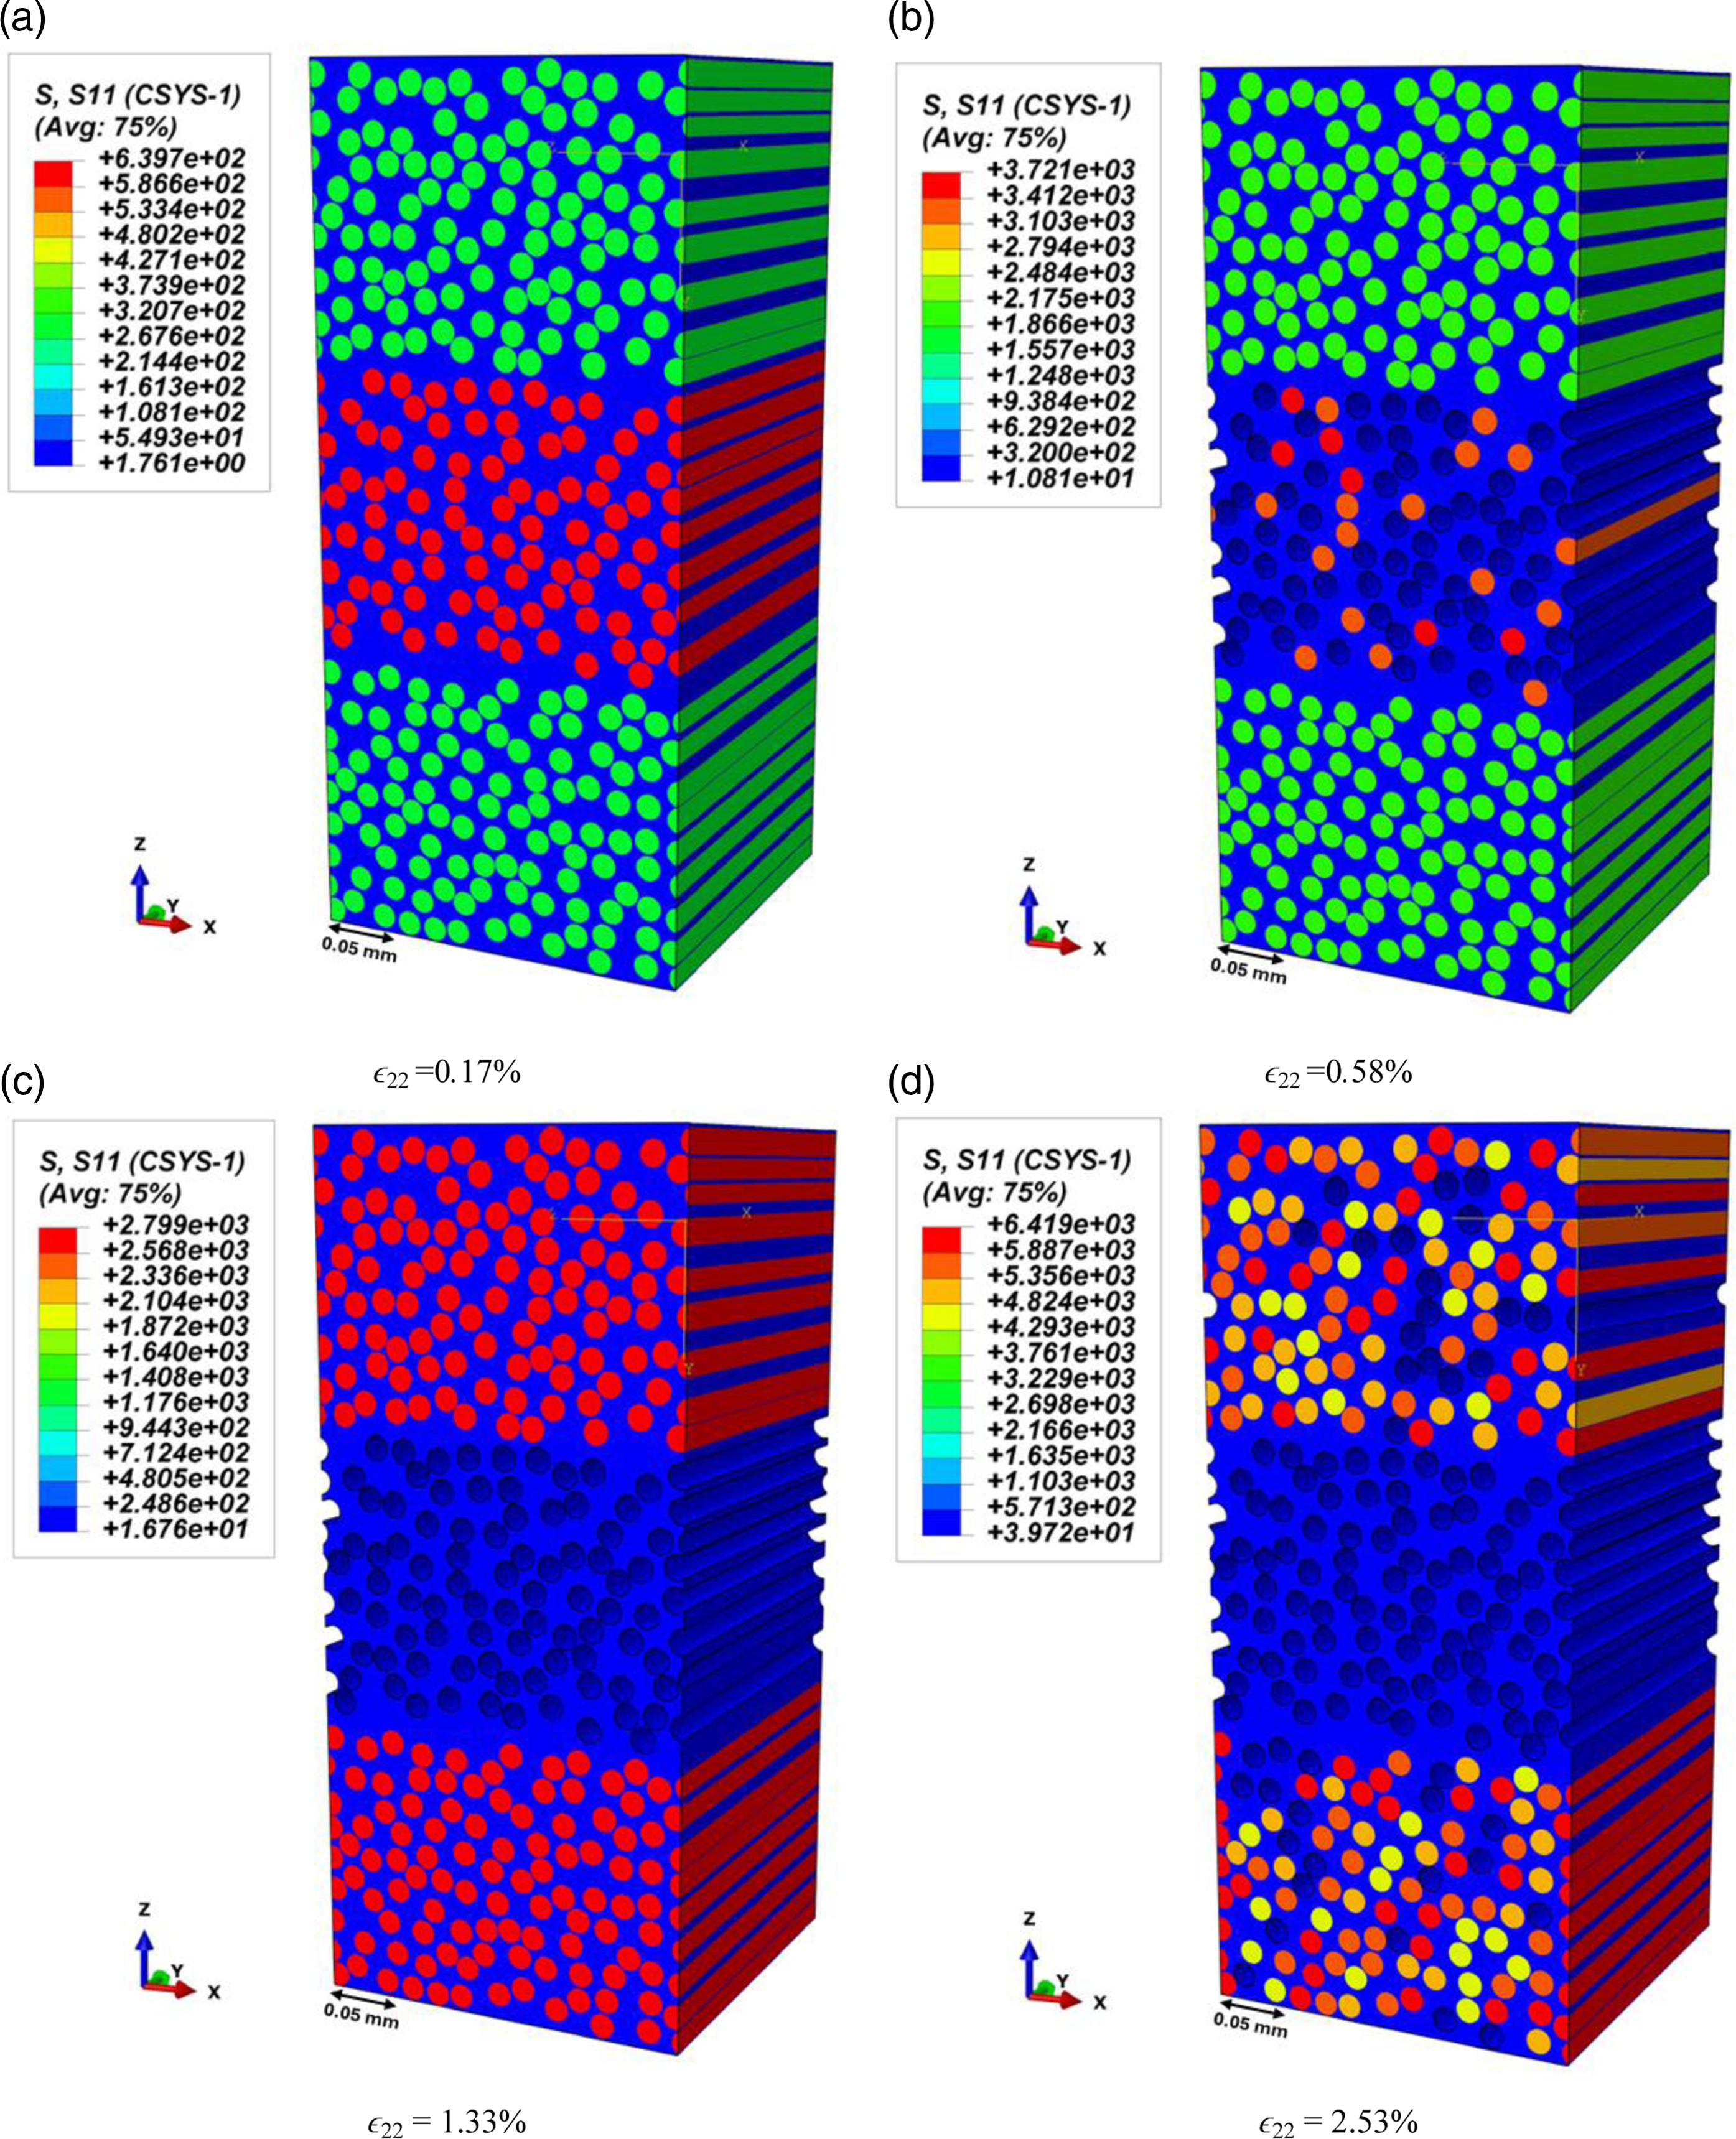
Effect of fiber volume fraction of the middle ply: As explained in the previous section, the pseudo-ductile behavior is observed due to the occurrence of fiber fragmentation in the low-strain ply leading to a nonlinear stress-strain curve in the composite. Once the middle ply is completely failed, the stress is transferred to other plies, resulting in a linear increase in stress values.
In this section, to determine the range of the middle-ply volume fraction (Vf−L) that results in a pseudo-ductile stress-strain response, a number of RVEs with side length of 0.2 mm and different Vf−L were simulated using the proposed numerical model. The stress-strain curve obtained for the composite with Vf−L of 10% (Figure 10(a)) indicates that this composite does not show a pseudo-ductile behavior as all fibers of the middle ply fail almost at the same time. The stress-strain curves shown in Figure 10 indicate that increasing Vf−L from 10% to 30% led to the middle ply gradual failure and an increase in the first yield stress and initial elastic modulus of the composite (Figure 10(c) and (d)). As a result, the composites with Vf−L above 30% exhibited a pseudo-ductile tensile behavior as can be observed in their stress-strain curves. Since the composite with Vf−L = 40% exhibited a clear pseudo-ductile stress-strain curve, this composite was used for most numerical simulations of this paper. Stress-strain diagrams curves obtained from the proposed numerical model for composites with different fiber volume fractions (Vf−L) in the middle ply including (a) Vf−L = 10%, (b) Vf−L = 20%, (c) Vf−L = 30%, (d) Vf−L = 40%.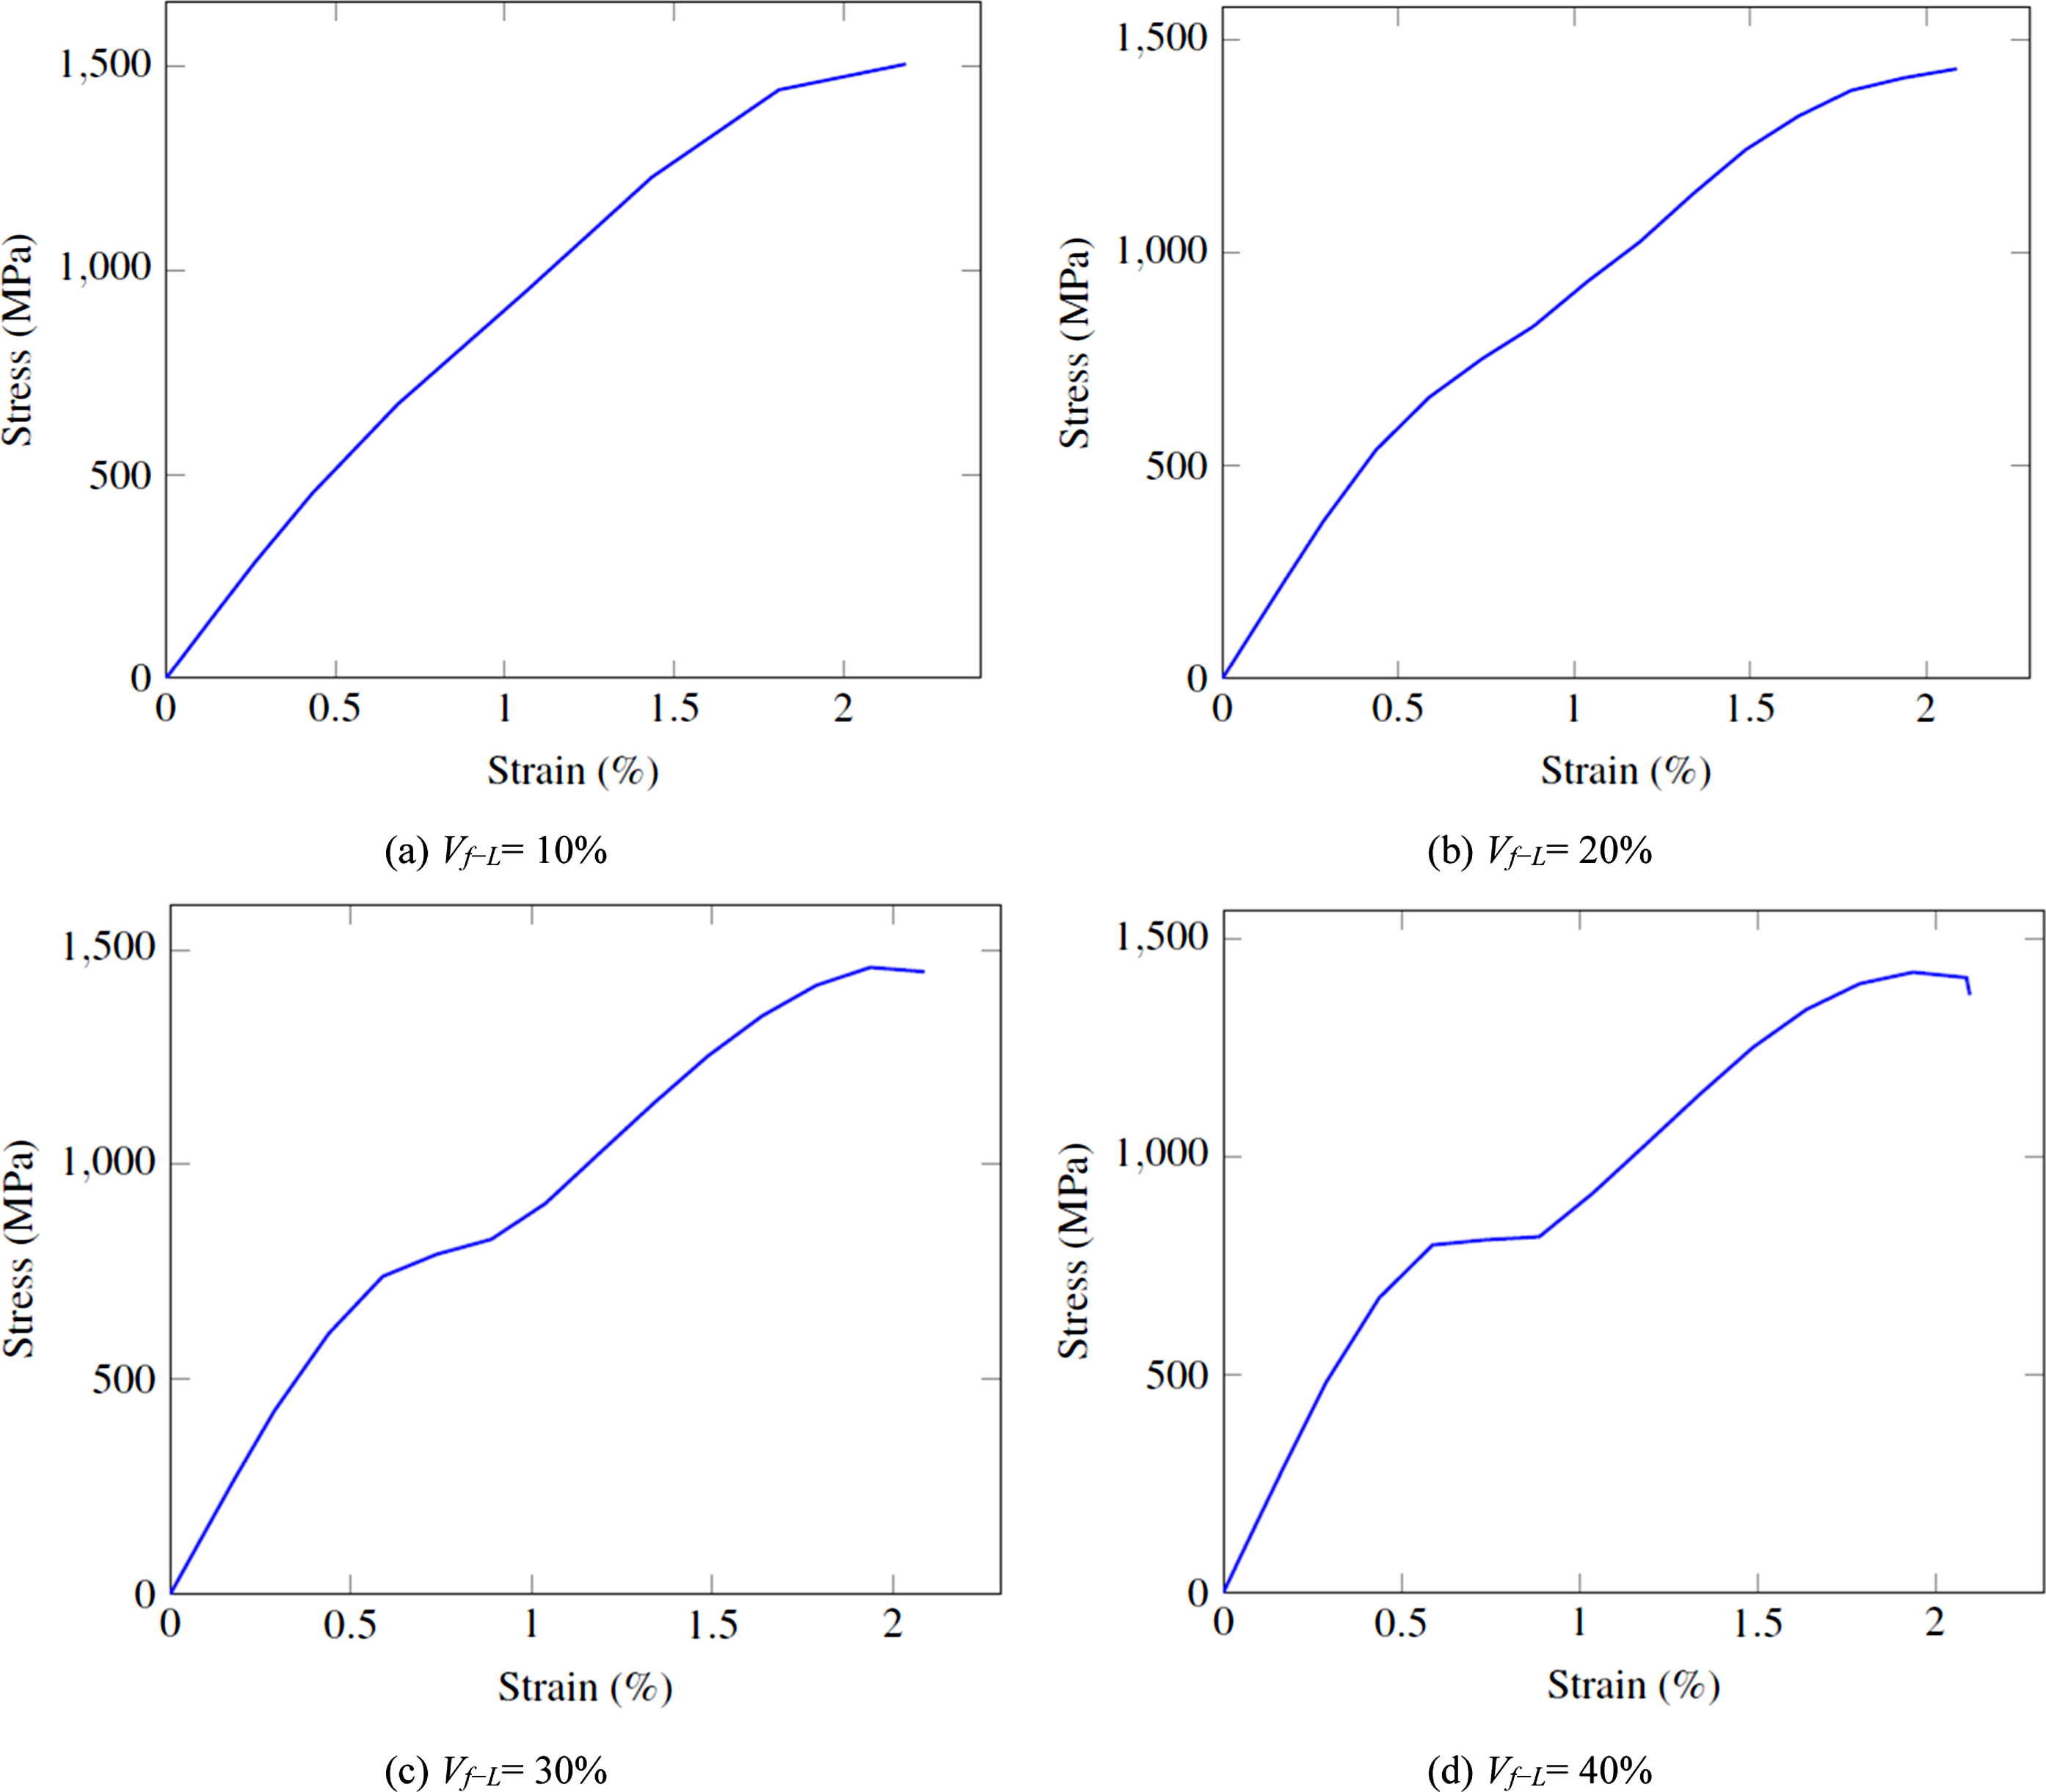
Comparison between numerical and analytical results
In this section, the results obtained from the proposed numerical model are compared with those predicted by the analytical model explained in Appendix A.


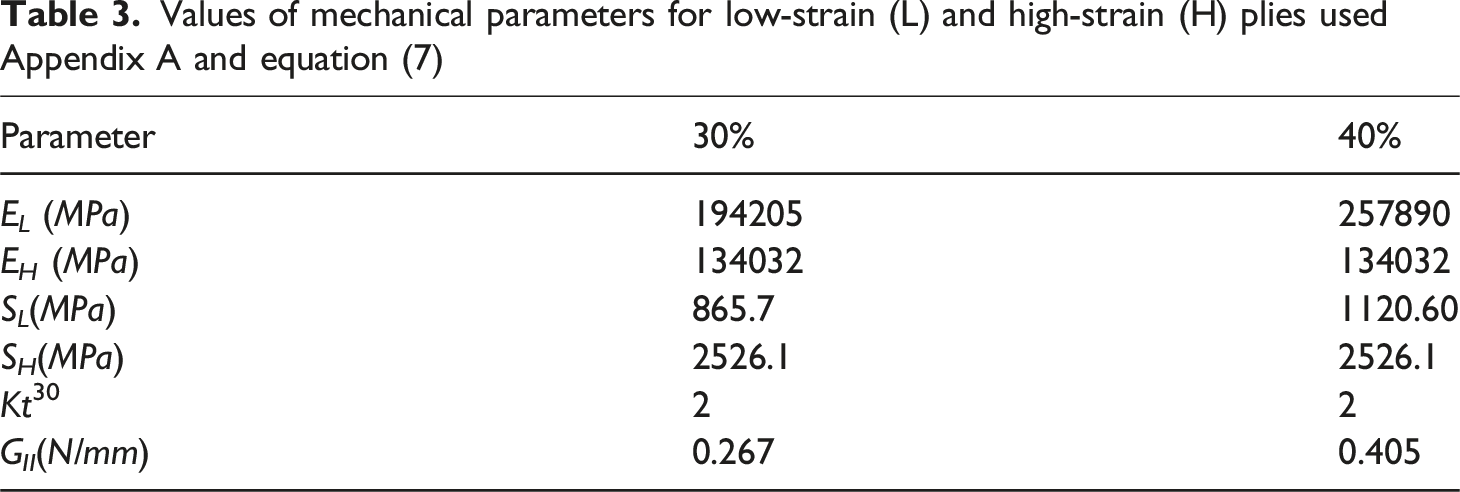
Values of mechanical parameters for low-strain (L) and high-strain (H) plies used Appendix A and equation (7)
To observe a pseudo-ductile behavior in a hybrid composite, it is essential to assess the following criterion as outlined in8.
According to Czél et al. study,
8
the G
II
value for a carbon/carbon composite should be less than 0.5 N/mm to observe a pseudo-ductile behavior. This criterion is met for both models with
Figure 11 compares the tensile stress-strain curves obtained from the numerical and analytical models and shows a good agreement between them. It is important to note that the analytical model considers a simple linear stress-strain response for each segment, whereas the numerical model can predict a nonlinear stress-strain behavior as it considers fiber fragmentation. Comparison between the tensile stress-strain curves obtained from the proposed numerical model and the analytical model
16
for two three-ply composites with (a) 30% and (b) 40% fiber volume fractions in the middle ply, and 0.2 mm width and thickness.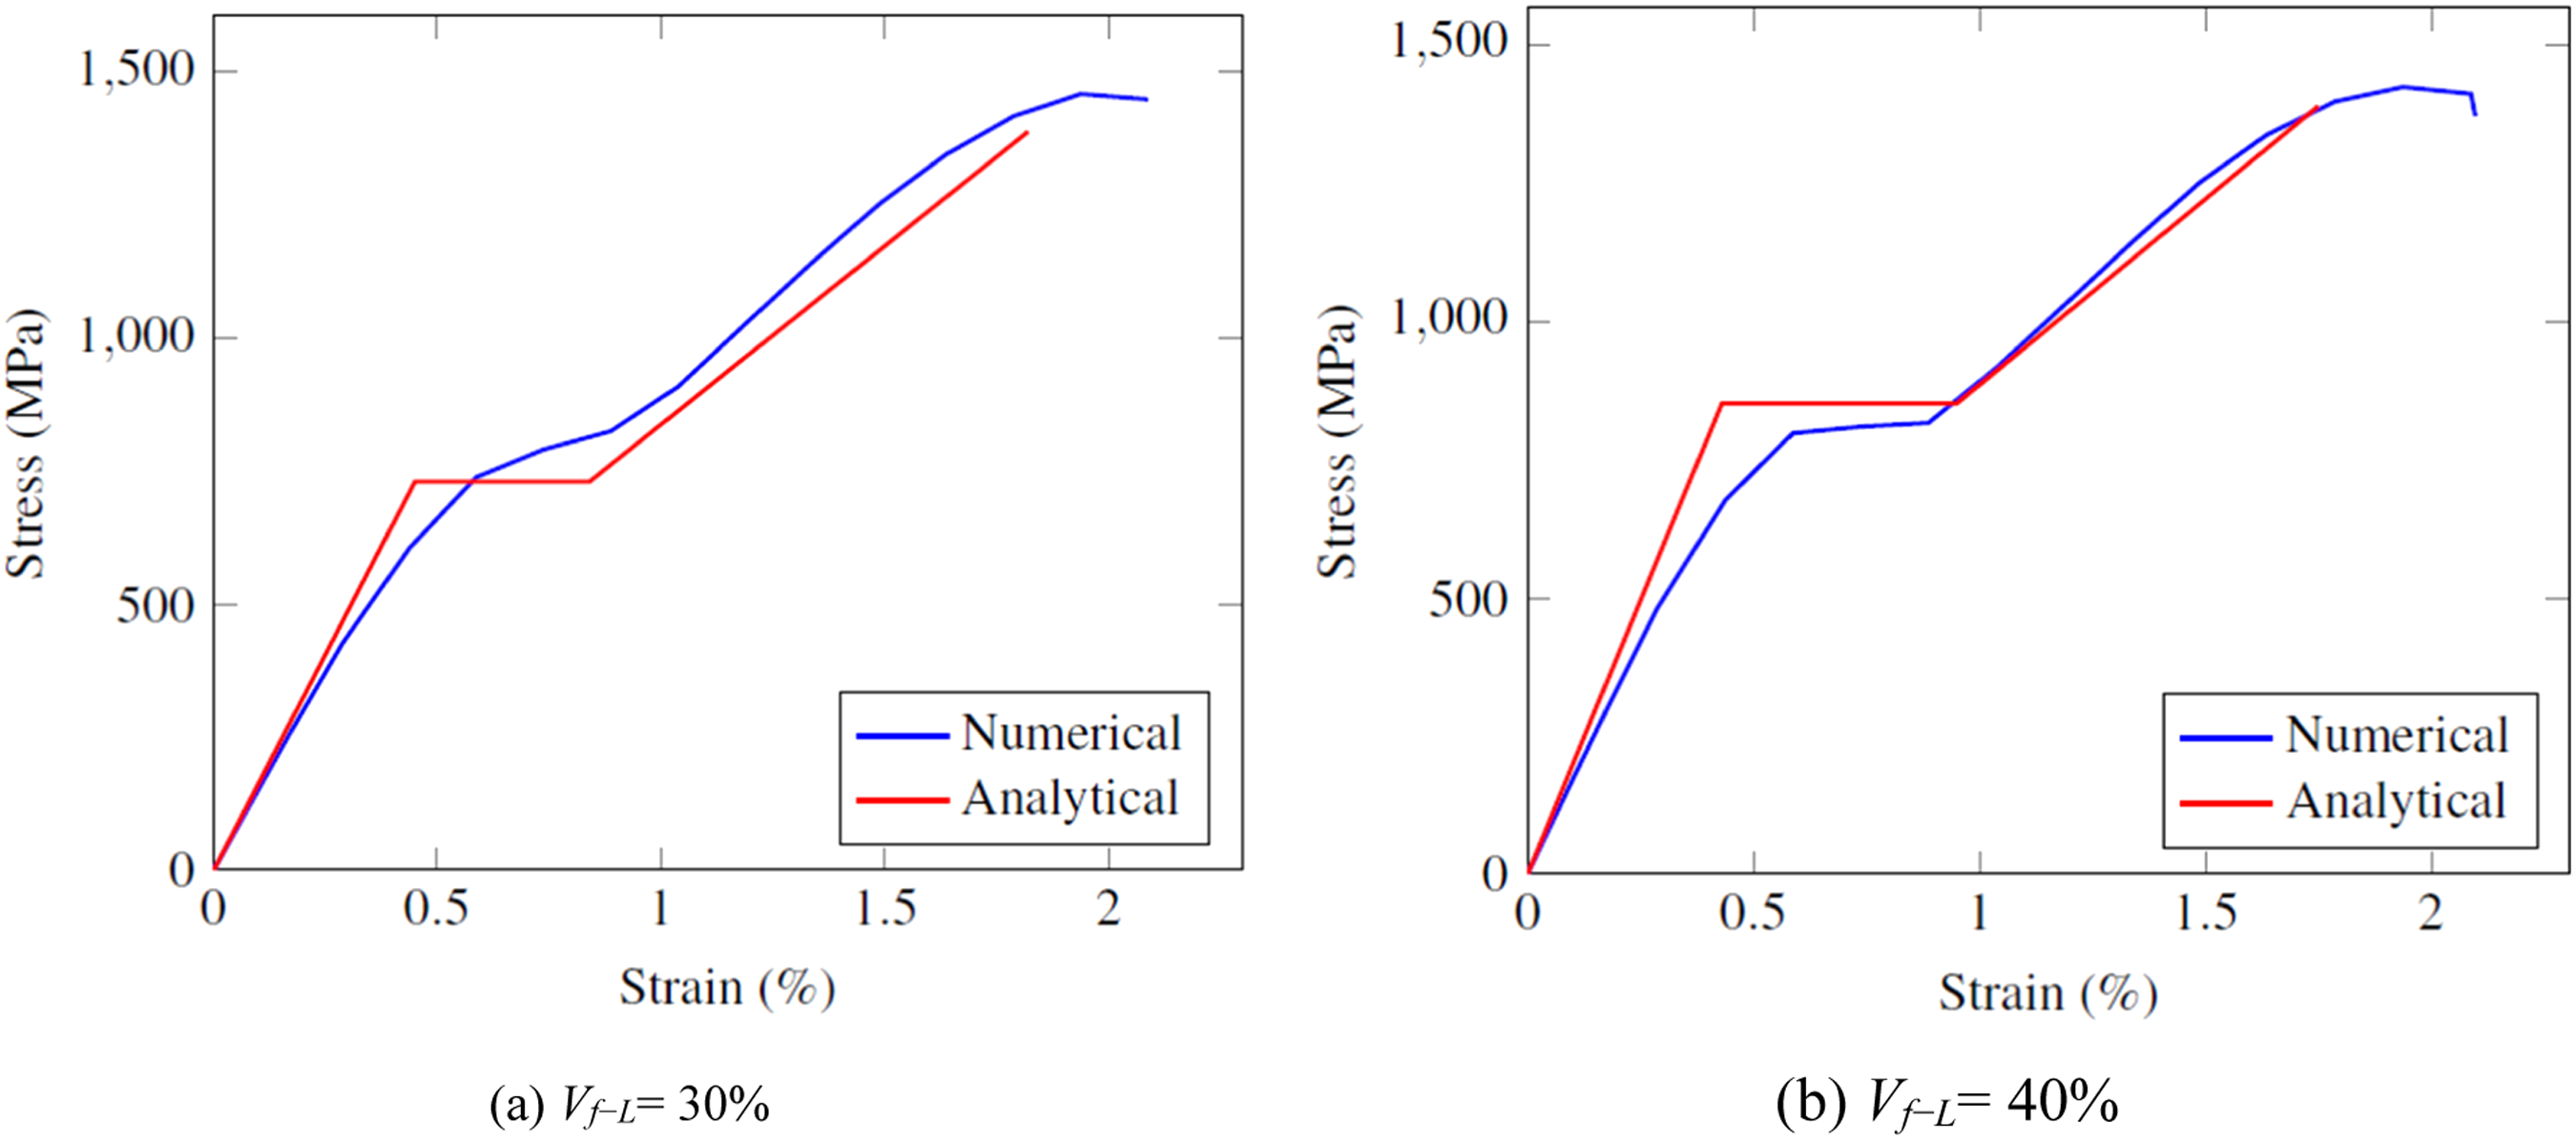
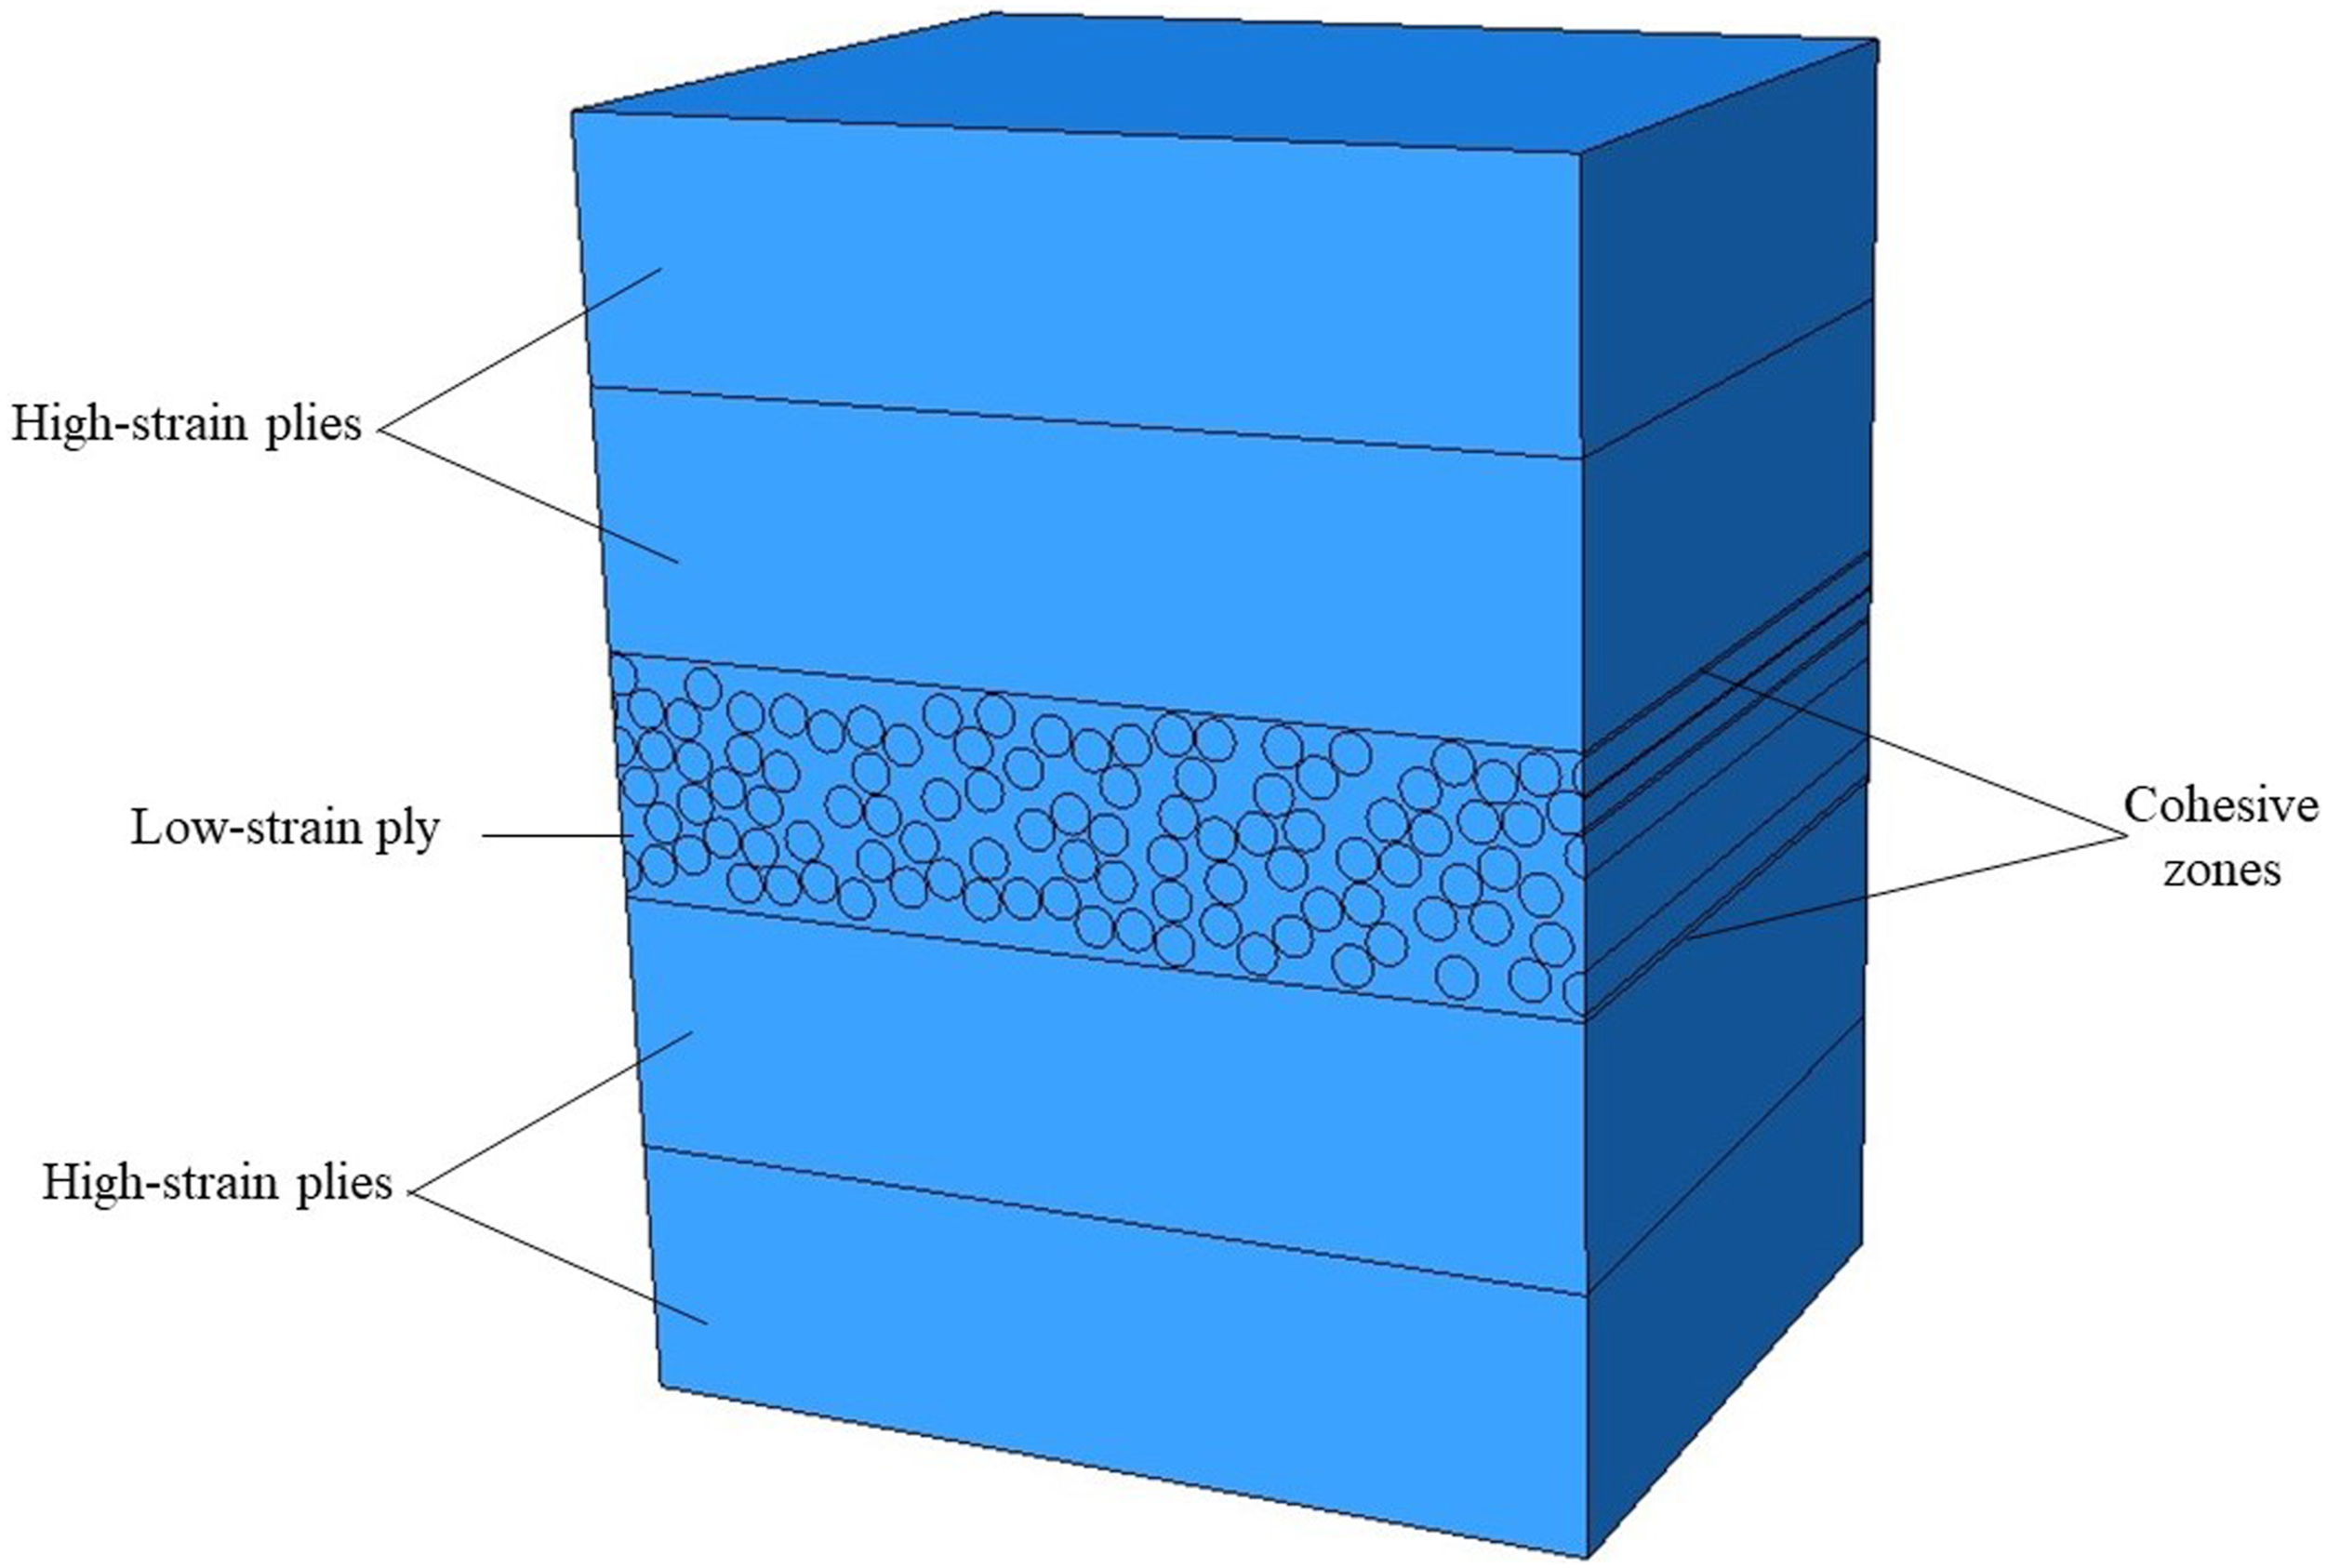
Validation of the model against experimental results
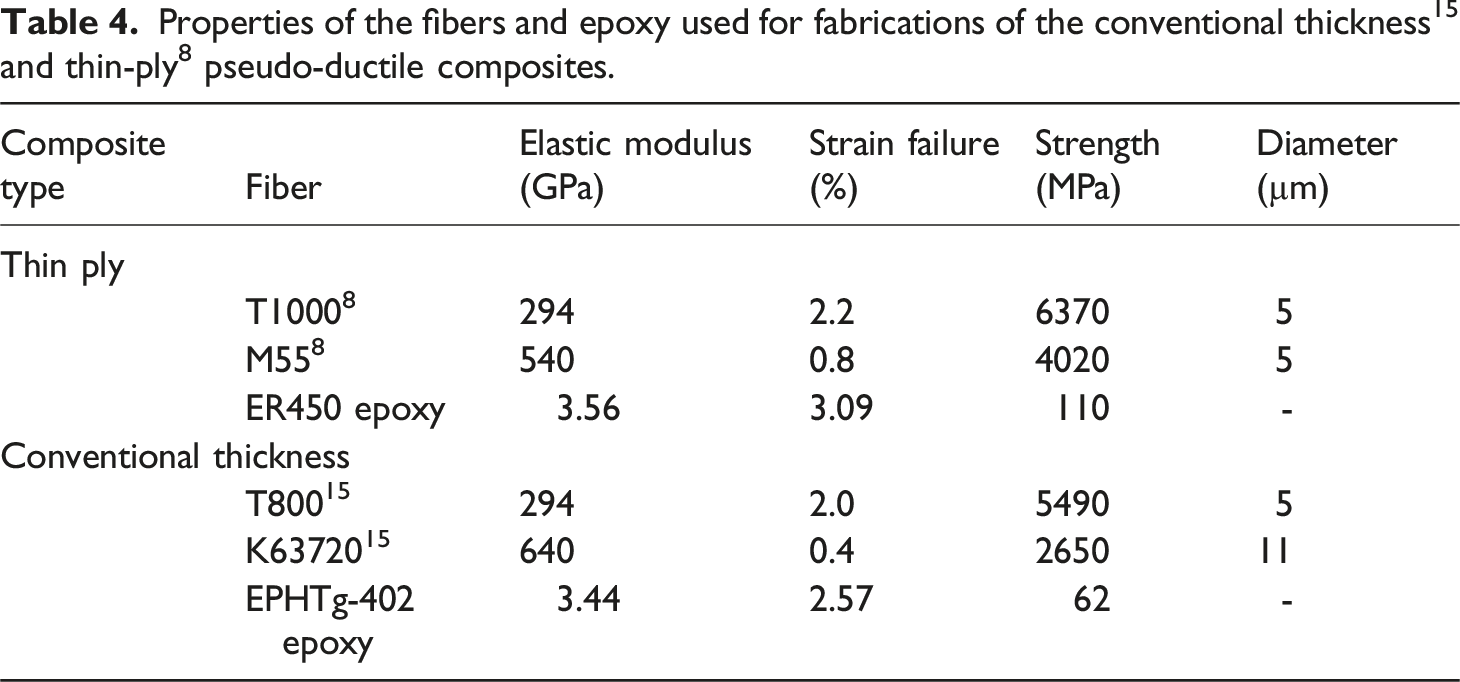
Since the middle ply gradual failure and the inter-ply delamination are the primary reasons for the nonlinear behavior exhibited by the conventional thickness and thin-ply pseudo-ductile composites, in this section, in order to save the computational costs while maintaining a high level of accuracy, only the middle layer is modelled with detailed fiber characteristics (micro-scale model), and the top and bottom layers are modeled as a macro-scale model. The mechanical properties of the top and bottom high-strain plies are obtained based on a homogenization approach using the Chamis’s formulas (Equations (5) and (6)). 29 The fiber volume fraction in the middle ply of the conventional thickness and thin-ply composites are 55% and 51.3%, respectively. The nearest neighbor algorithm 22 employed to generate fibers within the matrix (Section FE implementation) ensured that each successive fiber was positioned in close proximity to the initial one and thus such high fiber volume fractions (above 45%) are feasible. The Weibull modulus (m) for all fibers was assumed to be 6.6.
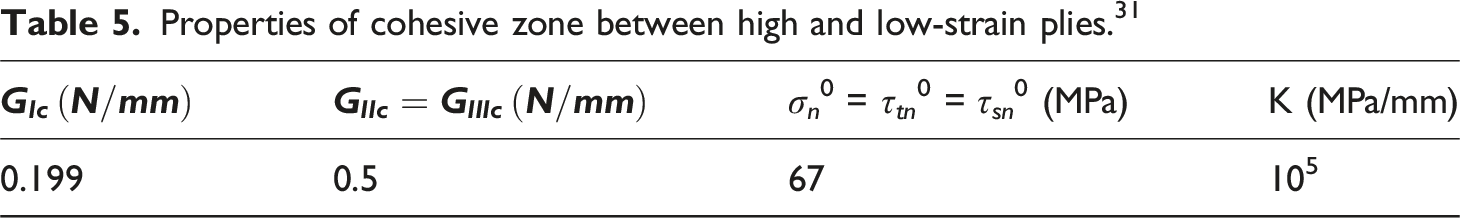
Properties of cohesive zone between high and low-strain plies. 31
Geometry of the conventional thickness RVE.
Geometry of the M55’s RVE with considering cohesive zones.
After generating these RVE, the load and PBCs mentioned in Section FE implementation were applied to the meshed RVEs. The tensile behavior of these RVEs was then analyzed using the ABAQUS FE software linked with our UMAT Fortran subroutine.
Figure 14 shows the tensile stress-strain curves obtained from the proposed model and experimental results in Sapozhnikov et al.
15
and Czél G et al.
8
studies. Figure 14 shows that the proposed numerical model accurately predicts the tensile response of pseudo-ductile composites, irrespective of their manufacturing methods, that is thin-ply and conventional thickness. Figure 14 also shows that by incorporating the cohesive zone to the model, it can effectively capture delamination between low-strain and high-strain plies in the thin-ply composite, resulting in improved alignment between numerical and experimental results. Comparison between numerical and experimental results for both M55 (thin-ply) and T3DT3 (conventional thickness) composites. (a) M55, (b) T3DT3.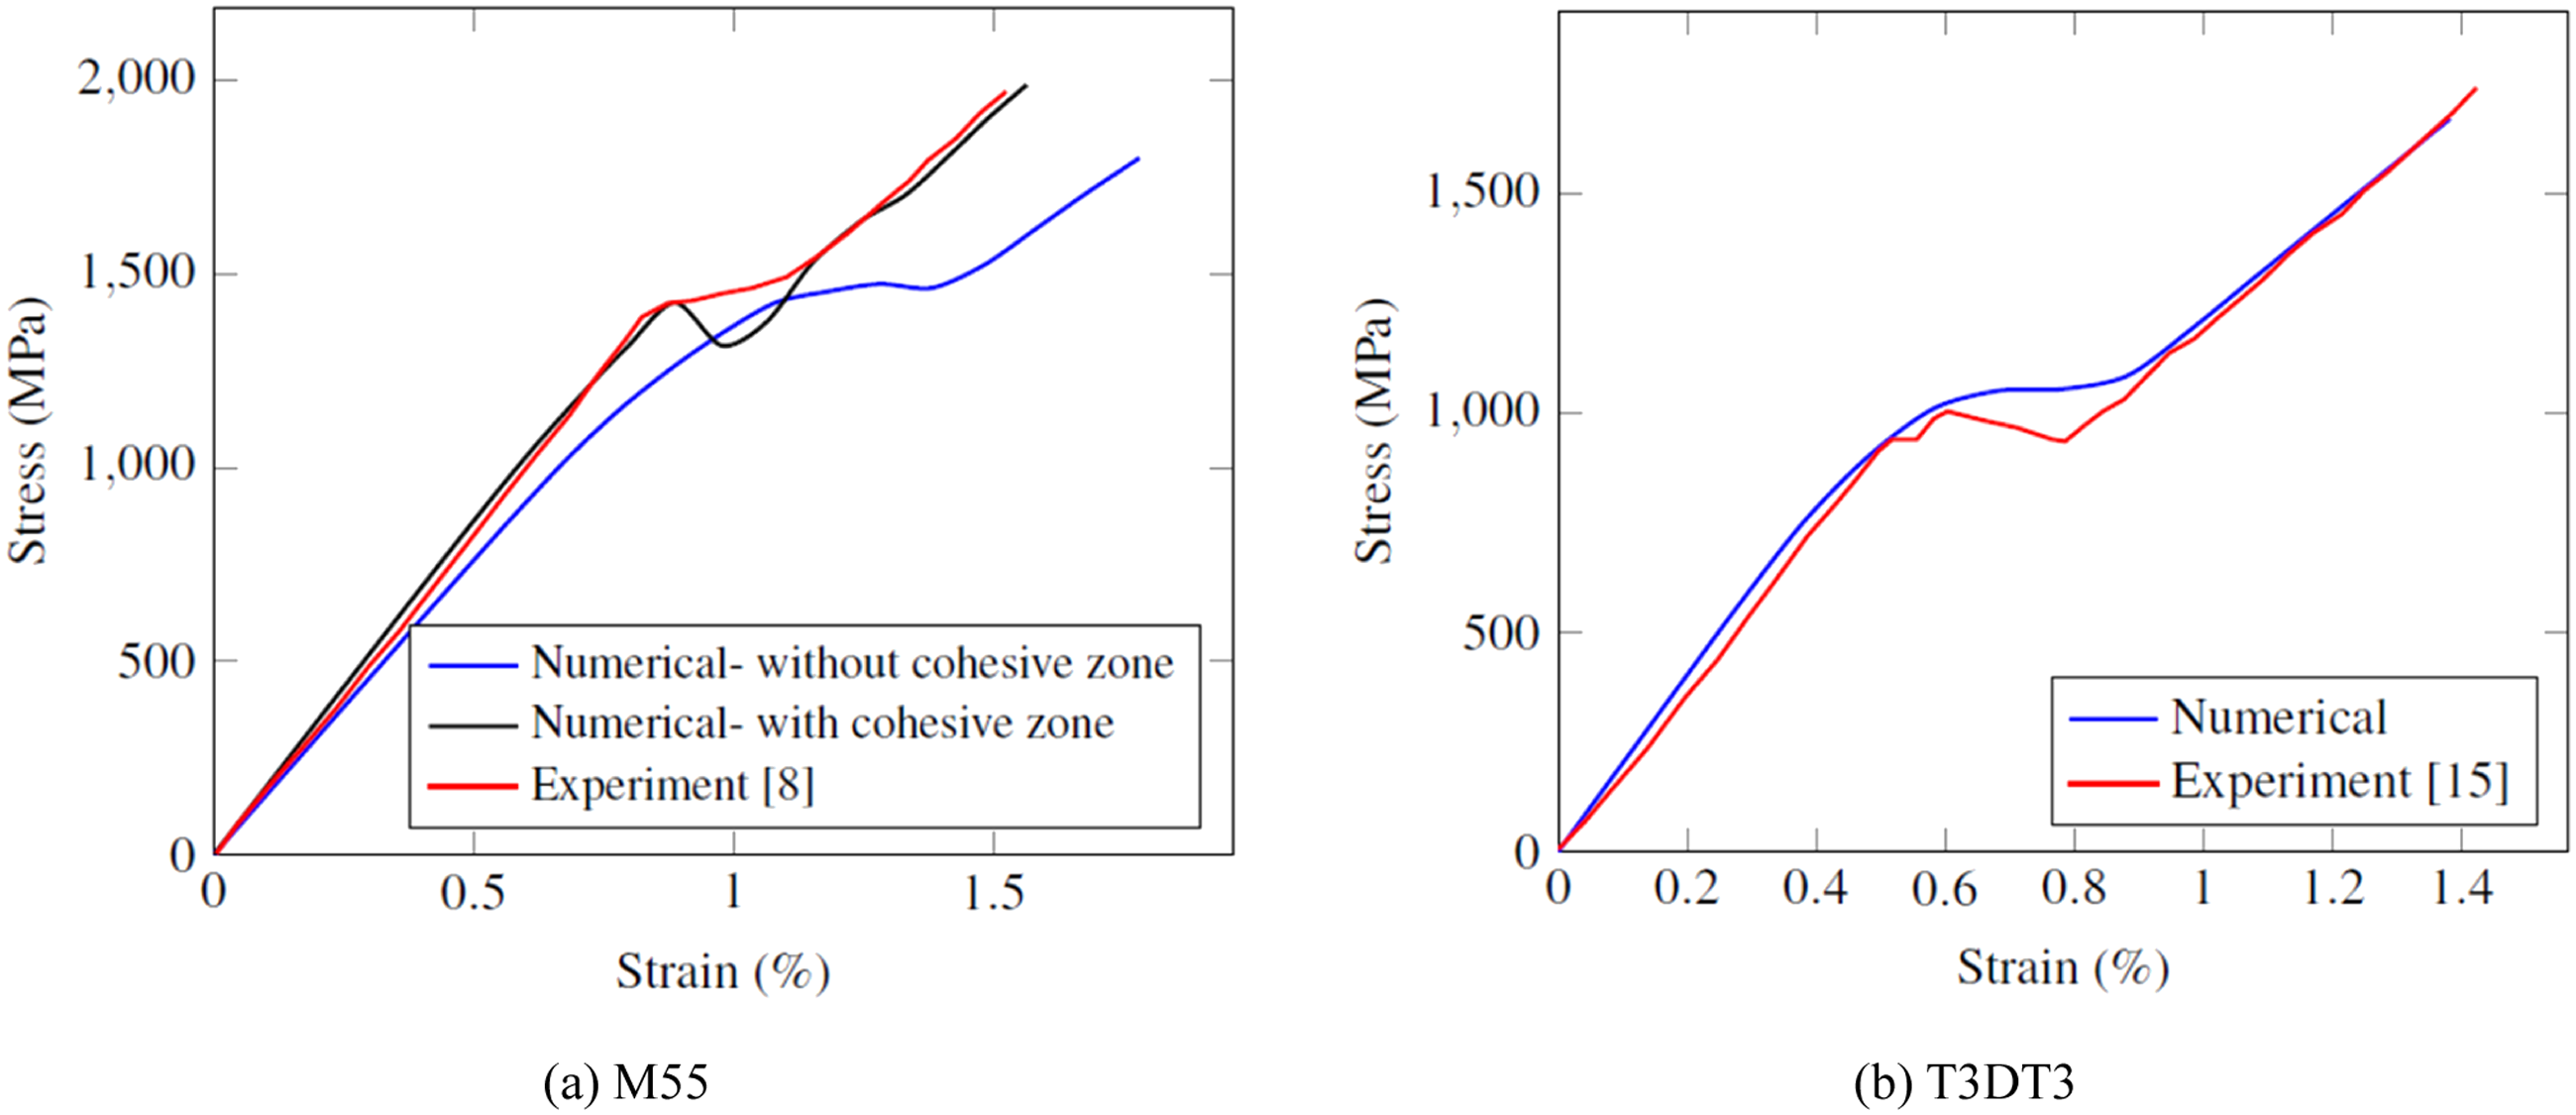
Figure 15 shows the von Mises stress distribution in both types of pseudo-ductile composites at different strain values during the displacement-controlled tensile loading. In Figure 15(c) the delamination and fiber failure are both the reason for gradual failure in thin-ply pseudo-ductile composite. However, fiber failure of the Vf−L is the main reason for gradual failure of conventional thickness composite (15-f). Stress contours on M55 and T3-D-T3, (a) M55 -(ϵ = 0.2%), (b) M55 (ϵ = 0.63%), (c) M55 (ϵ = 1.4%), (d) T3DT3 - (ϵ = 0.2%), (e) T3DT3 - (ϵ = 0.65%), (f) T3DT3 - (ϵ = 1.2%).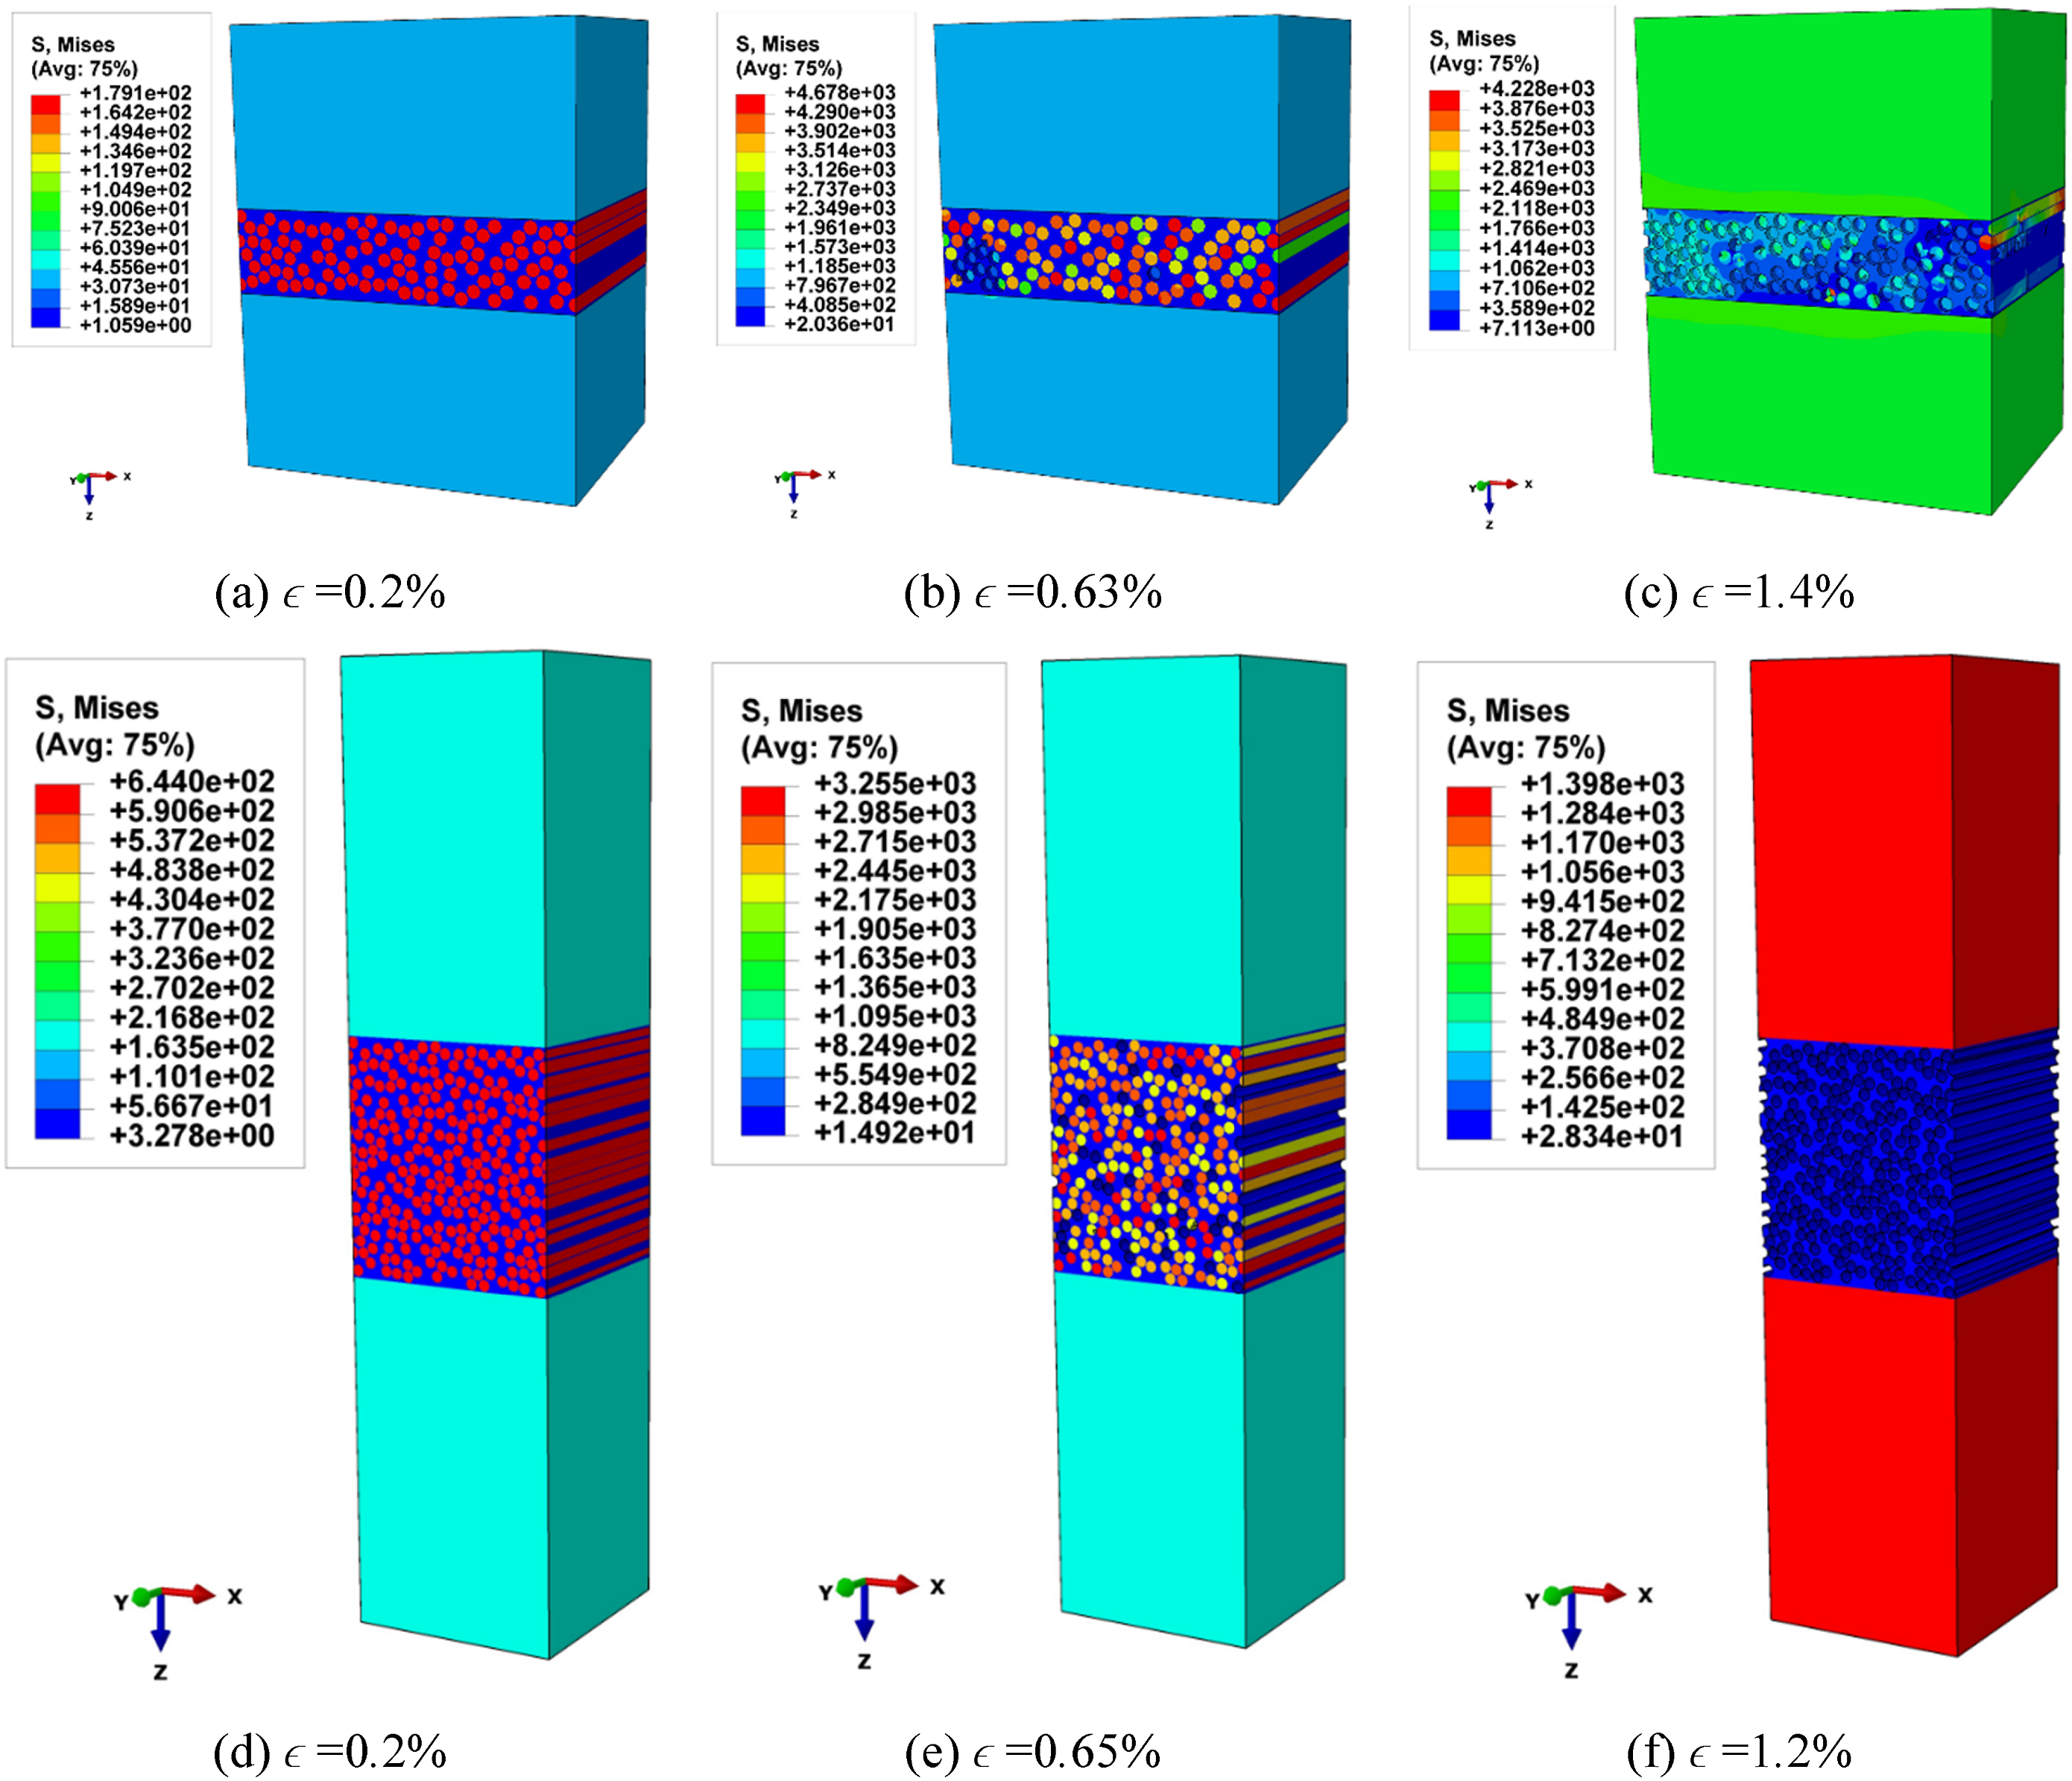
When the RVE of the thin-ply pseudo-ductile composite is subjected to tensile loading, fibers within the middle ply experience elevated stress concentrations, leading to their initial failure. As the fibers in the low-strain ply fail subsequently, stress transmission occurs among the various plies, resulting in heightened stress concentration at the ply interfaces. This heightened stress level augments the interlaminar energy between plies, ultimately leading to delamination. The delamination between low and high-strain plies of thin-ply pseudo-ductile composite is shown in Figure 16. In Figure 16, ‘COPEN’ in the clearance between two contacted surfaces in mm. Delamination between low and high-strain plies in thin-ply pseudo-ductile composite.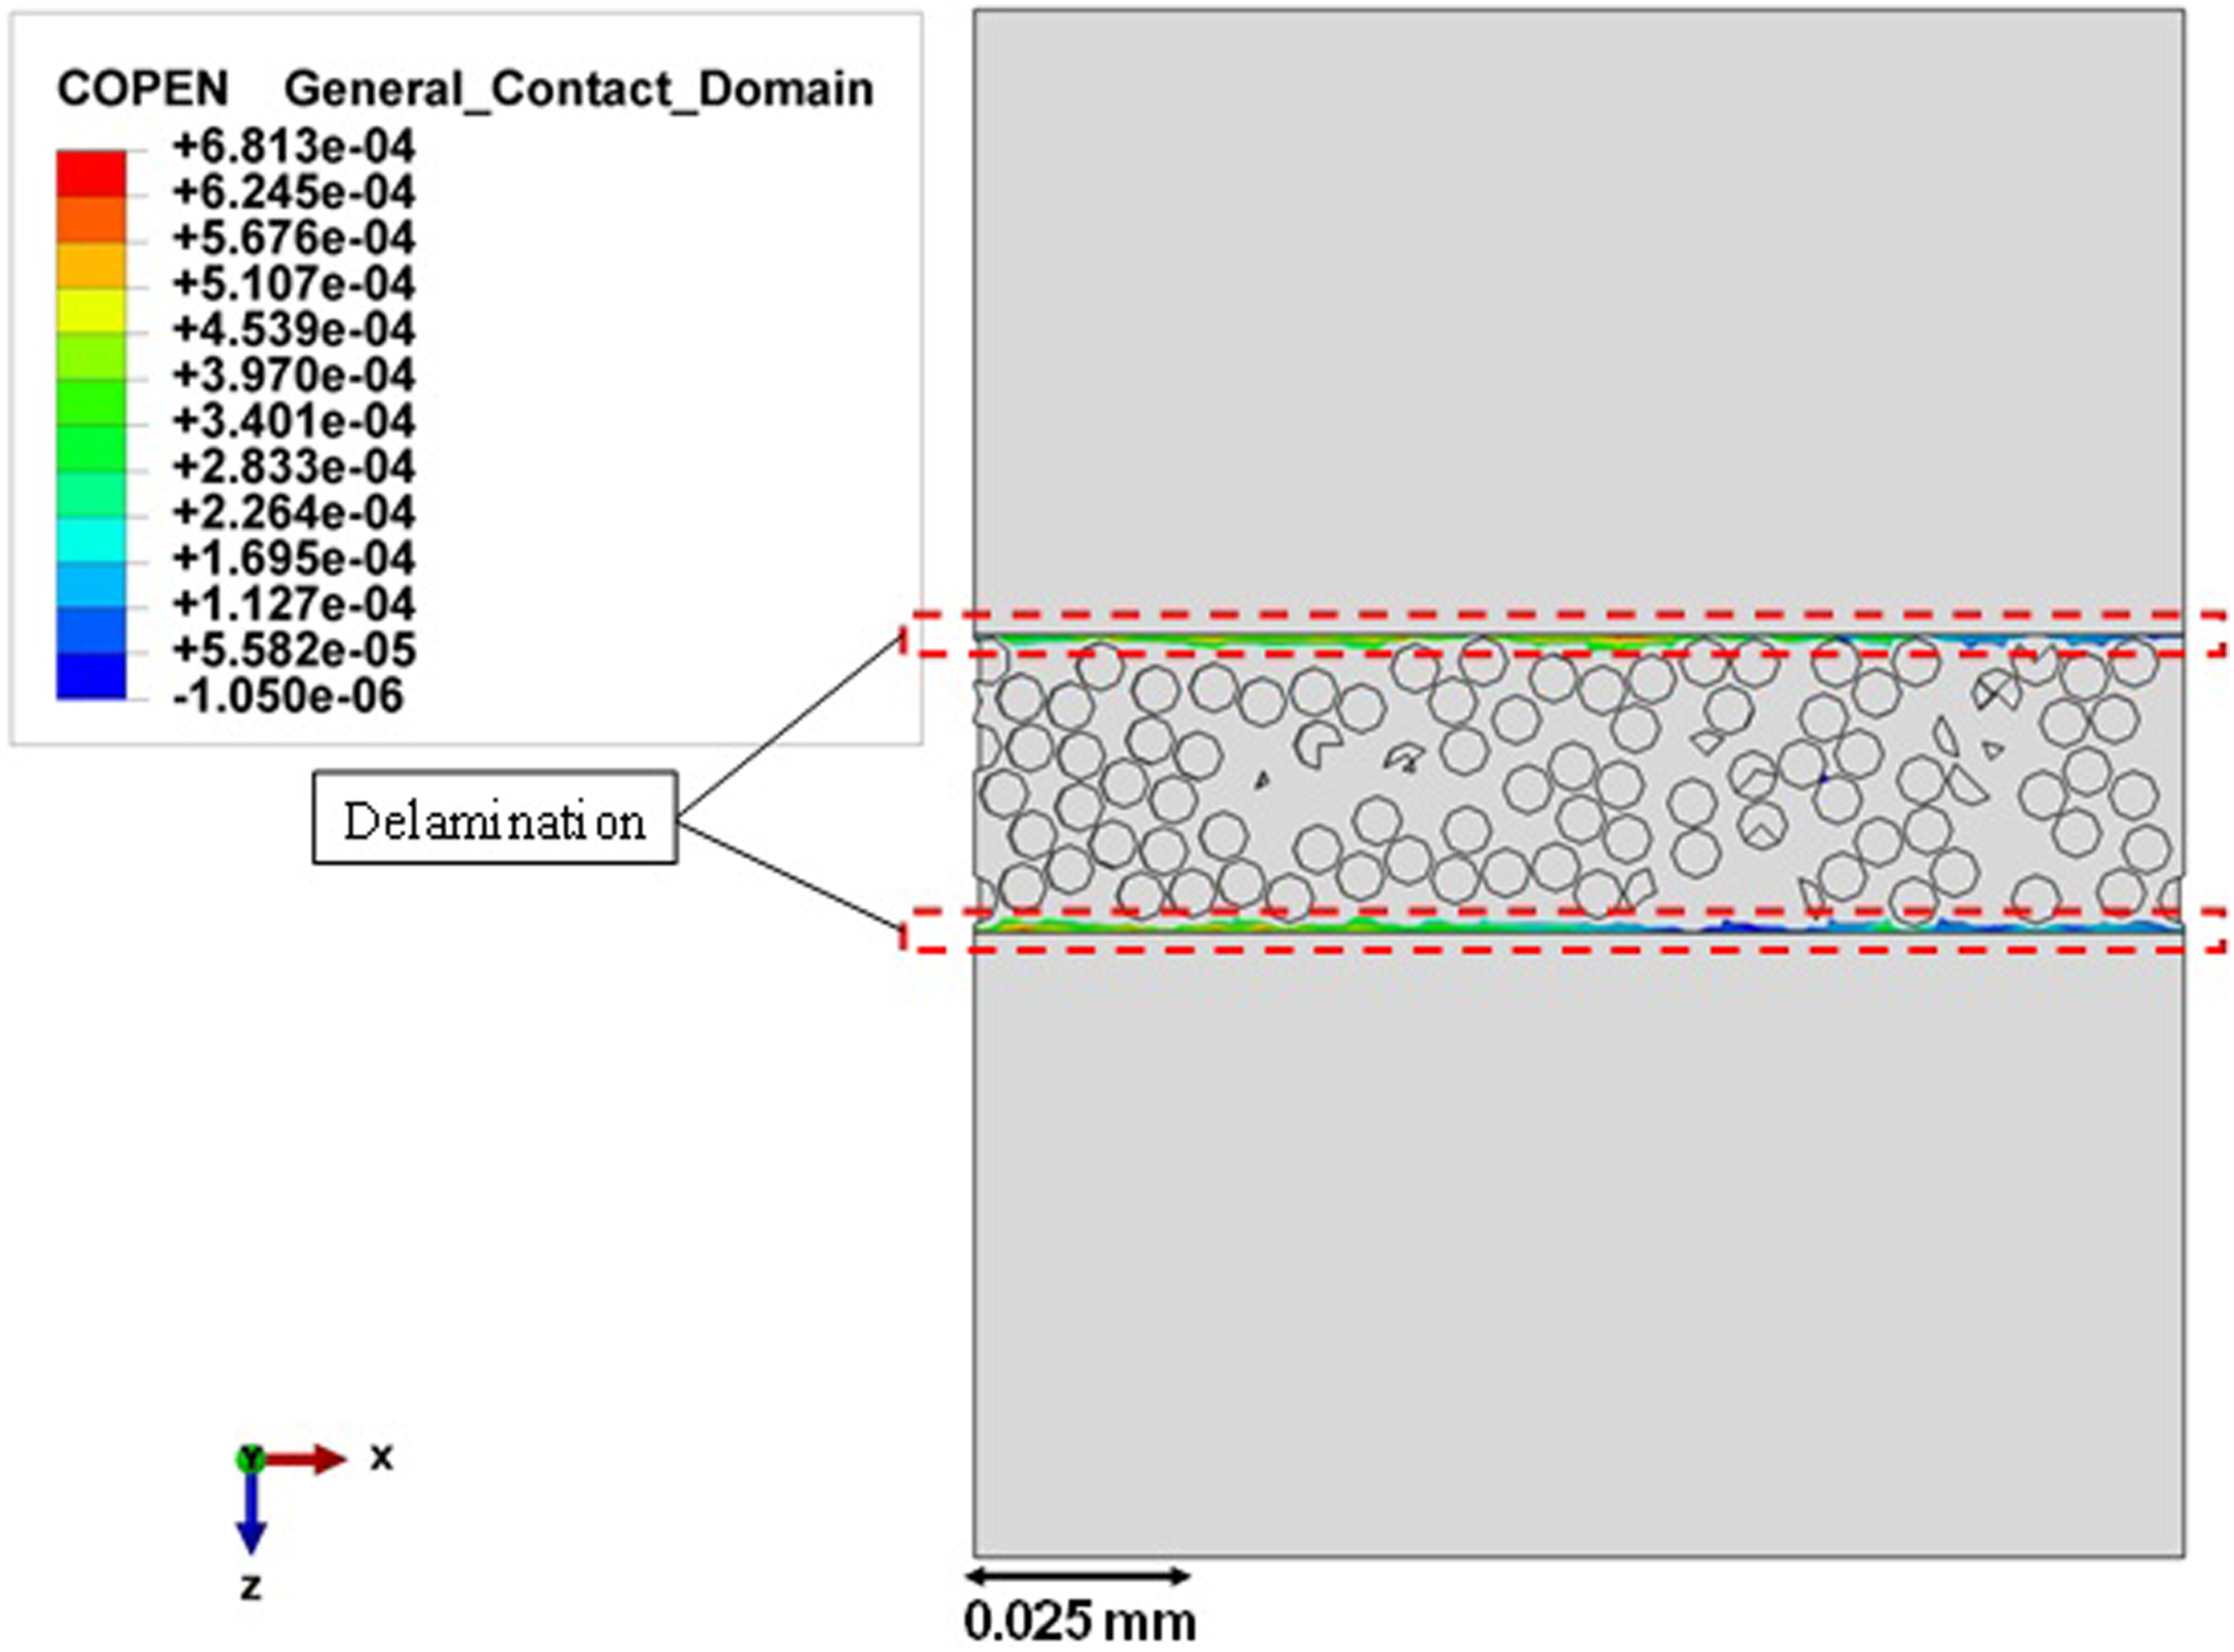
Effect of the middle-ply fibers’ tensile strength variation: It was shown in the previous sections that fragmentation of the low-strain material is the primary cause for observing pseudo-ductile behavior in pseudo-ductile composite with conventional thickness. In addition, variation of the tensile strength in the fibers of the middle ply has a critical role in the low-strain ply fragmentation. In the proposed model, the Weibull modulus is capable of altering the strength distribution among fibers of the middle ply, resulting in a change in the pseudo-ductile behavior of the composite. Therefore, in this section, five different Weibull moduli were considered for the low-strain material in the T3DT3 composite (Figure 17), and the tensile response predicted by the proposed model are discussed. Variations of the fiber strength for RVEs modeled using different Weibull moduli are presented in Figure 17 and the stress-strain curves predicted by the proposed model and experiments are shown in Figure 18. Strength distribution versus probability, red curve represent the Weibull distribution of fibers’ strength. (a) Weibull modulus = 1.6, (b) Weibull modulus = 3.6, (c) Weibull modulus = 6.6, (d) Weibull modulus = 10.6, (e) Weibull modulus = 15.6. The results with different Weibull moduli. (a) Weibull modulus = 1.6, (b) Weibull modulus = 3.6, (c) Weibull modulus = 6.6, (d) Weibull modulus = 10.6, (e) Weibull modulus = 15.6.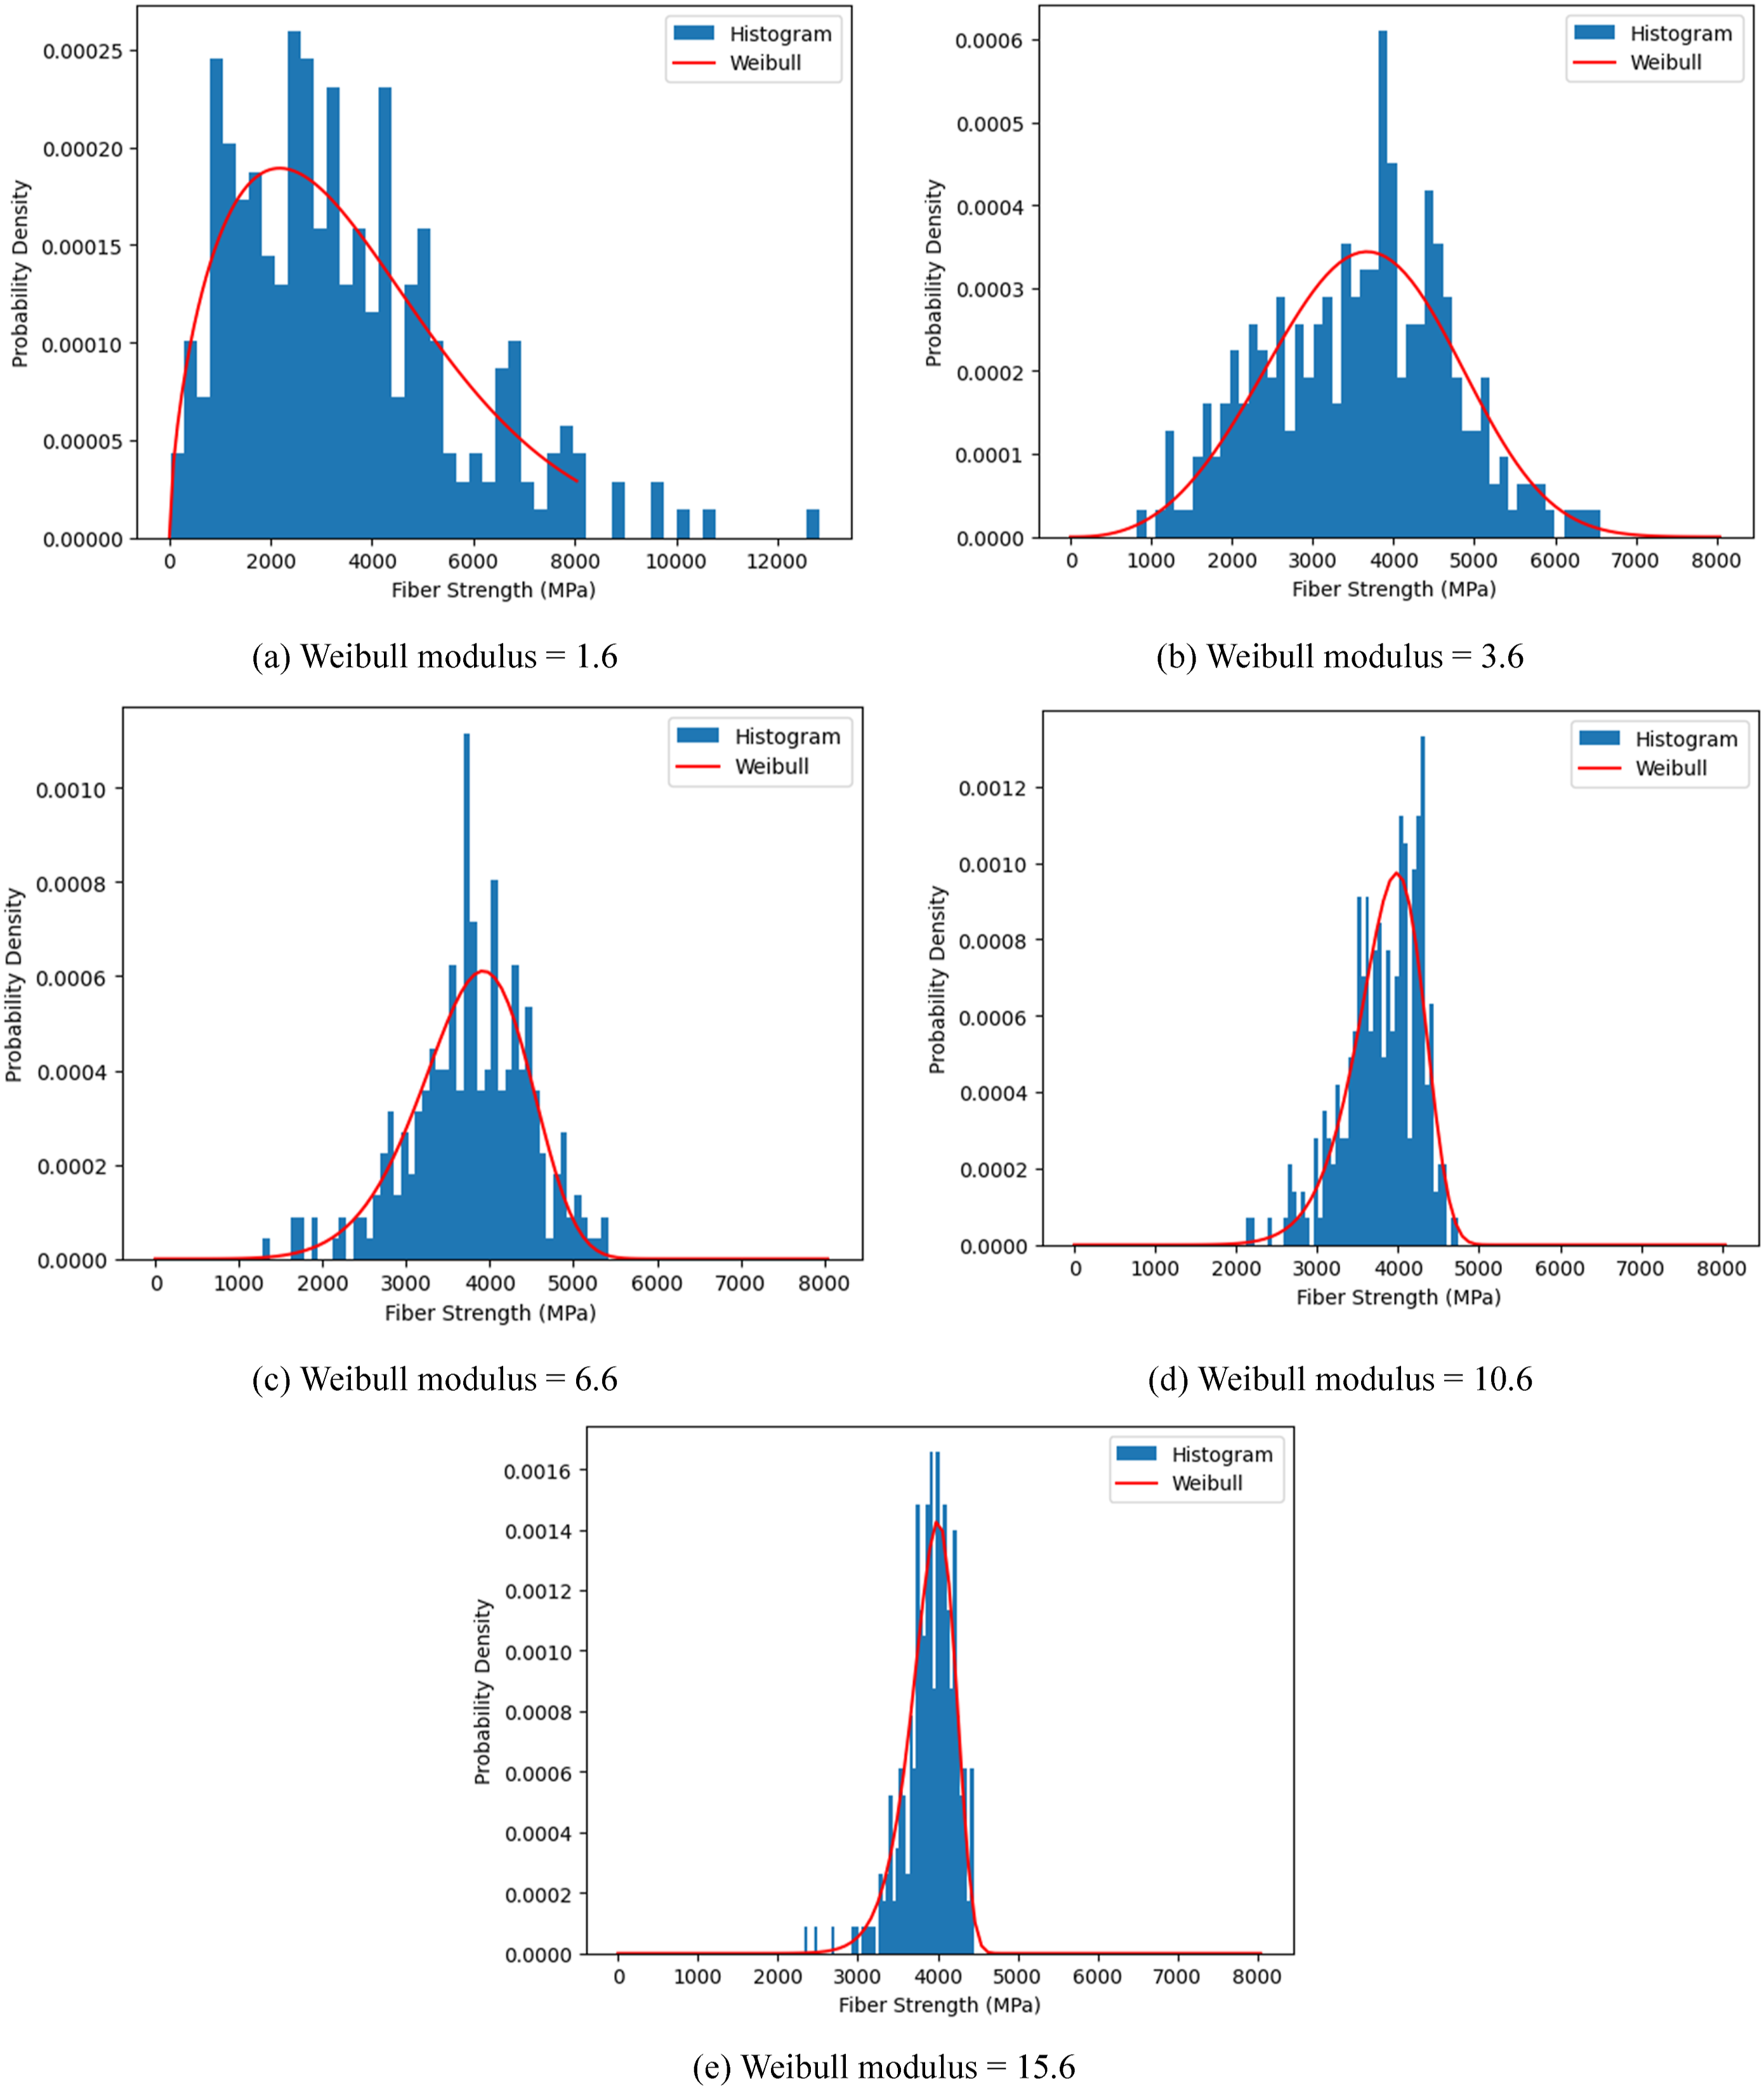
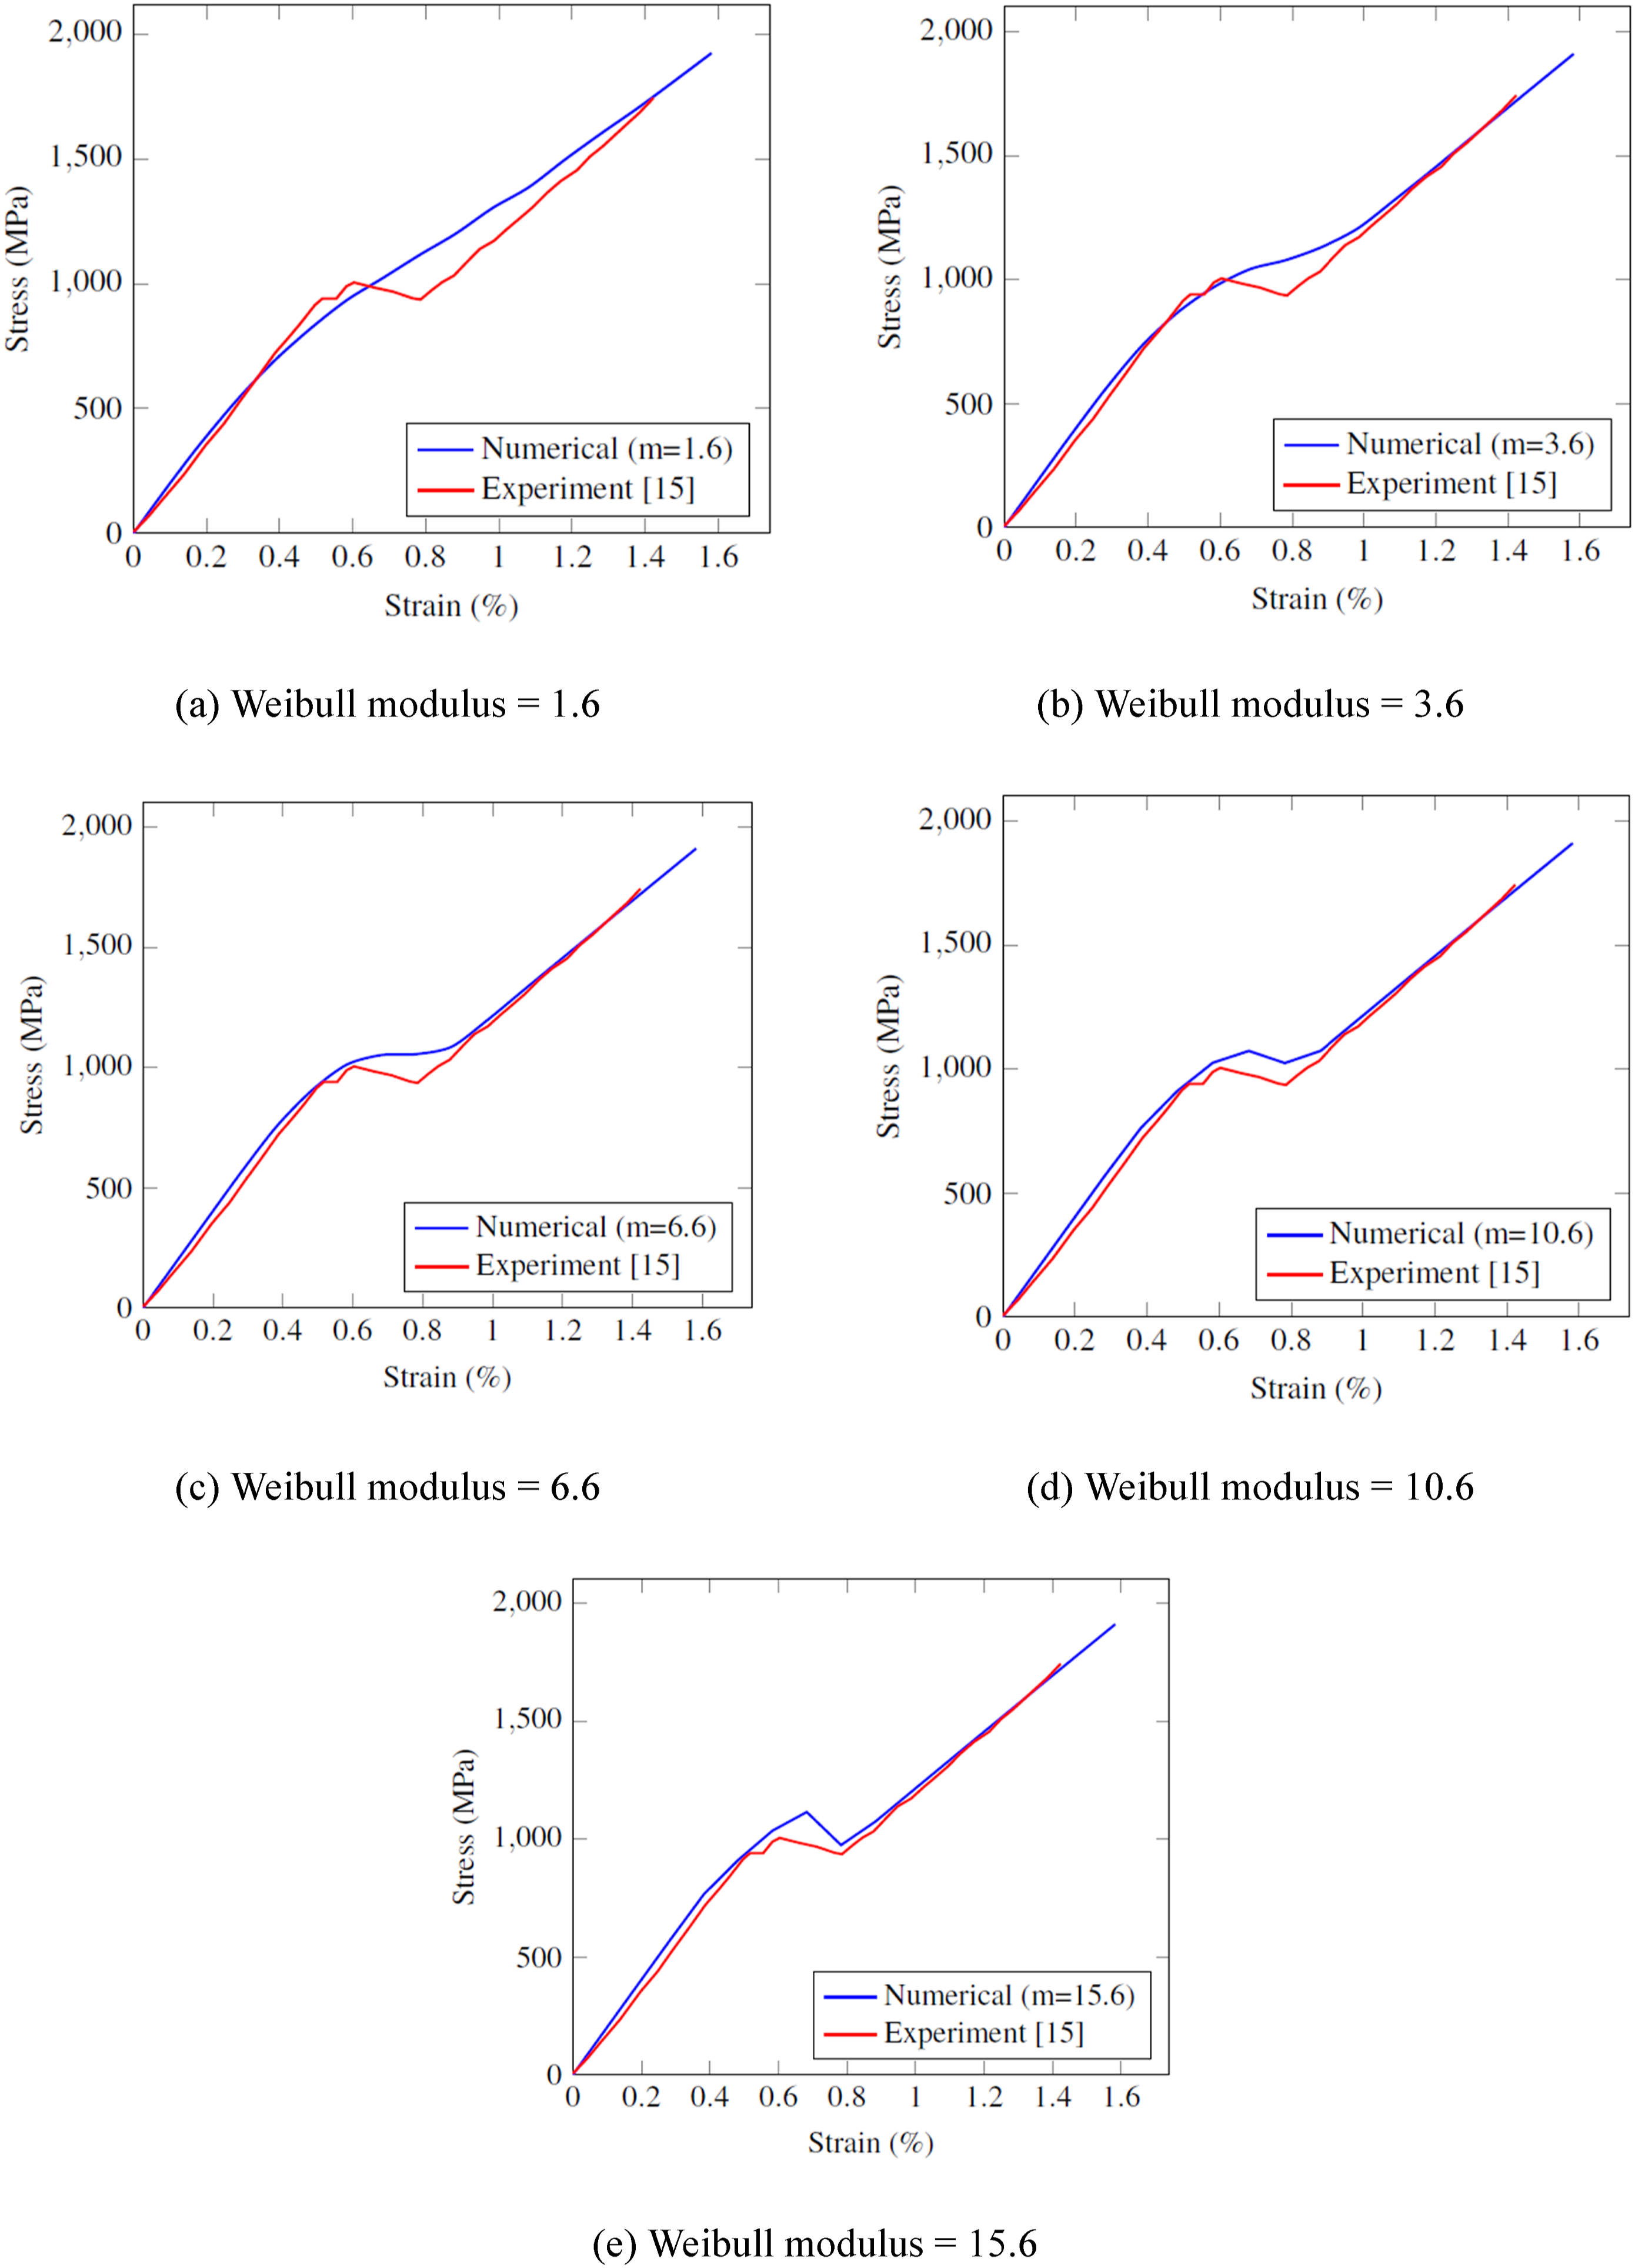
For RVEs with a high scatter in the tensile strength values of the middle-ply, that is a Weibull modulus of 1.6 in our model (Figure 17(a)), each middle-ply fiber fails at very different strain values resulting in a linear stress-strain response and not a pseudo-ductile behavior (Figure 18(a)). However, as this scatter is reduced meaning that there is less difference between the tensile strength of middle-ply fibers, that is Weibull moduli of 3.6 and 6.6 in our model (Figure 17(b) and (c)), the fibers fail at closer strain values. This results in an ideal pseudo-ductile behavior in the tensile stress-strain response of the composite (Figure 18(b) and (c)). In the case that the strength values of the middle-ply fibers are very close to each other, that is Weibull moduli of 10.6 and 15.6 in our model (Figure 17(d) and (e)), a large number of fibers will fail at almost the same strain value, leading to a sudden drop in stress values, as observed in Figure 18(d) and (e). Although in these cases (Figure 17(d) and (e)), the pseudo-ductile behavior is still observed, the sudden drop in the horizontal load-sharing plateau of the tensile stress-strain curve might not be ideal for certain structural and mechanical engineering load-bearing applications.
The analysis performed in this section indicates that in order to observe an ideal pseudo-ductile behavior, variation of the fibers’ tensile strength in the middle ply should be within a certain range. Because this variation is mainly controlled by the type of fibers used in the composite and the manufacturing process, it is important that it is optimized prior to the fabrication. The proposed micro-mechanical model can therefore be considered as a valuable tool as it is capable of controlling the fibers’ tensile strength variation by selecting the appropriate Weibull modulus.
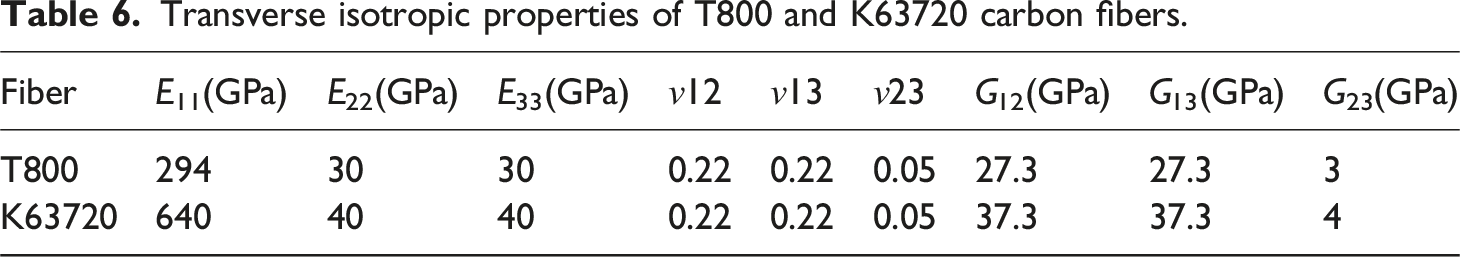
Incorporation of micro-mechanical results into a macro-scale model: In this section, elastic constants of a T3DT3 composite (with fiber volume fraction of 55% in each layer) were calculated using a multi-scale modelling technique. In this approach, micro-scale RVEs were first created for each of the low-strain (‘D’) and high strain (‘T’) plies with periodic geometries (Figure 19). The elastic constants used for modelling the carbon fibers are shown in Table 6 and those used for matrix are EPHTg-402 epoxy. The RVEs were discretized using ABAQUS C3D8R elements (element size = 0.0025 mm for D ply and element size = 0.001 mm for T ply). PBCs were employed to the boundaries of each RVE, and tensile and shear loads were applied on different planes and along different directions to determine the elastic constants of the composite. Micro-scale RVEs of (a) high and (b) low strain plies of the T3DT3 composite (conventional thickness). Transverse isotropic properties of T800 and K63720 carbon fibers.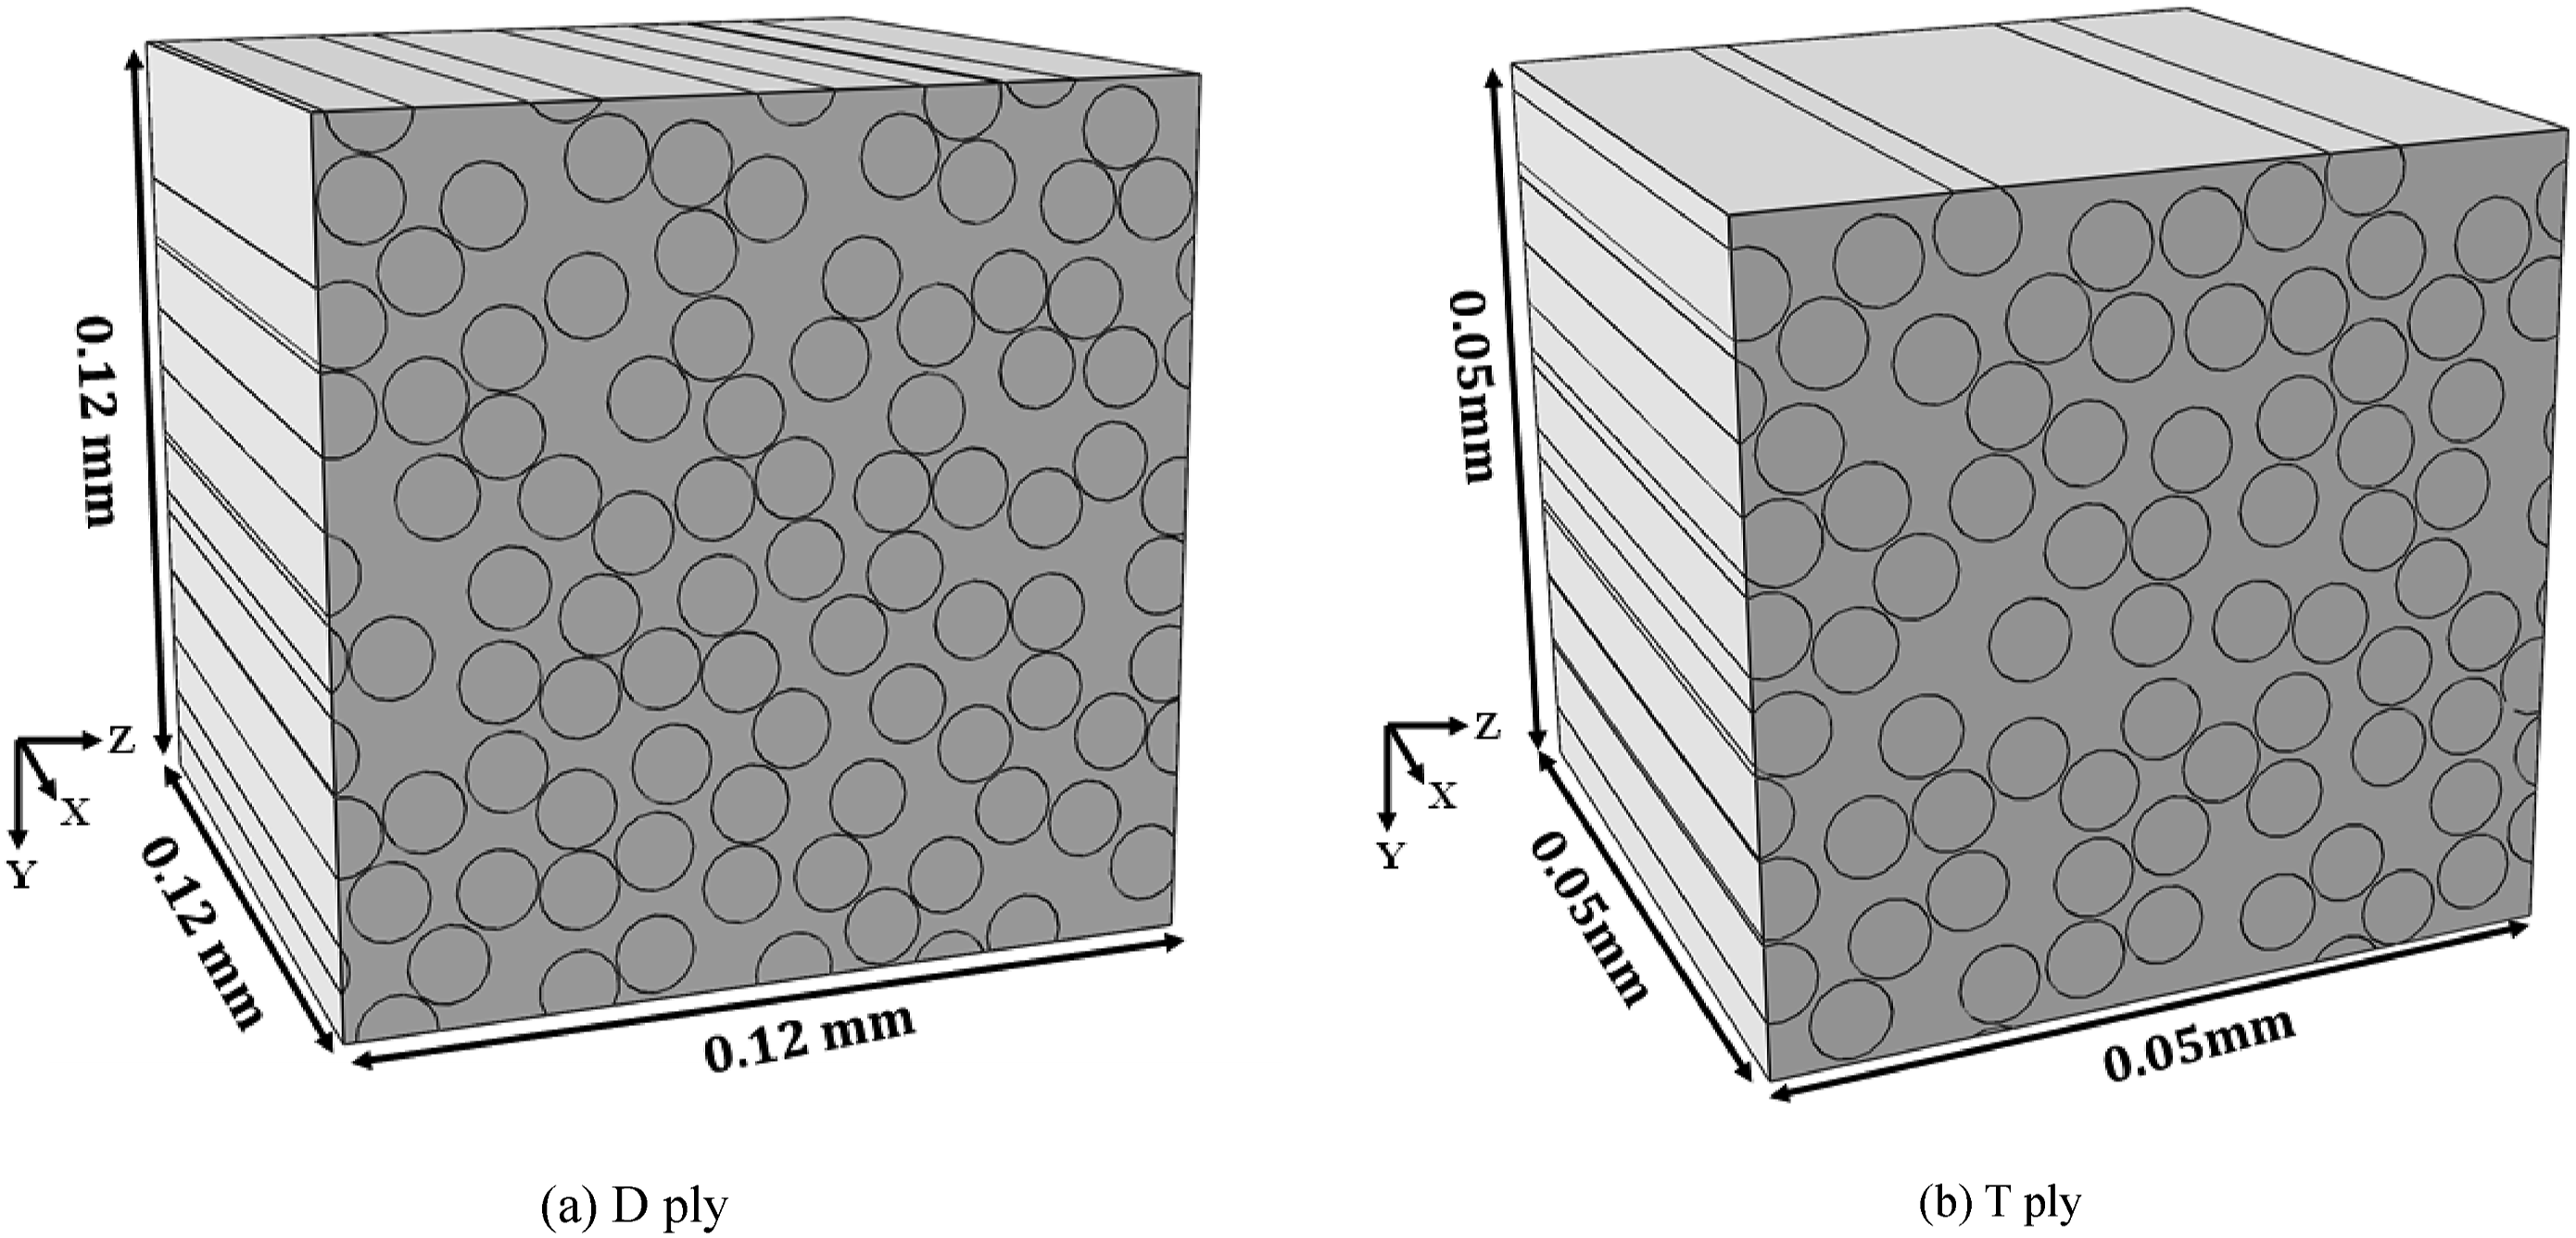
The procedure for obtaining the failure properties of each ply from the micro-scale RVEs is similar to that outlined in Section Material properties. Upon applying tensile and shear loading conditions to the RVEs, the longitudinal and transverse strengths of the composite are calculated for use in the macro-scale model. Figure 20 shows the deformed geometry of micro-scale RVEs under tensile and shear loads. Deformation of D and T plies under longitudinal, transverse, and shear loads, (a) longitudinal load on D ply in X direction (RVE Dl), (b) transverse load on D ply in Z direction (RVE Dt), (c) shear load on D ply on YZ plane (RVE Ds), (d) longitudinal load on T ply in X direction (RVE Tl), (e) transverse load on T ply in Z direction (RVE Tt), (f) shear load on T ply on YZ plane (RVE Ts).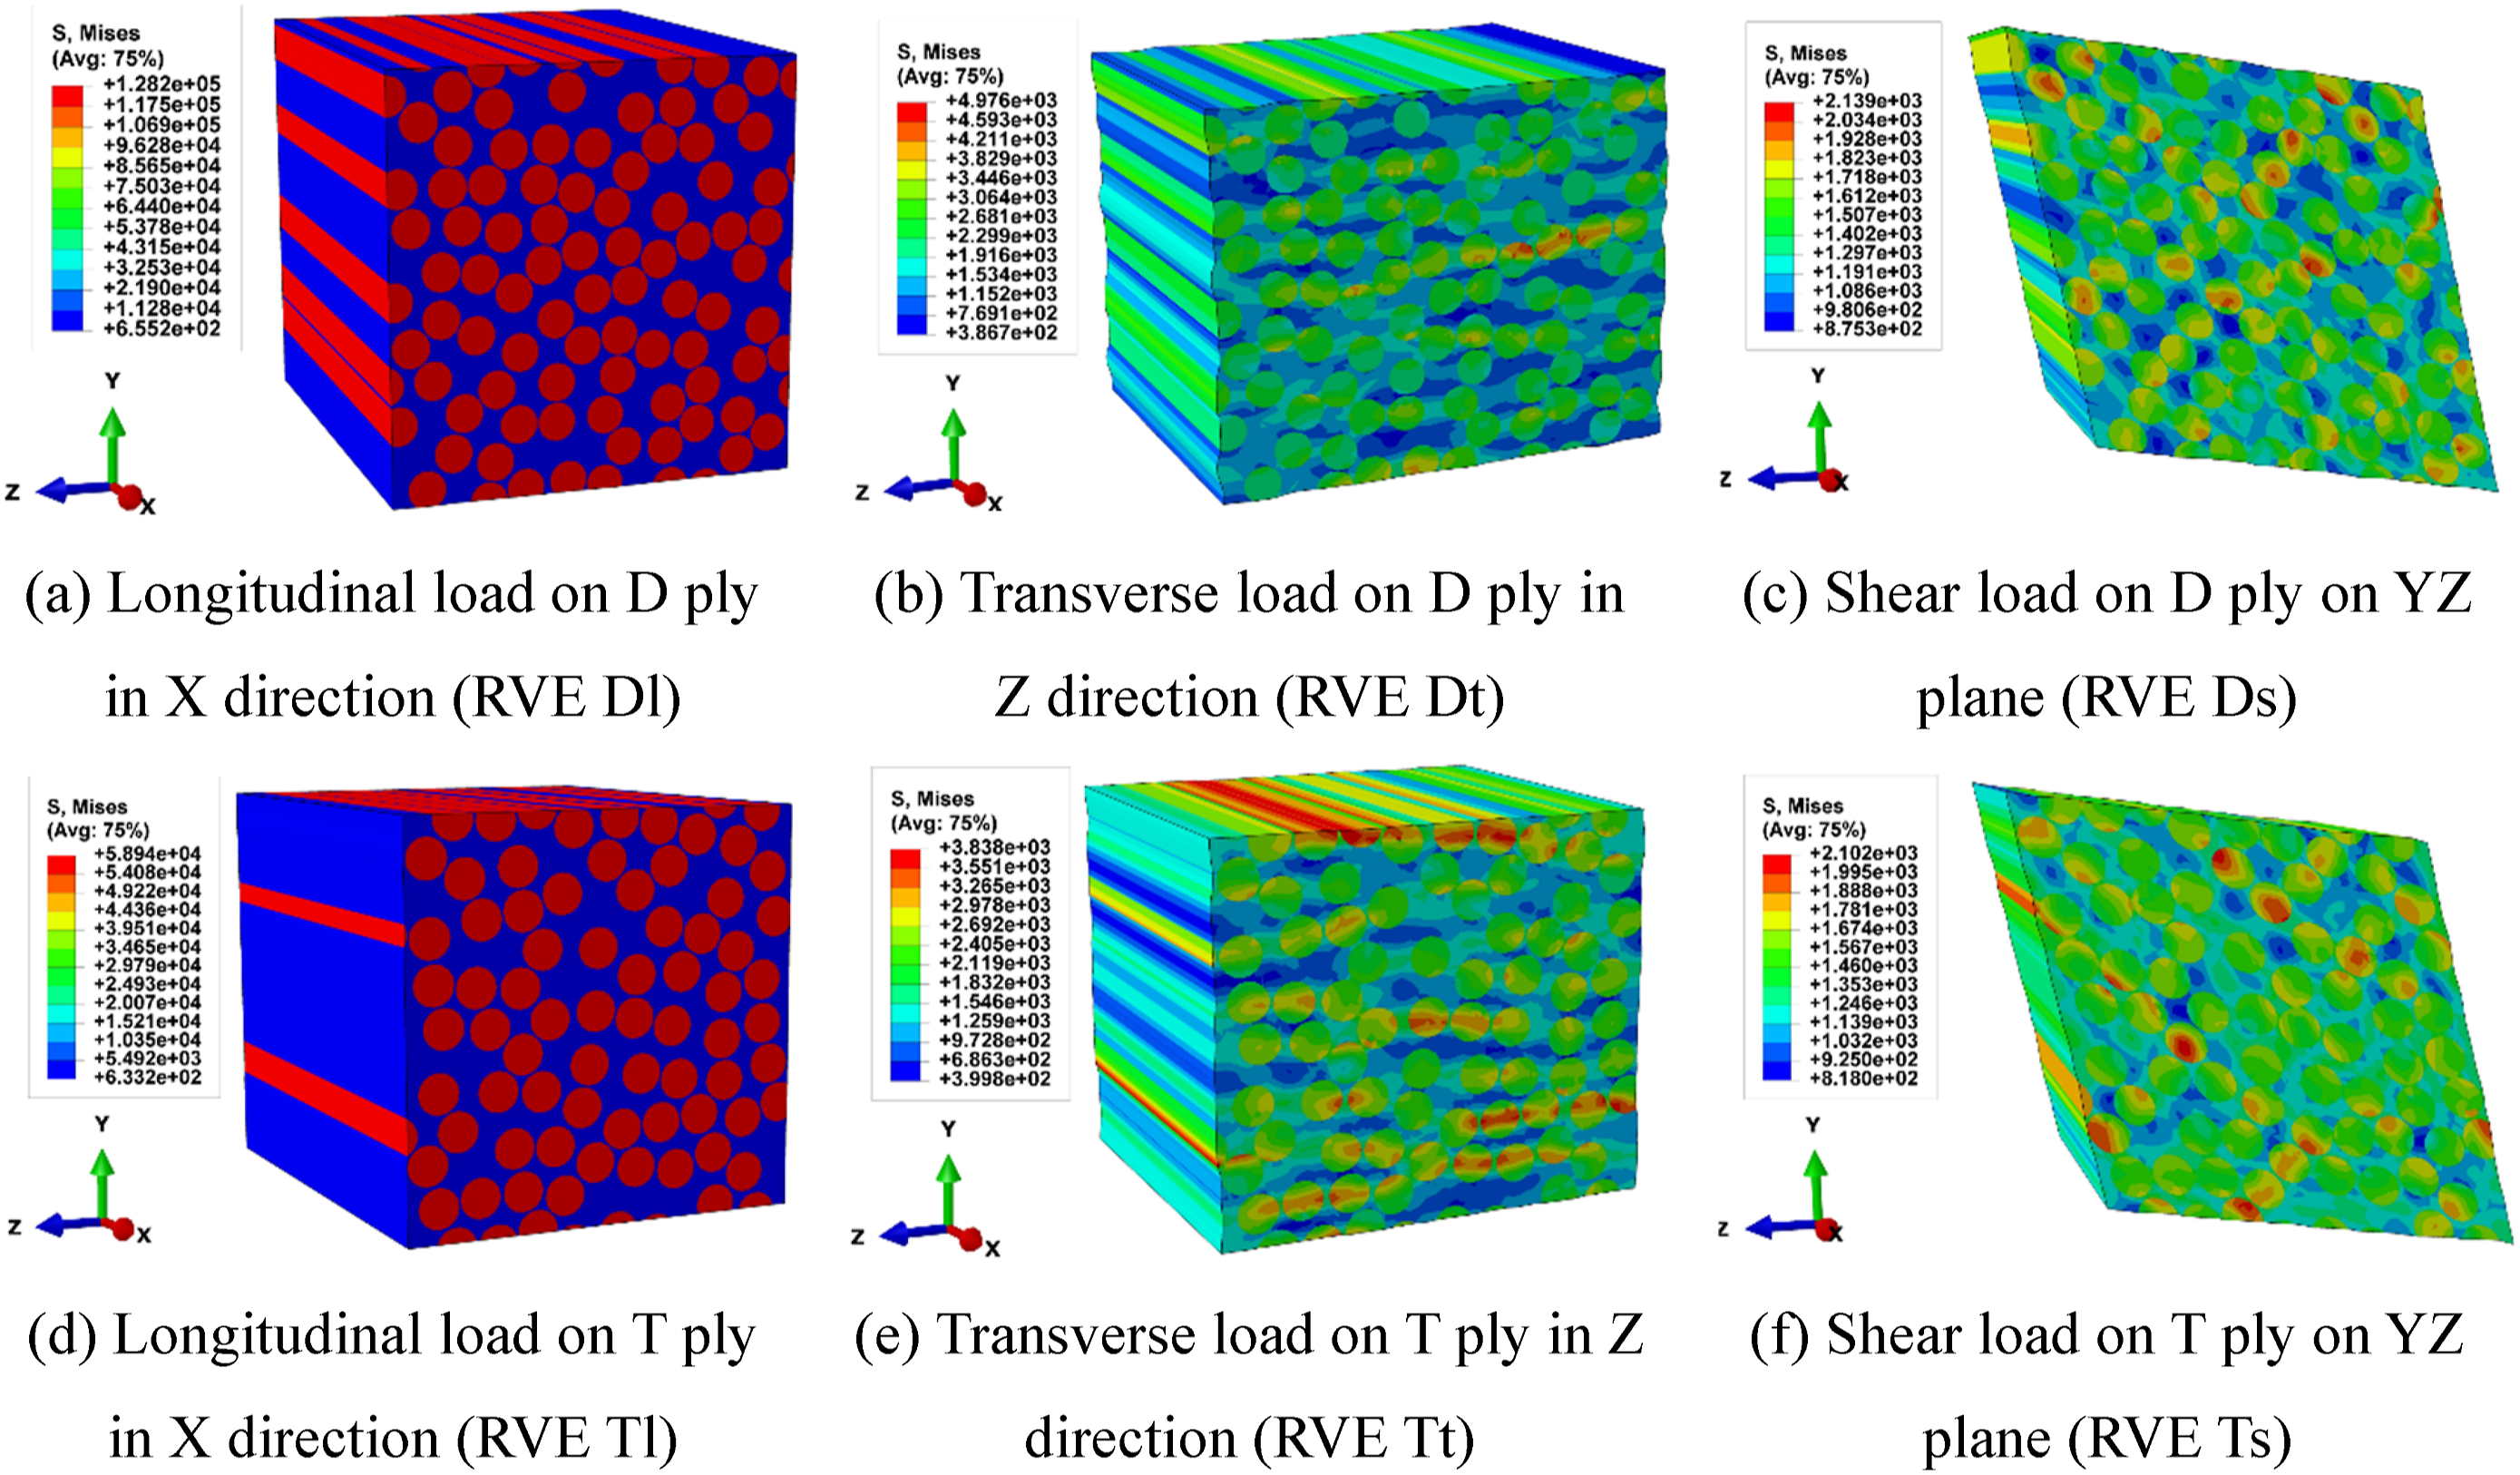
Outputs of the meso models.
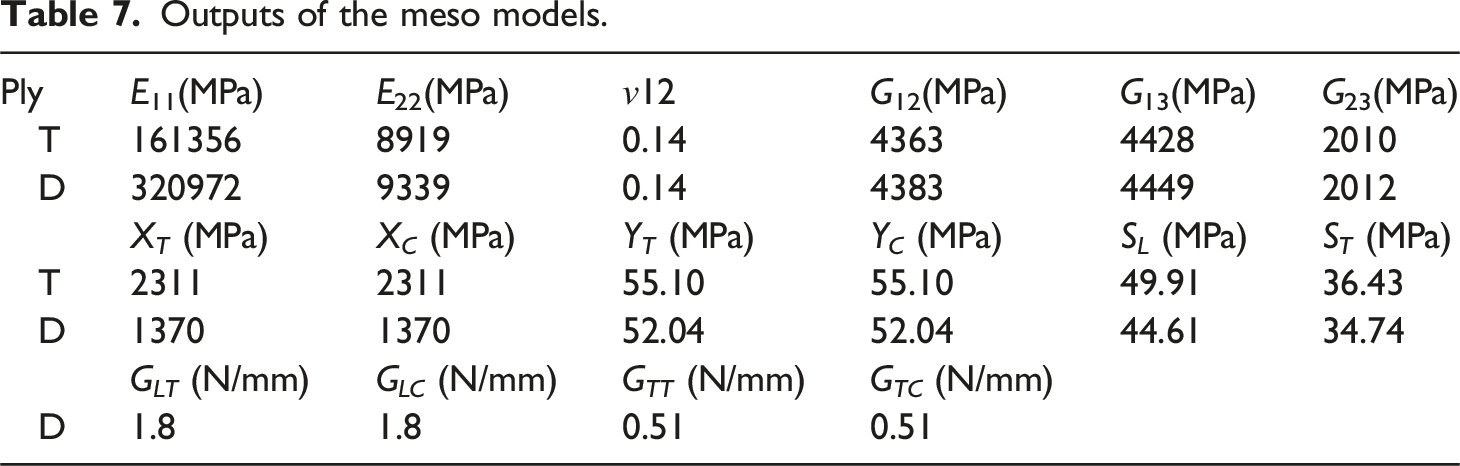
The ’D’ ply significantly contributes to the pseudo-ductile behavior of the composite. To model the damage evolution of the ’D’ ply, the fracture energy of this ply at different directions was utilized as input data for the macro model.
For the macro-scale model, a rectangular shell geometry measuring 150 mm × 15 mm was generated in ABAQUS FE software by considering the appropriate layer sequences (i.e. T3/D/T3). The Hashin damage criterion
18
was employed to simulate the damage of each ply. The Hashin damage initiation criterion considers four potential failure modes, each associated with a specific index: (i) fiber breakage in tension (
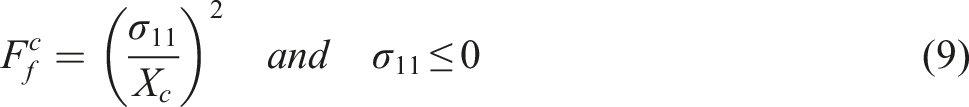


The tensile response of the macro-scale model is illustrated in the stress-strain curve in Figure 21. In Figure 21, the progressive damage of the D ply at different points is depicted on the stress-strain diagram. As previously mentioned, the gradual failure of the low-strain ply (D ply) is the key factor contributing to the pseudo-ductile behavior of the conventional thickness composites, a phenomenon clearly evident in Figure 21. In the initial segment of the curve, all fibers within the D ply remain undamaged (point 1). As strain values increase, fiber damage initiates (point 2). Further strain elevation leads to the sequential failure of additional fibers, gradually encompassing the entire model in the fiber damage contour (points 3 and 4). Following the complete failure of fibers in the D layer, the T plies start to carry the tensile load (point 5). Comparison of multi-scale FE results with experimental results.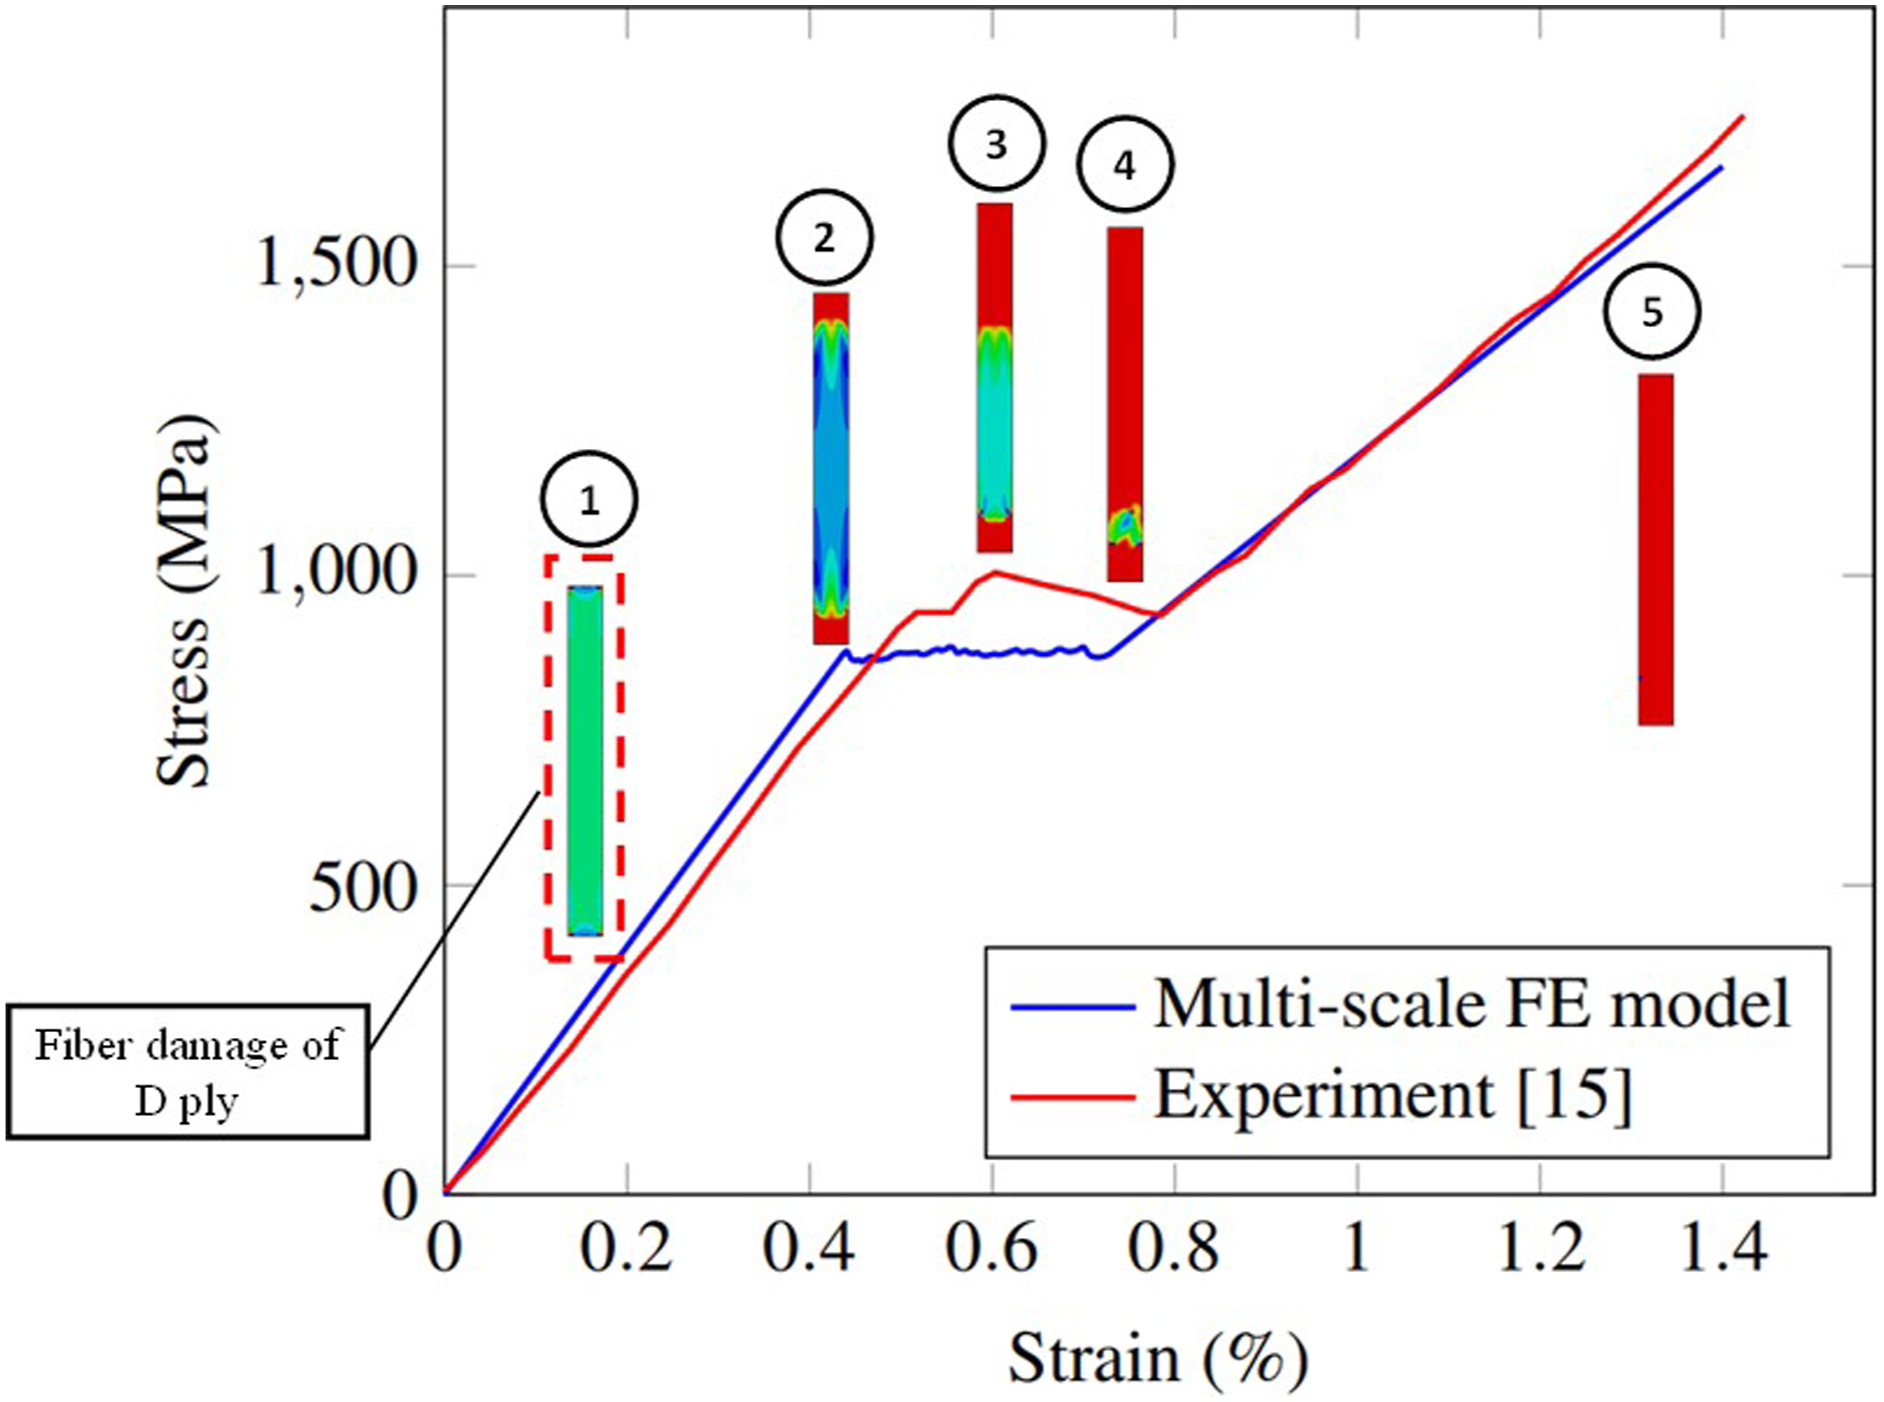
Furthermore, this phenomenon was depicted in the micro-scale model as well. For a comparative analysis of the gradual failure of the D ply in both the micro and macro-scale models, the damage progression of this ply under different strain values is shown in Figure 22. In this figure, HSNMTCRT and HSNFTCRT represent the damage values of the matrix and fiber, respectively. These parameters range between 0 and 1, where a value of 0 signifies no damage and one indicates complete damage in the component. Comparison of damage progression the micro-scale and macro-scale models generated with micro-mechanical model inputs under tensile load at different strain values for the ’D’ ply (low-strain ply) (a) ϵ = 0.2%, (b) ϵ = 0.44%, (c) ϵ = 0.5%, (d) ϵ = 0.7%, (e) ϵ = 0.77%, (f) ϵ = 1%.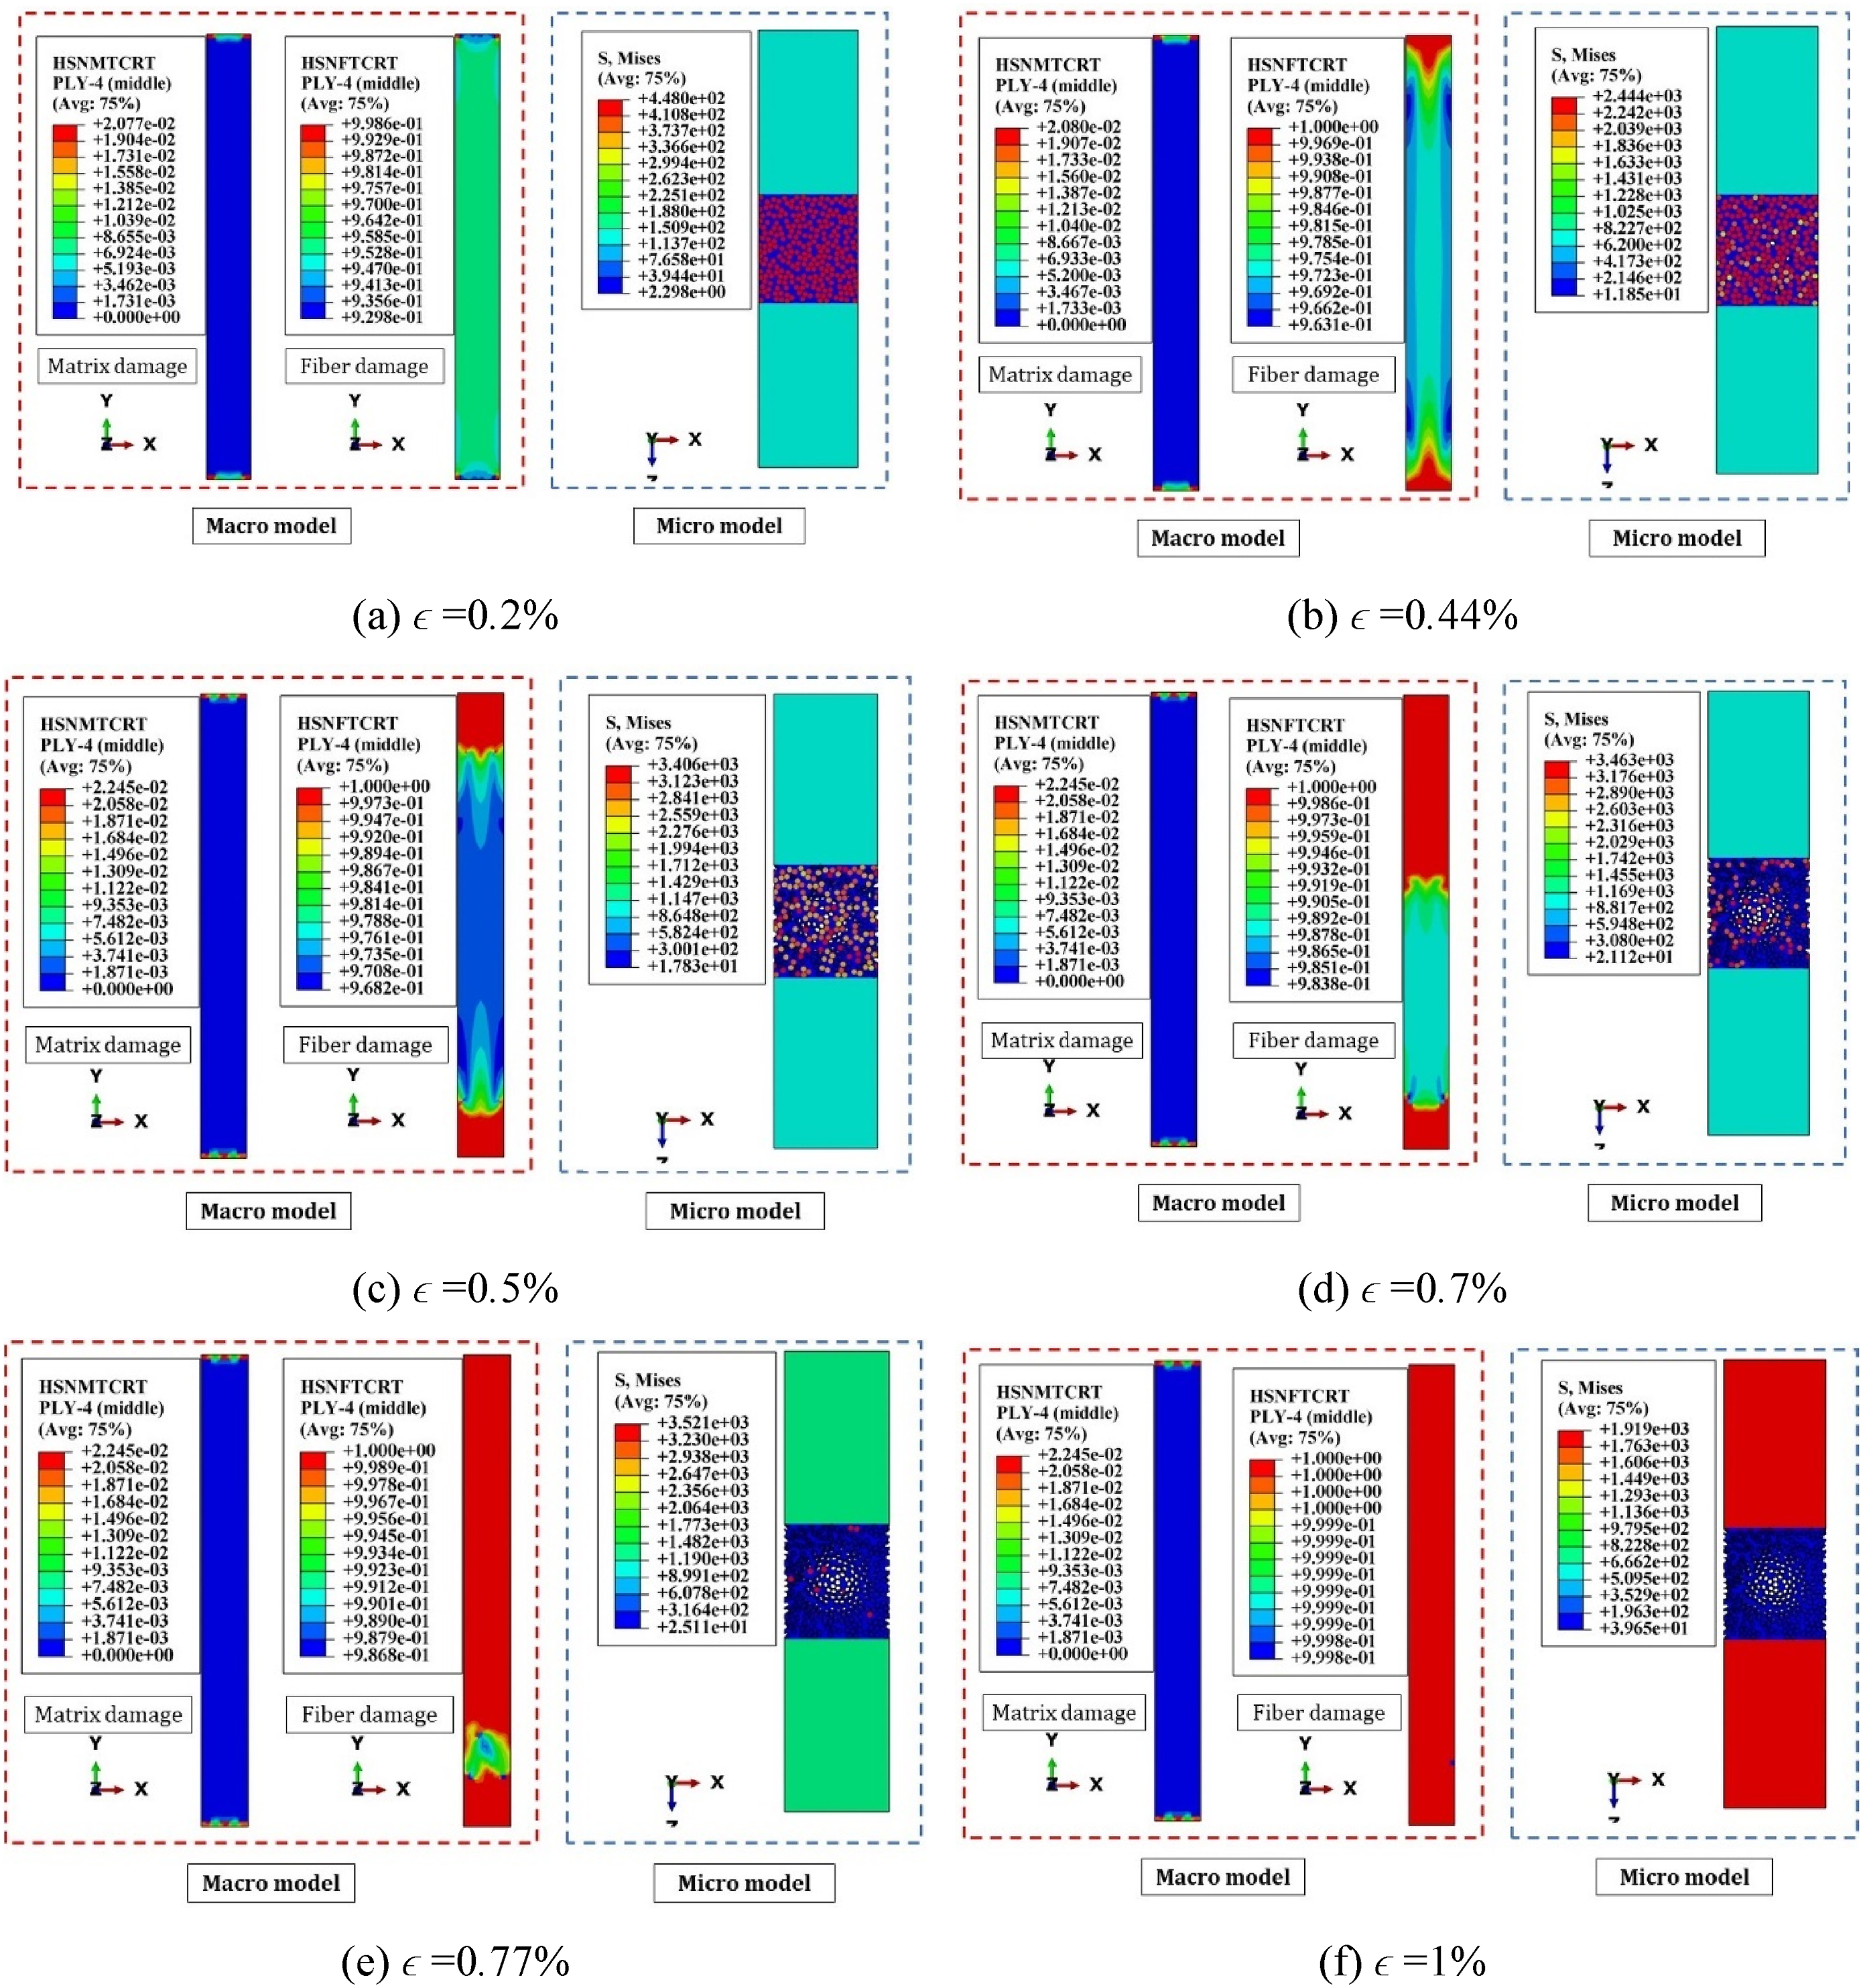
At low tensile strain values, both fibers and matrix experienced tensile stress with no damage occurring in the fibers (Figure 22(a)). As the tensile strain increases, gradual fiber failure begins in the ’D’ ply, resulting in a gradual decrease in the tensile stress values and the observation of a plateau in the tensile stress-strain diagram (Figure 22(b) to (d)). This gradual failure persists until all fibers in the ’D’ ply fail, while the matrix remains undamaged (Figure 22(e)). Upon complete fiber failure in this ply, stress transfers to other plies while the matrix in the ’D’ ply remains intact (Figure 22(f)).
Comparison of the stress-strain curves predicted from the micro-scale and the macro-scale model generated with micro-mechanical model inputs shows that the error values in the nonlinear segment are more pronounced in the macro model, as depicted in Figure 23. Since the micro-scale model accurately considers the components of each layer and also assumes different tensile strengths for each fiber through the Weibull distribution, it can accurately simulate the damage progression in each ply. In contrast, the macro-scale model relies on equations and fracture energy for calculating the damage of each component. Additionally, inherent errors in the FE method contribute to modeling inaccuracies, and these errors may be exacerbated when analyzing at two scales. This indicates a micro-level error during the calculation of elastic constants or damage parameters, which is then compounded with macro-level errors, resulting in a significant overall discrepancy. Using a macro-scale model developed by a sequential multi-scale approach is advantageous because it allows us to test the composite under different loading conditions, such as bending or impact, with lower computational costs compared to the micro-scale model. Comparison between macro-scale model generated with micro-mechanical model inputs and micro models results.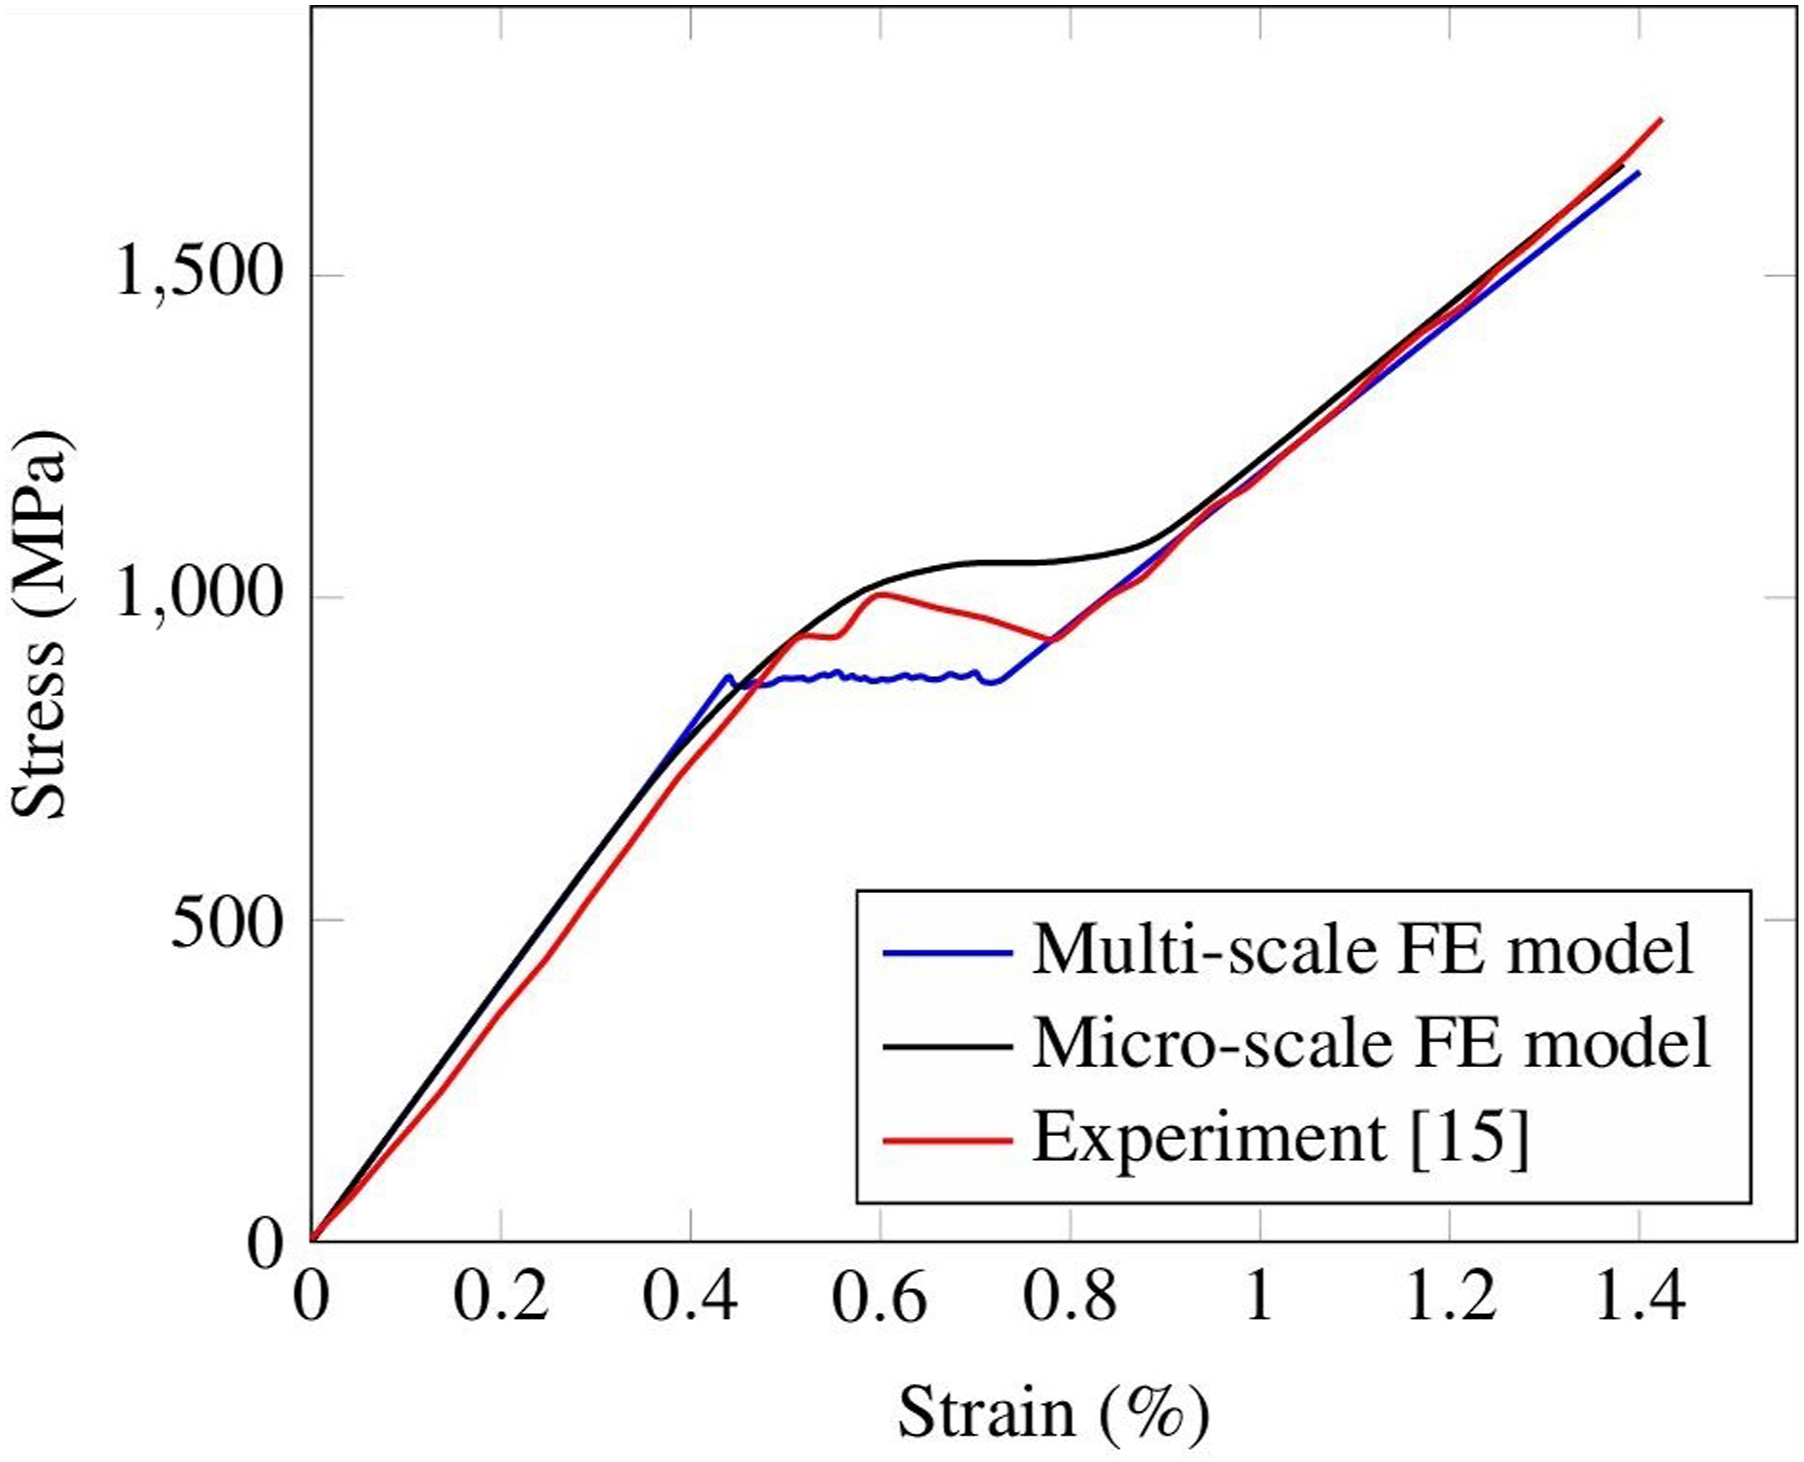
Conclusion
This paper presents a numerical multi-scale finite element model (micro and macroscales) for predicting the damage behavior of different types of pseudo-ductile composites, with a focus on those with conventional thickness. Different tensile strengths, based on the Weibull distribution function, were assigned to fibers in each ply. The proposed model was validated by comparing the numerical results with those obtained from recent experiments conducted on thin-ply and conventional thickness pseudo-ductile composites. The numerical results were also compared with those predicted by an analytical model
16
described in the Appendix. Different sensitivity analyses were performed and the effect of the volume fraction and also the tensile strength variation of the fibers in the low-strain ply (D-ply), as the most effective parameters, were investigated. Based on the outcomes of this research, the following conclusions can be drawn: • Pseudo-ductile behavior can be observed in composites with 30% and 40% fiber volume fractions of the middle ply, while composites with low fiber volume fractions (10% and 20%) showed linear behavior leading to failure. • Increasing the fiber volume fraction of the middle ply leads to a higher initial elastic modulus and pseudo-ductile behavior. • The comparison between numerical and analytical results shows a good agreement in predicting the tensile failure of the composite. For composites with low fiber volume fractions (10% and 20%), the division is increased after the middle ply fracture due to low fiber amounts. • The middle-ply fibers’ tensile strength variation plays a critical load in the tensile pseudo-ductile behavior of composites: The composites with a large scatter of the fibers’ tensile strength in the middle ply (low Weibull modulus in our model) do not exhibit a pseudo-ductile behavior. Reducing this scatter (increasing the Weibull modulus in our model) results in a nonlinear and load-sharing horizontal plateau in the tensile stress-strain diagram of the composite.
In the end, using a sequential multi-sale modeling approach the results of the micro-mechanical simulations were inputted to a macro-scale model to predict the pseudo-ductile behavior of the conventional thickness composite. Such a multi-scale FE model offers acceptable accuracy while minimizing the computational costs. This approach will be particularly of interest if dynamic loads such as impact are to be considered where the three-dimensional state of stress needs to be accurately modeled.
The outcome of this study provides valuable insights into the design and engineering of pseudo-ductile composites. The proposed model enables us to design an optimized composite structure tailored to the final application prior to fabrication, thereby significantly reducing production costs by minimizing the requirement for extensive experimental tests. Future work could explore the mechanical response of these composites under other loading scenarios such as impact and fatigue loads which are highly experienced by them in different engineering applications.
Footnotes
Declaration of conflicting interests
The author(s) declared no potential conflicts of interest with respect to the research, authorship, and/or publication of this article.
Funding
The author(s) received no financial support for the research, authorship, and/or publication of this article.