
Abstract
This study presents experimental results of compression after impact (CAI) strength testing of foam core sandwich structure with carbon/epoxy face sheets impacted at three different energies with either a blunt or sharp tip impactor. The impact energies used were chosen to span the barely visible impact damage (BVID) thresholds for the sharp (4.1 J) and blunt (12.9 J) impactors with an impact energy approximately halfway between these (8.1 J) also used. While most impact testing on composites utilize a hemispherical (blunt) impactor, actual damage to a part may be due to an object impacting the part that is not blunt, but sharp and the impact response and resulting CAI strength values may be different for a given impact energy level. In this study, with regards to the impact response, the sandwich specimens showed larger transverse displacements (by about a factor of two) during the impact event when impacted by a sharp impactor versus a blunt impactor. The maximum load of impact was larger for the blunt impactor by about a factor of three. The barely visible impact damage (BVID) threshold energy was lower by about a factor of three for the sharp impactor. The absorbed energy of impact was higher for the sharp impactor. The CAI strength results showed that the sharp impactor gave lower average CAI strength values at the lowest impact energy level used, slightly lower average CAI strength values for the medium impact energy used and about the same average CAI strength values for the highest impact energy used.
Introduction
For damage tolerance testing of polymer matrix composites, impact damage is typically inflicted using a rounded tip impactor to represent a generic impact event. The ASTM standard for Compression After Impact (CAI) testing
1
calls for a blunt, hemispherical striker tip, although it does state that the use of a sharp striker tip may be appropriate in certain circumstances. An example of a tool drop that can demonstrate different impact responses is shown in Figure 1. If a screwdriver were to impact a composite surface, then the impact may have a different response whether the screwdriver falls blade first or handle first. Example of a tool drop in which the tool produces a “sharp” impact (left) or a “blunt” impact (right).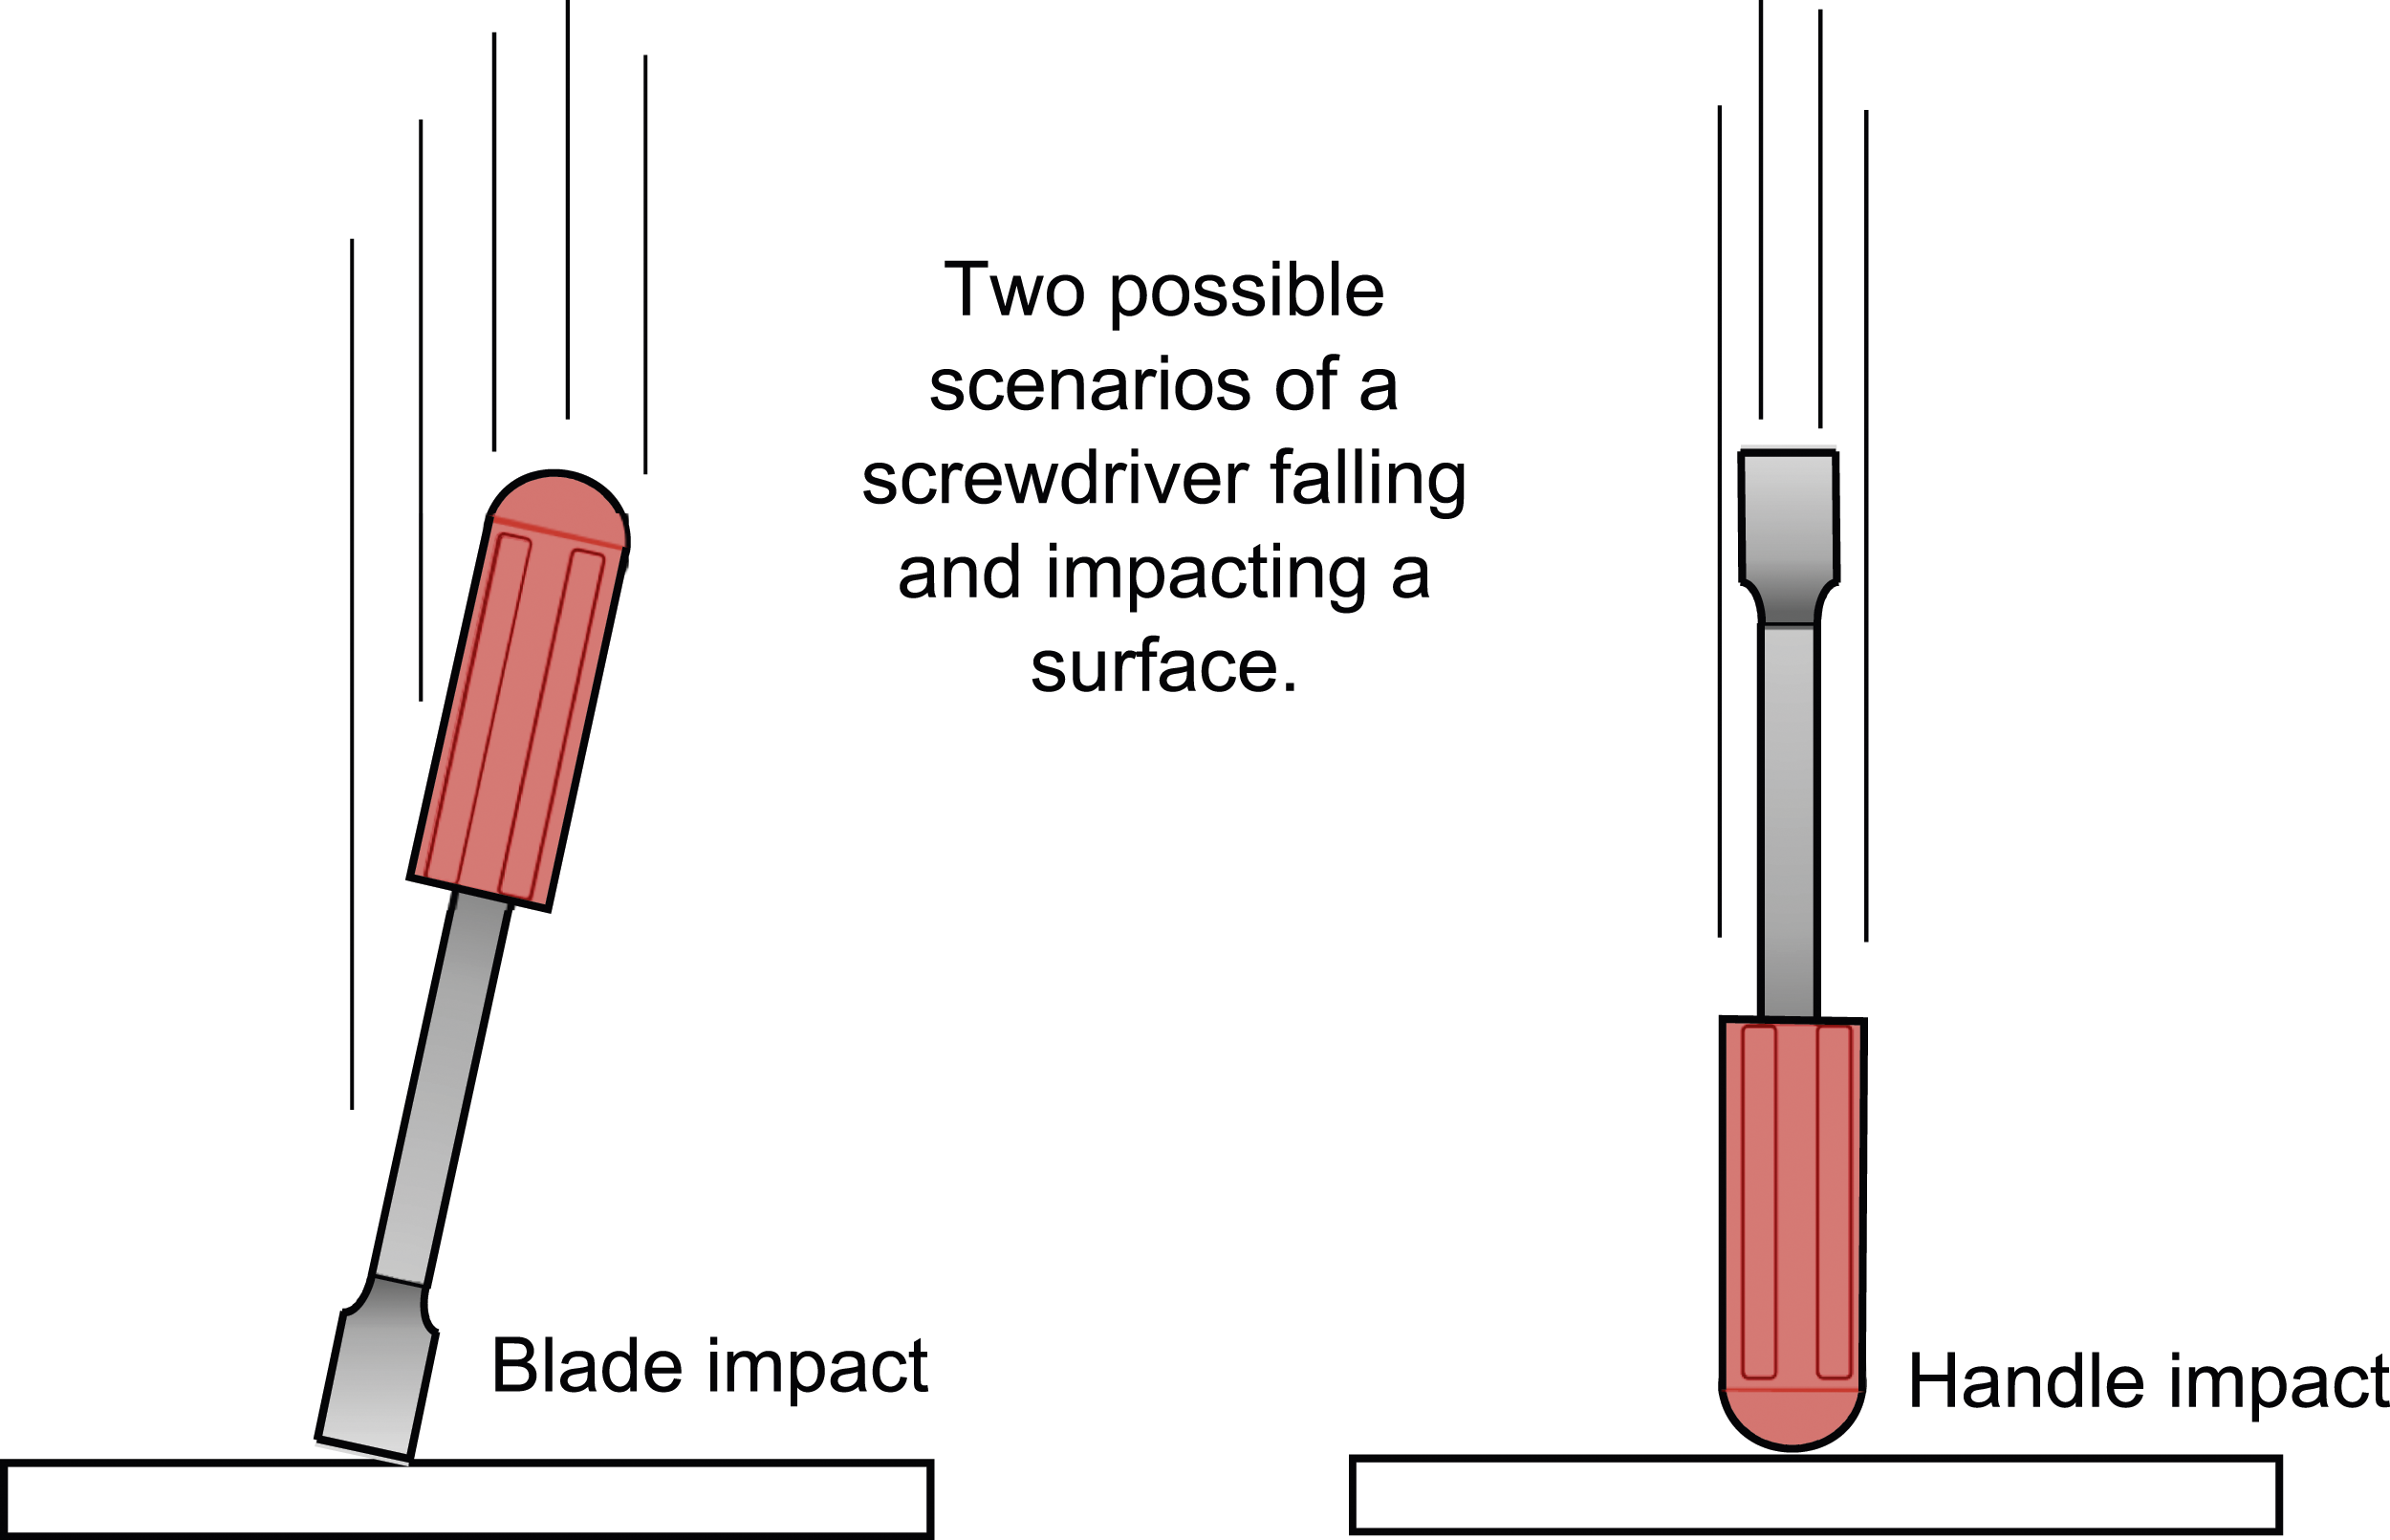
Past studies where sharp tip impactors were used involved damage tolerance of rocket motor cases.2–4 For rocket motor cases, the laminate was shown to be so thick that there was little difference in the impact response of sharp versus blunt impactors. The thick laminate enabled the first few layers to crush at the tip of the sharp impactors and the debris of these first few plies acted as a “blunting mechanism” ahead of the sharp tip.
For thinner laminates some results in the open literature were found comparing the impact response of different shape impactors.5–10 None of these references provided any post impact compression strength results, just damage resistance information. These studies also did not utilize sandwich structure. Of commonality in all these studies was that at a given impact energy a sharper impactor produced a lower load of impact and larger deflection than a blunt impactor as determined by instrumented impact data. In general, the damage size was smaller for the sharper impactor. One aspect to bear in mind is that these thinner laminates did demonstrate a large amount of global deflection due to flexure of the specimen during the impact event since the specimens in these studies were supported over a large opening and these large global deflections will not occur on sandwich structure.
Material
One of the design concepts for manufacturing a Payload Adaptor Fitting (PAF) at NASA’s Marshall Space Flight Center (MSFC) consisted of foam core sandwich structure. The specimens used in this study were representative of the acreage of the PAF structure.
The face sheets of the sandwich specimens tested in this study consisted of Hexcel® HexTow® IM7 carbon fiber with Hexcel® 8552-1 epoxy resin and were co-cured to the core which consisted of Rohacell® Hero 71 Polymethacrylimide (PMI) foam core with a density of 75 kg/m3 and a thickness of 12.7 mm. All the face sheets were manufactured by automated fiber placement (AFP) at NASA’s MSFC. The layup for the face sheets was 8-ply [+45/0/-45/90]S quasi-isotropic. The sandwich specimens had an outer ply of woven 8-harness weave IM7/8552 carbon/epoxy placed at ±45⁰ to the specimen loading direction. This woven cloth was placed on both sides of the specimen and was included in some of the design configurations of the PAF being designed and manufactured at MSFC in the hopes of aiding in impact damage resistance and fiber breakout upon any drilling operations. The sandwich structure had a layer of FM® 300-2M epoxy film adhesive placed over the core prior to the automated tape laying process used to manufacture the face sheets.
The sandwich structure was cured in an autoclave with a pressure of 276 kPa and a temperature of 175°C. The flat sandwich panel made for this study was 92 cm × 92 cm in size. The sandwich structure showed good consolidation as noted in the cross-sectional photomicrographs shown in Figure 2. Using photomicroscopy and measuring tools contained within the software attached to the microscope, the nominal face sheet thickness of the sandwich structure was measured at 1.83 mm. Cross sectional photomicrographs of a face sheet showing good consolidation. Specimen cuts are in width direction (left) and loading direction (right).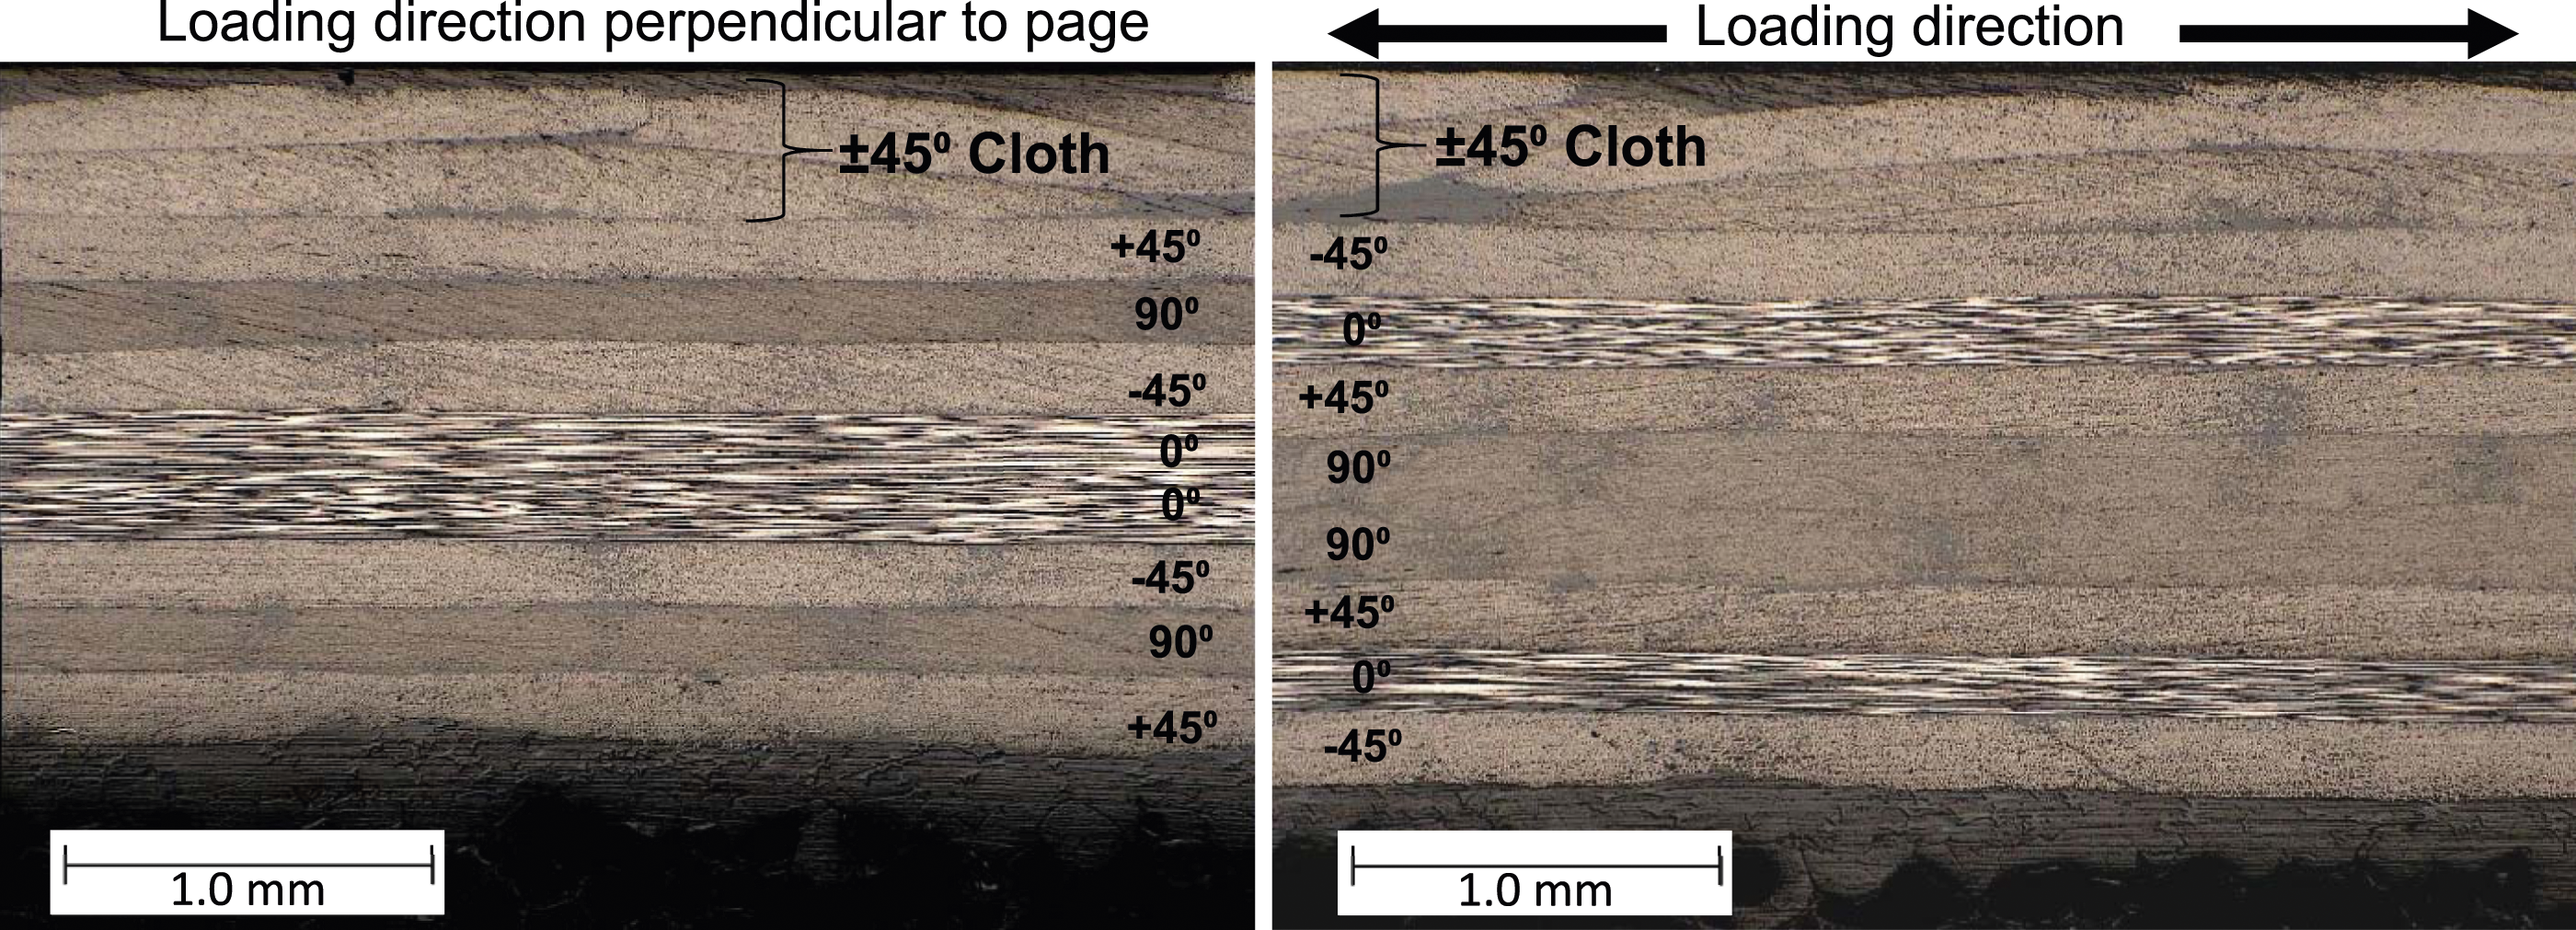
The sandwich structure was cut into 15.2 cm tall (direction of loading) by 10.2 cm wide specimens using a diamond saw. The top and bottom edges of these specimens were then machined to ±0.0025 mm tolerance of parallelism using a vertical end mill with a solid carbide cutting tool (Onsrud 67-526 designed for carbon fiber machining). The side edges of the specimens were machined to be perpendicular to the top and bottom edges.
Undamaged strength testing of the foam core sandwich structure was not pursued in this study since the undamaged specimens exhibited end-brooming, which is not a valid failure mode. This study concerns damage tolerance testing and the differences between blunt and sharp impactors and the undamaged strength values are not relevant to the scope of this study.
Impact damage testing
An instrumented drop weight impact apparatus was used in this study and is shown in Figure 3. The mass and height of the impactor could be varied to get a variety of impact energies. A pneumatic rebound brake prevented multiple impacts on the specimen. Each specimen was clamped between two steel plates during impact. The top steel plate had an opening to allow the impactor to pass through and hit the specimen. Photograph of impact tester used in this study.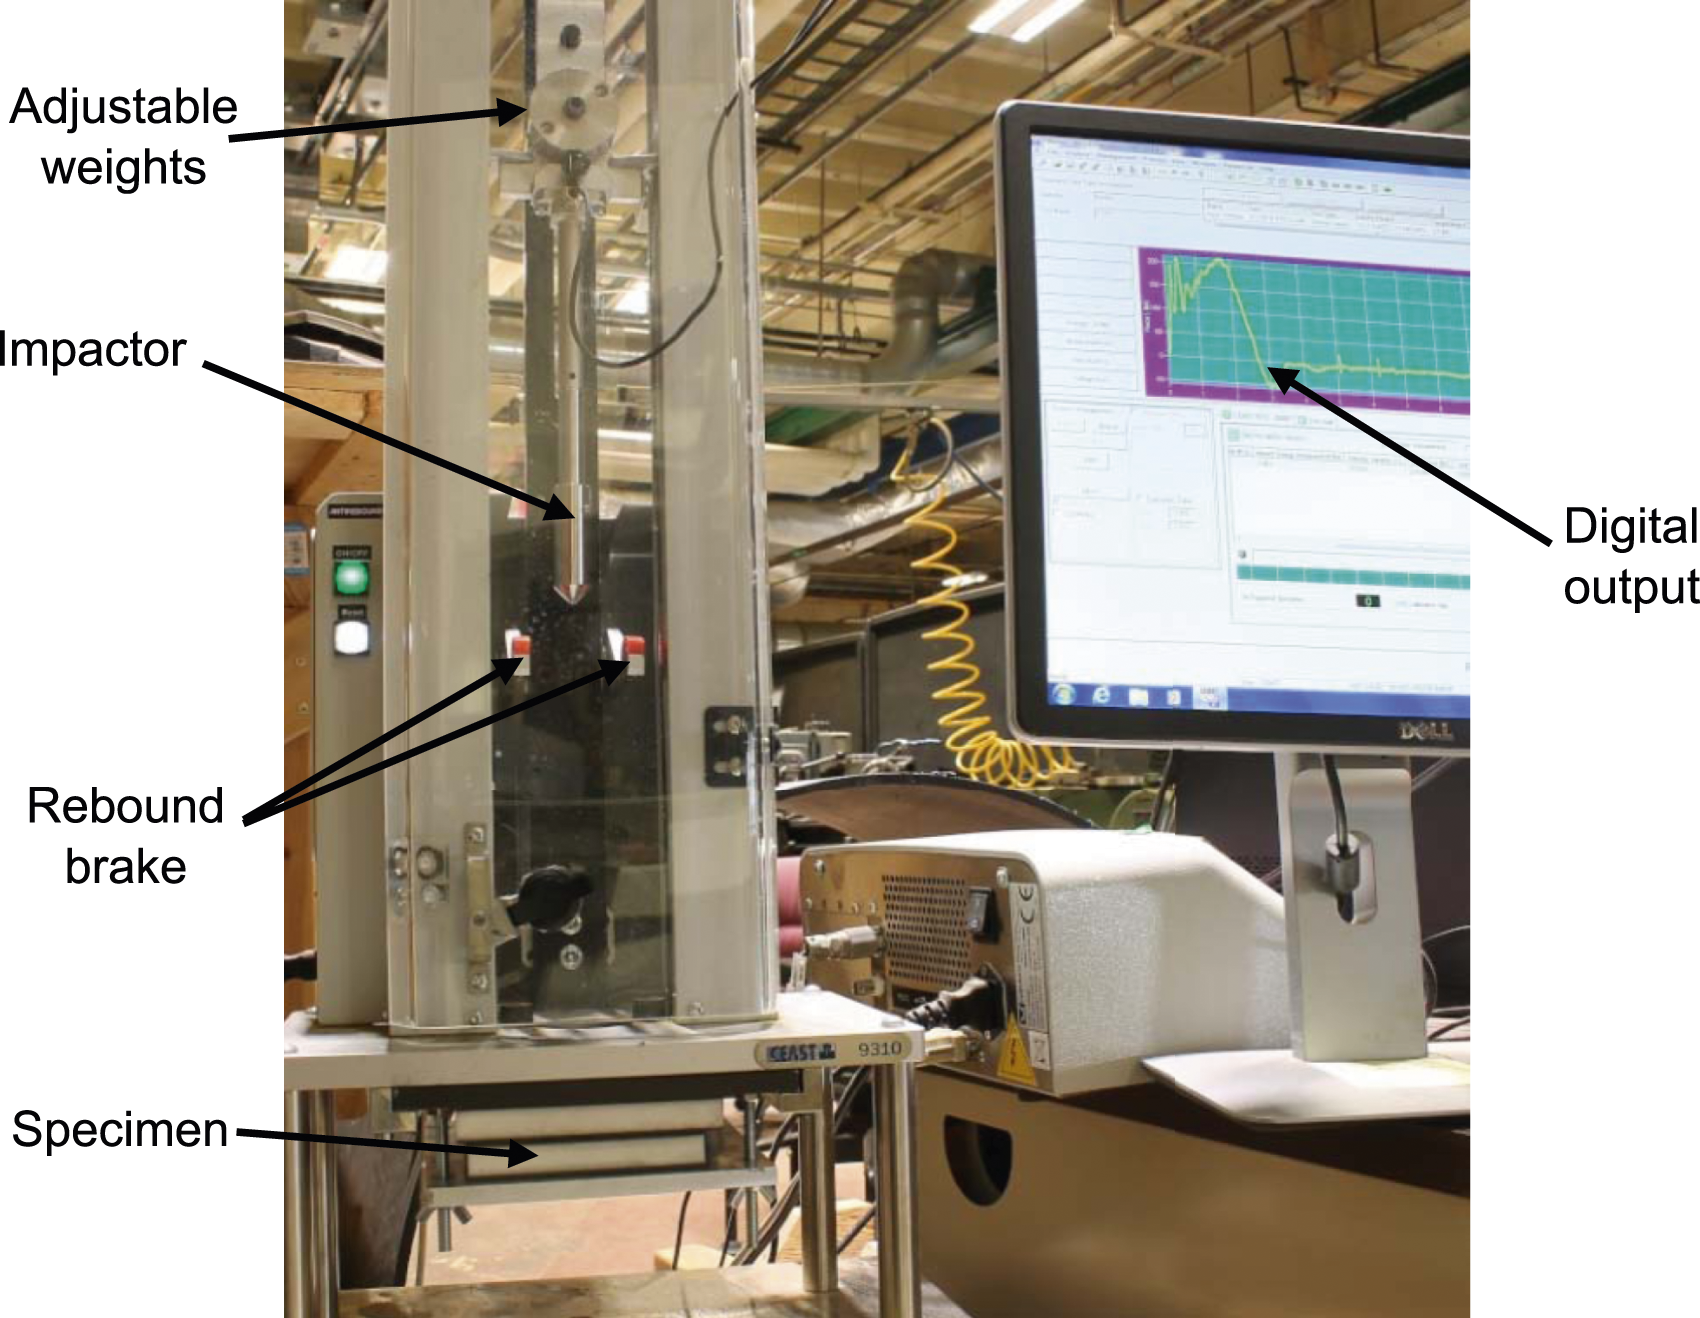
Two impactor shapes were used in this study. A hemispherical impactor of diameter 12.7 mm was used as this is the most common size and shape used by the authors. To represent a “sharp’ impact, a conical impactor of 19.0 mm diameter was used. The cone was beveled at a 45⁰ angle. Photographs of the two types of impactors are shown in Figure 4. Photograph of two types of impactors used in this study.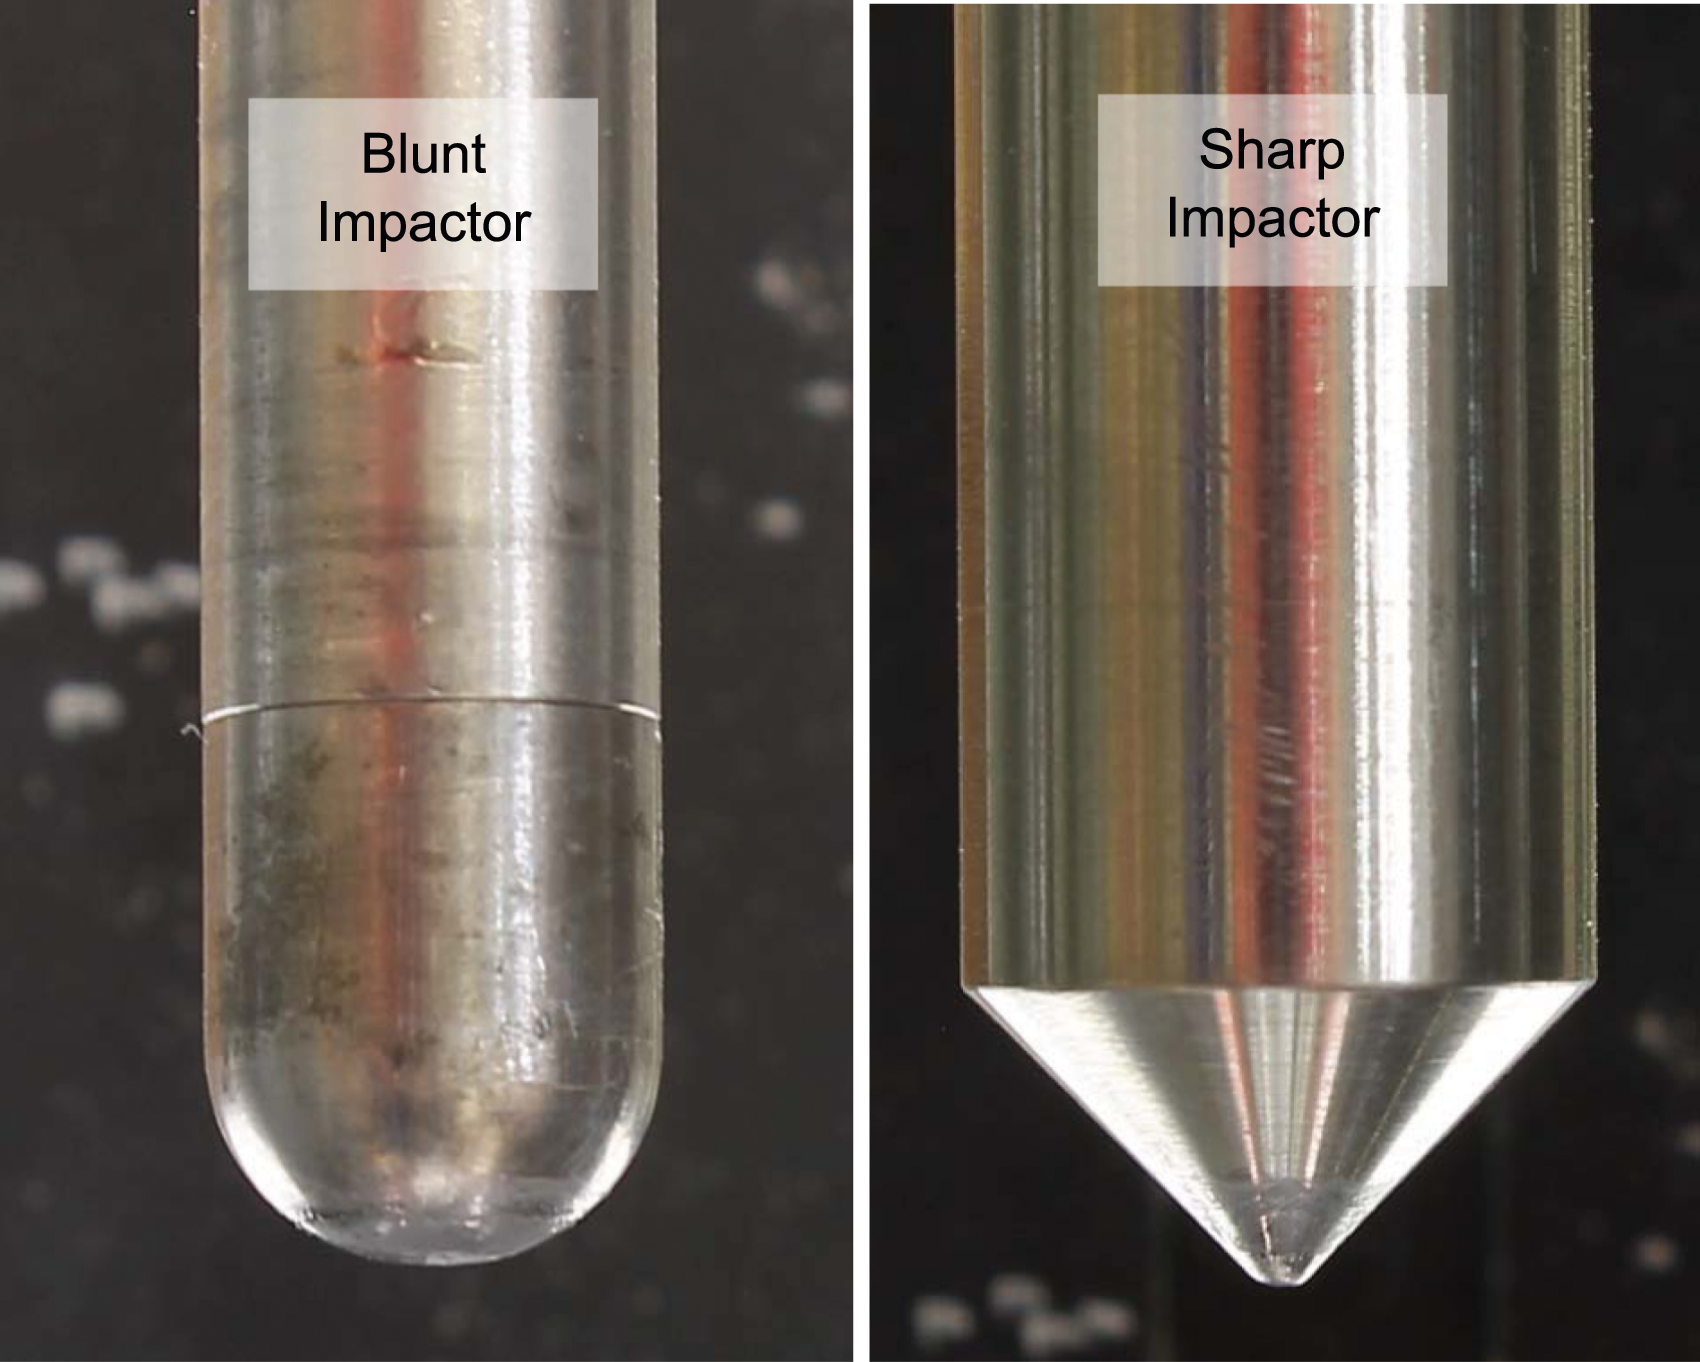
For each of the two types of impactors used in this study, a barely visible impact damage (BVID) threshold needed to be established since BVID may be a major design criterion. Multiple trials on representative sandwich structure were conducted with each of the two types of impactors and BVID thresholds of 12.9 J for the blunt impactor and 4.1 J for the sharp impactor were determined.
It was decided to test the specimens with both types of impactors with these two impact energies “bracketing” the high and low impact energies and using one intermediate impact energy (8.1 J). Thus, the foam core sandwich specimens were to be impacted at 4.1, 8.1 and 12.9 J with each of the two types of impactors for a total of six impact conditions. Multiple specimens were tested at each of the six impact conditions.
Visual damage
Examples of the visual damage caused by each of the six impact conditions are shown in the photographs in Figure 5. Examples of visual damage inflicted upon the specimens at each of the six impact conditions tested. Loading direction is from top to bottom in these pictures.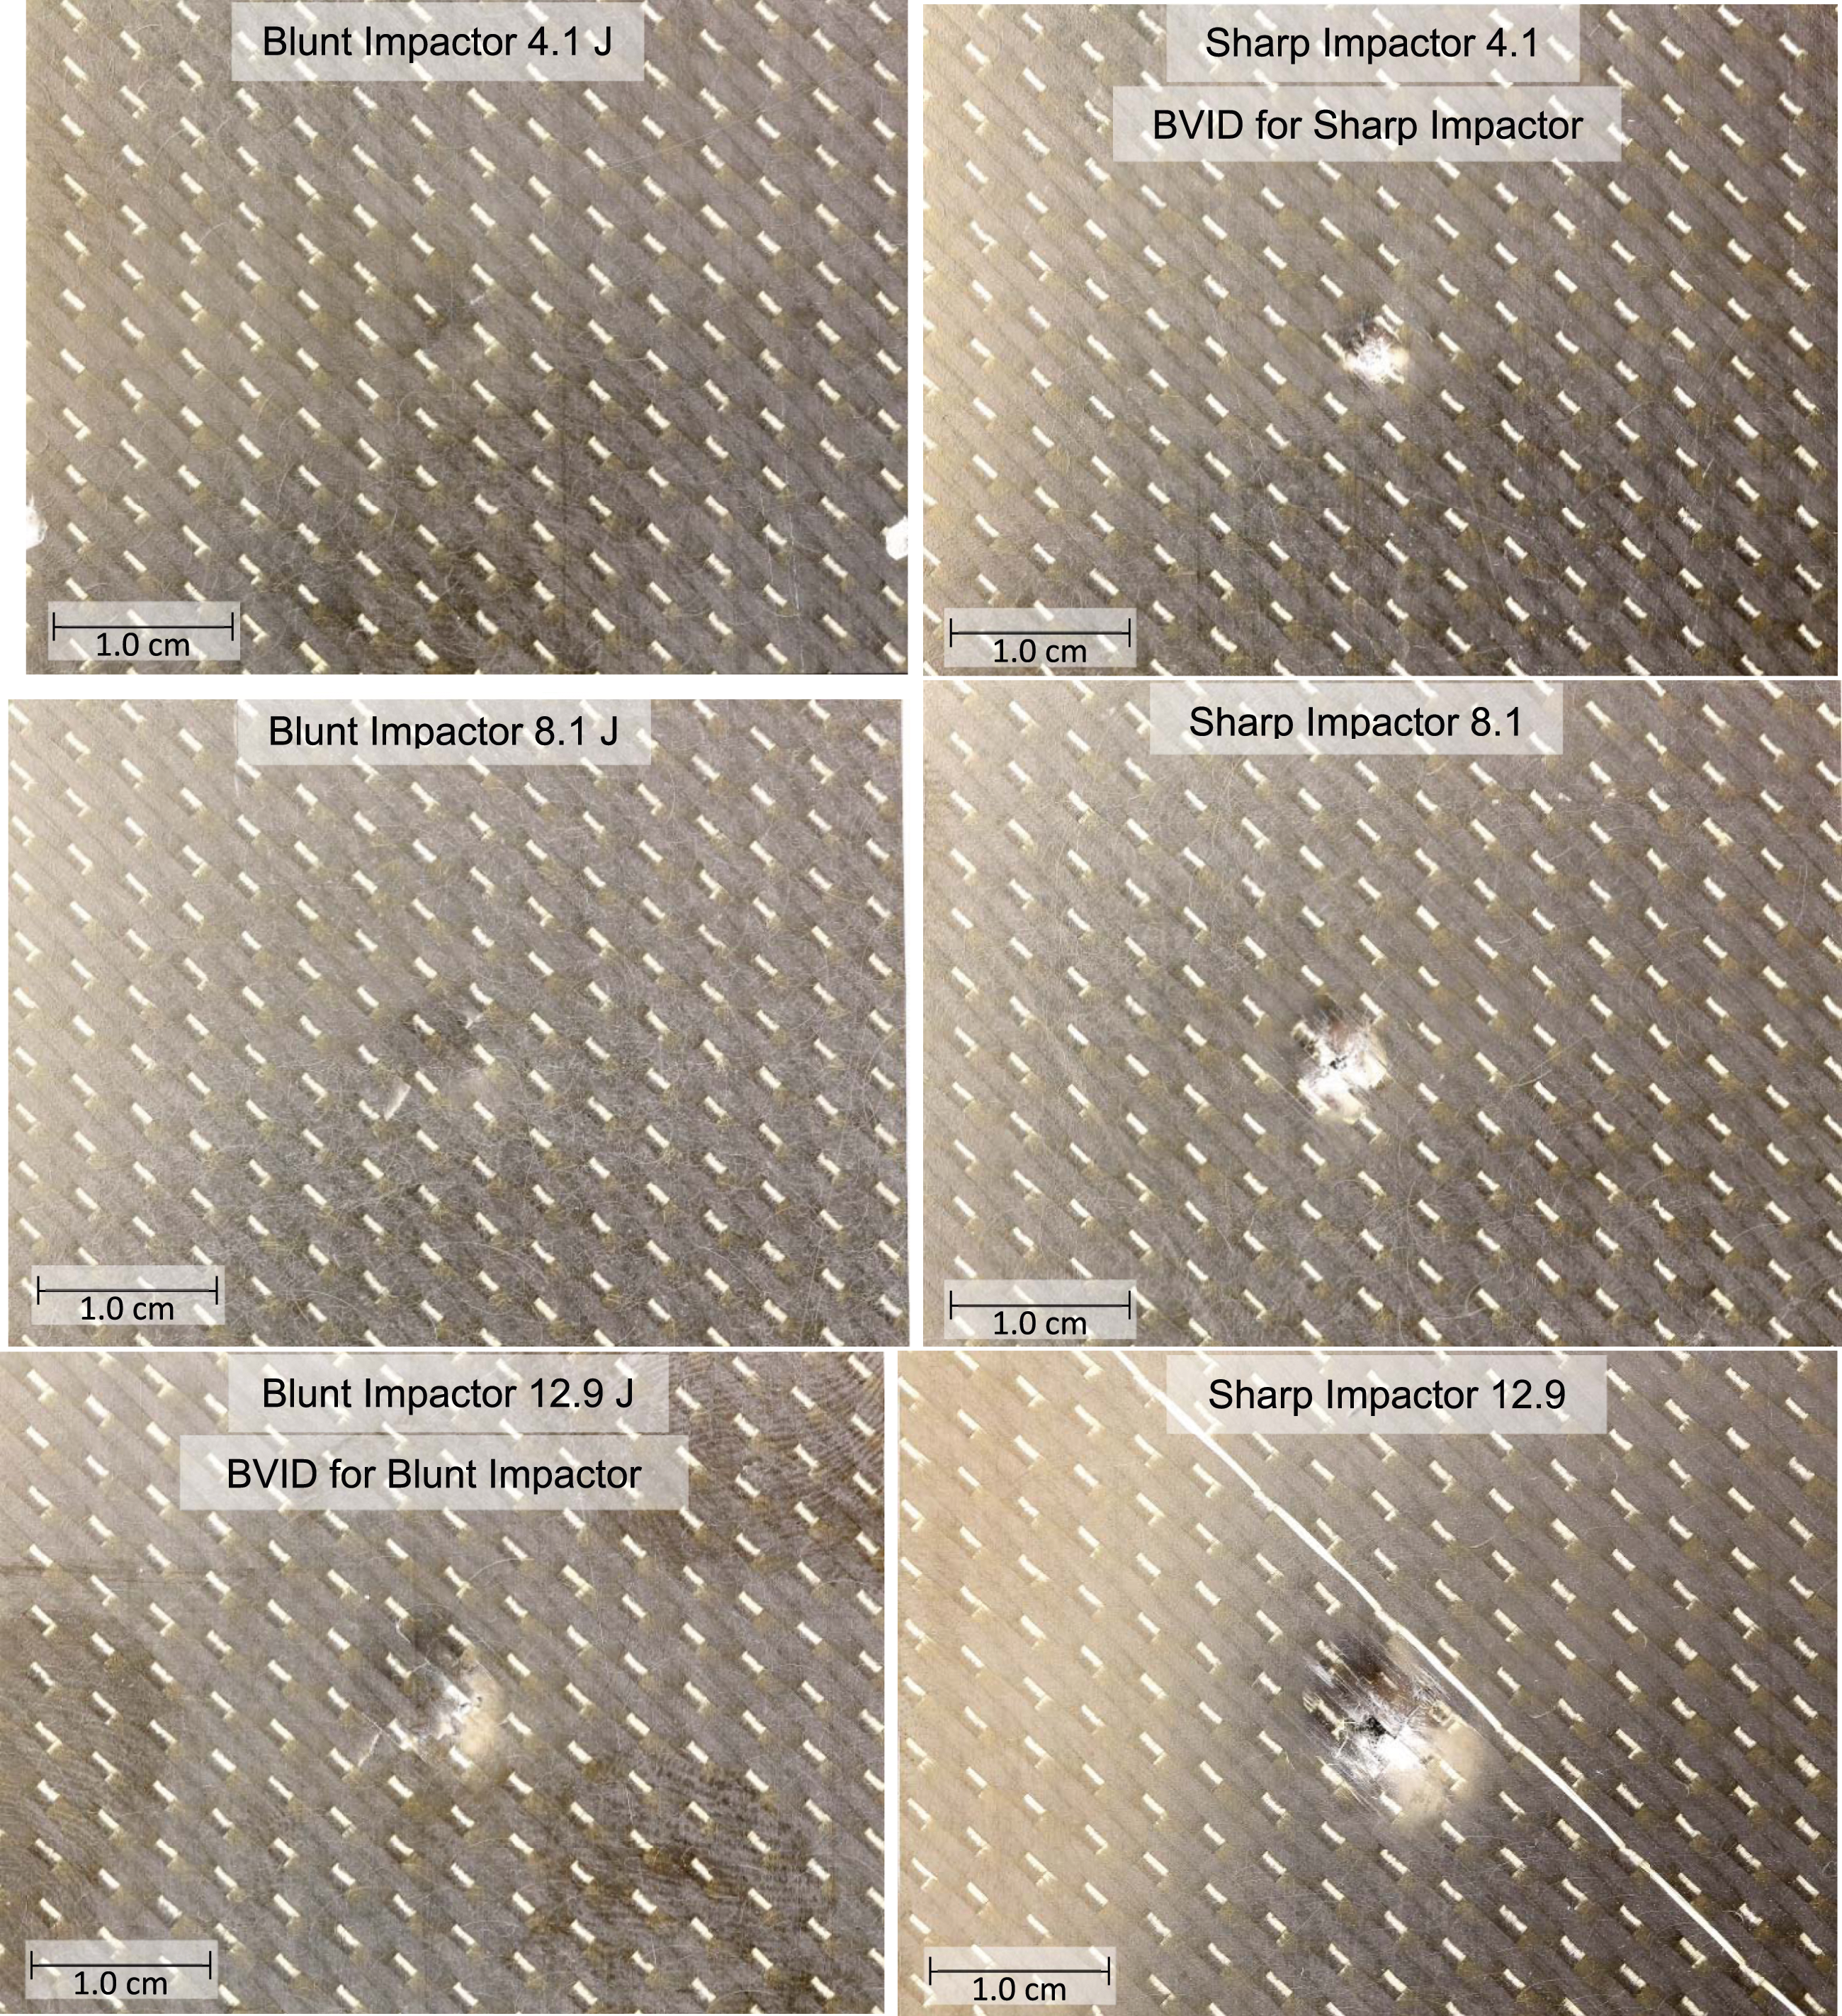
It should be noted that “BVID” is subjective and depends on many variables in the field. Such things as amount of light, angle of light, surface finish and color are some of the variables that can contribute to the threshold impact energy for BVID. In Figure 5, plain ambient (room) lighting was used but the photos were taken quite close to the damage site and some sections of hardware may not avail itself to such close visual inspection.
For this study, the main takeaway from the visual impact results is that the damage from the sharp impactor is easier to see and will result in a lower impact energy for the BVID threshold than the blunt impactor. This is not an unexpected result.
Instrumented impact data
Typical load-deflection traces of each of the six impact conditions are shown in Figure 6. The sharp impactor results are in blue and the blunt impactor results are in black. The notation “E” in each curve is the absorbed energy of impact (area under the curve). Instrumented impact examples of load-deflection plots of the specimens at each of the six impact conditions tested.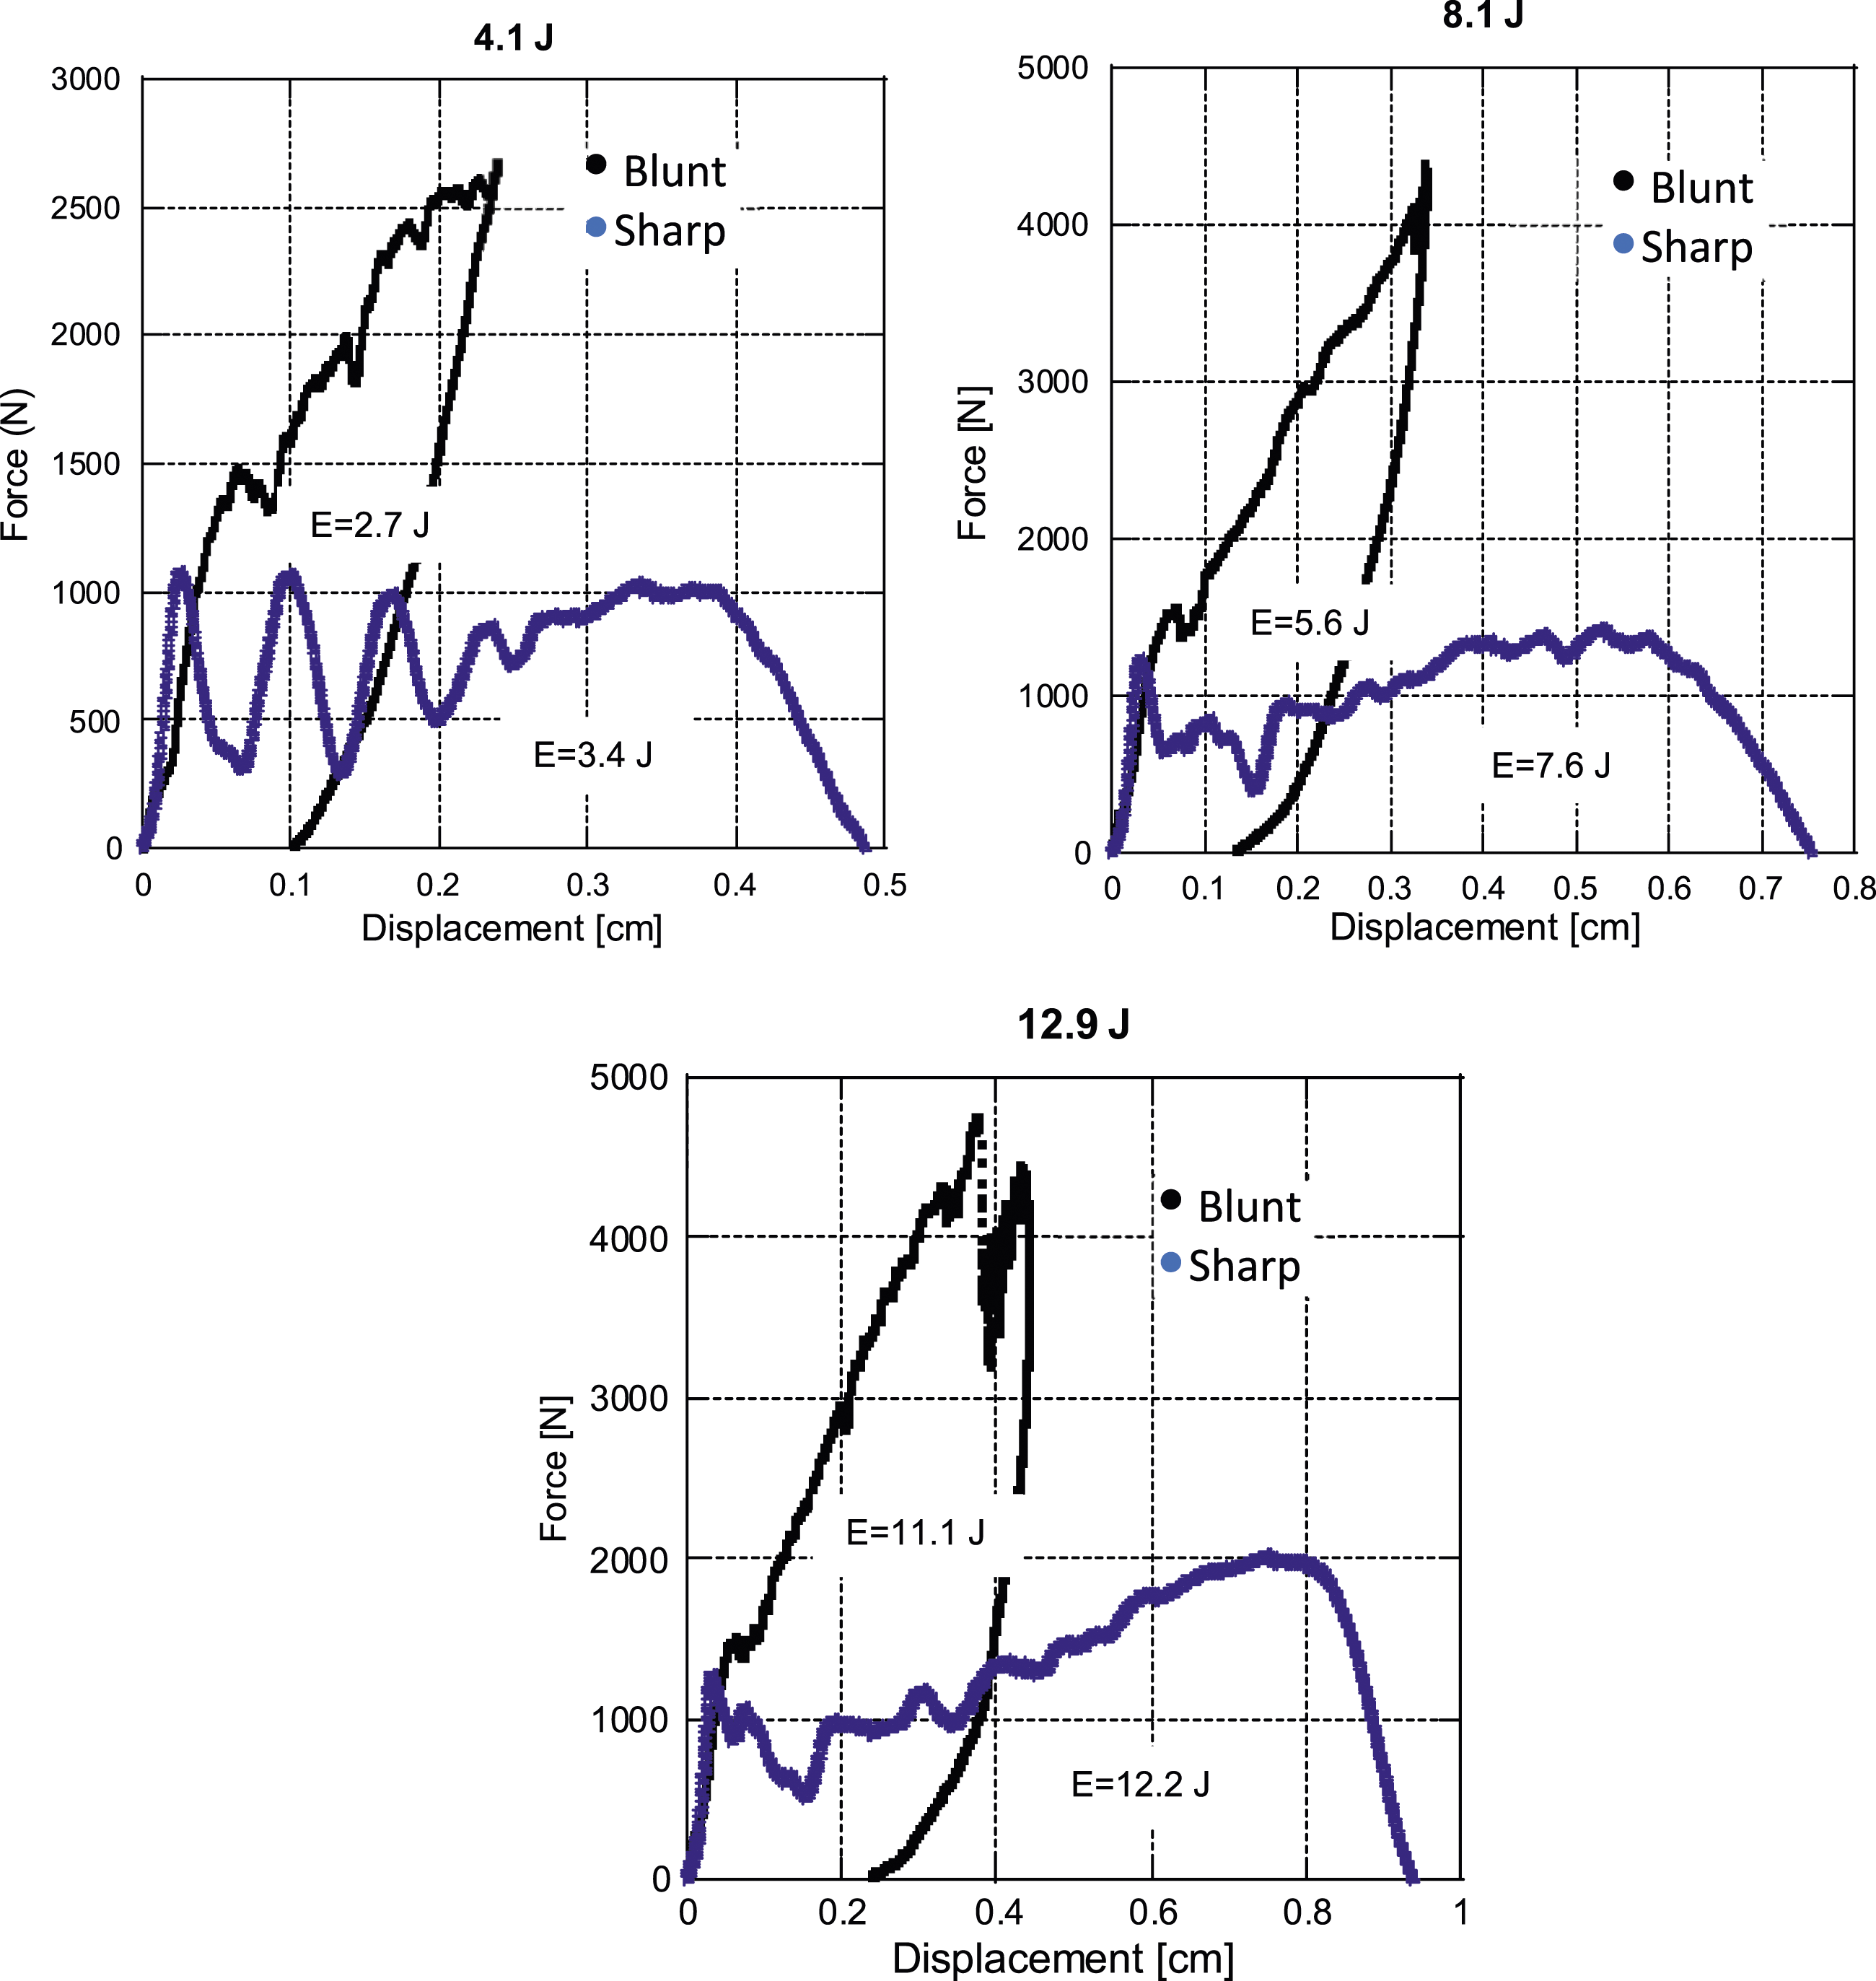
The sharp impactor produced a notably lower maximum load of impact and notably higher deflection as was seen in references.5–10 The amount of impact energy absorbed by the specimen (the area under the load-deflection curve) was higher at any given impact energy level for the sharp impactor and resulted in there being little rebound of the impactor due to the sharp tip causing so much fiber breakage which absorbs a considerable amount of the impact energy.
Thermography results
Non-destructive evaluation (NDE) in the form of thermography was performed on the impacted specimens and sample signatures from each of the six impact conditions are presented in Figure 7. The shape of the damage zone is circular for all three energy levels using the sharp impactor. The blunt tip impactor had a circular shape damage zone at the lowest energy level, but peanut shaped indications at the two highest impact energies. Examples of thermography images of the specimens at each of the six impact conditions tested. Loading direction is from top to bottom in these pictures. Indication of cut for photomicroscopy shown on the images.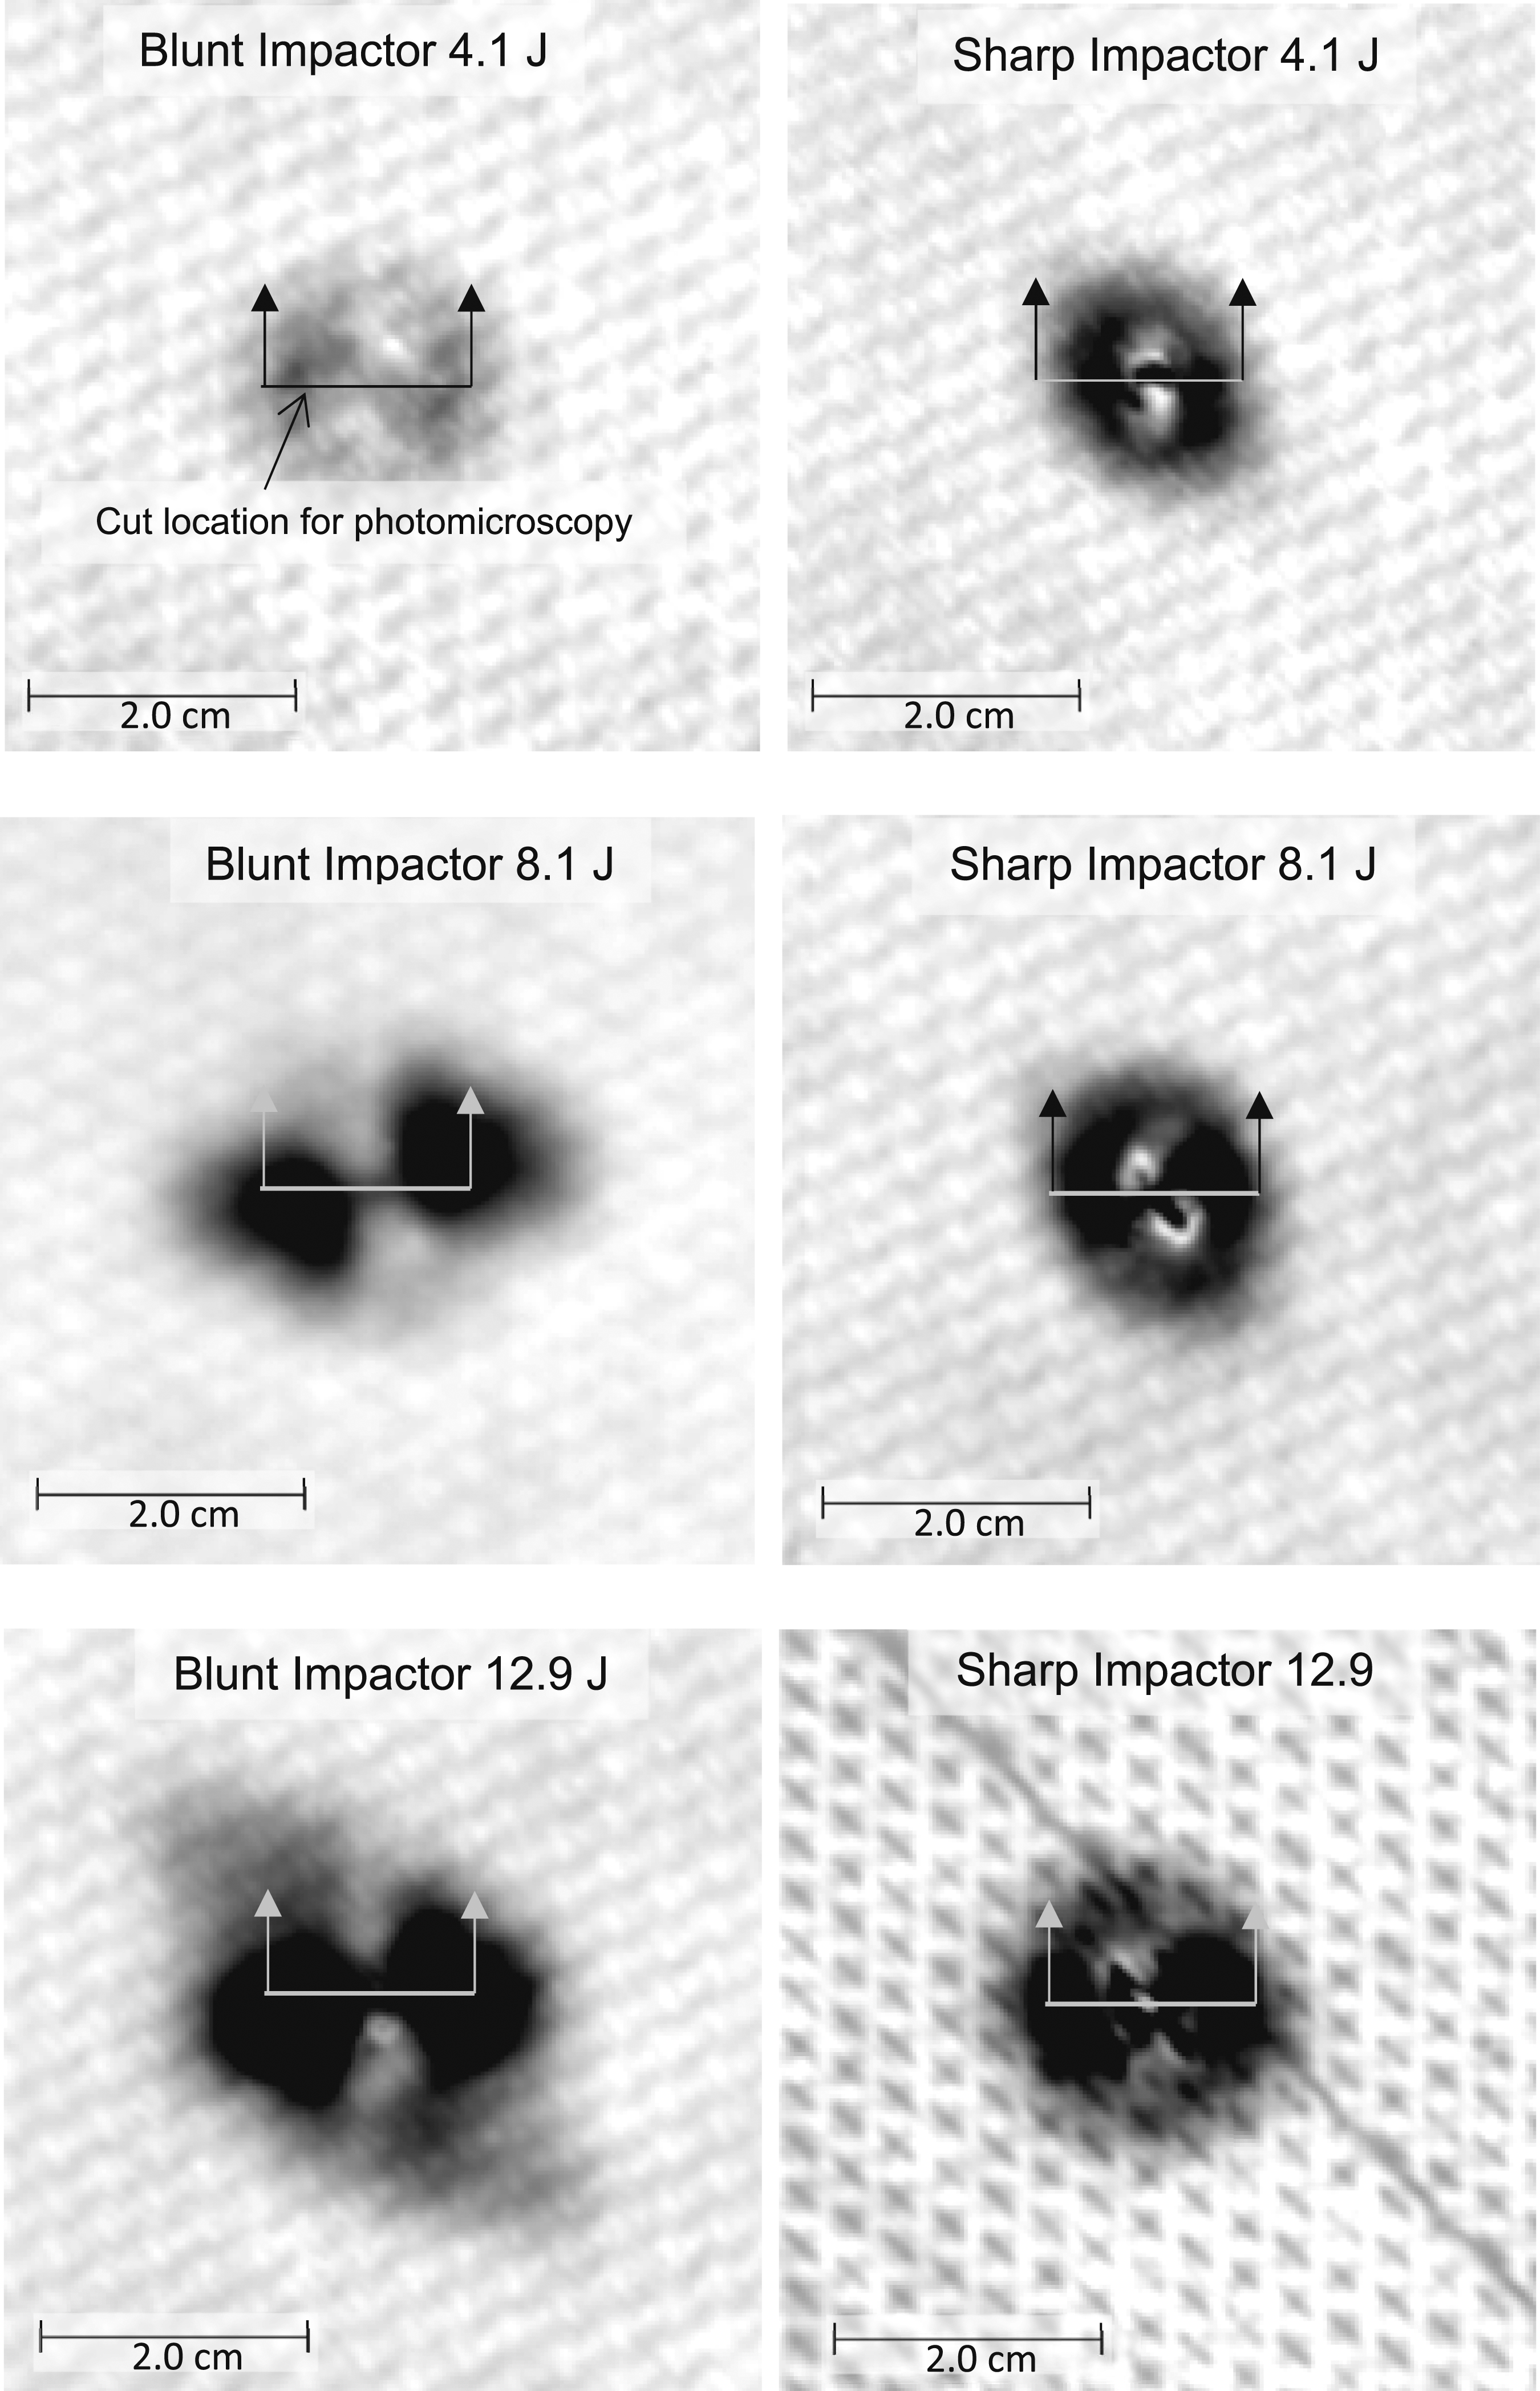
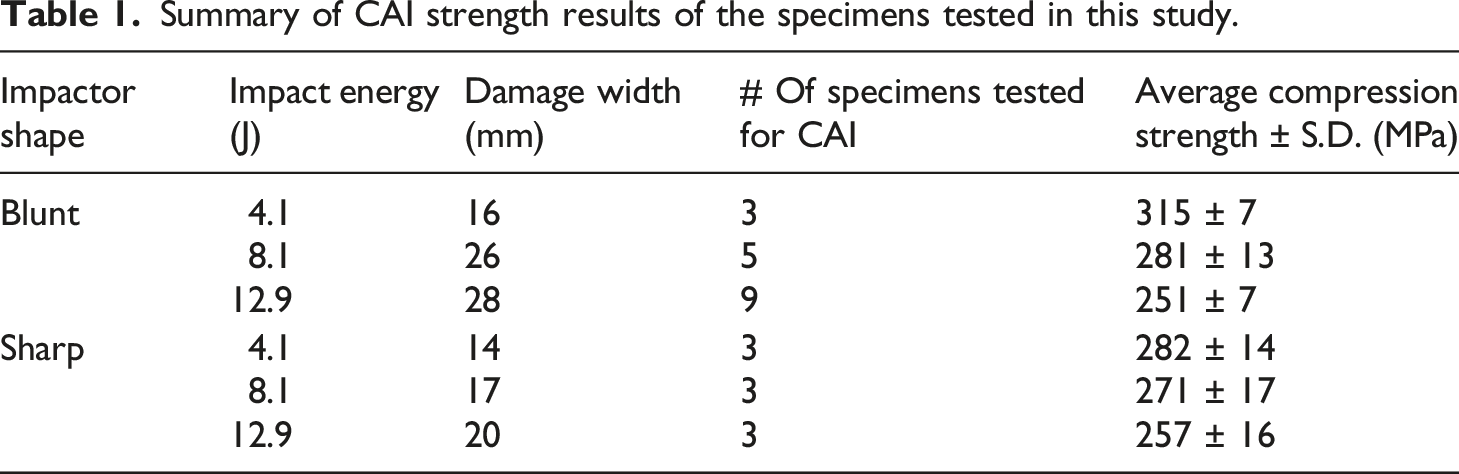
Since it has been claimed that damage width as detected by thermography is a good indicator of CAI strength, 11 the width of the damage zones in Figure 7 were measured and the values were found to be 16, 26 and 28 mm for the blunt impactor going from lowest to highest impact energies and 14, 17 and 20 mm for the sharp impactor going from lowest to highest impact energies. Thus, for any given impact energy, the blunt impactor should give a lower CAI strength value than a sharp impactor if damage width alone governs the CAI strength.
Cross-sectional microscopy
Since the thermography results cannot ascertain the through thickness extent of damage, one impact from each of the six types of impact conditions was cross sectioned in the width direction of the specimen as indicated in Figure 7. These photomicrographs are shown in Figure 8. Example cross-sectional photomicroscopy of the specimens at each of the six impact conditions tested.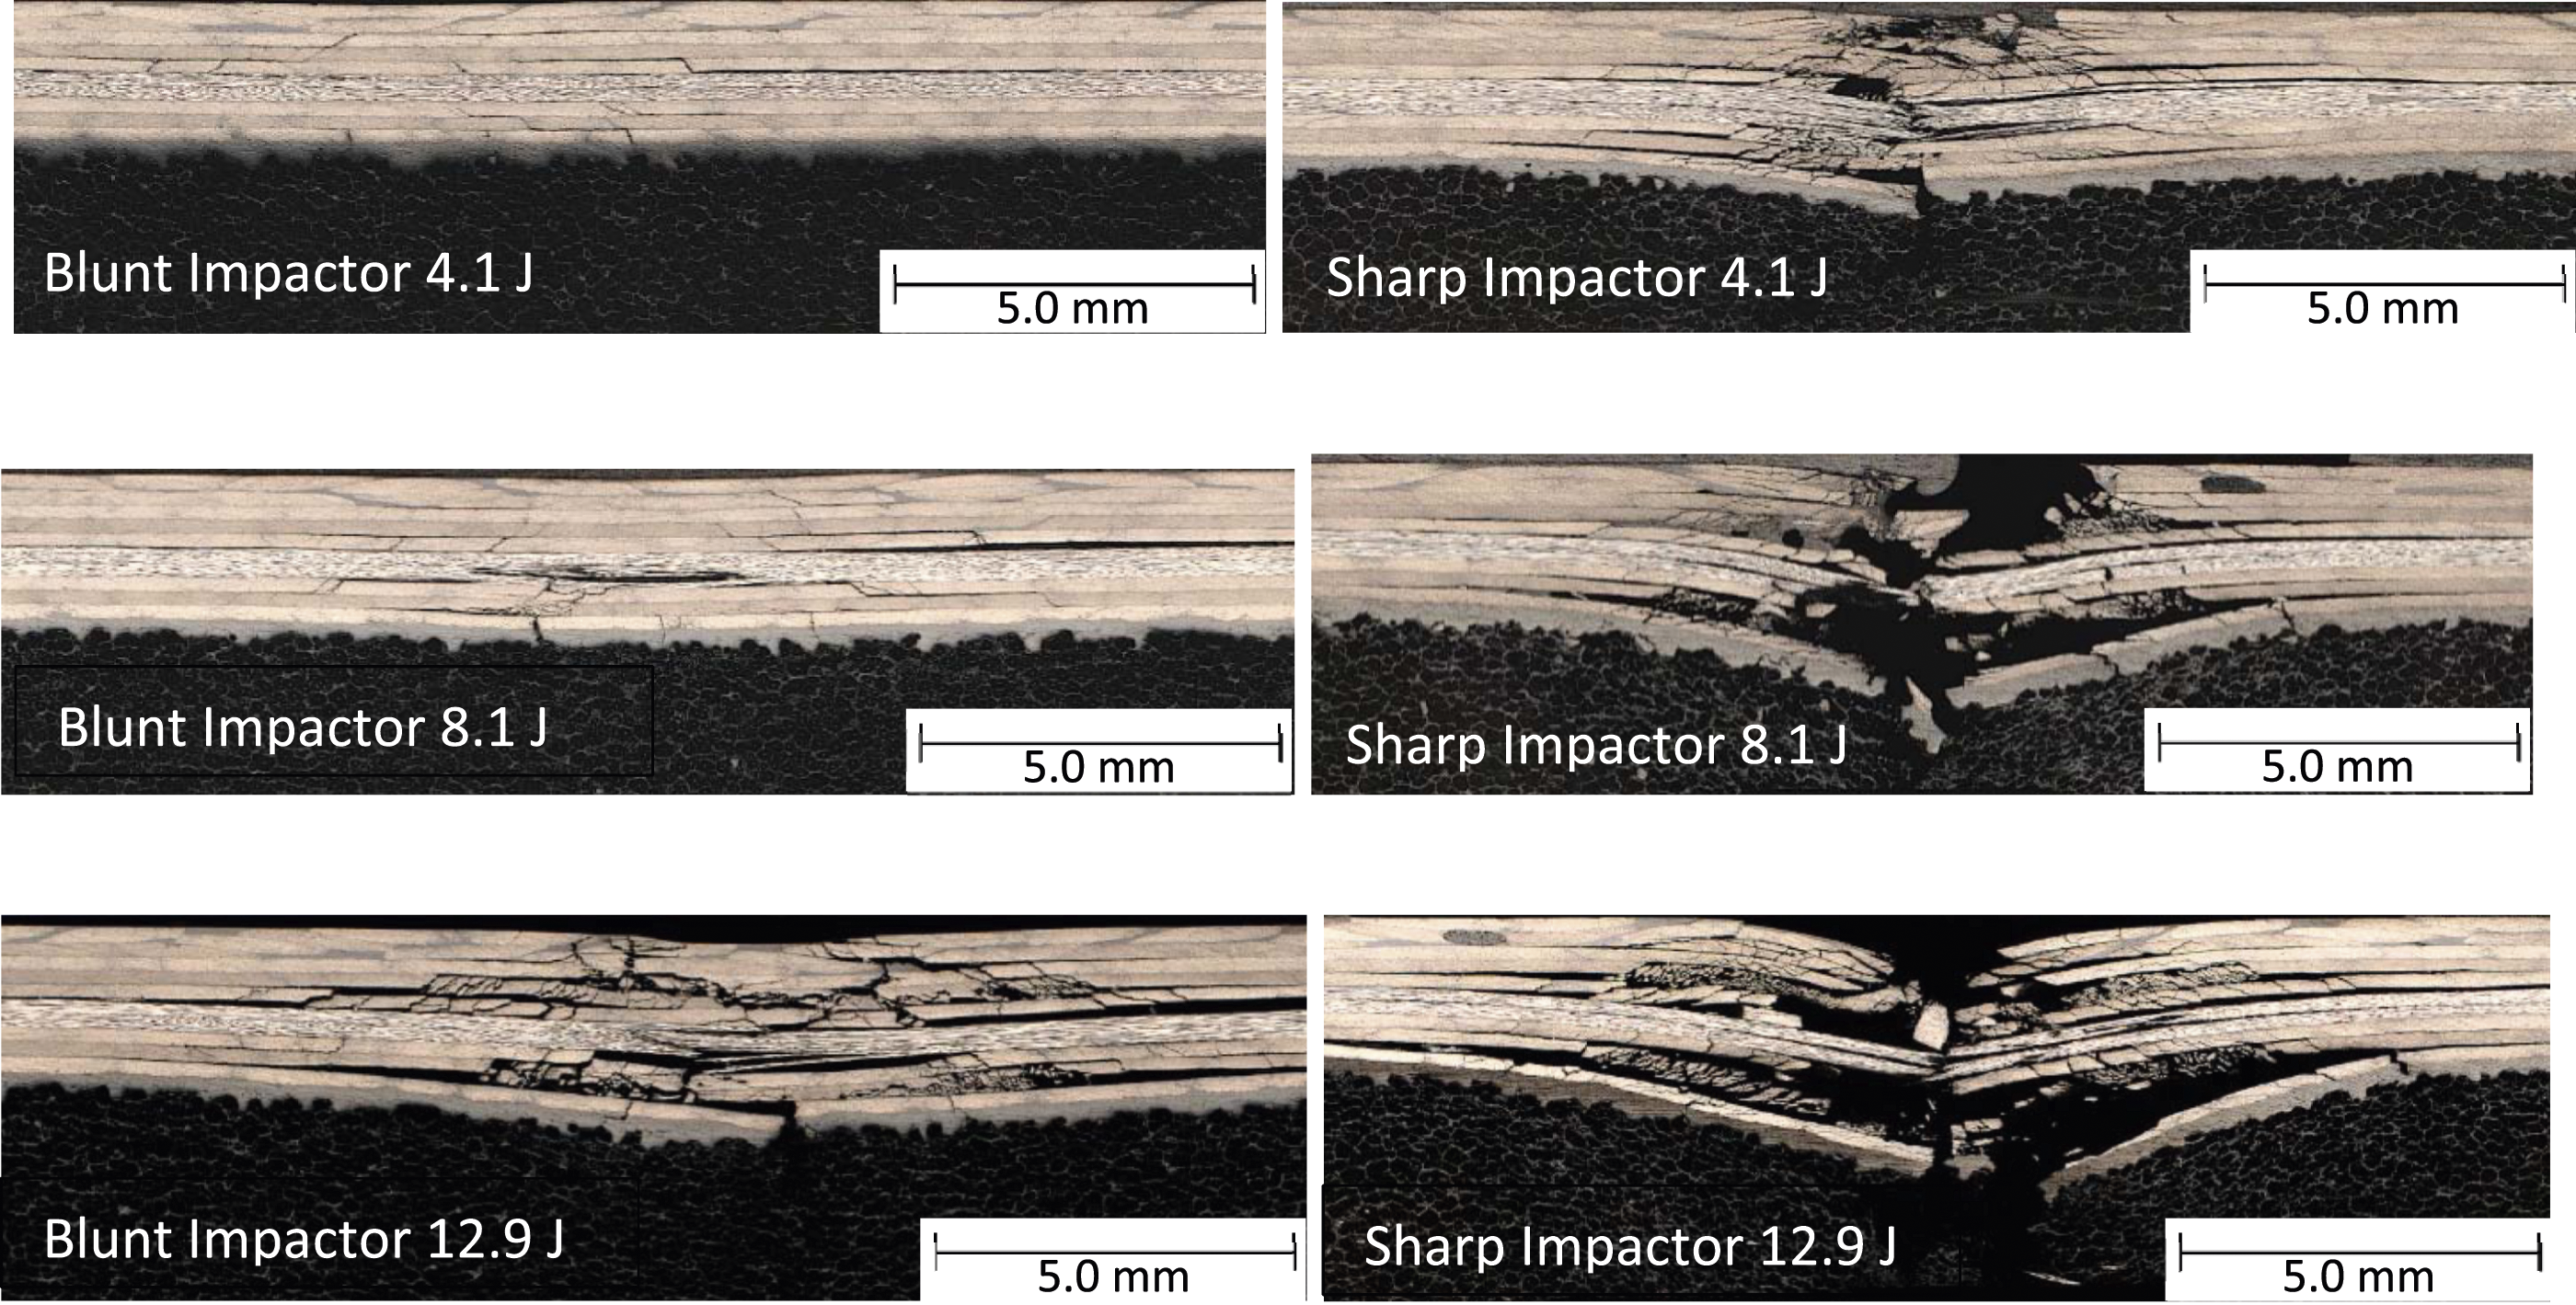
Even at the lowest impact energy level, the sharp impactor appears to completely penetrate the face sheet whereas this penetration does not occur until the highest impact energy level used for the blunt impactor. Thus the through-thickness damage is more severe for the sharp impactor which is not an unexpected result.
Compression after impact testing
The impacted sandwich specimens were assessed for residual compression strength using the test fixture shown in Figure 9. Three strain gages were placed on the specimen to ensure even loading of each of the face sheets. Two gages on the impact side were to ensure even loading across the specimen width and one gage in the center on the opposite (non-impacted) side to monitor for even loading across the specimen thickness. The specimens were taken to approximately 1000 microstrain compression and if one gage was lower than the others by more than 10%, shims were placed under the edge that was reading low until the gages were even. During compression testing the gages were monitored and if any deviation greater than 10% occurred, the test was stopped, and shims would be rearranged until the gages read within 10% of each other all the way until failure of the specimen. Fixture used in this study to assess compression after impact strength of sandwich specimens.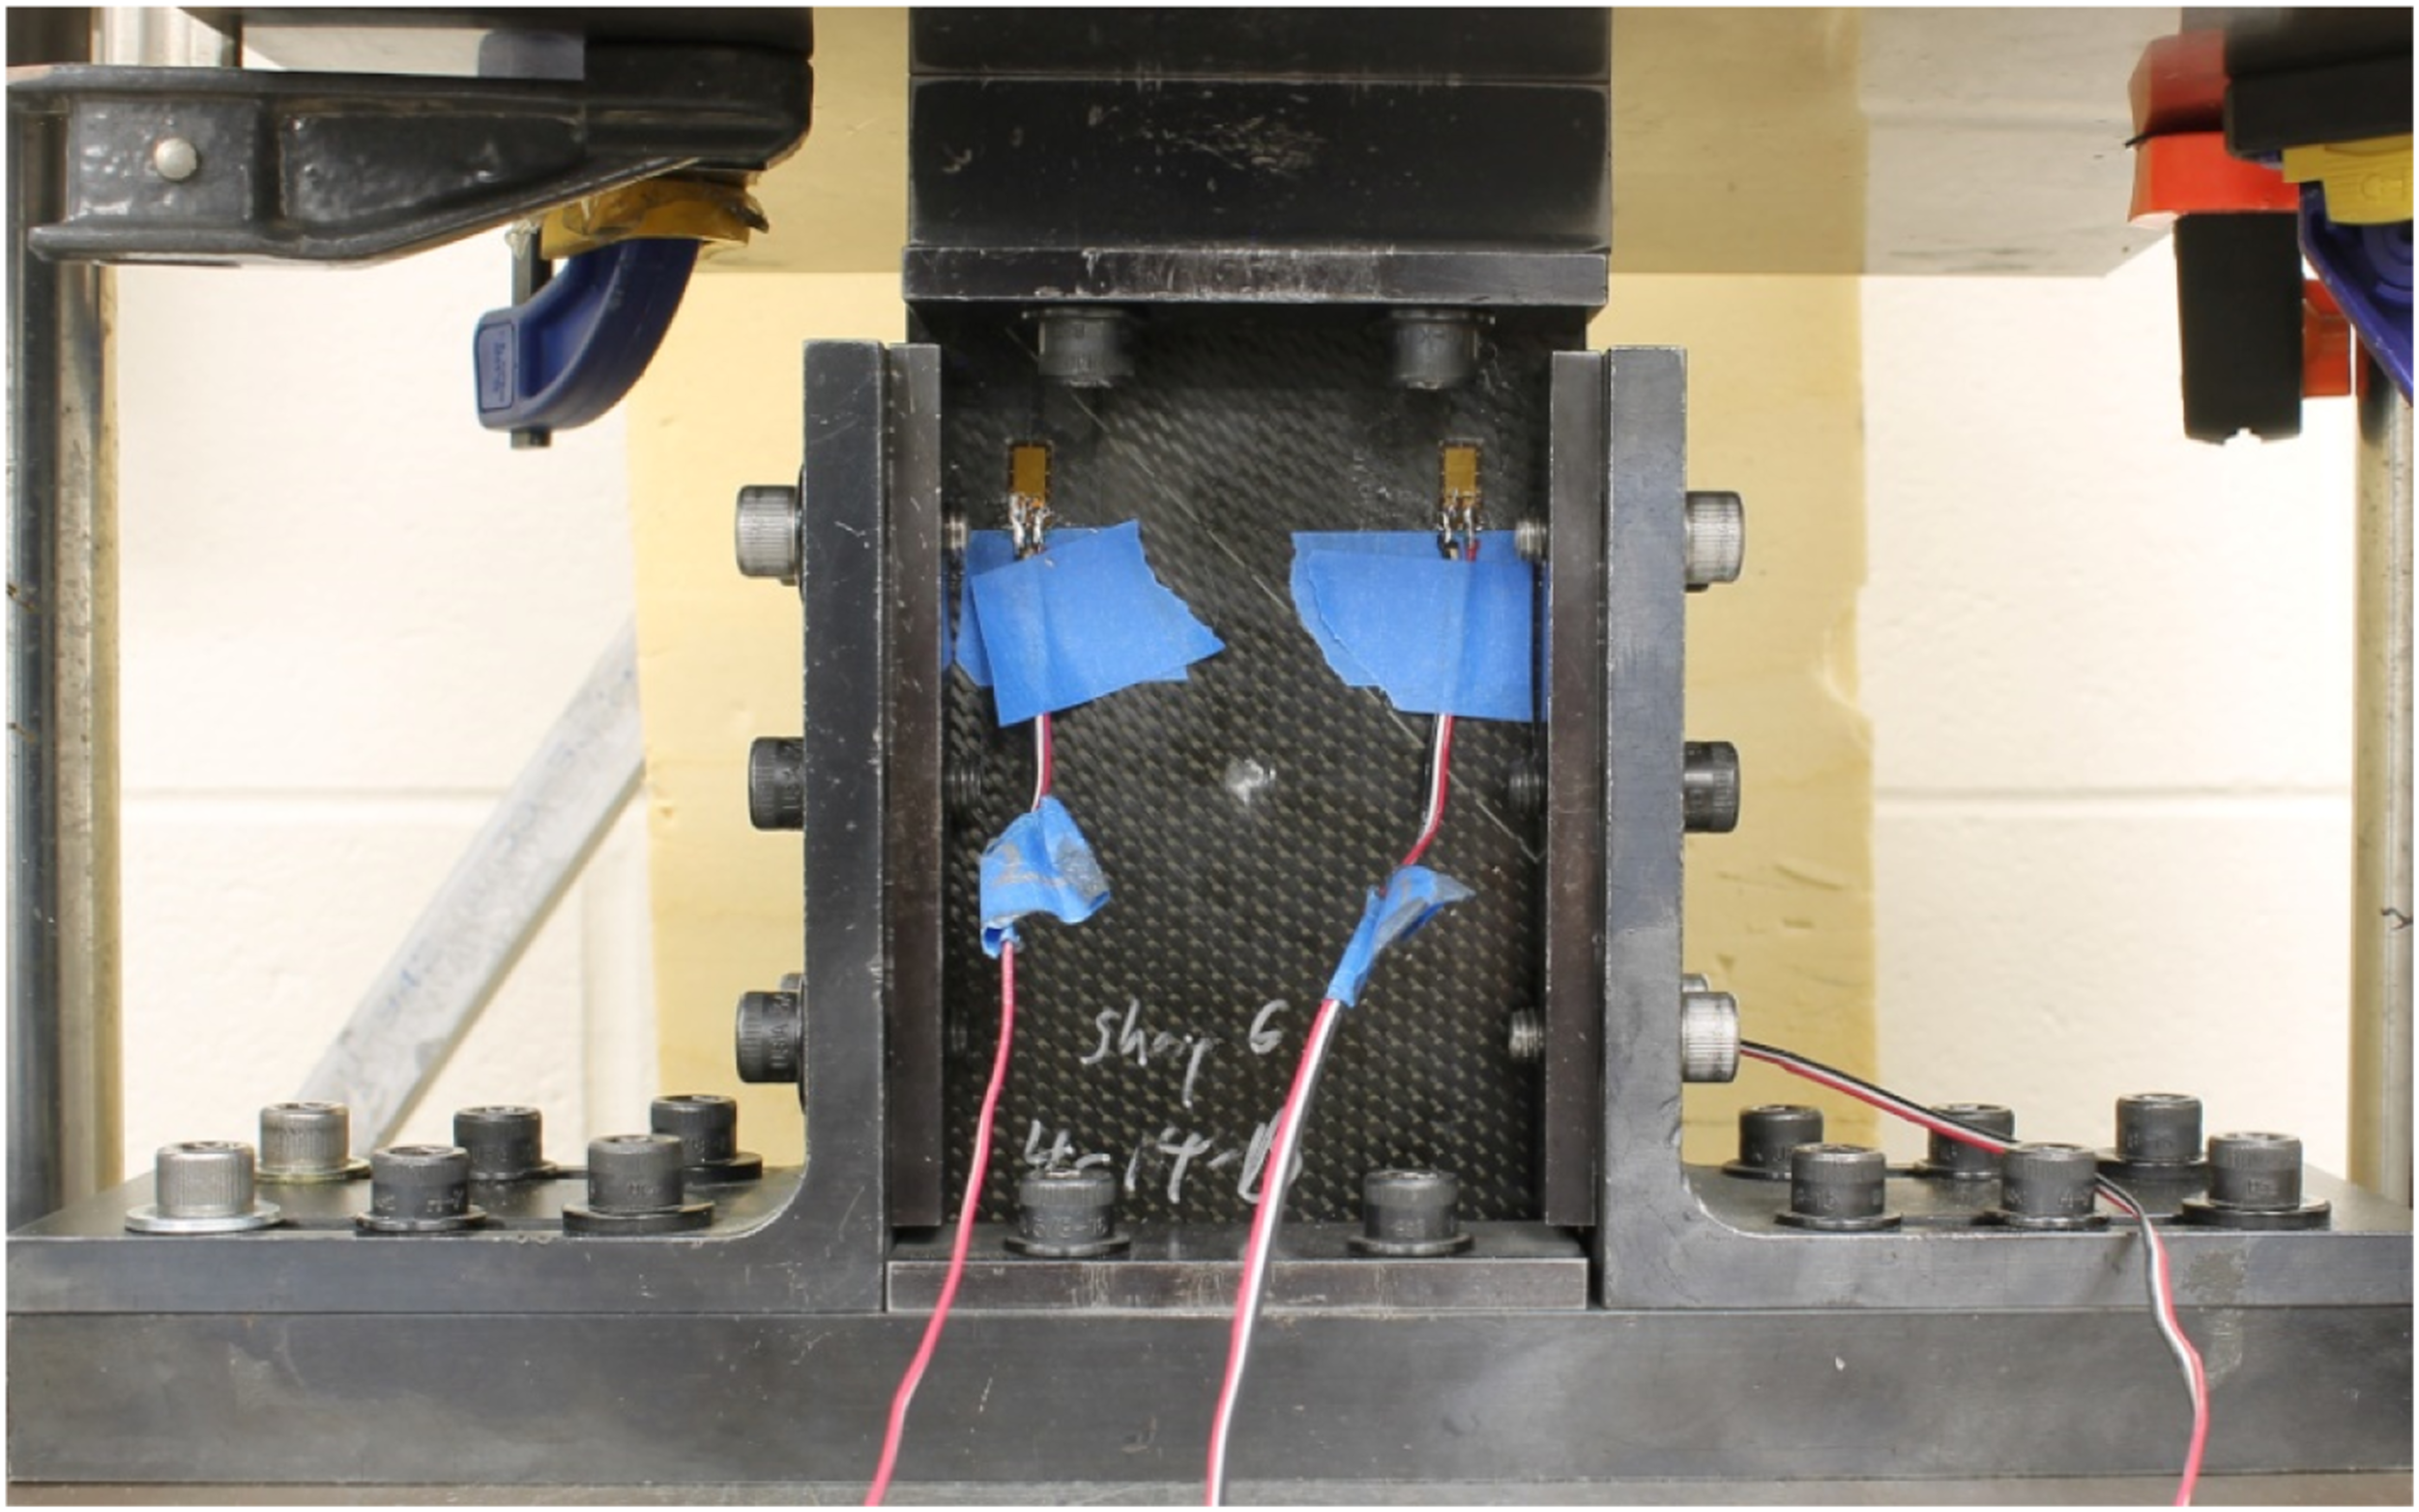
Summary of CAI strength results of the specimens tested in this study.
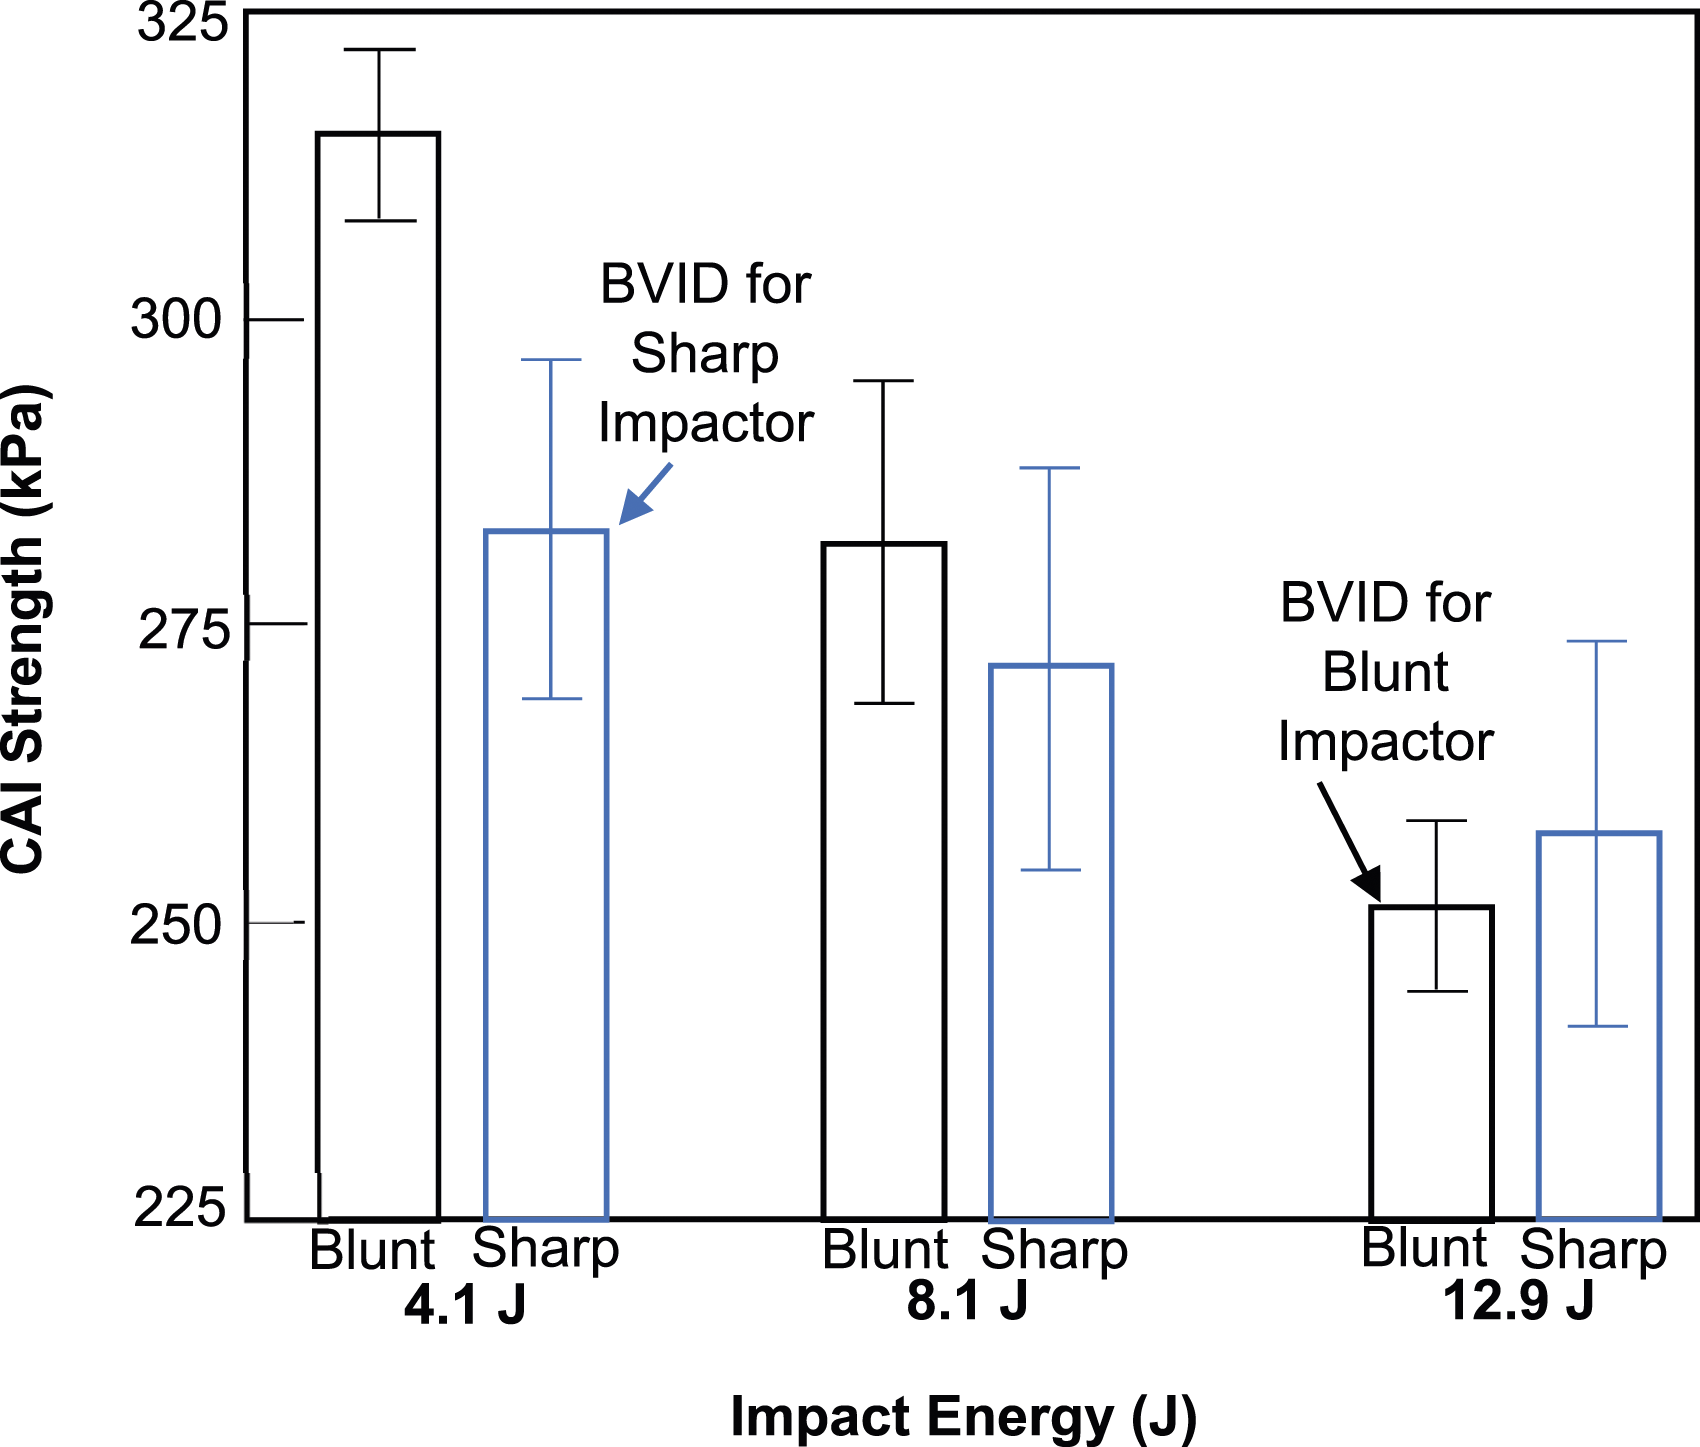
Graphic representation of average CAI results obtained in this study with +1 and -1 standard deviation bars.
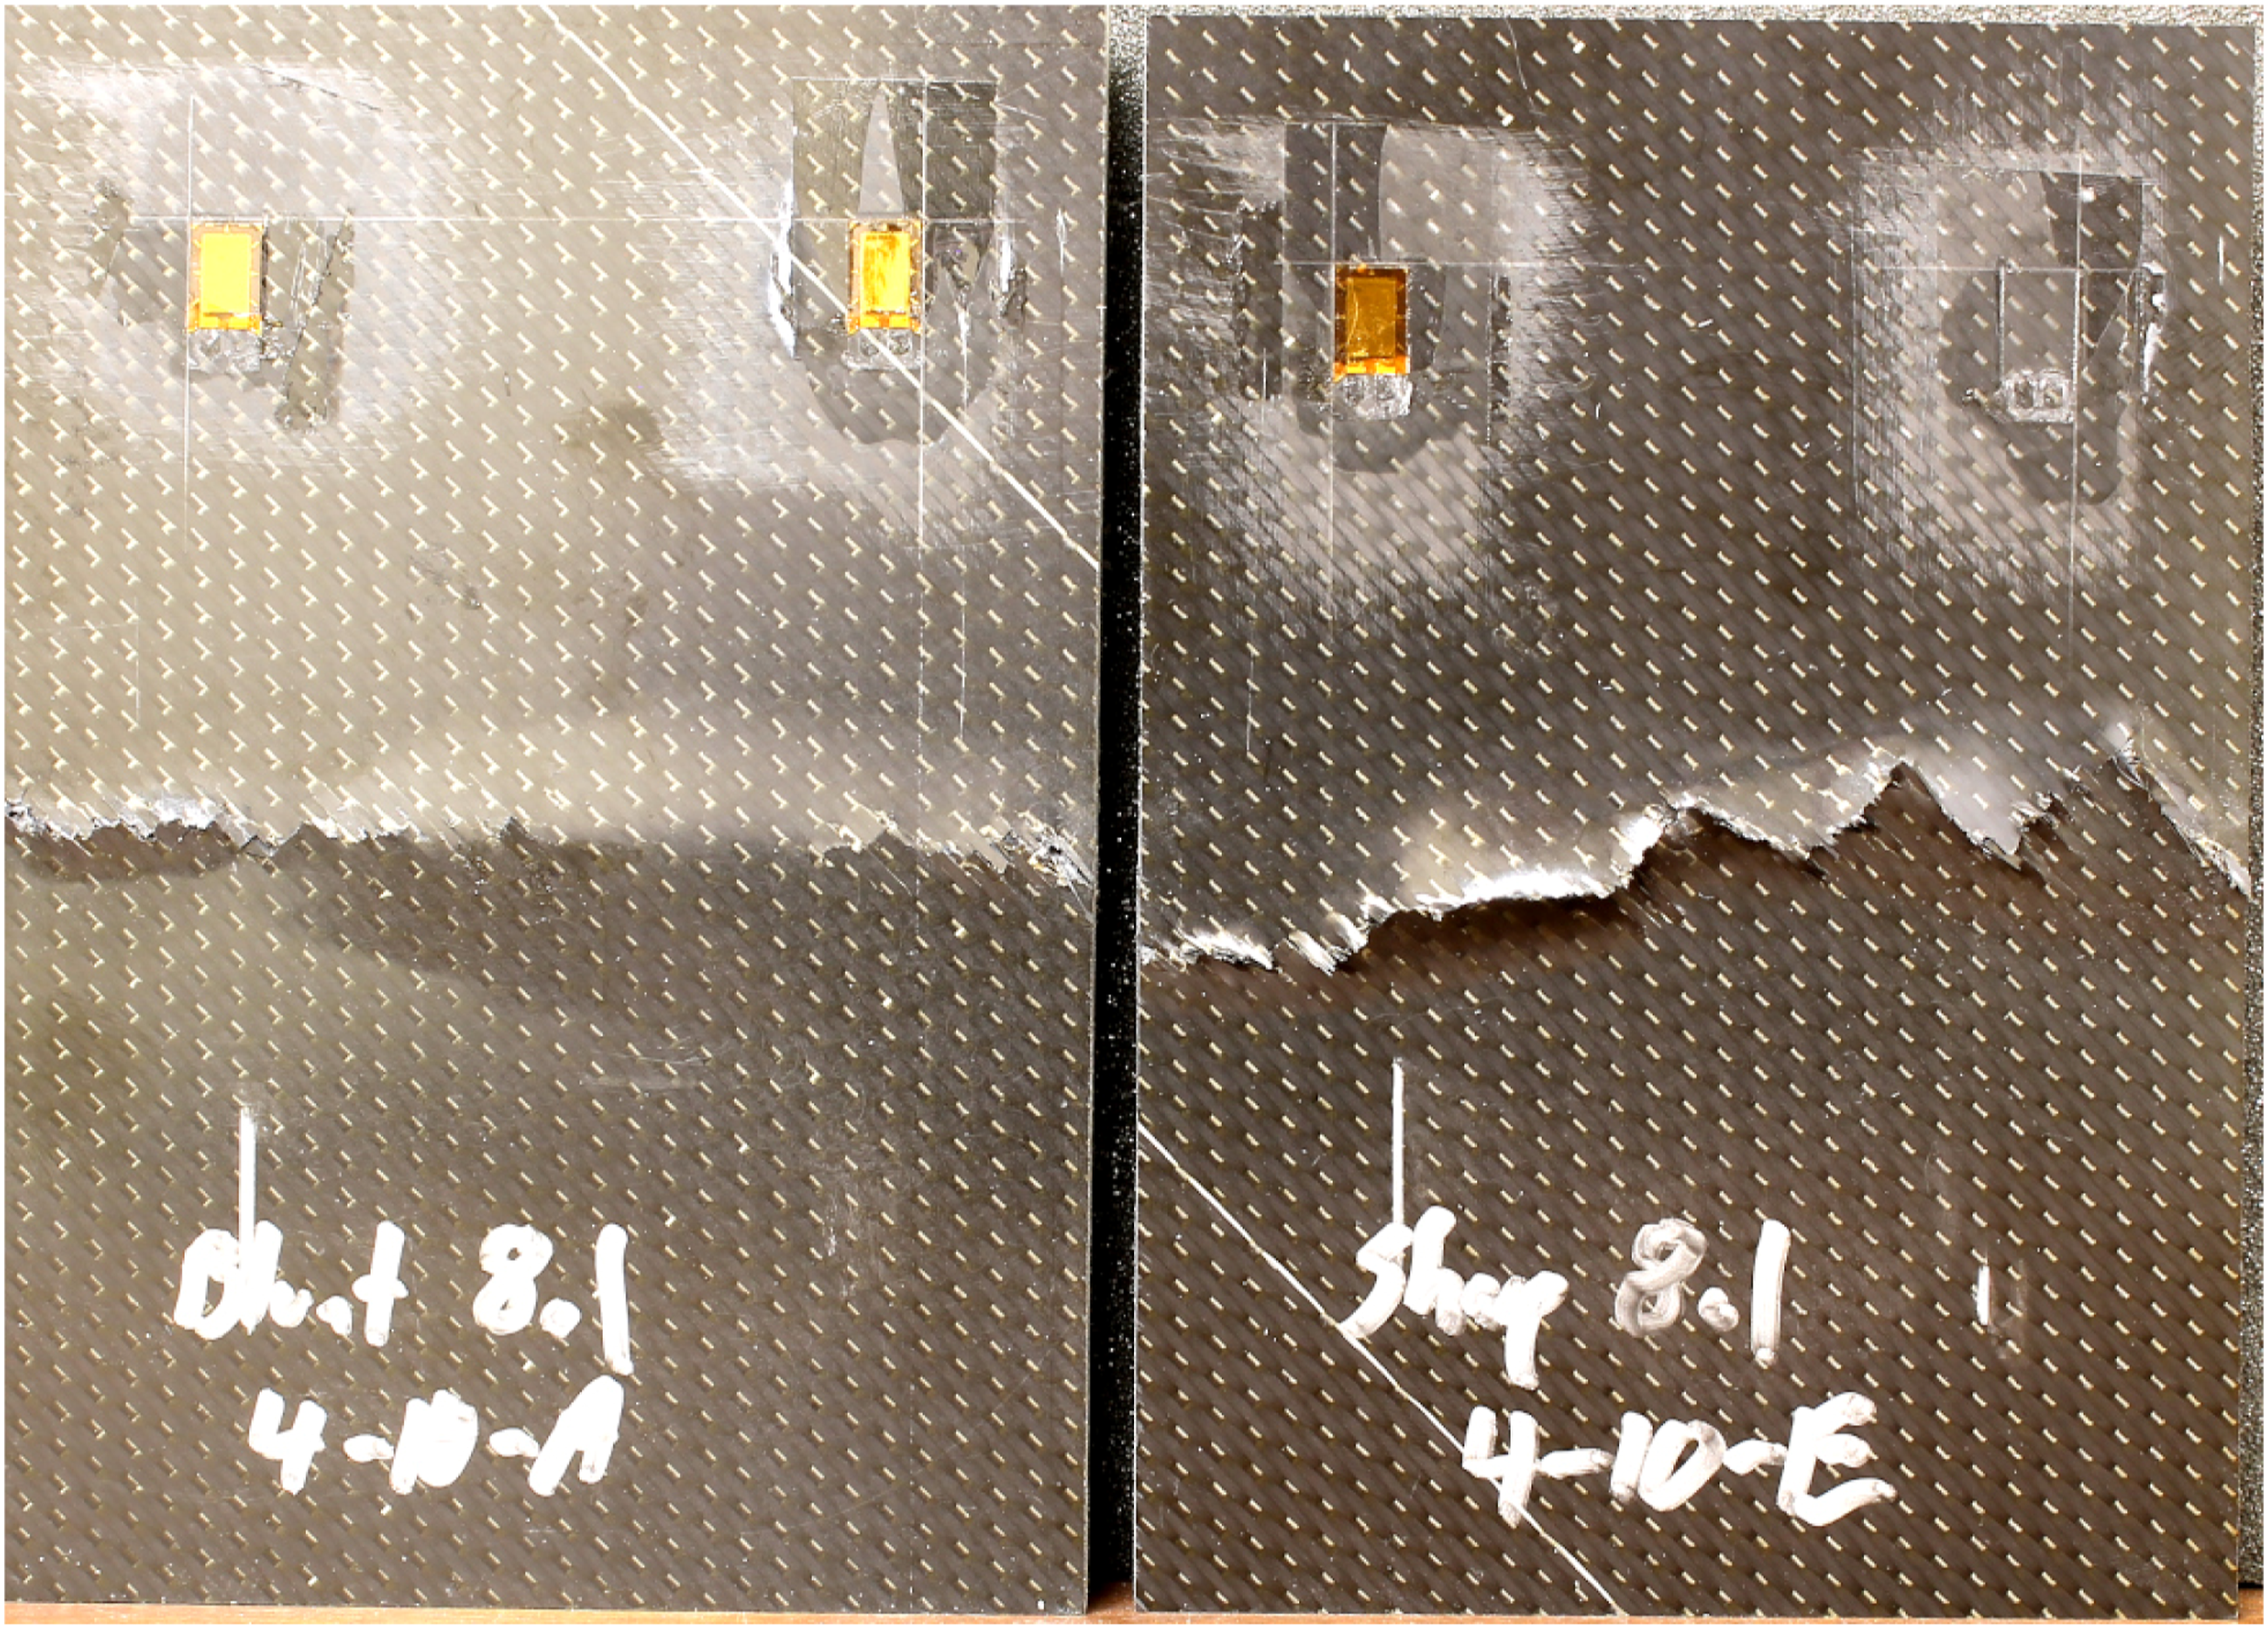
Photograph of typical failed CAI test specimen used in this study. Blunt impact specimen on left and sharp impact specimen on right. Loading direction is from top to bottom in this photograph.
It is apparent that the claim in reference 11 that damage width as detected by thermography is a good indicator of CAI strength may not be true for non-blunt impactors since at the lowest impact energy level the sharp impactor average CAI strength values are lower but had smaller damage width than the blunt impactor. At the medium and high impact energy levels, the average CAI strength values (considering the scatter) were not notably different, but the damage width from the blunt impactor was notably larger implying that the blunt impact specimens should have had a notably lower CAI strength. Thus the shape of the impactor also needs to be taken into account instead of using damage width alone.
Conclusions
The effect of a blunt versus a sharp impactor on the impact response and CAI strength of foam core sandwich structure with carbon/epoxy face sheets has been investigated in this study. The results show that the impact response is quite different with the maximum load of impact being about three times larger for the blunt impactor and the maximum deflection of the face sheet being about twice as small for the blunt impactor. Thermography results showed the sharp impactor yielding a smaller damage zone for a given impact energy, but cross-sectional microscopy showed much deeper damage for the sharp impactor. This deeper damage leads to a lower average CAI strength for the sharp impactor compared to the blunt impactor at the lowest energy level tested.
However, when based on a BVID threshold, the sharp impactor has a higher average CAI strength (282 MPa) than the blunt impactor at its BVID (251 MPa) since so much more energy is needed to produce BVID for a blunt impactor. Thus as a conservative measure, blunts impactors should be used to define BVID.
These results raise practical questions about using impact energy alone as a metric to define an impact event, as is commonly done in “damage threat assessments” since the impact response and subsequent CAI strength can be quite different depending on the shape of the impactor. It is suggested that both a damage size and through thickness evaluation of the damage zone using a NDE technique such as phase array ultrasonics (PAUT) be considered to arrive at a CAI strength value prediction. While this may not be practical in all instances, spaceflight hardware can be thoroughly inspected before flight and any known impact events (usually defined by BVID) can be dispositioned to (1) leave as is, (2) repair or (3) scrap the part based on planar and through-thickness damage as determined by NDE techniques.
Footnotes
Declaration of Conflicting Interests
The author(s) declared no potential conflicts of interest with respect to the research, authorship, and/or publication of this article.
Funding
The author(s) disclosed receipt of the following financial support for the research, authorship, and/or publication of this article: This work was supported by the National Aeronautics and Space Administration, Marshall Space Flight Center. (58577.08.50.50.40.14).