
Abstract
The structural performance of concrete walls reinforced with pultruded glass fibre-reinforced polymer (GFRP) ribbed plates on either side has been experimentally investigated. The GFRP plates were used as a stay-in-place (SIP) structural formwork replacing internal steel reinforcement. The pultruded flat plates incorporated 51 mm deep T-shape ribs on one side, spaced at 100 mm, which provided interlocking with concrete. Six 3000 × 616 mm panels, either 150 or 200 mm thick, were tested in bending (M), under axial compression (N) and under combined loads to establish the completed (M-N) failure envelope of the wall. The effect of surface treatment of the GFRP forms was also investigated. It resulted in full composite action with no concrete slip, reaching 30% higher flexural strength than untreated panels. The effect of reinforcement ratio was studied by varying wall thickness. In all panel tests, diagonal concrete shear cracking occurred and propagated into a horizontal delamination above the GFRP ribs. Slenderness effect and secondary moments were accounted for in developing the (M-N) interaction curve. Initially, M increased by 25% as N increased from zero to 17% of pure axial strength. Then, M reduced linearly to zero at pure N as concrete crushing occurred when the GFRP compression plate separated from the ribs and buckled outwards at midspan. A simplified design approach is also presented.
Introduction
Concrete walls have been widely used for structural or architectural demands in buildings or other applications. Typical solid concrete walls consist of regular strength concrete and steel reinforcement. A typical construction process starts with building the temporarily or reusable forms, assembling and placing two layers of reinforcement cages, followed by concrete placement. Once the concrete is hardened, typically forms are removed. Based on the application and performance demands, concrete walls can be designed as a stand-alone structural element or as a part of a structure, contributing to the overall performance of the structure. Deterioration is often an issue when concrete structures are exposed to harsh environments [1], mainly caused by the corrosion of steel reinforcement. The use of fibre reinforced polymer (FRP) reinforcement in concrete members in the form of bars has increased significantly as a durable alternative [2,3]. The superior performance of FRP materials in terms of longevity and strength has encouraged researchers to combine various FRP structural shapes as reinforcement with concrete in the form of hybrid elements [4–7]. Extensive research on using glass-FRP (GFRP) sections for bridge applications has demonstrated their feasibility as stay-in-place (SIP) structural forms, enabling accelerated construction [4,7–9]. These studies have shown that various pultruded GFRP forms can be used as full or partial replacement of conventional steel reinforcement in bridge decks as well as eliminating the need for temporary formwork. In addition to solving the corrosion problems of steel-reinforced concrete decks, studies [2,7] showed that there are great economical benefits to the project by reducing the on-site labour time and improving the speed and ease of construction.
Bank et al. [10] conducted an experimental study on using pultruded FRP planks as a SIP formwork and tension reinforcement for concrete beams. The study showed that concrete beams reinforced with FRP SIP forms reached higher ultimate capacities compared to steel reinforced concrete beams and performed as well or better in terms of the crack distribution. To improve the bond and develop composite action between the FRP and concrete, the study showed that coating the inner surface of the FRP plank with epoxy-bonded aggregate of 3 to 6 mm size is needed. Honickman et al. [11] conducted an experimental study on concrete slabs reinforced with pultruded GFRP flat plates. The study compared the bonded aggregate treatment method to two other methods, namely a special adhesive that bonds fresh concrete to GFRP surface, and the use of mechanical fasteners. It was found that slabs with bonded aggregate outperformed all other methods, where bond failure happened at a much higher load without any slip prior to failure.
All previous investigations of GFRP SIP forms simulated a concrete slab – or bridge deck – applications, where the form is on the underside of the member. This paper introduces the first application, to the authors’ knowledge, of GFRP SIP forms in vertical walls as a robust GFRP facing sandwich system filled with concrete. Applications may include buildings (above or below ground walls), retaining walls, and walls of storage tanks. The GFRP SIP forms used are commercially available flat plates with T-shape ribs on one side. The ribs provide interlocking with concrete, thereby enhancing bond. The study aims to test this new system under a full range of out-of-plane bending and axial compression loads, accounting for slenderness effects, and develop a simple design tool.
Experimental study
Six concrete wall panels reinforced with pultruded GFRP SIP forms were fabricated and tested to failure. All specimens were 3000 mm long by 616 mm wide, including five that were 150 mm thick and one that was 200 mm thick. All specimens consisted of a regular strength concrete core sandwiched in between two commercially available pultruded GFRP structural forms. Figure 1(a) to (c) shows a plan view and the cross-sections for the walls, while Figure 1(d) and (e) show the GFRP SIP form used. Details of the experimental program including materials, test matrix, fabrication, test setup and instrumentation are presented in the following sections.
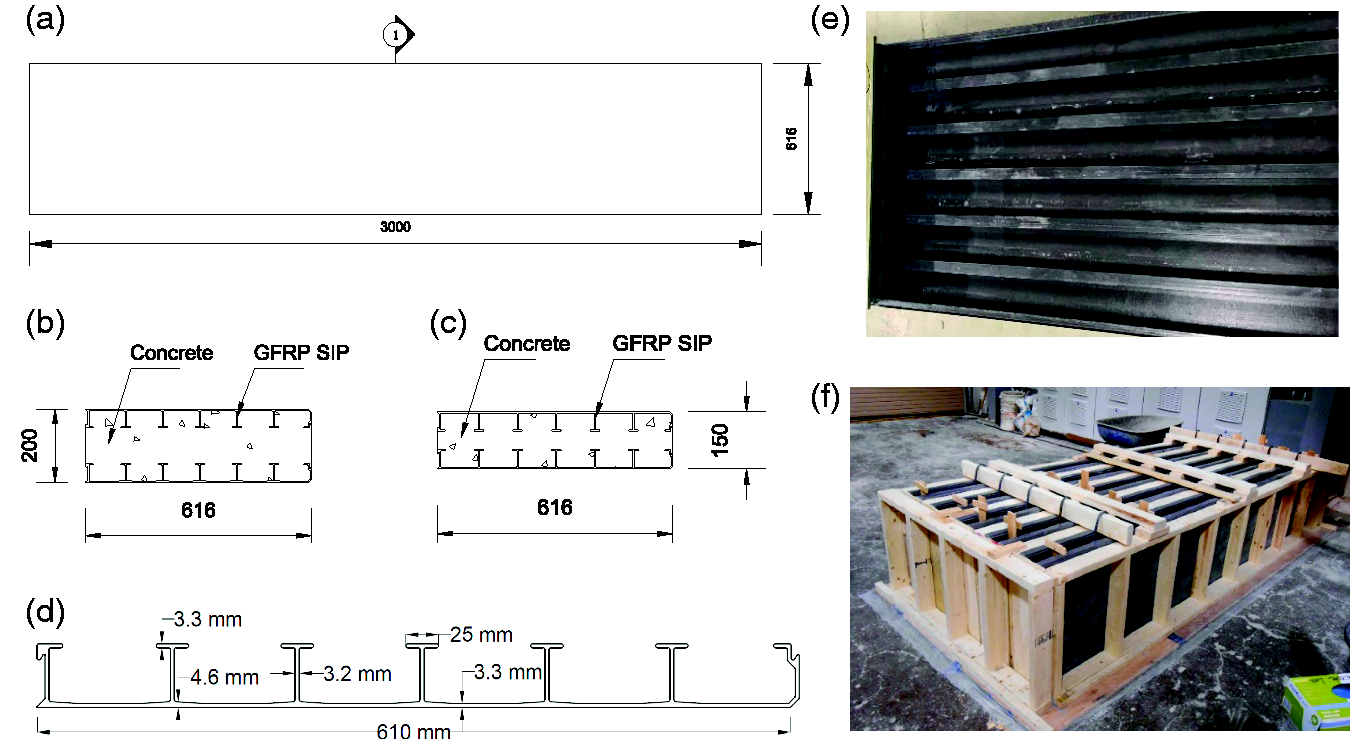
General panel configuration: (a) Plan layout; (b) Cross-section of specimen FX-2; (c) Cross-section of specimens FX-1, FX-3, CL-300, CL-600 and CL-900; (d) SIP form profile, (e) Picture of SIP form, (f) Casting in a ‘battery’ arrangement. All dimensions in mm.
Test matrix
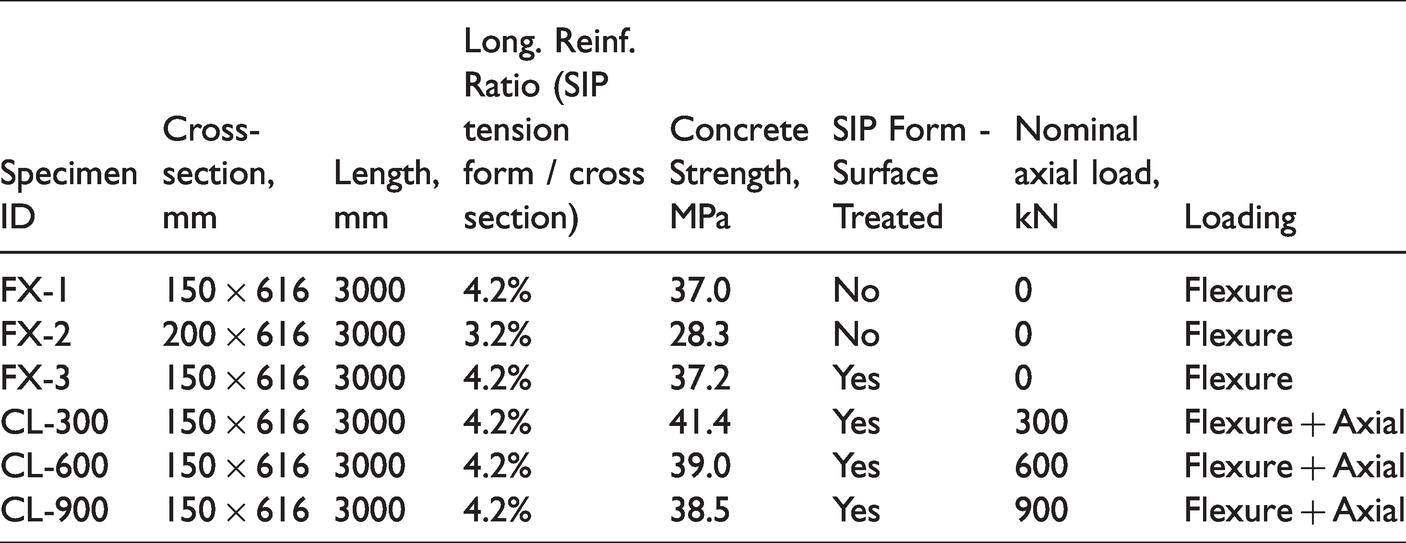
Table 1 shows the test matrix including the parameters investigated in this study. Six full-scale wall specimens were tested to failure. Specimens designation ‘FX’ in Table 1 indicates the walls tested in bending only, whereas, ‘CL-300’ indicates a specimen tested under combined bending and a fixed axial compression of 300 kN. The first two walls, FX-1 and FX-2, were used to investigate the effect of wall thickness, namely 150 mm and 200 mm, reflected through GFRP reinforcement ratio. The inner surface of the GFRP forms for these two walls was not treated. The effect of surface treatment was investigated by comparing FX-1 and FX-3. FX-3 had its GFRP forms treated using epoxy-bonded aggregates. The axial-moment (N-M) interaction curve of this wall system has been established using the results of FX-3, CL-300, CL-600 and CL-900. FX-3 was tested in bending only while ‘CL’ specimens were tested under combined axial compression and bending, at various levels of axial load. To assess the capacity of this wall under pure axial load, ancillary stub-wall tests were conducted on segments cut from the intact ends of tested walls.
Test matrix.
Materials
Concrete
Regular strength concrete that was premixed and delivered with a ready-mix truck was used. The concrete mix had a maximum aggregate size of 12 mm to flow better around the integrated ribs of the GFRP SIP forms. One specimen (FX-2) was fabricated using a different concrete batch. Three standard size cylinders, 100x200 mm, were cast for each specimen as per CSA A23.2 [12]. Cylinders were demolded after 24 hours and were left to cure in the air at approximately 21 °C, same as the walls until the day of the test, approximately three months after the cast. The ends of each cylinder were ground properly to ensure uniform bearing and the loading rate was applied at 0.25 MPa/s. Table 1 shows the average compressive strength on the day of the test for each wall specimen.
GFRP SIP forms
Commercially available GFRP forms were used for this study. The GFRP forms consist of T-shaped ribs integrated onto a 3.3 mm thick plate (Figure 1(d) and (e)). The ribs are spaced at 101 mm centre-to-centre and the overall width of the form is 616 mm with preformed sides for potential splicing of more than one form. The GFRP form has a cross-sectional area of 3887 mm2 and is fabricated using a pultrusion process. The standard length of the GFRP form is 6000 mm.
Twenty coupons were cut from the plate and the ribs of the GFRP form, including five for tension and five for compression tests, from each. The coupons were tested following ASTM D3039 [13]. Figure 2(a) and (b) shows the stress-strain curves of the plate and rib, respectively. The average ultimate tensile strengths of the plate and ribs were 472 MPa and 413 MPa, respectively, with standard deviations of 37 MPa and 79 MPa, respectively. The average compressive strengths for the plate and the rib were 352 MPa and 312 MPa, respectively, with standard deviations of 28 MPa and 57 MPa, respectively. The average modului of the plate and ribs are 22.8 GPa and 20.6 GPa, respectively. Figure 2(c) and (d) show the failed coupons.
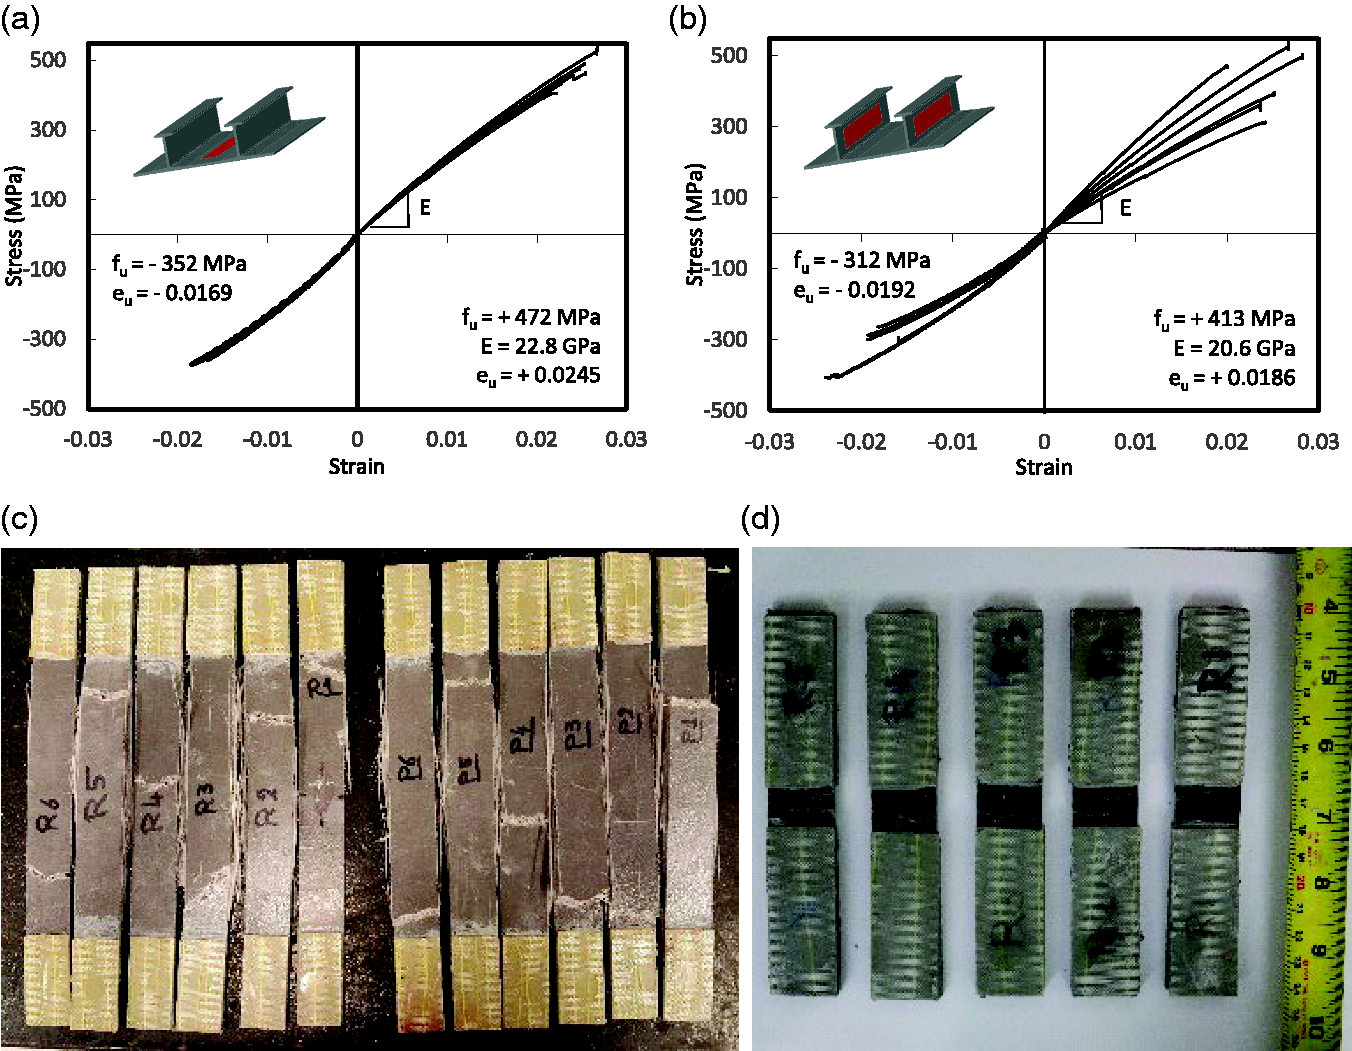
Material testing of FRP SIP forms: (a) Stress-strain of the plate section; (b) Stress-strain of the rib section; (c) Tested coupons in tension; (d) Tested coupons in compression.
Epoxy adhesive
A commercially available two-part epoxy was used to bond the aggregate to the inner surface of the pultruded GFRP planks. This adhesive has a mortar-like consistency with approximately 30 minutes of working time once the two parts are mixed. The manufacturer data shows a tensile strength of 24.8 MPa and shear strength of approximately 16 MPa.
Fabrication of specimens
The GFRP forms were first cut to size lengthwise, at 3000 mm sections. Two 3000 mm long by 616 mm wide GFRP forms were used on each wall specimens. The forms were used ‘as-is’ for specimens FX-1 and FX-2. The remaining eight forms for the other specimens were treated to enhance the bond between the GFRP and concrete. Other studies [10,11] have shown that applying a layer of epoxy-bonded aggregate to the inner surface of the GFRP plate significantly improves bond. Crushed gravel was used in this study and was first sieved at 3.1 to 6.3 mm size and then washed and dried before use. The inside surface of the GFRP forms was cleaned, then a layer of thin pre-mixed epoxy was applied on the plate between the T-shaped ribs. Approximately 3–4 kg/m2 of aggregate was placed on the fresh epoxy layer and then the aggregates were gently pressed into the epoxy with an aluminum roller. One day after, the loose aggregates were brushed-off leaving only the well-embedded aggregates into the epoxy.
A light wooden frame was built to hold the GFRP forms in place (Figure 1(f)). All specimens were cast on their side with one GFRP form on each face. After securing the forms in place, concrete was poured in approximately three equal layers and vibrated in between to ensure good flow and consolidation in between GFRP forms.
Test setup and instrumentation
Full-scale walls
The first three ‘FX’ wall specimens were tested in four-point bending at a span of 2850 mm. The two loads were applied at 1150 mm from each support, resulting in a 550 mm constant moment zone. The specimens were supported by a pin and a roller at 75 mm from each end. The load was applied using a 900 kN capacity stroke-controlled machine at a rate of 1 mm/min, and was distributed using a steel spreader beam. Figure 3(a) to (d) shows the typical test setup for the wall specimens. The test setup for ‘FX’ specimens did not include the axial loading system. The test setup for the ‘CL’ specimens includes the end bearing steel plates and the axial loading self-reacting frame. The endplates were designed to apply an eccentric axial load to satisfy the minimum requirements by design codes. According to CSA A23.3 [14] the end moment in axially loaded elements should satisfy equation (1) below, which results in a 20 mm minimum eccentricity in this study. The stiff plates were designed to provide a uniform bearing stress under high axial load while enabling free end rotation of the wall using a pin sandwiched between two plates including the bearing plate (Figure 3(b)).
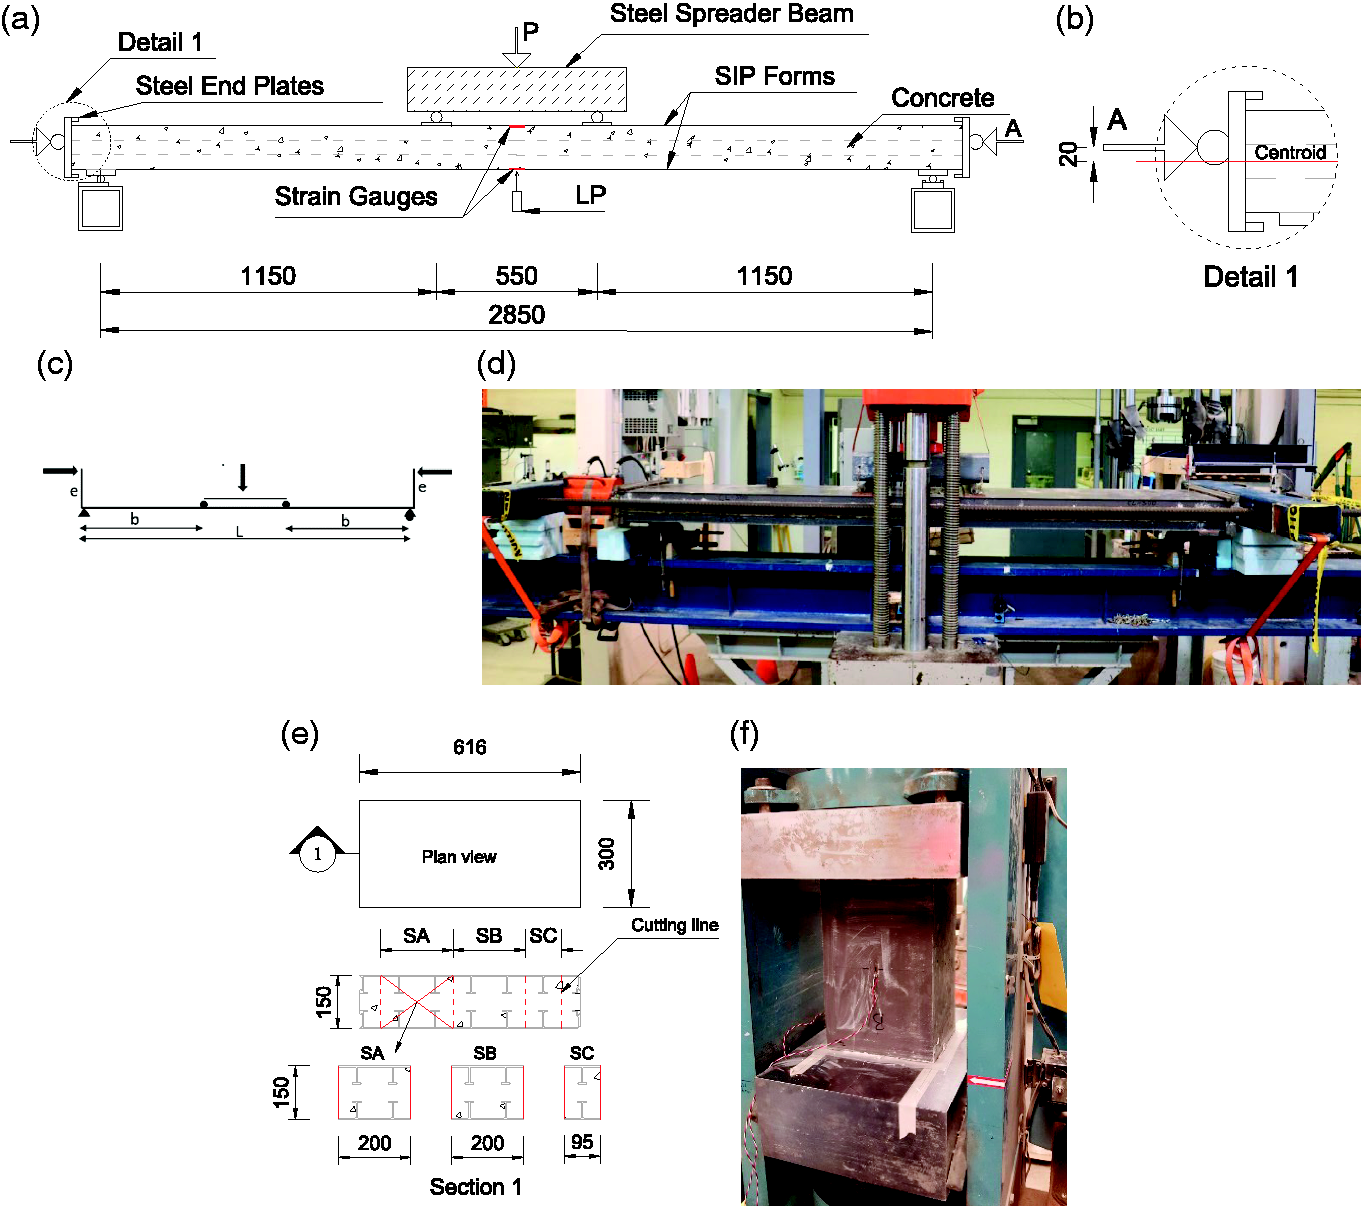
Test setups: (a) Schematic view of full panel test, (b) Details of eccentric axial end loading, (c) Idealized beam action, (d) picture of full panel setup, (e) three stub specimens cut from an end of a full-size panel and (f) Stub column test setup (all dimensions in mm).
The 2000 kN capacity self-reacting frame used to apply axial loads consists of stiff HSS steel sections at the ends and two 38 mm diameter high strength steel threaded bars. A hydraulic ram was used to apply the axial load and was placed on one side between the HSS reaction beam and the loading plate-pin system. Once the ‘CL’ wall specimens were placed on the supports, the axial load was applied first to the specified load levels, namely 300, 600 and 900 kN, for CL-300, CL-600 and CL-900, respectively, at a rate of approximately 50 kN/min. Then, the specimens were loaded in bending while the axial load was kept constant during transverse loading to failure.
Transverse, axial loads and stroke were recorded. The mid-span deflection was measured using a linear potentiometer (LP) while the top and bottom longitudinal strains of the GFRP plate at mid-span were measured using 5 mm uniaxial strain gauges. The end slip between the bottom GFRP form and concrete of ‘FX’ specimens was measured using LPs. The uplift of the threaded bars arising from end rotations in the ‘CL’ specimens was measured at mid-span and at both ends using LPs. The exact elevation of the threaded bars was especially important to track during the tests since it affects the added moment from the eccentric axial load.
Stub-walls
Three stub column tests were retrieved from the intact end of a full-scale wall specimen as shown in Figure 3(e) and (f). The specimen was carefully inspected for any cracks or damage of GFRP and concrete before the samples were cut and no signs of damage on that part of the wall were observed. Because of the maximum axial loading capacity of the testing machine the full cross-section could not be tested to failure. As such, three separate sections representing two different configurations were tested (Figure 3(e)), including two similar specimens with two T-shape ribs in each plate and one configuration with a single rib in each plate. By comparing the strength of the two configurations it is possible to conclude if there is any increase in concrete strength due to confinement that might be generated between ribs. The ends of each specimen were ground and squared, and a thin layer of plaster was placed on each end to ensure uniform bearing. The load was applied using a 2200 kN testing machine at a rate of 0.25 MPa/s.
Experimental results
The test results and observations are presented and compared in the following sections, in terms of load-deflection responses under transverse and/or axial loads, load-strain and load-slip responses and failure modes. The effects of different parameters on the behavior are also presented.
Wall panel behaviour under axial loads
Full scale panels
Three wall specimens, CL-300, CL-600, and CL-900 were tested under combined loading, axial and transverse. The axial load at the ends of the wall was gradually applied first and the response of each wall was monitored in terms of mid-span deflection and strains as reported in Table 2. Because the axial load was applied on pin-end connections to allow rotation, the axial loading frame including the threaded bars gradually shifted upwards as the load was increased. When the target axial load was achieved these shifts at mid-span were 0.13 mm, 1.8 mm and 8.6 mm for CL-300, CL-600 and CL-900, respectively. The additional eccentricity caused by this shift was accounted for when calculating the moment from the axial load.
Panel behavior under initial axial loading.
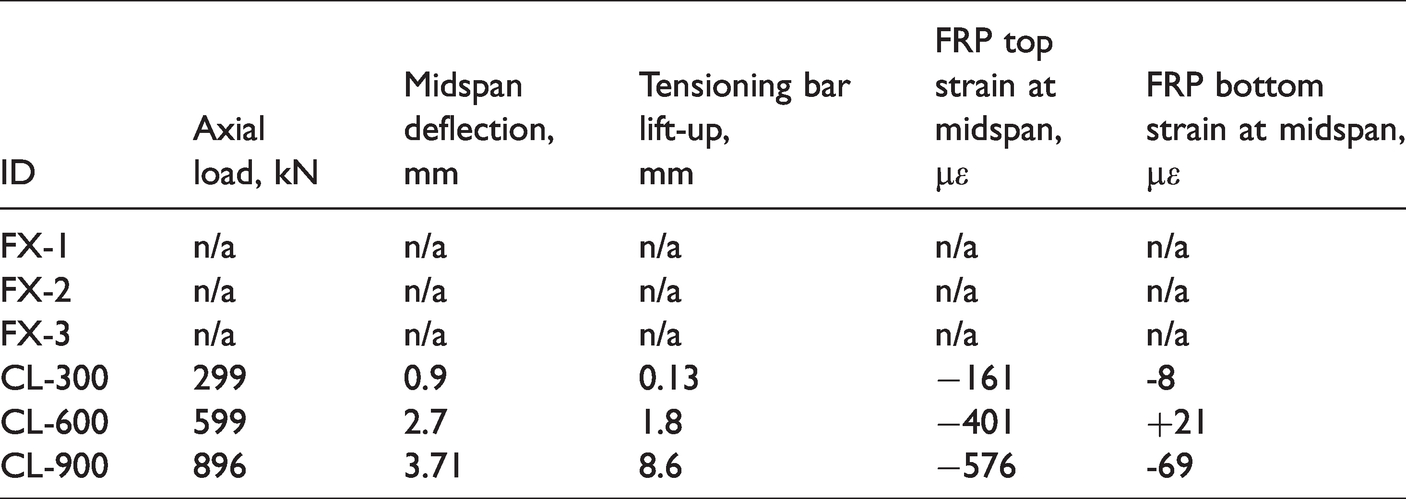
The axial load-transverse deflection responses of the three specimens are shown in Figure 4(a). A linear response can be seen until the target axial load was reached, then a flat plateau as the load was kept constant during transverse loading. The measured mid-span deflections were 0.9 mm, 2.7 mm and 3.7 mm for CL-300, CL-600 and CL-900, respectively (Table 2). Figure 4(b) shows the load-midspan strain responses under axial loading. The strains were mostly compressive and were very low (Table 2). They were found to be higher at the top of the wall due to the initial upward eccentricity of the axial load. Once the target load was reached and transverse load was introduced, the strain profiles were more defined in terms of compression and tension at the top and bottom fibres, respectively.
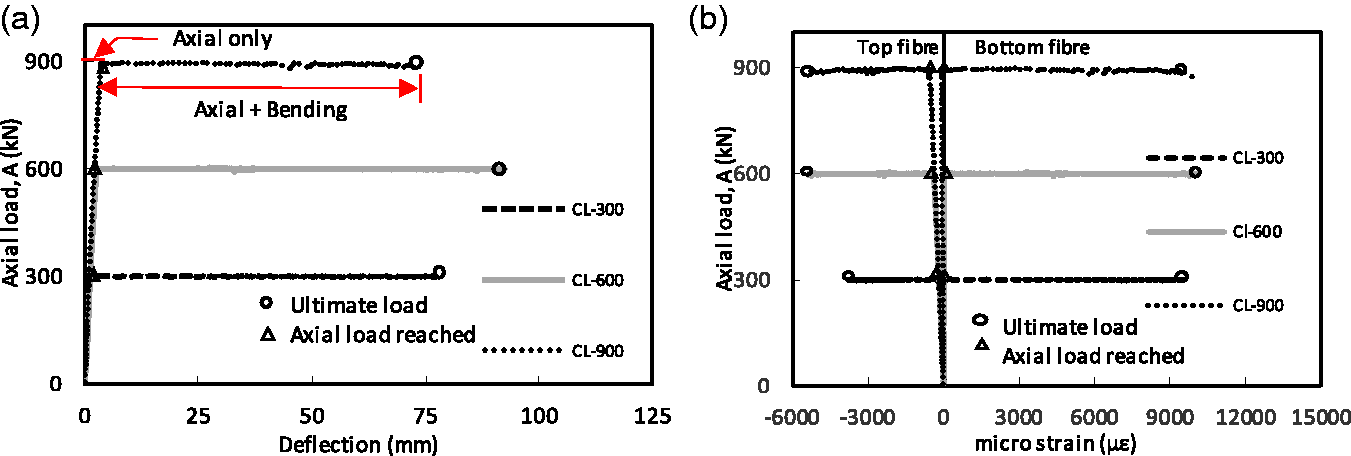
Behavior under axial loading followed by increasing transverse loading: (a) Axial load – midspan deflection and (b) Axial load – midspan strains of GFRP SIP form (top and bottom fibre).
Stub-walls
The measured axial strengths of specimens SA, SB and SC (Figure 3(e)) are 35.1, 40 and 37.2 MPa, respectively, with an average compressive strength of 37.4 MPa, which is similar to the average cylinder strength of 37 MPa. These results suggest that no distinction exists between the two configurations and also no confinement effect on concrete strength. Later, however, results of the full panels will show that on the compression side, some longitudinal strains approached −6000 micro-strains, which suggests partial confinement.
The objective of testing these short stubs was also to calculate the pure axial capacity of the entire wall cross-section, in order to establish the axial load-bending interaction diagram of this wall. This load was calculated assuming a uniform compressive strength of 37.4 MPa over the entire cross-section (616 × 150 mm), resulting in a maximum axial load capacity of 3470 kN.
Failure mode
Failure of the wall stubs was due to longitudinal splitting cracks that developed at the weak plane between the flanges of the GFRP ribs and the concrete core.
Wall panel behaviour in flexure
Effect of GFRP SIP surface treatment
Figure 5(a) compares the load-deflection responses of specimens FX-1 (untreated) and FX-3 (treated) while Tables 3 and 4 present a summary of the test results at cracking and at ultimate, respectively. The cracking loads of FX-1 and FX-3 were 15.3 and 20.3 kN, respectively, while the ultimate loads were 162.1 kN and 208.1 kN, respectively. In both cases, approximately 30% higher loads are achieved as a result of GFRP surface treatment which enabled better composite action.
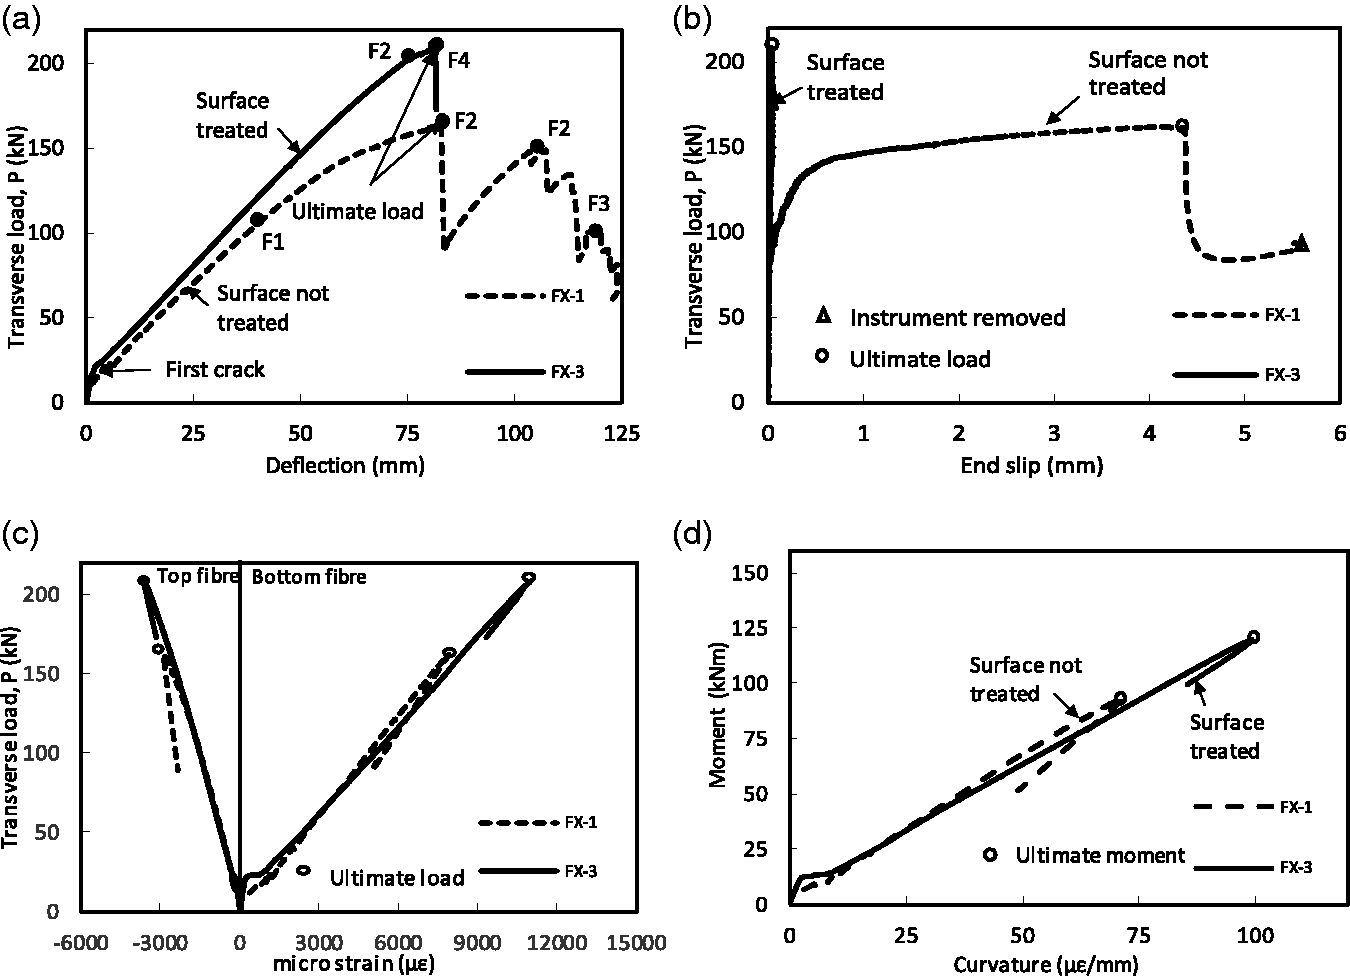
Effect of surface treatment on flexural behavior: a) Transverse load - midspan deflection; b) Transverse load - total relative end slip; c) Transverse load - midspan strains of GFRP SIP form (top and bottom fibre); and d) Midspan moment - curvature;.
Initial cracking.
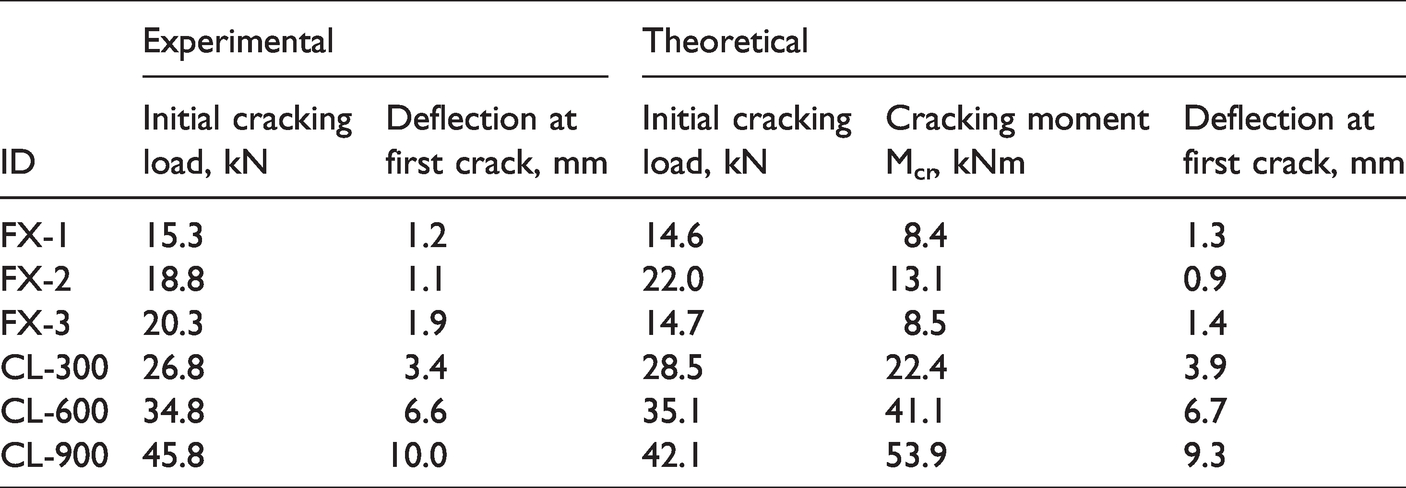
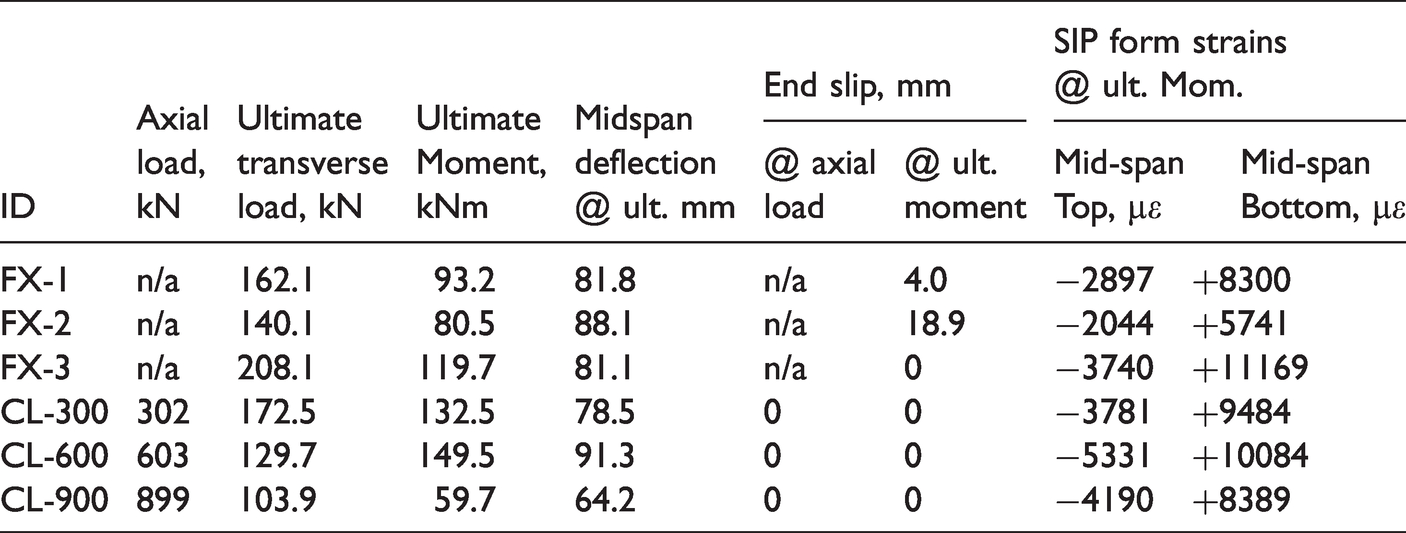
Summary of test results at ultimate.
A linear load-deflection response was observed for FX-1 up to approximately 100 kN when the slip of the GFRP form was more noticeable (Figure 5(b)). As a result of the bond loss, the contribution of the GFRP form to the overall structural strength of the wall was gradually dissipated, and eventually concrete and the GFRP forms behaved as two non-composite elements. FX-3, on the other hand, experienced full composite behaviour up to ultimate and no signs of slip were observed (Figure 5(b)). Although similar deflections were measured at ultimate moments, 82 mm and 81 mm for FX-1 and FX-3, respectively, FX-1 experienced lower stiffness and showed a more gradual loss of load than FX-3 (Figure 5(a)).
Figure 5(c) shows the load-GFRP longitudinal strain responses, which were very similar for FX-1 and FX-3, except for ultimate values. The maximum compressive strains (top fibre) at ultimate were −2897 and −3740 micro-strains for FX-1 and FX-3, respectively, representing 17 and 22% of the ultimate values (Figure 2(a)). The maximum tensile strains of FX-1 and FX-3 were +8300 and +11169 micro-strains, respectively, representing 33 and 45% of the ultimate values (Figure 2(a)). Because of concrete cracking on the tension side, neutral axis shifts away from mid-thickness towards the extreme compression side, leading to higher values of tensile strains than compressive strains.
Effect of wall thickness
The effect of reinforcement ratio reflected by the wall thickness was investigated by comparing FX-1 (150 mm thick) and FX-2 (200 mm thick), both were not surface treated. The two specimens have flexural tension (or compression) reinforcement ratios of 4.2 and 3.16%, respectively. Figure 6(a) to (d) compare the load-deflection, load-slip, load-strain and moment-curvature responses of the specimens. The curvature has been calculated as the slope of the linear strain profile over the thickness of the panel, established from strain gauge measurements on the two extreme GFRP surfaces. To assess the effect of reinforcement ratio independently from the geometric variation, the normalized moment-curvature responses are compared in Figure 6(e). Because the two specimens were fabricated from two different concrete batches with compressive strengths of 37 and 28.3 MPa for FX-1 and FX-3, respectively, the moment-curvature responses were also normalized with respect to concrete strength in Figure 6(e).
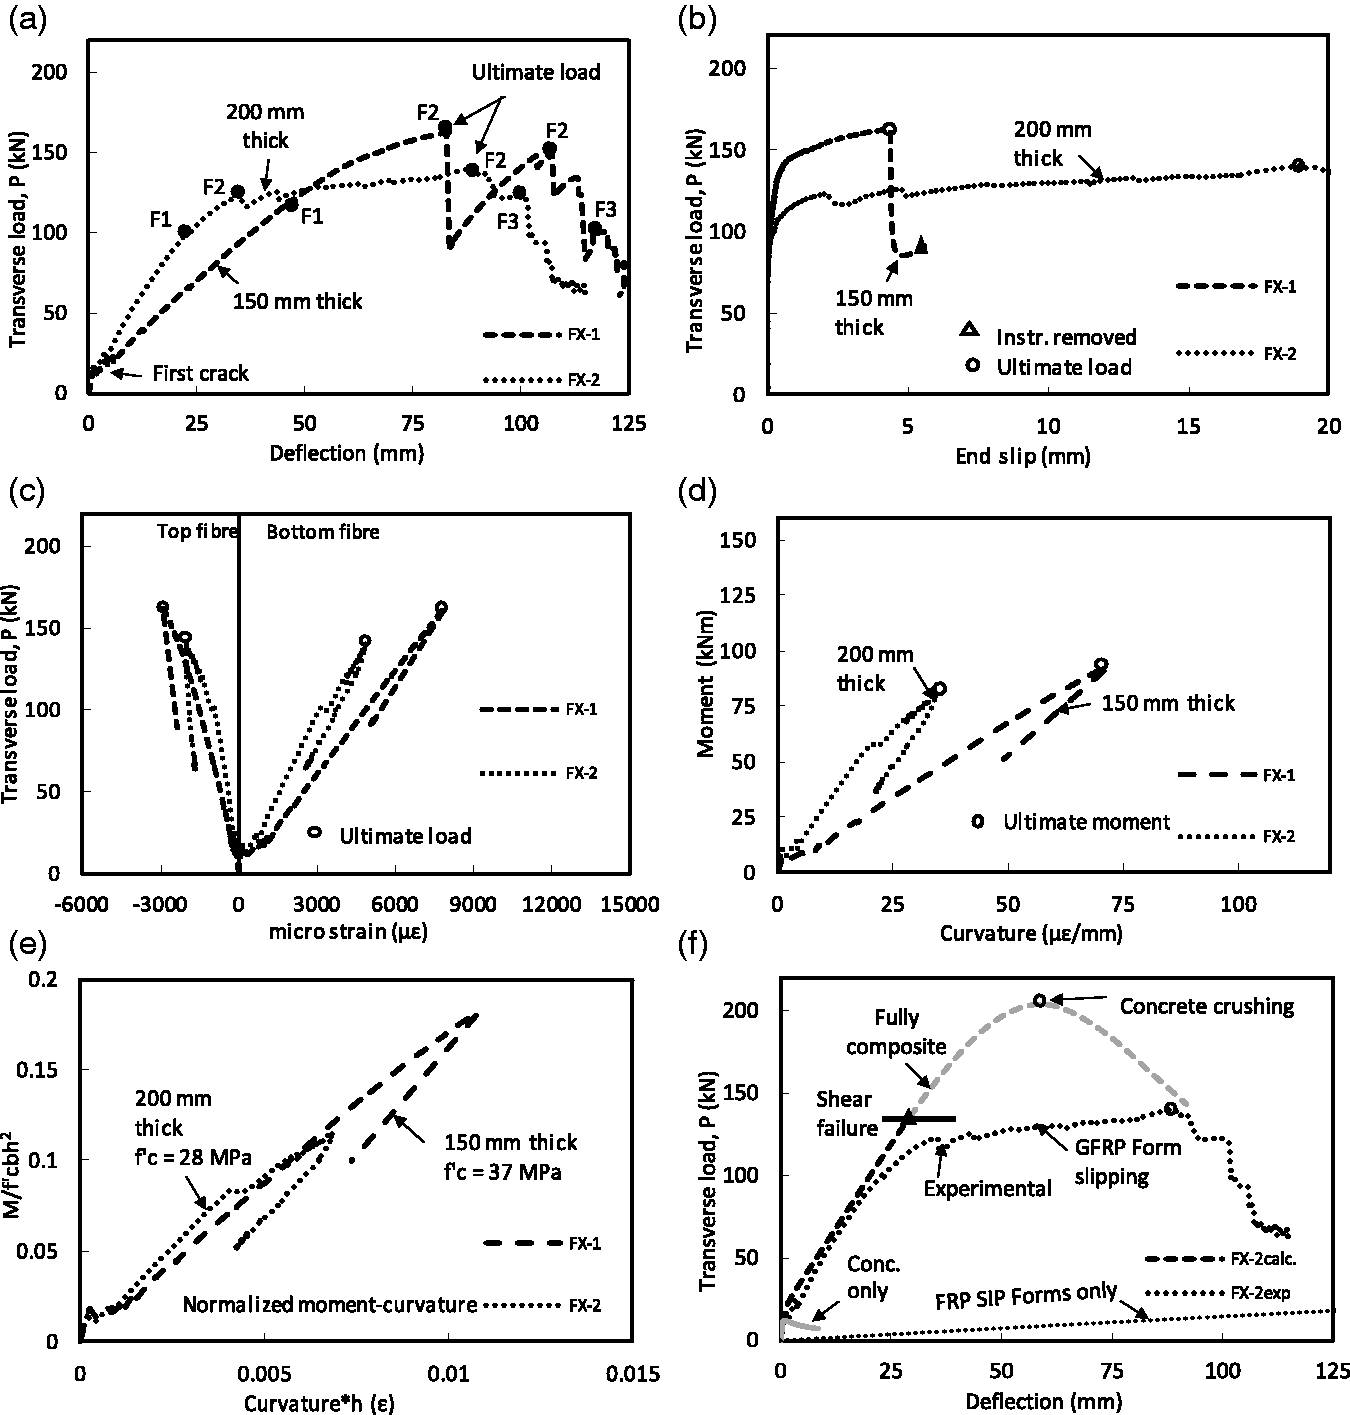
Effect of concrete thickness on flexural behavior: a) Transverse load - midspan deflection; b) Transverse load - total relative end slip; c) Transverse load - midspan strains of GFRP SIP form (top and bottom fibre); d) Mid-span moment - curvature; e) Normalized moment-curvature; and f) Transverse load - midspan deflection (experimental vs theoretical);.
Figure 6(a) and (d) show that following initial cracking, FX-2 showed an apparent higher stiffness than FX-1 because of the larger thickness, but this effect diminishes in the normalized response (Figure 6(e)) as the difference in concrete strength compensates for the difference in thickness. The onset of bond failure as evidenced by the onset of slip between GFRP and concrete was observed at a lower load in FX-2 than in FX-1 (Figure 6(b)). Lower bond strength can be attributed to weaker concrete strength, and/or sensitivities to handling and craning. Ultimately failure occurred in FX-2 at a 38% lower normalized strength than FX-1 (Figure 6(e)), or 14% lower actual load (Figure 6(a) and (d)), and at a much larger end slip of nearly 20 mm compared to 5 mm in FX-1 (Figure 6(b)). The strains at the ultimate moment were −2897 and −2044 at the extreme top fibre whereas the bottom tensile strains were +8300 and +5741 for FX-1 and FX-2, respectively (Figure 6(c)). The lower strains are attributed to the increased slip in FX-2.
To better understand the response of specimen FX-2, a theoretical prediction of its response was carried out for two scenarios, an upper bound assuming a fully composite section and a lower bound assuming a non-composite section. Calculations were conducted using nonlinear cracked section analysis incorporating the principles of equilibrium, strain compatibility and material constitutive relationships through a layer-by-layer approach. Computer program RESPONSE2000 [15] was used to develop the moment-curvature response, which was then used to develop the load-deflection response shown in Figure 6(f) by double integration of the curvature distribution along the span. The fully composite response was developed assuming flexural compression failure of unconfined concrete. For the non-composite case, the responses are plotted separately for the plain concrete core and the two GFRP forms for clarity. For the two GFRP forms, responses were calculated separately then added, where for one form the flat plate was positioned on the compression side and for the other, the flat plate was on the tension side. Moment-curvature responses were developed and moments were added at the same curvatures. This was then converted to a load-deflection response. It can be seen in Figure 6(f) that FX-2 performed very close to a fully composite system up to approximately 100 kN where end slip gradually increased (Figure 6(b)). At this point, the nonlinear response started in FX-2 and the response deviated from the fully composite one. Shear strength was checked using CSA A23.3 [14] and was found to govern failure at 136 kN which agrees well with the 143 kN failure load of FX-2, also by shear.
Failure modes
Figure 7 shows the various failure modes observed in this study. Following initial flexural cracking, specimens FX-1 and FX-2 with untreated surfaces first experienced the onset of slip between GFRP form and concrete (points F1 in Figures 8(a) and shown in 7(a)). Stiffness gradually reduced up to the first diagonal concrete shear crack (F2 in Figures 8(a) and 7(b)) which defined the peak load for FX-1. Following the sudden load drop in FX-1, the load was increased until a second diagonal shear crack developed on the opposite side at lower peak load (second F2 in Figure 8(a)), followed by a series of shear cracks. In FX-2 excessive slip led to a second higher peak load when another diagonal crack occurred (second F2 in Figure 8(a)). In both specimens, the loss of composite action from slip eventually led to a compression failure of the bottom GFRP flanges of the outer ribs (F3 in Figures 8(a) and 7(c)) as the bottom GFRP section had its own neutral axis, experiencing both compression and tension.
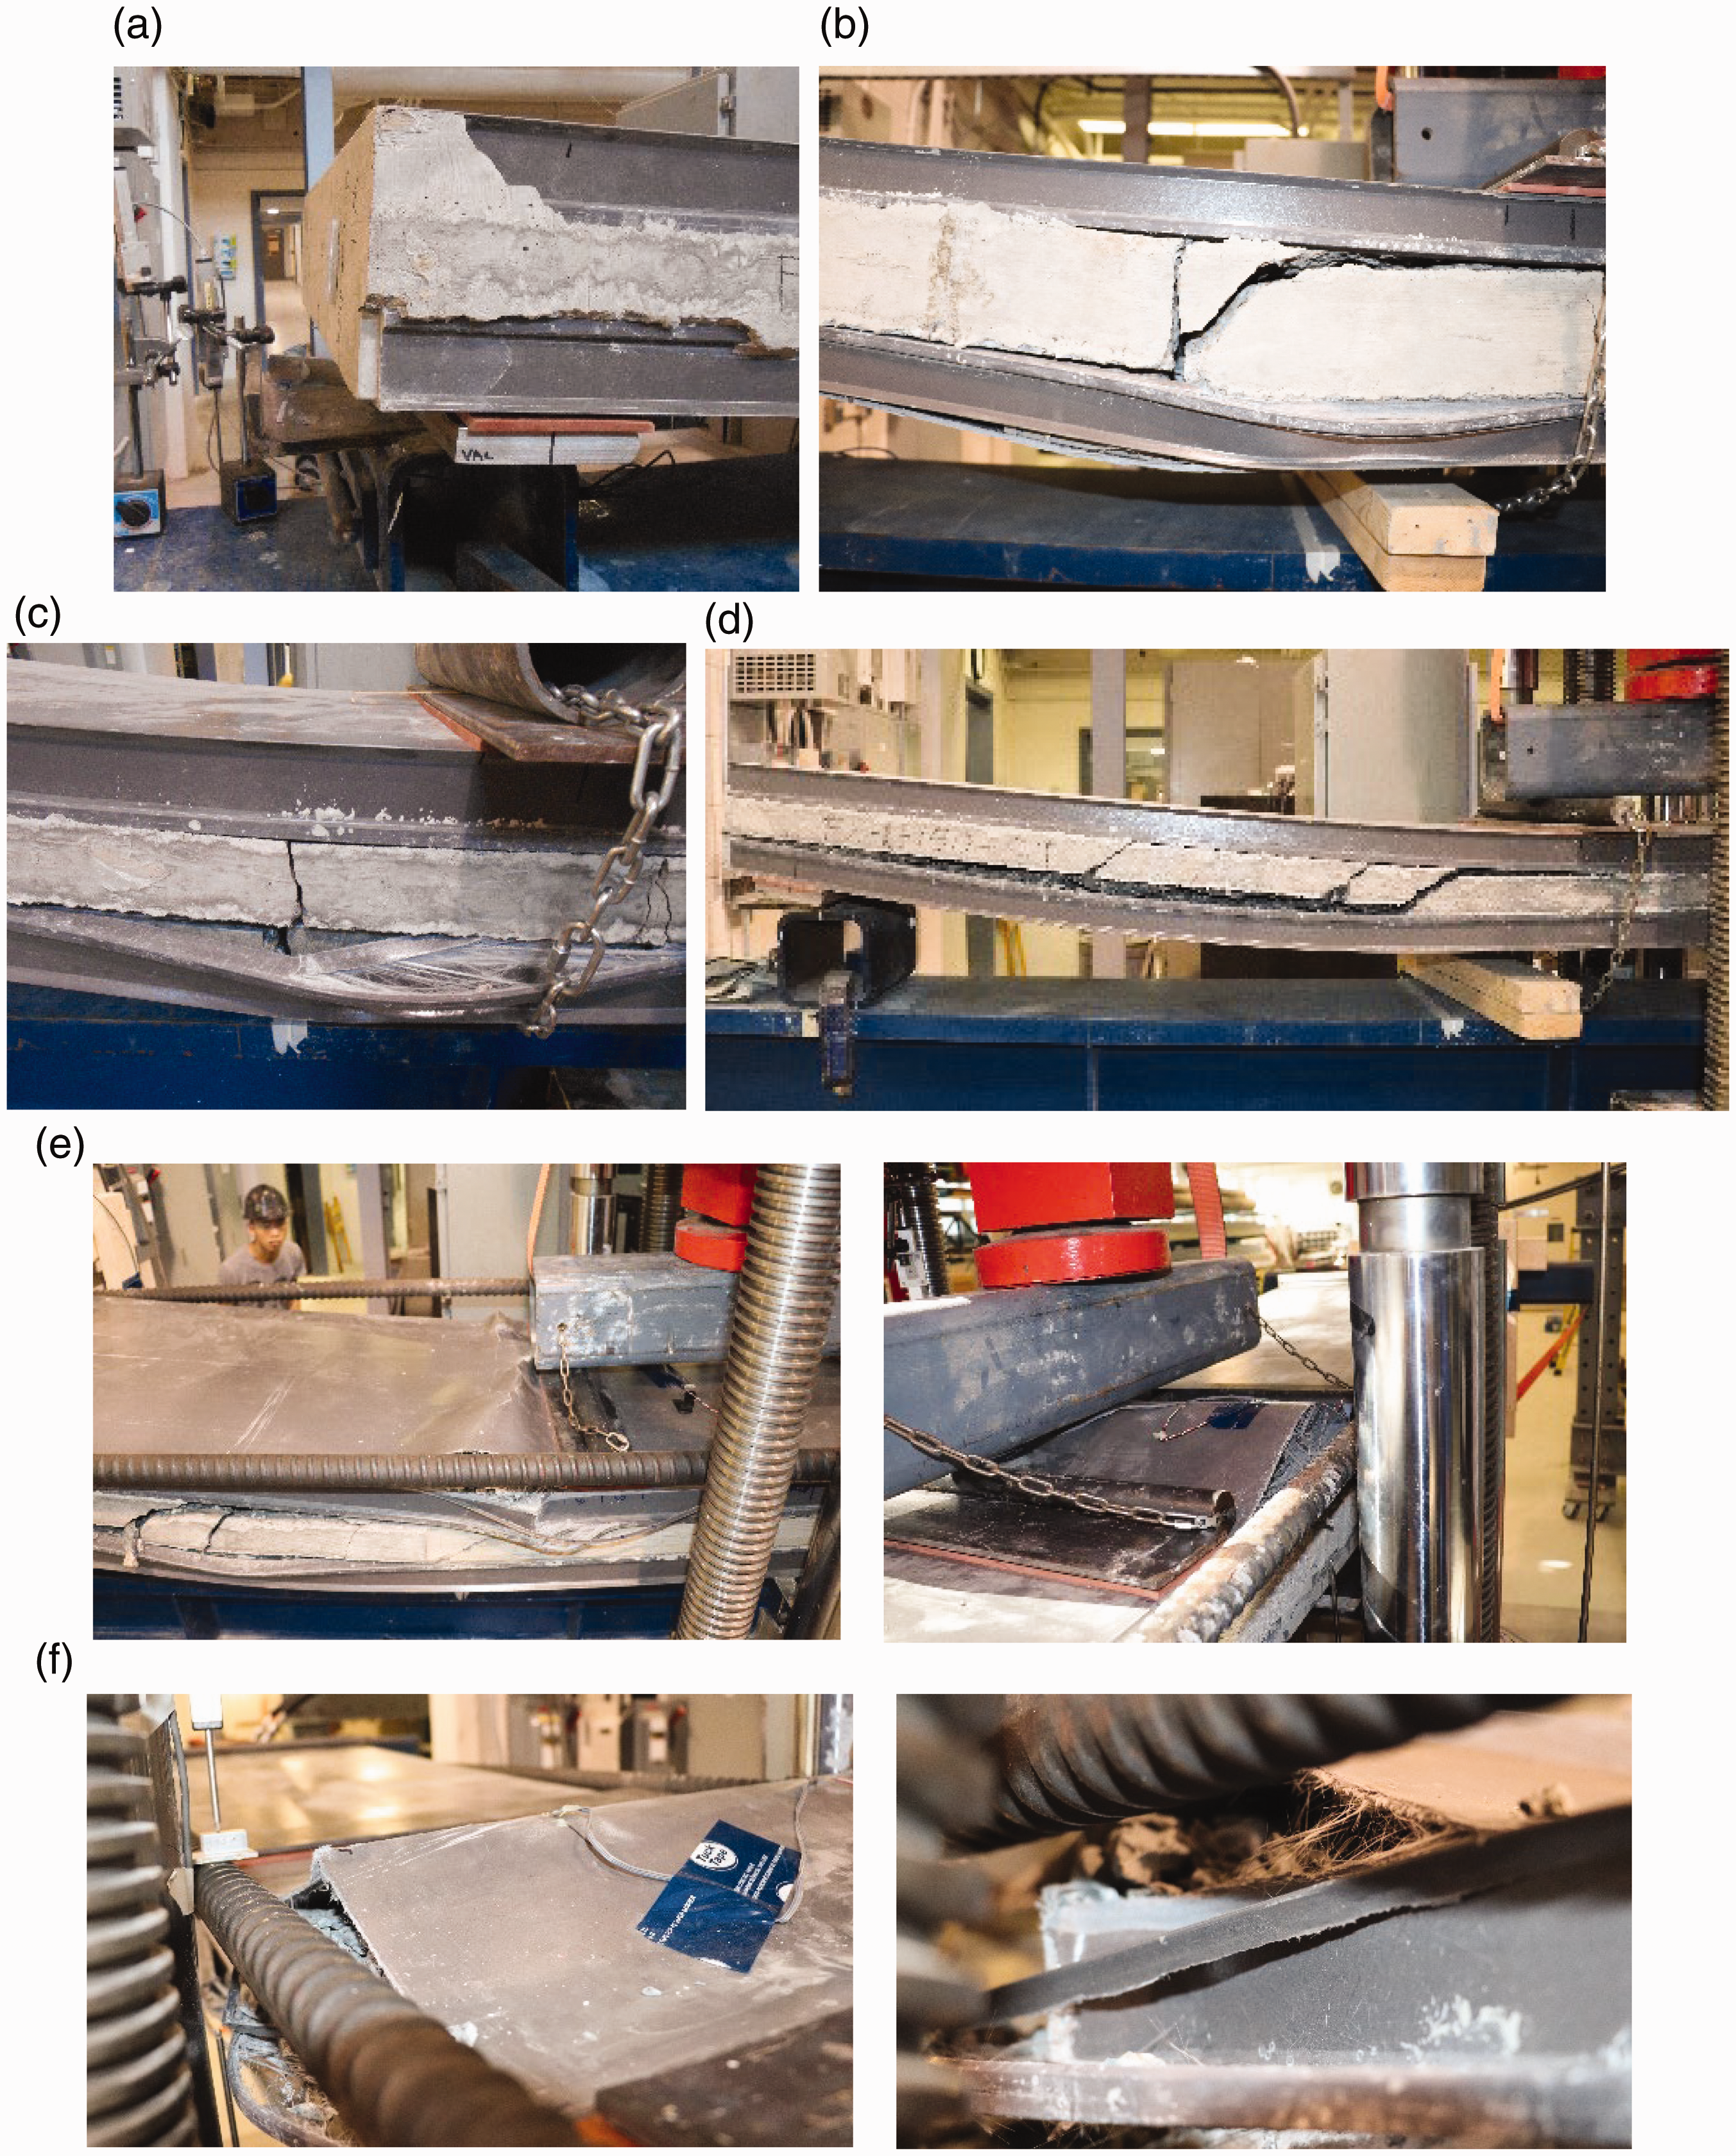
Failure modes: (a) Type F1-slip between SIP form and concrete due to bond failure observed in FX-1 & FX-2; (b) Type F2-diagonal concrete shear cracking observed in all specimens; (c) Type F3-compression failure of bottom SIP form due to local buckling observed in FX-1 & FX-2; (d) Type F4-concrete delamination due to horizontal shear at rib-flange level observed in FX-3, CL-300, CL-600 & CL-900; (e) Type F5-compression failure of top SIP form after separation of plate from embedded ribs observed in CL-300, CL-600 & CL-900; and (f) Type F6-concrete crushing at midspan observed in CL-900.
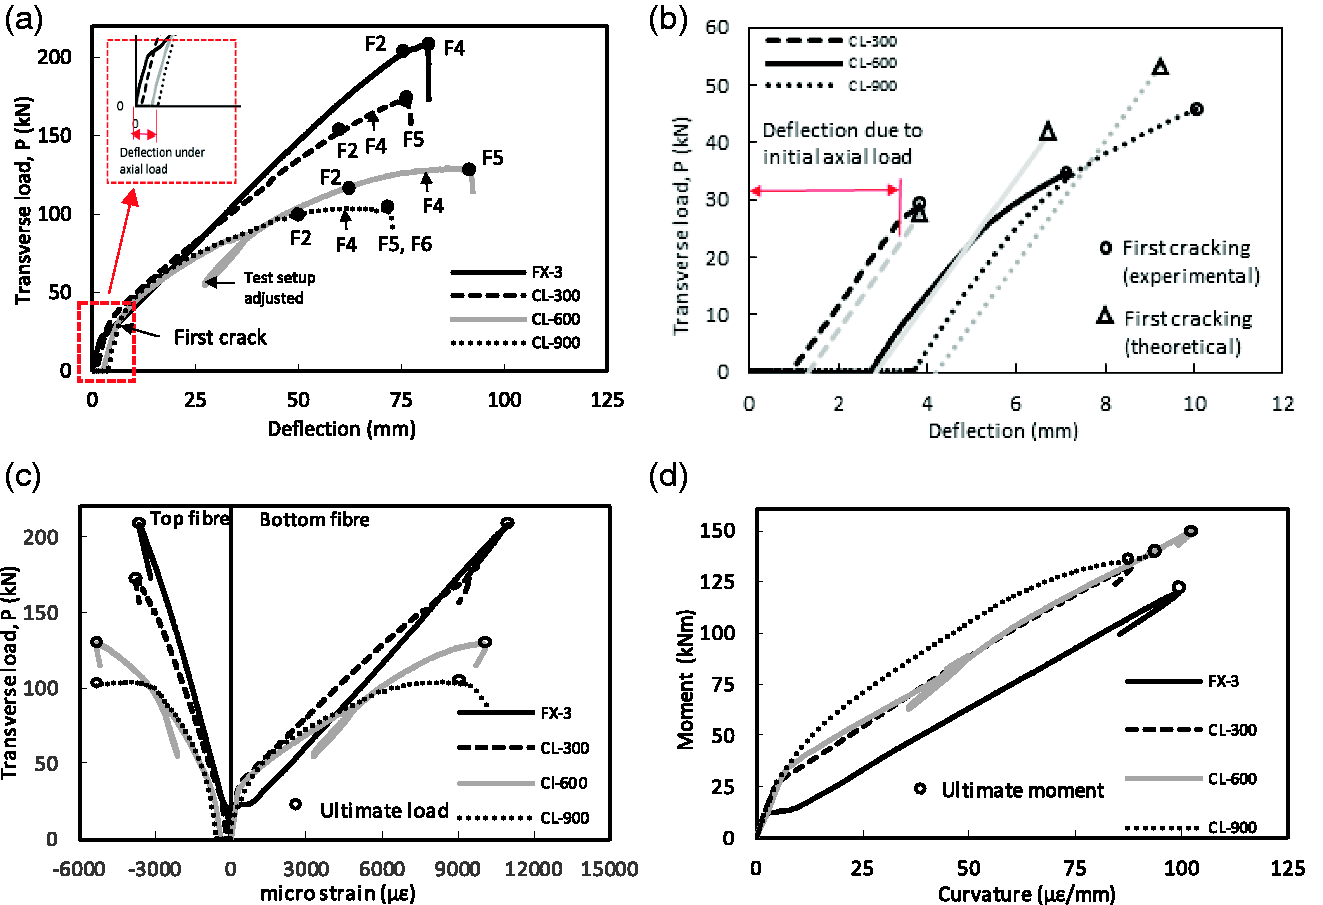
Flexural behavior under fixed axial loads: (a) Transverse load - midspan deflection; (b) Transverse load – midspan deflection up to initial cracking; (c) Transverse load - midspan strains of GFRP SIP form (top and bottom fibre) and (d) Midspan bending moment – curvature.
For FX-3 with treated surface, no slip occurred, and the first event was diagonal shear cracking (F2 in Figure 8(a)). Shortly after, a sudden failure occurred by the delamination of concrete from the bottom GFRP form just above the flanges of the ribs due to horizontal shear (F4 in Figures 8(a) and 7(d)), at which point, the load completely dropped.
Wall panel behaviour under combined loading
Cracking behavior
The transverse load-deflection responses are shown in Figure 8(a) and a close-up, till cracking is shown in Figure 8(b). The figure shows a deflection offset representing deflection occurring under the axial loading phase. These deflections were also predicted using the moment-area method of a beam under constant moment resulting from end eccentricity, and then accounting for second-order bending using an iterative approach. The experimental cracking loads for CL-300, 600 and 900 were 26.8, 31 and 38.1 kN, whereas the theoretical cracking loads were 26.6, 35.1 ad 42.1 kN as calculated using equation (2). When calculating the theoretical cracking load, an iterative process was also used to account for the added bending produced by the axial load as a result of the additional deflection caused by the transverse load. The deflections at the transverse cracking loads were also calculated using the moment-area method based on gross sectional properties, accounting for both transverse and axial loading moments. Figure 8(b) shows the comparison with the experimental results.
Effect of axial loading on flexural response
Figure 4 shows the axial load-transverse deflection and axial load-longitudinal strain responses of the panels while Figure 8 shows the responses under increasing transverse load while axial load is fixed for identical specimens FX-3, CL-300, CL-600 and CL-900. Table 4 shows a summary of the results at ultimate. The effect of axial load can be observed when comparing CL specimens with the control specimen, FX-3. As axial load increased from zero (FX-3) to 300 (CL-300), 600 (CL-600) and then to 900 kN (CL-900), the ultimate transverse load was decreased by 17%, 38%, and by 50%, respectively (Figure 8(a) and Table 4). Although the ultimate transverse load was gradually decreased with axial load, the total midspan moment was in fact increased relative to that of FX-3 by 10% in CL-300, 25% in CL-600 and 15% in CL-900.
Figure 8(c) shows the transverse load-longitudinal strain responses at the exterior surfaces of the GFRP form at midspan. The highest tensile strain in GFRP was observed in FX-3 at +11169 micro-strain, which is 45% of the ultimate tensile capacity of GFRP as indicated earlier. The highest GFRP compressive strains were observed in CL-600 and CL-900 at −5327 and −5281 micro strains, respectively. Based on the strain profiles and the thickness of the GFRP form, it was calculated that concrete strains will be 9% lower than GFRP, which still makes these strains higher than the −3500 crushing strain of concrete. Because of the partial confinement. Indeed, evidence of crushing was observed in CL-900 as will be discussed in failure modes.
Determining total moment at midspan
In order to establish the axial load-bending moment interaction diagram of this wall panel, it is crucial to determine the total bending moment at ultimate (MT) at midspan for the CL specimens. This includes the moment from transverse loading (Mt) and that from axial load (Ma) due to end eccentricity (ee), and midspan deflection from the axial and transverse loading (δ
M
), as given by equations (3) and (4). As explained previously, the location of the axial load (deformed bars) was monitored during the test using LPs. It was noted that as axial load increased and the wall deformed, the axial frame slightly shifted upwards. This increased eccentricity (eb) was accounted for when calculating the moment from the axial load (Ma) (equation (4)). Test results showed that there were no signs of slip between GFRP and concrete, hence a fully composite behaviour was reached. The eccentricity of the axial load was measured from the mid-thickness of the wall (plastic centroid).

Once the total applied moments were determined for each specimen, the moment-curvature responses were developed (Figure 8(d)).
Interaction diagrams
The axial load (N)-bending moment (M) interaction curves of this wall system are presented in Figure 9. Figure 9(a) shows the contribution of axial load due to end eccentricity only
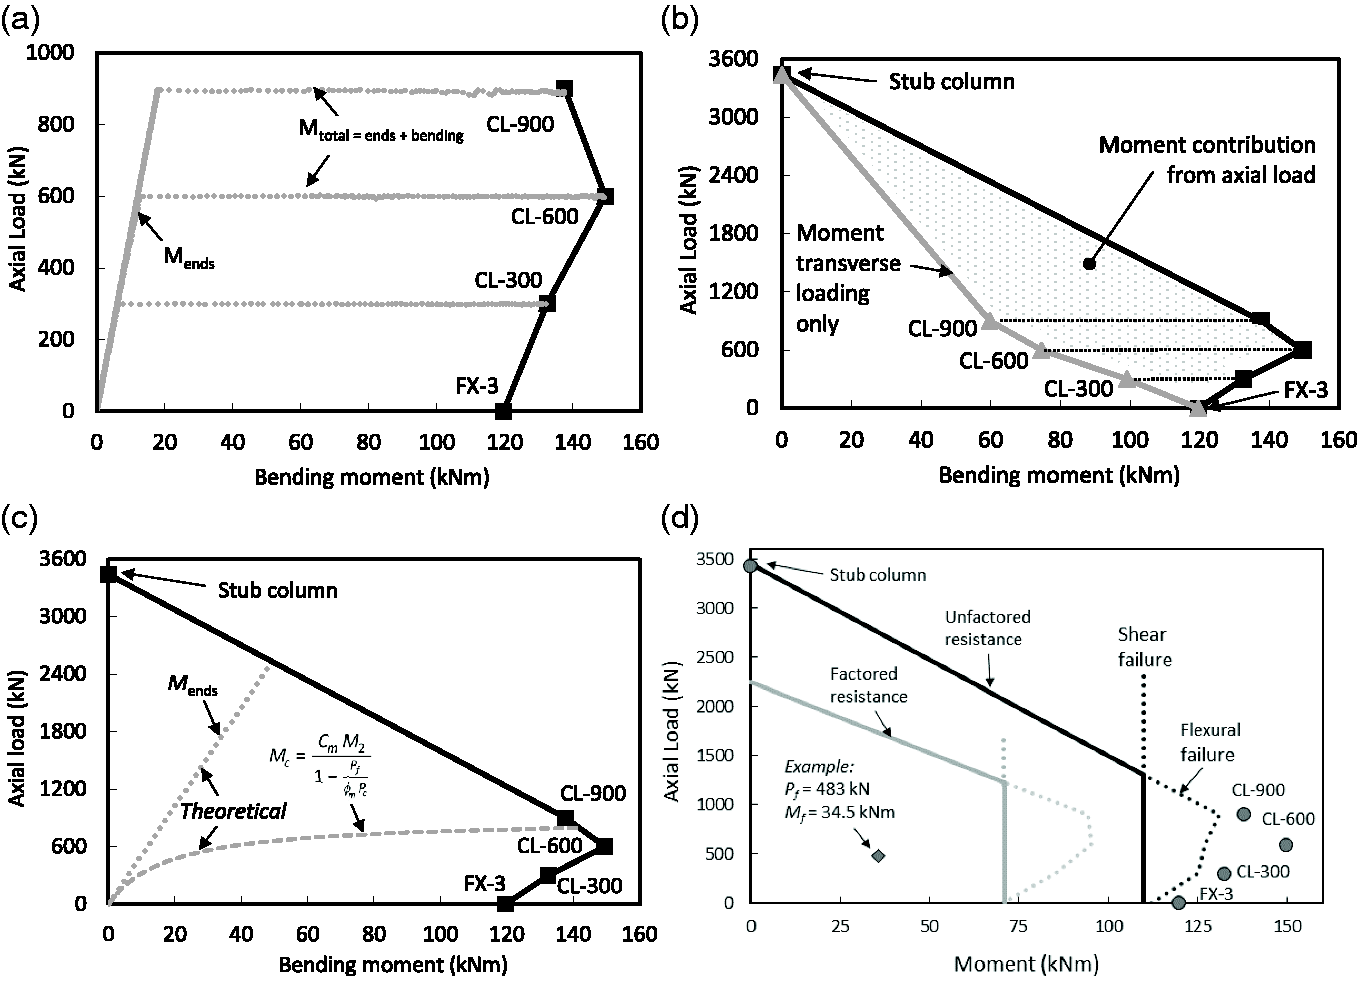
Axial load–bending moment curves: (a) Showing contribution of end eccentricity separate from transverse loading and slenderness effects; (b) Showing the contribution of transverse loading separately, (c) Showing loading paths and (d) Design curves using the proposed model.
Failure modes
Following flexural cracking of CL-300, CL-600 and CL-900, stiffness reduced and eventually diagonal concrete shear cracking occurred (points F2 in Figure 8(a)). The load continued to increase at a reduced stiffness then concrete delamination occurred due to horizontal shear just above flanges of the ribs (points F4 in Figure 8(a) and (d)). Shortly after, the GFRP plate failed in compression due to the separation of the plate from the embedded ribs and buckling outwards (points F5 in Figure 8(a) and (e)). This was the same for all CL specimens, except that it happened in the shear span of CL-300 and CL-600 and within the constant moment region for CL-900. Additionally, concrete crushing was observed in CL-900 (F6 in Figures 8(a) and 7(f)), due to sudden loss of confinement when the GFRP plate failed.
Design approach and case studies
Loading path to failure
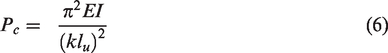
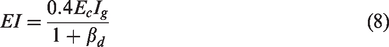
The established interaction diagram is a cross-sectional property. In order to demonstrate the slenderness effect of the wall under an eccentric axial load, the loading path to failure will be established for a case of an axially loaded wall panel with equal end eccentricities. CSA A23.3 [14] requires that compression members be designed for the factored axial load (Pf) and the magnified moment (Mc) for the second-order effects as follows: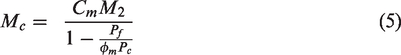

Design example
It is required to design a 3 m high basement wall of a 10 story building that has 3 m high and 150 mm thick walls in each story, supporting 200 mm thick floor slabs spanning 6 m. Floors carry 4.8 kPa live loads and the roof carries 1.2 kPa snow load. The basement wall retains soil with a 14 kN/m3 density. It is required to design the basement wall using the proposed system.
Shear strength (Vc) of concrete must also be checked. In this case, the simplified method of CSA A23.3 was used, as follows:
Conclusions
In this study, a new sandwich wall system was introduced. It comprises ribbed GFRP plates as outer skins serving a stay in pace structural forms filled with concrete, eliminating internal reinforcement. The study explored the effects of surface treatment of the GFRP panels, wall thickness, axial load level and slenderness on flexural strength and behavior. A simple design approach is introduced and a design example is presented. The following conclusions are drawn: Surface treatment of GFRP form using epoxy-bonded 3-6 mm aggregates enhanced composite action and performance significantly. Cracking and ultimate moments were both increased by 30%. No slip occurred in the treated specimens, which also enhanced flexural stiffness. On the other hand, untreated specimens experienced a more gradual loss of strength. Both treated and untreated flexural specimens experienced diagonal concrete shear failure, governing the peak load for the untreated specimen. In the treated specimen, it propagated as a horizontal shear failure just above the ribs, at a slightly higher load. The maximum GFRP tensile strains were 33 and 45% of ultimate, for untreated and treated specimens, respectively, while the maximum compressive strains were 17 and 22% of ultimate. Increasing GFRP tension reinforcement ratio from 3.2 to 4.2%, by controlling concrete thickness, did not particularly increase flexural strength in untreated specimens. In fact 18% reduction occurred because of the nature of failure modes, namely bond and shear of concrete, which are known to be highly variable. All panels tested at different axial loads also experienced a diagonal shear failure that propagated horizontally just above the ribs of the GFRP section. The bending-axial load (M-N) interaction curve was bi-linear. Initially, M increased by 25% as N increased from zero to 17% of the pure axial strength. Then, M reduced linearly to zero at pure N as concrete crushed when the GFRP compression plate separated from the ribs and buckled outwards at midspan. The point of the maximum moment on the (M-N) interaction curve experienced the highest second-order effects due to slenderness, where the second-order moment arising from axial load and deflection was 85% that from transverse loading.
Supplemental Material
sj-pdf-1-jsm-10.1177_10996362211044745 - Supplemental material for Structural performance of sandwich wall made of concrete cast in between GFRP facings
Supplemental material, sj-pdf-1-jsm-10.1177_10996362211044745 for Structural performance of sandwich wall made of concrete cast in between GFRP facings by Valon Sylaj and Amir Fam in Journal of Sandwich Structures & Materials
Footnotes
Data availability statement
Research data is available upon request.
Declaration of conflicting interests
The author(s) declared no potential conflicts of interest with respect to the research, authorship, and/or publication of this article.
Funding
The author(s) disclosed receipt of the following financial support for the research, authorship, and/or publication of this article: The authors acknowledge the financial support provided by the Natural Sciences and Engineering Research Council of Canada (NSERC).
References
Supplementary Material
Please find the following supplemental material available below.
For Open Access articles published under a Creative Commons License, all supplemental material carries the same license as the article it is associated with.
For non-Open Access articles published, all supplemental material carries a non-exclusive license, and permission requests for re-use of supplemental material or any part of supplemental material shall be sent directly to the copyright owner as specified in the copyright notice associated with the article.