
Abstract
Mines, specifically as Anti-Tank (AT) mines are a significant threat for defence vehicles. While approaches such as v-shaped hulls are currently used to deflect the blast products from such threats, such a solution is not always usable when hull standoff is limited. As such the development of a low profile, energy absorbing solution is desirable. One approach that has potential to achieve these requirements are sandwich panels. While sandwich panel cores can be constructed from various materials, one material of particular interest are auxetics. Auxetic are materials that exhibit a negative Poisson’s ratio. This material has potential to be an efficient an impact energy absorber by increasing stiffness at local deformation by gathering mass at the impact location. This study investigates the effectiveness of novel auxetic core infills alongside three other panel types (monolithic, air gap, polymer foam sandwich) against buried charges. 160 grams of PE4 were buried in 100 mm depth and 500 mm stand off the target. Laser and High Speed Video (HSV) system were used to capture the deflection-time profile and load cell sensors were used to record the loading profile received by the panels. Experimental works were compared with numerical model. Explicit model were generated in LSDYNA software as ‘initial impulse mine’ keyword. The result found that the auxetic and foam core panels were effective in reducing peak structural loading and impulse by up to 33% and 34% respectively. Air-filled panels were the most effective to reduce the deflection of the rear of the plate, however variation between capture methods (HSV and Laser system) were reported, while numerical modelling provided comparable plate deflections responses. When normalised against panel weight, the air filled panels were experimentally the most efficient per unit mass system with the auxetics being the least effective.
Introduction
Anti-vehicle (AV) mines and Improvised Explosive Devices (IEDs) have become a feature of modern warfare. Since World War II, they have become the leading cause of vehicle loss [1]. AT mines with typically 6 kg of explosives can cause severe damage to the vehicle and injury or kill its occupants. Bird reported that 22% of the United States (U.S) military losses were due to landmines in World War II [2]. Furthermore, the percentage of fatality in the Korean War, Vietnam War, Persian Gulf operation, and Somalia were 55%, 70%, 59%, and 60%, respectively. NATO (North Atlantic Treaty Organisation) presented the data of the AV mine data in its technical report [3]. The data shows the number of incidents resulting in casualties and fatalities between the years 1998 to 2006. The quantity of accidents and casualties depended on the year and the conflict. The number of incidents increased during such disputes, such as the former Yugoslavia, Afghanistan, and Iraq conflict. During this period, there were approximately 255 casualties and 235 fatalities on more than 190 AV mine incidents all over the world. In a recent conflict, U.S overseas contingency operation of Iraq and Afghanistan, AT mines and IEDs were responsible for nearly half of total 4,153 US troops deaths since 2006 [4].
As IEDs and AT mines continue to improve, so must the protection. The mitigation methods have changed with vehicle generation by designing the improved anti-land mine structures [5]. Whilst rolled homogeneous armour is traditionally used as vehicle armour, it is unsuitable in mass terms to merely increase thickness to protect against larger or more sophisticated mine threats. As such, various alternative approaches have been investigated, including structural alterations, sacrificial plates, the use of energy absorbing materials and alternative materials [5–7].
However, one material yet to gain traction for vehicle mine protection are auxetics. Auxetics are a modern class of materials that have demonstrated Improved mechanical properties such as fracture toughness [8–10], resilience [11], shear resistance [12–16], or even vibration response [17–19] owing to their negative Poisson’s ratio [20]. The negative Poisson’s ratio causes the material thicker when stretched or will shrink towards the centre of compression loading. The shrinkage area becomes denser to increase indentation resistance [21–23]. To date a wide range of materials have been modified to be auxetic including polymers [24], metals [12,25], ceramics [26–28], composites [29,30], and fibres [31,32]. In nature, these materials can be found in black phosphorus [33] or biological tissues [34]. Since their inception, several applications for the defence field have been proposed. In the defence field, auxetics has an opportunity as a shield or barrier by absorbing the impact energy [35–37]. The density enhancement of auxetic makes it possible to take in the explosion shock energy and reduce the barrier damage. The progressive crushing of auxetic core results in densification and concentration of material in the centre. The densification absorbs the impact load and reduce the back-face deflection [38]. More recently the concept of using auxetic materials as an energy absorber in blast impact mitigation have been explored [39,40].
The idea of using a core sandwich material as a blast protector is not new. Several numerical and analytical studies of sandwich structure responses subjected to impulse loading have been conducted [40–46]. The studies have varied materials, panel thickness, or panel configuration. In the earlier work, Schenk et al. [42] explored the stacked folded material core for sandwich configuration. Numerical modelling on quasi-static and dynamic loading has been executed to find the optimum core architecture for maximum for blast mitigation. Imbalzano conducted the numerical analysis of auxetic composite under blast loading [41]. The curvature or chiral form also been investigated to understand how the modified auxetic geometry effects their mechanical properties [37]. The experimental investigation of the blast impact on the monolithic panel structures have been done [47–49]. However, only a few studies have been undertaken using explosive loading due to the potential factors including cost, and accessibility. Moreover, the buried explosive loading is also a rare study until present. Specifically for auxetic materials, Qi et al. [39] compared the numerical and experimental results of sandwich panels under 250 grams of composition B explosive. They examined the areal specific energy absorption (ASEA), and the study indicated the potential of auxetic in the protection of civil and vehicle objects. Moreover, several numerical methods were compared to experimental explosive loading [50]. For the cellular sandwich panel, Holloman et al. [51] investigated the impulse transfer of sand impact, one key observation is that the strong core cellular structures transferred the same impulse as a solid block while the softer core transferred less impulse.
Furthermore, the mine explosion phenomenon shows that the short duration of explosion in comparison to the natural period of the vehicle structure makes the pressure-time loading is not relevant [52,53]. Otherwise, the total impulse of blast impact is a critical indicator of blast effect on the vehicle structure. This indicator can be approximated from the Tremblay equation [54]. Deflection is one of the parameters to measure the damage on the structure and how far mine explosion able to deflect the vehicle structure. Therefore, the objectives of this study are: (i) to conduct the explosion testing of 160 grams of PE-4 explosives, which is relatively larger amount of size than the existed works, buried under the fine building sand (ii) to replicate the observed testing in numerical modelling; (iii) to compare the results between the experimental and numerical simulation; and (iv) to investigate the displacement and impulse response on four different panel configurations, i.e. monolithic, air gap, Styrofoam core and steel-made auxetic sandwich. In addition, the specific energy absorption will be presented to figure out the effectiveness of auxetic structures in absorbing impulse damage.
Finite element modelling
Computational modelling was undertaken using LS-DYNA pre post V4.5 with the explicit solver of R910 double-precision, using a 64 bit Windows 7, 32 GB RAM, i7 2.6 GHz 8 core processor computer. This is an an explicit non-linear dynamic finite element code which is appropriate for handling the dynamics testing and complex contact interaction between the structure sheets. . The steel panels were fully modelled using a Belytschko-Lin-Tsay four-node thin shell element type, due to the simple and reliable shell element [55]. Element size was determined through the mesh convergence test detailed below.
Mesh convergence test
Mesh convergence is required to obtain the optimum element size by considering numerical accuracy and simulation solve time. Several number of ‘impulse mine’ simulations were carried out to determine the appropriate shell element size. Shell element size of 8 mm, 6 mm, 5 mm, 4 mm, and 2.5 mm of auxetic sandwich panels were modelled to investigate the central node displacement and the effects of resolution on the simulation output, as shown in the Figure 1. It indicated that the shell element size affects the modelling result. The use of 8 mm and 6 mm that have a bigger element size than 5 mm and 4 mm produced a higher deflection. 5 and 4 mm element size model is shown to be converged to the value of 12.4 mm. We also considered the running memory allocation to choose the proper element size. Memory allocation is required to process the modelling. Higher number of elements would demand higher memory requirement. Figure 1 indicated that reducing 1 mm size would increase the memory requirement by factor of 2. The running time of these simulations were not the issue because as presented in Figure 1 that the maximum CPU time for 4 mm running element size was only 812 s. The running time was increasing when the element size was reduced. By reducing the element size by 1 mm, the running time of auxetic panel was increasing to 1.1 to 3.6 times and the required memory to finish the job was increasing more than double. Moreover, especially for sandwich structure that requires complex interaction between the layer and numerous elements, thin metal shell element or foam solid element smaller than 5 mm will result in higher computational times. Due to the relatively smaller difference in deflection for smaller elements, the authors deemed the extra computational time unnecessary.
Mesh convergence test detailing relationship between element size, maximum deflection and memory requirement.
Buried charge modelling
We considered that ‘Initial impulse mine’ were suitable in this case due to the accuracy and considered less time consuming than other methods [56]. The buried charge was simulated using ‘initial impulse mine’ keyword [57], and was defined in terms of TNT equivalence; 160 gram mass of PE4 explosive is equivalent to 208 gram of TNT. This rule follows Bogosian et al. study [58]. The ‘initial impulse mine’ function was derived based on Tremblay equation [54]. Figure 2 shows the ‘initial impulse mine’ keyword conditions which is replicates the Tremblay model. Tremblay modified the empirical equation of specific impulse (impulse per unit area) presented by Westine et al. [59]. By integrating the specific impulse, the total impulse was acquired. The equation below determines the total impulse for a quadrangular deflector panel above the land mine
‘Initial Impulse Mine’ model where the explosive charge was modelled as point of charge relative to the depth of burial, standoff distance, and soil density; adapted from [54].
Tremblay’s non-dimensional parameters [54].
Another limitation is a factor 1.8 to the empirical specific impulse. The predicted impulse occurred is between the interval of
Boundary conditions
The boundary condition at the panel edges were set to be fixed and simulated the clamped joint at the edge of the testing panel. Fix joint restrained the panel to move in six degrees of freedoms, three degrees of translational and three degrees of rotational.
Contact in the sandwich panels was required for air gap, foam, and auxetic core. ‘Automatic surface to surface’ contact was applied to those configurations. It defined the contact between the elements of panel and core as a friction contact. This contact type provided the same model according to the real condition where the metal sheet only touched in the core without any adhesion or bonding. Also, ‘automatic single surface’ was also defined to the panel surfaces to prevent the interpenetration between each contacting elements during the deformation.
Damping response also must be considered to obtain the precise structure response. The result of energy dissipation forms damping during structural vibration, which is affected by structural damping (material itself) and Colomb damping on the dry surface of the clamped joint. The conservation approach neglects this interaction between the charge source in a shock wave and the structure [61]. In this study, dissipated energy due to the plastic deformation is far greater than the damping energy. However, other studies show that the damping ratio can overestimate the deflections for lighter structure in low-level blast loads [62]. The effect of the damping ratio has a considered effect on the displacement response [19,63–65]. We have roughly calculated to predict the damping ratio from the overshoot of displacement trace of monolithic panels. The results indicated that the damping ratio ranged between 5–11%. So in this study, the damping ratio coefficient in numerical will be assumed as 5% of critical damping. Figure 3 displays the first mode or critical mode of the monolithic panel occurs at 324 Hz.
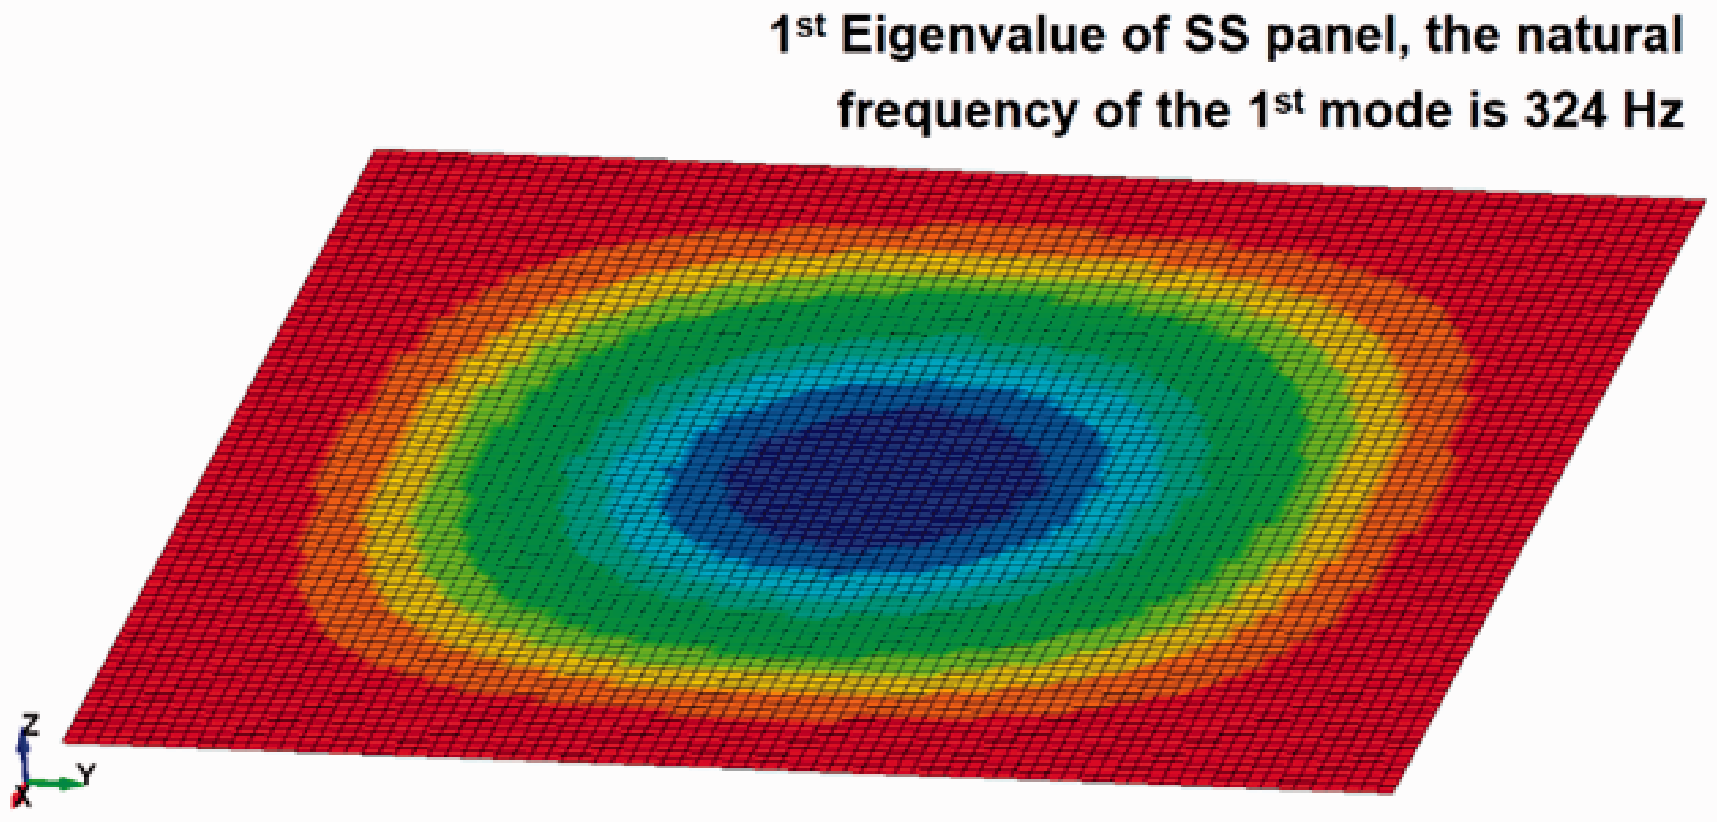
Single steel panel simulated by modal analysis to calculate natural frequency and appropriate dampening ratio.
Material model
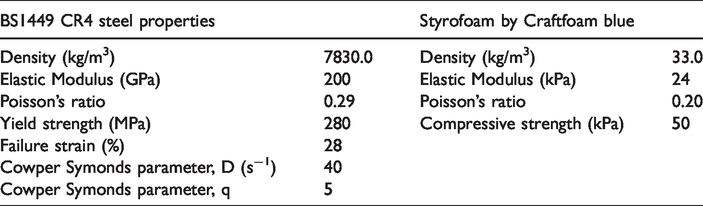
The steel material was modelled as an elasto-plastic material with kinematic hardening. The steel panel was modelled using a plastic kinematic material model that ignored the effect of thermal changes due to the limitation of material data [55]. This model is also used by Jin to model his plate [43]. A plastic kinematic model is acceptable since the lack of stress-strain data. This material model also includes the damage criterion when the failure stress reached. The numerical model included strain rate effects in the model as Cowper Symonds constants of mild steel [66,67]. These constants are applied to the surface panels and auxetics core. Next, the foam material was created as a crushable foam with isotropic properties [68,69]. For crushable foam, strain-stress data was generated by inputting the plasticity points. The foam element is deleted when the strain reaches the failure criterion of elongation at break. The mechanical properties of the utilized mild steel and Styrofoam material were taken from the ASTM material database [70] and technical data from Wickes Ltd. [71], as shown in Table 2.
Steel and foam material properties.
Experimental work
Buried charges
Twelve tests were conducted across four different panel configurations at a fixed standoff distance of 400 mm from the sand surface. A spherical charge of 160 gram PE-4 was buried at a depth of 100 mm, from the centre to the ground surface in the sand, supplied by Wickes, UK (Figure 4). The sand was naturally dried within a laboratory environment for a minimum of seven days and raked twice daily to facilitate uniform drying. Prior to the testing, the sand humidity was recorded using a WT Meter at five different locations, four on the surface, and one at the base, where the charge was placed. A summary of the humidity readings and taken test days are given in Appendix 1.
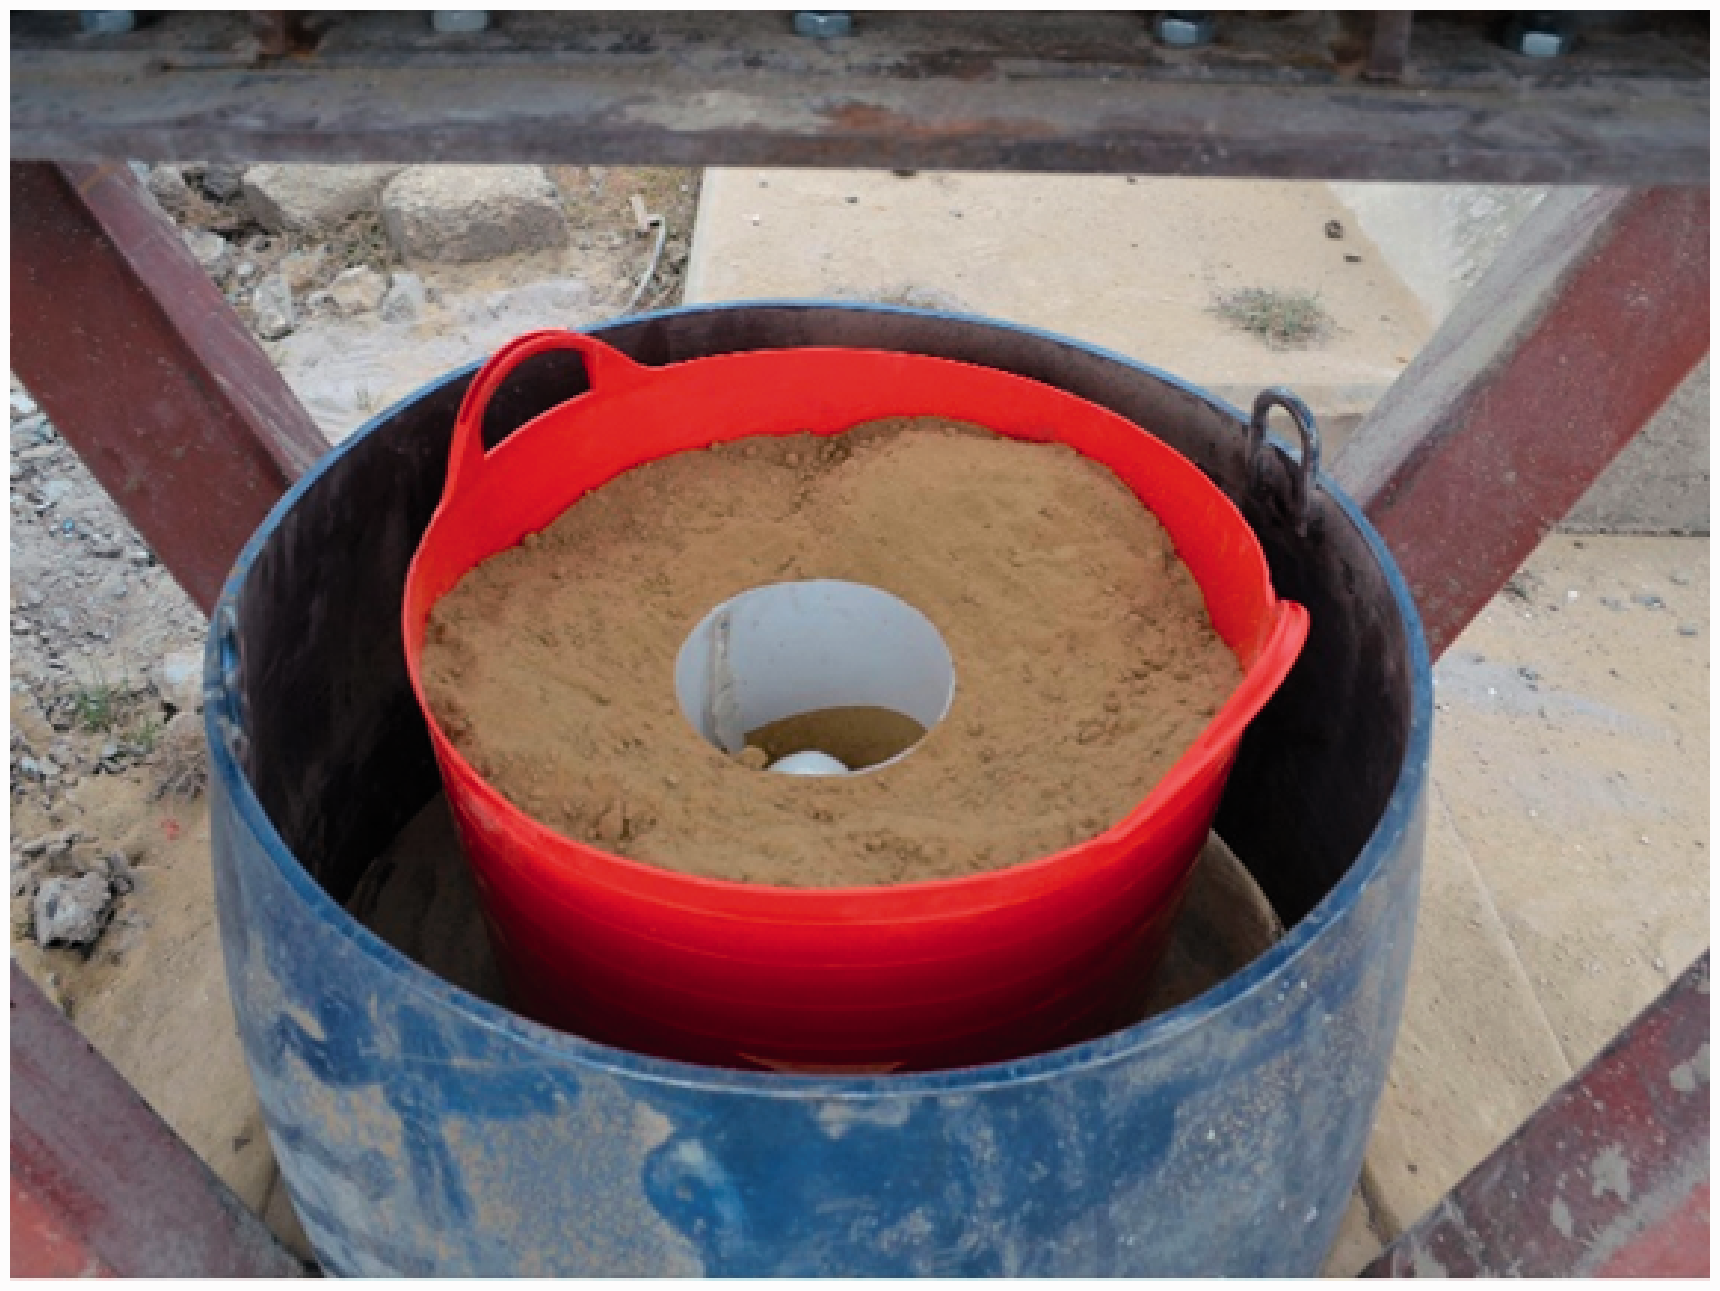
Contained sand with centre location excavated to enable placement of PE4.
Material and panel specifications
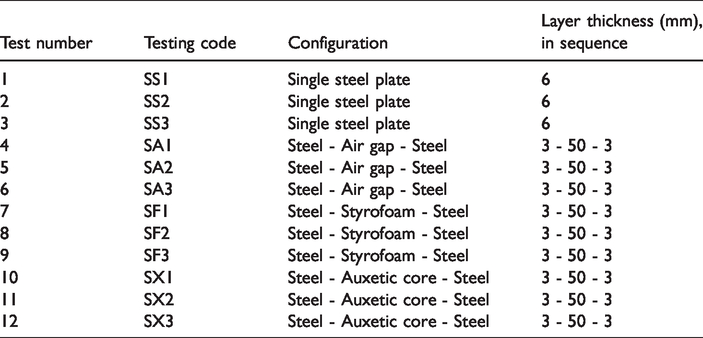
A series of test panels, dimensions 500 mm × 500 mm were manufactured at Cranfield University workshops, as described in Table 3. The flat steel plates were 6 mm in thickness, while the sandwich panels comprised of four components; 2 × 3 mm steel plates, a support frame, and a core. The support frame was manufactured from C-Bar and had external dimensions 500 mm × 500 mm × 50 mm, with interior dimensions of 400 mm × 400 mm, as illustrated in Figure 5. A series of M10 bolt fasteners were placed at regular intervals of distance 112.5 mm, to facilitate the fixing of the plates to the support frame and the experimental test rig.
Testing panel configurations used within this study.
Panel geometry has dimension of 500 mm x 500 mm mild steel panel with the frame width of 50 mm at each edge constraint the sample. The effective area of exploded panel is 400 mm x 400 mm. (a) Auxetic sandwich panel; (b) Foam infills panel; (c) Air infills and monolithic panel.
Three different core materials were investigated: Atmospheric air (air gap), Craftfoam Blue, and an auxetic re-entrant structure. Craftfoam Blue, supplied by PanelSystems [72], is a low-density Polystyrene Foam typically used for model making and prototyping. Metal sheets were supplied of dimensions 600 mm × 600 mm × 50 mm, and cut down to 400 mm × 400 mm × 50 mm using a band saw. The auxetic core was manufactured using a bending method from 1 mm sheet mild steel to a re-entrant bowtie structure (Figure 6). Due to the limitation of bending tools, the 400 mm × 400 mm auxetic core was manufactured as two 200 mm × 400 mm parts and welded to form a single core. Welding was used to join the closed side and each bow tie pieces to create the configuration.
An example of the re-entrant auxetic core in (a) side on and (b) a top down view.
Data acquisitions
Experiments were undertaken on the Explosive Range and Demonstration Area (ERDA) located at the Shrivenham campus of Cranfield University, over a three-day period. A custom-built support rig fixed the panels, which provide rigid sample support that contain the explosives under the sample (Figure 7). The support rig consists of three main components i.e., explosive plates, I-Beam cross sections, and frames. The plates were attached to the blast rig by anchoring the corners to the underbelly of the I-beams and sandwiched between two thick pieces of square steel at the top. Located between the plates and test rig at opposite corners were two Piezo-electric Kistler sensors (9061 A 0–200 kN). Load cells took the loading data by changing the deformation of compressed cells during the explosion to the voltage signal. The acquisition data convert the voltage response in the load cells to the Newton unit. Data was captured at a sampling rate of 100 kHz using a Prosig 8012 acquisition system coupled with a charge amplifier. A pre-trigger (triggered above 30 kN) set at 0.1 s was used to ensure event capture. A calibrated hammer equipped with a load cell was used to validate the load cells.
Instrumented blast rig instrument setup at the ERDA.
Plate deflection was measured using two methods: a Keyence LK G507 displacement laser sensor and a high speed Phantom V12 camera. The laser sensor was position centrally above the test panel and had a set working range set at 0 to 100 mm, over a 10 V range. Data were sampled at 10 kHz and triggered by the piezo-electric pre-trigger. The laser signal instrument was installed on the blast rig perpendicularly at the middle point of the panel. The deflection was measured by pointing the laser signal and measuring the change of the laser length. Raw data from the laser signal was processed using point data average method to remove the noise as normalized data.
The High Speed Video (HSV) captured using Phantom V12 camera was located at a distance behind a Pendine block barricade and used a mirror to observe the plate surface at a 540 × 540 pixel resolution at 21,005 FPS (Figure 8(a)). The angle of incidence of the mirror reflection was corrected using the trigonometric relationship. A simple trigonometry concept determined the vertical plate displacement, where theta (θ) was measured to be 34°. For a high-speed camera, due to the perspective view change on the image, the horizontal distance of the white points was used. On the back face of the panels, white spots were marked in a 3×3 grid, spaced 50 mm apart to enable post-experimental displacement tracking using the Phantom Camera Control software (PCC) 2.6. The laser signal was directly aimed at the middle white spot (Figure 8(b)). As part of the tracking process, the PCC software requires a scale calibration to relate pixels to distance. For each video, scale calibration was taken about the horizontal axis, and measured between the centres of two 50 mm apart marks. Once calibrated, a tracking region was set. In all tests, the tracking region was set about the central mark as it remained within view until the detonation products and sand obscured the plate. A comprehensive method of how tracking works within PCC is detailed in [73]. Plate deflection measured using the Keyence LK G507 was measured centrally, and zeroed before each test to mitigate against pre-loading.
(a) Phantom V12 high-speed camera installation to record the central displacement of the panel. The camera captured by reflected the response by the mirror with theta, θ is 34°; (b) The 5 mm apart white spots in 3 x 3 grid is used for V12 high speed camera processing through the PCC software to trace the displacement.
Result and discussion
Negative Poisson’s ratio behaviour
The auxetic core was compressed computationally to determine the bulk Poisson’s ratio as a structural characteristic prior to experimental testing (Figure 9), where the greatest negative Poisson’s ratio (–0.35) was shown to occur at the beginning of compression. At the initial condition, the cross-section of the auxetic panel is shown as a bow-tie structure in perfect shape without welding condition between the cellular walls. This shell element modelling was different from the real condition where the point welding used to join the bow-tie cellular. At 0.20 strain condition, the shrinkage arrangement to the centre direction started to appear. Next on 0.65 strain, the core panel became fully dense in the central region before it expanded and regained to the base material Poisson’s ratio on 0.74 strain.
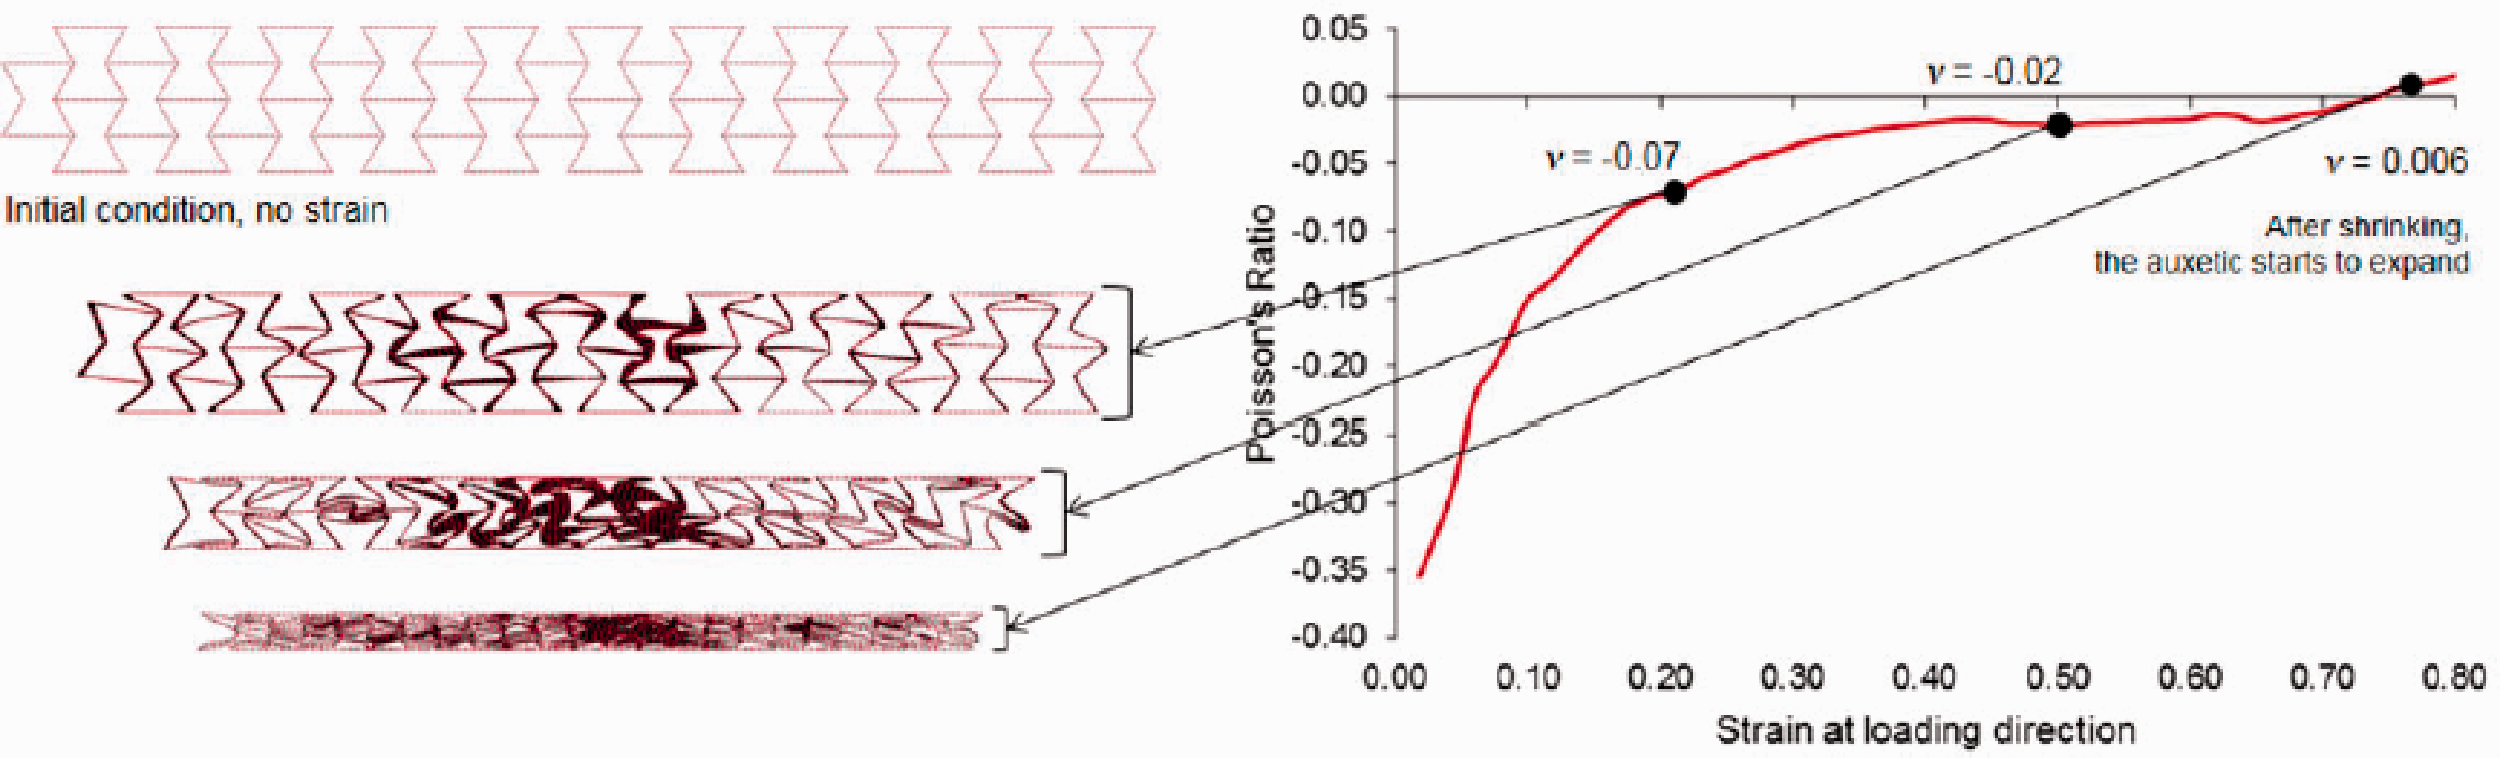
Compression modelling of the auxetic core with structural bulk Poisson’s ratio detailed graphically relative to strain.
Impulse and blast loading
Figure 10 shows the average peak force-time profiles for the different panel configurations, with a summary of individual data given in Table 4. To mitigate experimental noise, a 5-point rolling average filter was applied to the raw force data.
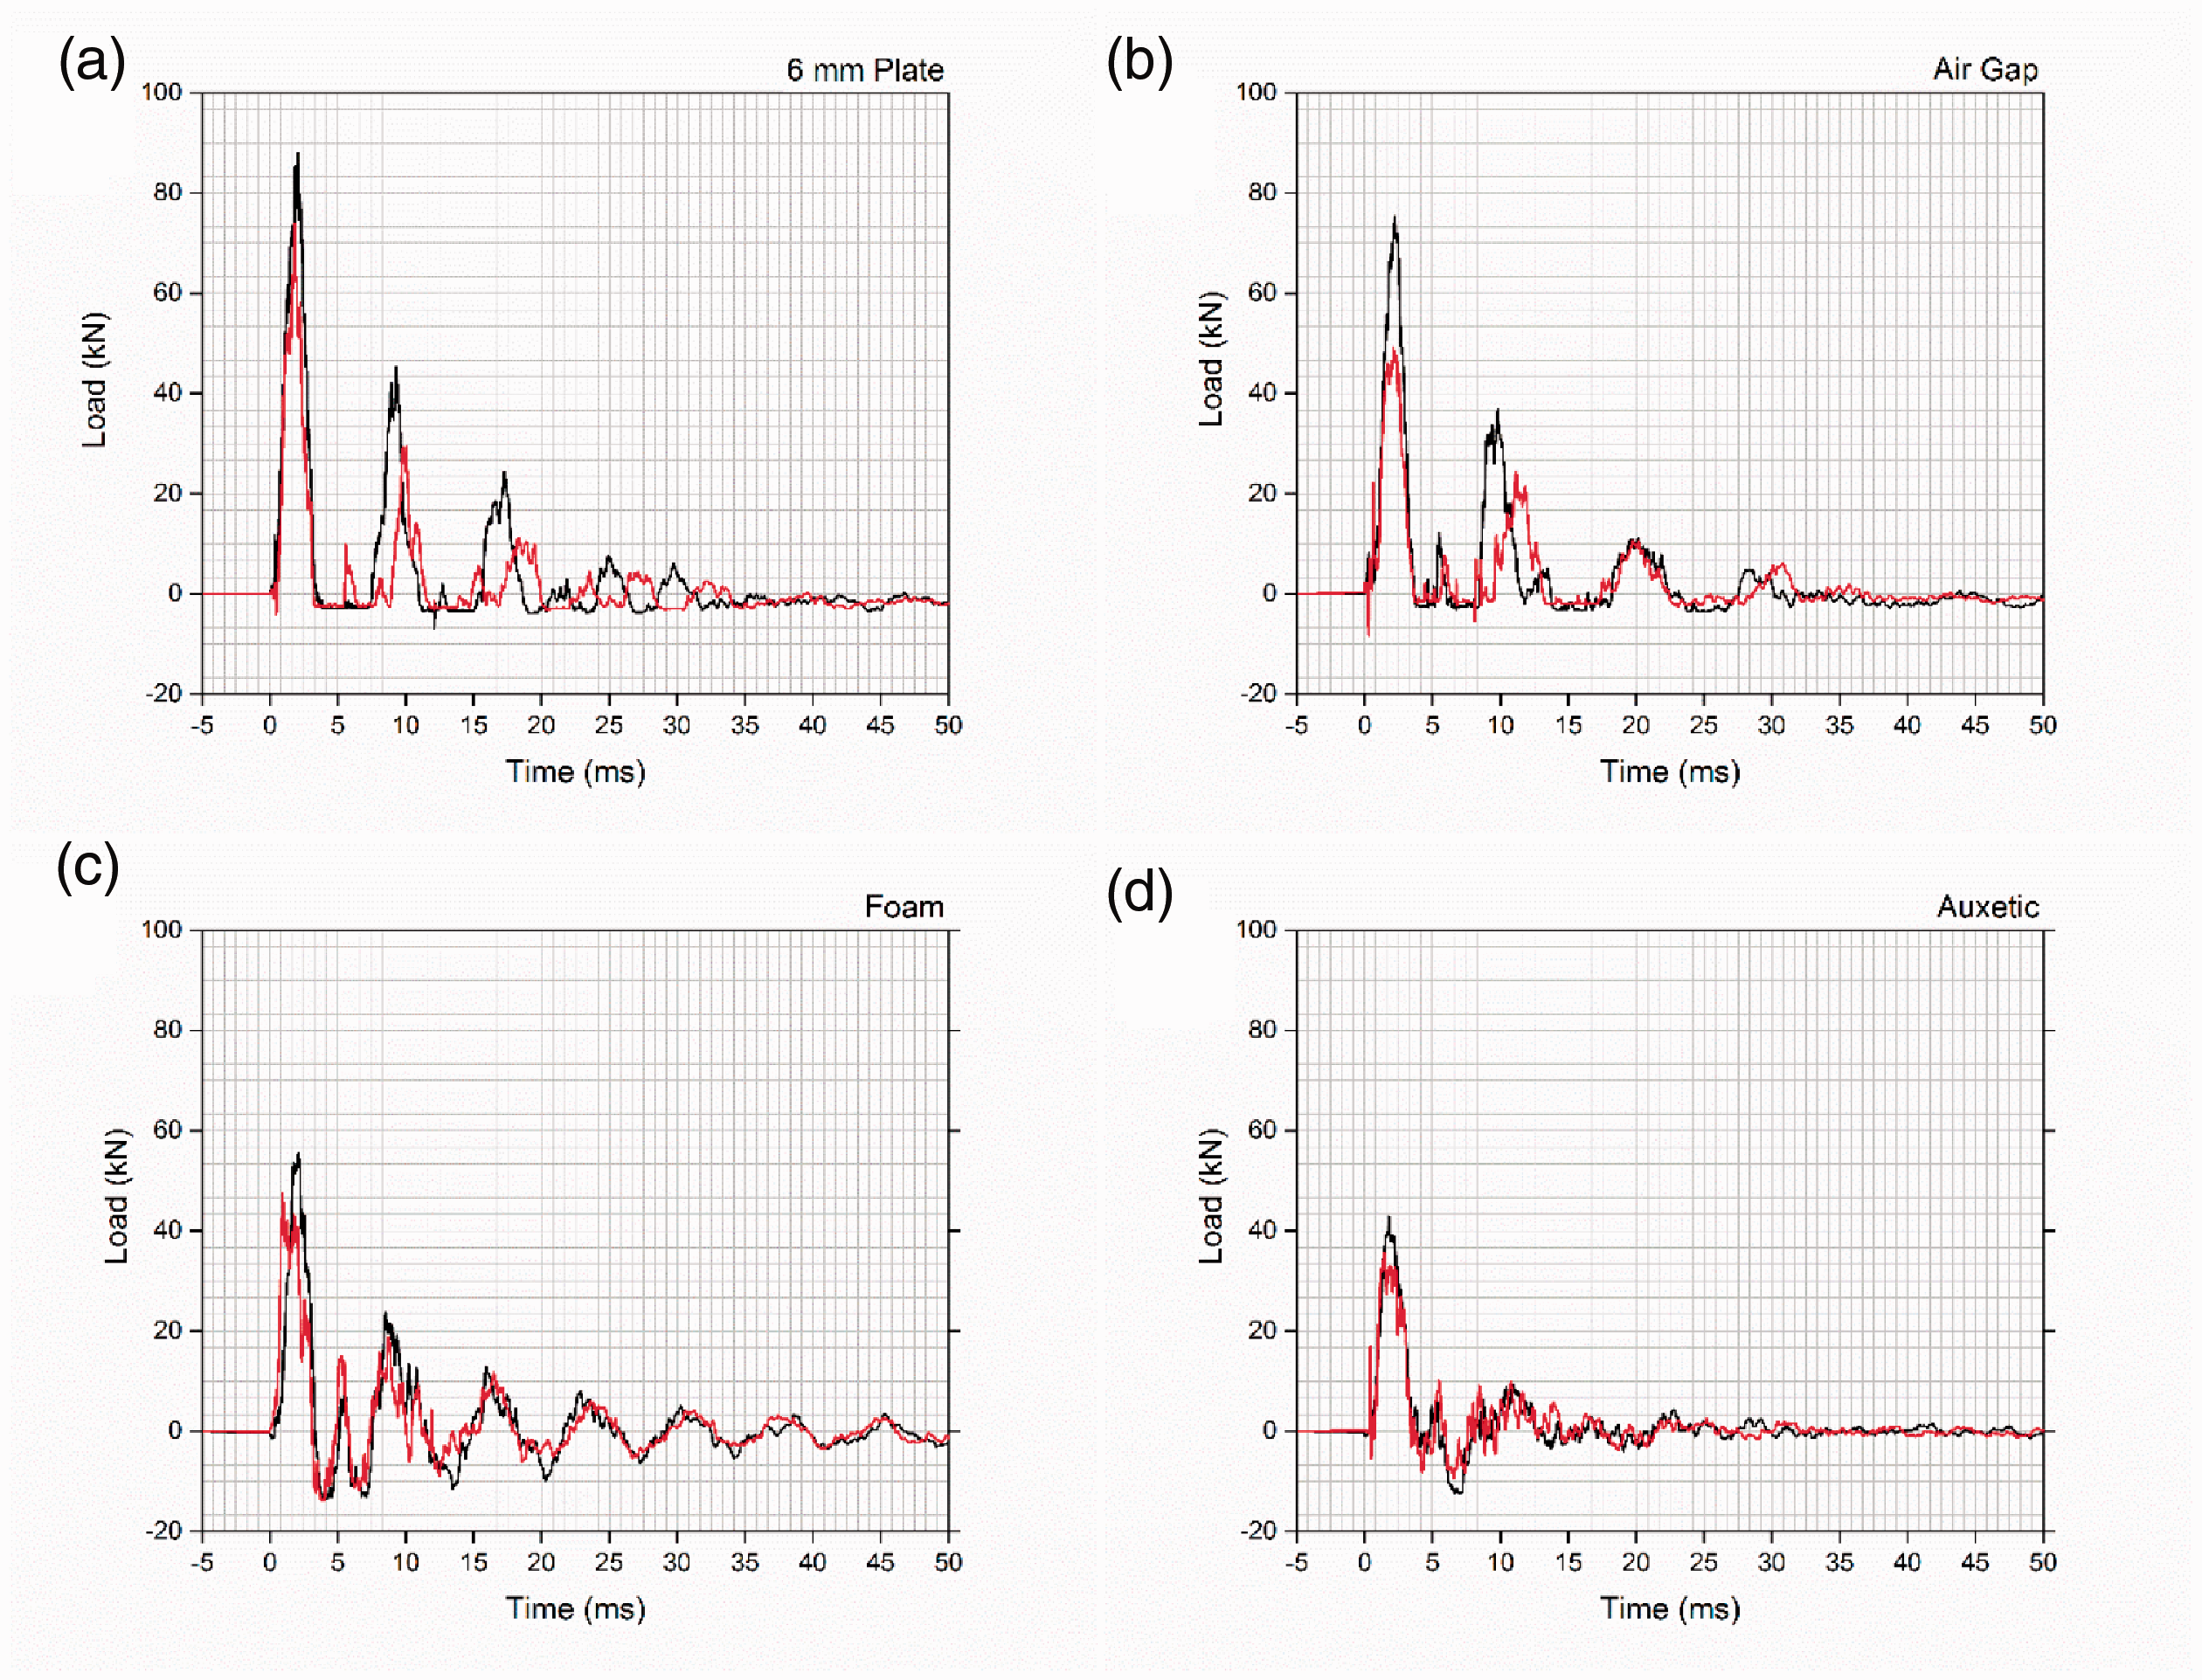
Force-time profiles for (a) 6 mm Plate, (b) Air Filled Panels, (c) Foam filled Panels, and (d) auxetic filled panels, for sensors S/N 389 (▬) and S/N 625 (▬).
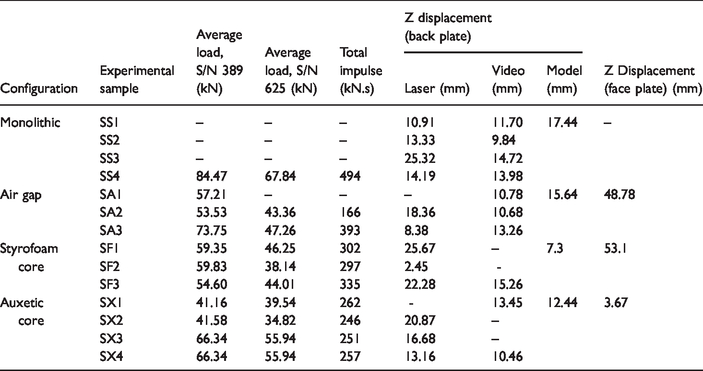
Experimental and numerical results of mean load and central transversal displacement.
All experiments exhibited comparable force-time profiles, where a primary peak loading lasting between 2 to 3 ms in duration before transitioning to a negative load. As time progresses, a series of positive and negative peaks repeat until full attenuation. The 6 mm plate data was the exception as no discernible negative loading data is shown. The absence of negative loading, suggests that either the DAQ system is cutting off data, or sensors were not fixed correctly. Unfortunately, it is difficult to clarify this, as unlike the other profiles, only the data from the 6 mm plate test 4 is presented in Figure 10, as DAQ failure resulted in no usable data being recorded due to an over-ranging error. To ensure this behaviour did not occur in later tests a 10:1 channel reducer was introduced.
Good correlation existed between the two sensors with the exception of the air-filled plates which were particularly noisy. In most tests greater loading was experienced by sensor S/N 389, indicating an irregular loading pattern. There are two potential sources for the irregular loading. One reason could be due to support plate distortion induced from repeated exposure to the blast. This explanation however fails to account for the lack of consistency throughout testing. A more likely explanation is the soil ejecta impacting the plate is either anisotropic in impact location or in geometrical shape. For mediums such as the sand, the loading at any discrete location is dictated by the particle size that impacts the location and its momentum induced from the explosive charge [58]. This coupled with the variation in sand humidity (detailed in Appendix 1) makes for a more likely explanation. Unfortunately due to the location of the high speed camera coupled with the blast products, the ability to observe loading pattern from the ejecta was not observable within this study.
On average the monolithic samples exhibited the greatest peak loading of 84.47 kN, with auxetic samples exhibiting the lowest at 41.16 kN. Generally, all panels were highly variable in similar range, with error variance being approximately 14% for S/N 389 and 11% for S/N 625. Greater consistency was shown for the foam cored panels with error variance approximately 3% and 4% of the mean for S/N 389 and S/N 625 sensors respectively. Assuming the 6 mm plate as the control, both the auxetic and foam infills offer a mean loading and impulse mitigation of 33% and 34% respectively. Alternatively, the air filled panels have the potential to both amplify and mitigate the pressure and impulse experienced.
In a series of tests a low intensity, rapid loading event occurred prior to first peak without bias across panel configurations. Such behaviour has been previously reported by Ramasamy et al. [74], and is referred to as the detached shock wave. While this interaction induces a loading effect on the plate, due to acoustic impedance between the sand and air, only a small fraction of the incident shock is transmitted into the air, causing the resultant air shock to have minimal influence on the target structure [75]. Instead, the initial peak loading is caused by the soil ejecta. According to Deshpande et al. [76] and Børvik [77] up to two thirds of the impulse is delivered to a vehicle is from the soil ejecta, with the remaining third delivered by the blast products.
While the fixed conditions of testing coupled with the test data, can allow for the assumption that they are induced by the blast products and soil ejecta, it fails to account for the irregular subsequent data peaks trends such as, the third peaks always being lower than the fourth. It is postulated that this behaviour could be caused by the presence of a reflected wave between the rig and the panel during the loading event. Alternatively, it could be caused by the fluttering or vibration response of the structure induced from the blast impact. The flutter occurred in an oscillation trend between the peaks. Frequencies were calculated from the period between the peaks and were found to be approximately 1282 Hz, 1338 Hz, 1000 Hz, 1420 Hz, for monolithic, air gap, foam, and auxetic respectively. We compared with the numerical analysis and found out that the 6th mode of monolithic damped frequency is 1194 Hz. The numerical result strengthens the argument that it could be a damped oscillation. It is consistent also with dynamics principles where stiffer the panel, higher the frequency mode would be.
When considered in the impulse domain the auxetic panels exhibited the lowest mean impulse while the monolithics exhibited the most (Figure 11). The single 6 mm plates were comparable to the air plates in measured impulse, while the foam infills were more comparable to the auxetic panels. Once again the air-filled panels were highly variable with error variance being approximately 57.43% of the mean, while foam and auxetic panel configurations were fairly consistent with an average error of 6.63% and 2.75% of the mean respectively. Although unclear why the air-filled panels demonstrated such large variation, it is suspected that it is caused by the high pressure experienced at sensor S/N 39 in test SA3. Although the cause of this high pressure is difficult to ascertain, the variance indicates that the soil ejecta that interacts with the plate is either anisotropic in impact location or in geometrical shape. For mediums such as the sand used in this study, the experienced loading at any discrete location is dictated by the particle size at that location and its momentum induced from the explosive charge [78]. This is further supported by the wider literature where soil type and charge shape are reported to be the principle parameters that influence loading [75,79–85]. As such if some part of the soil ejecta impacted directly at the sensor location, a greater loading and subsequent impulse would be recorded. Unfortunately with only two data points (both significantly different), it is difficult to validate this theory.
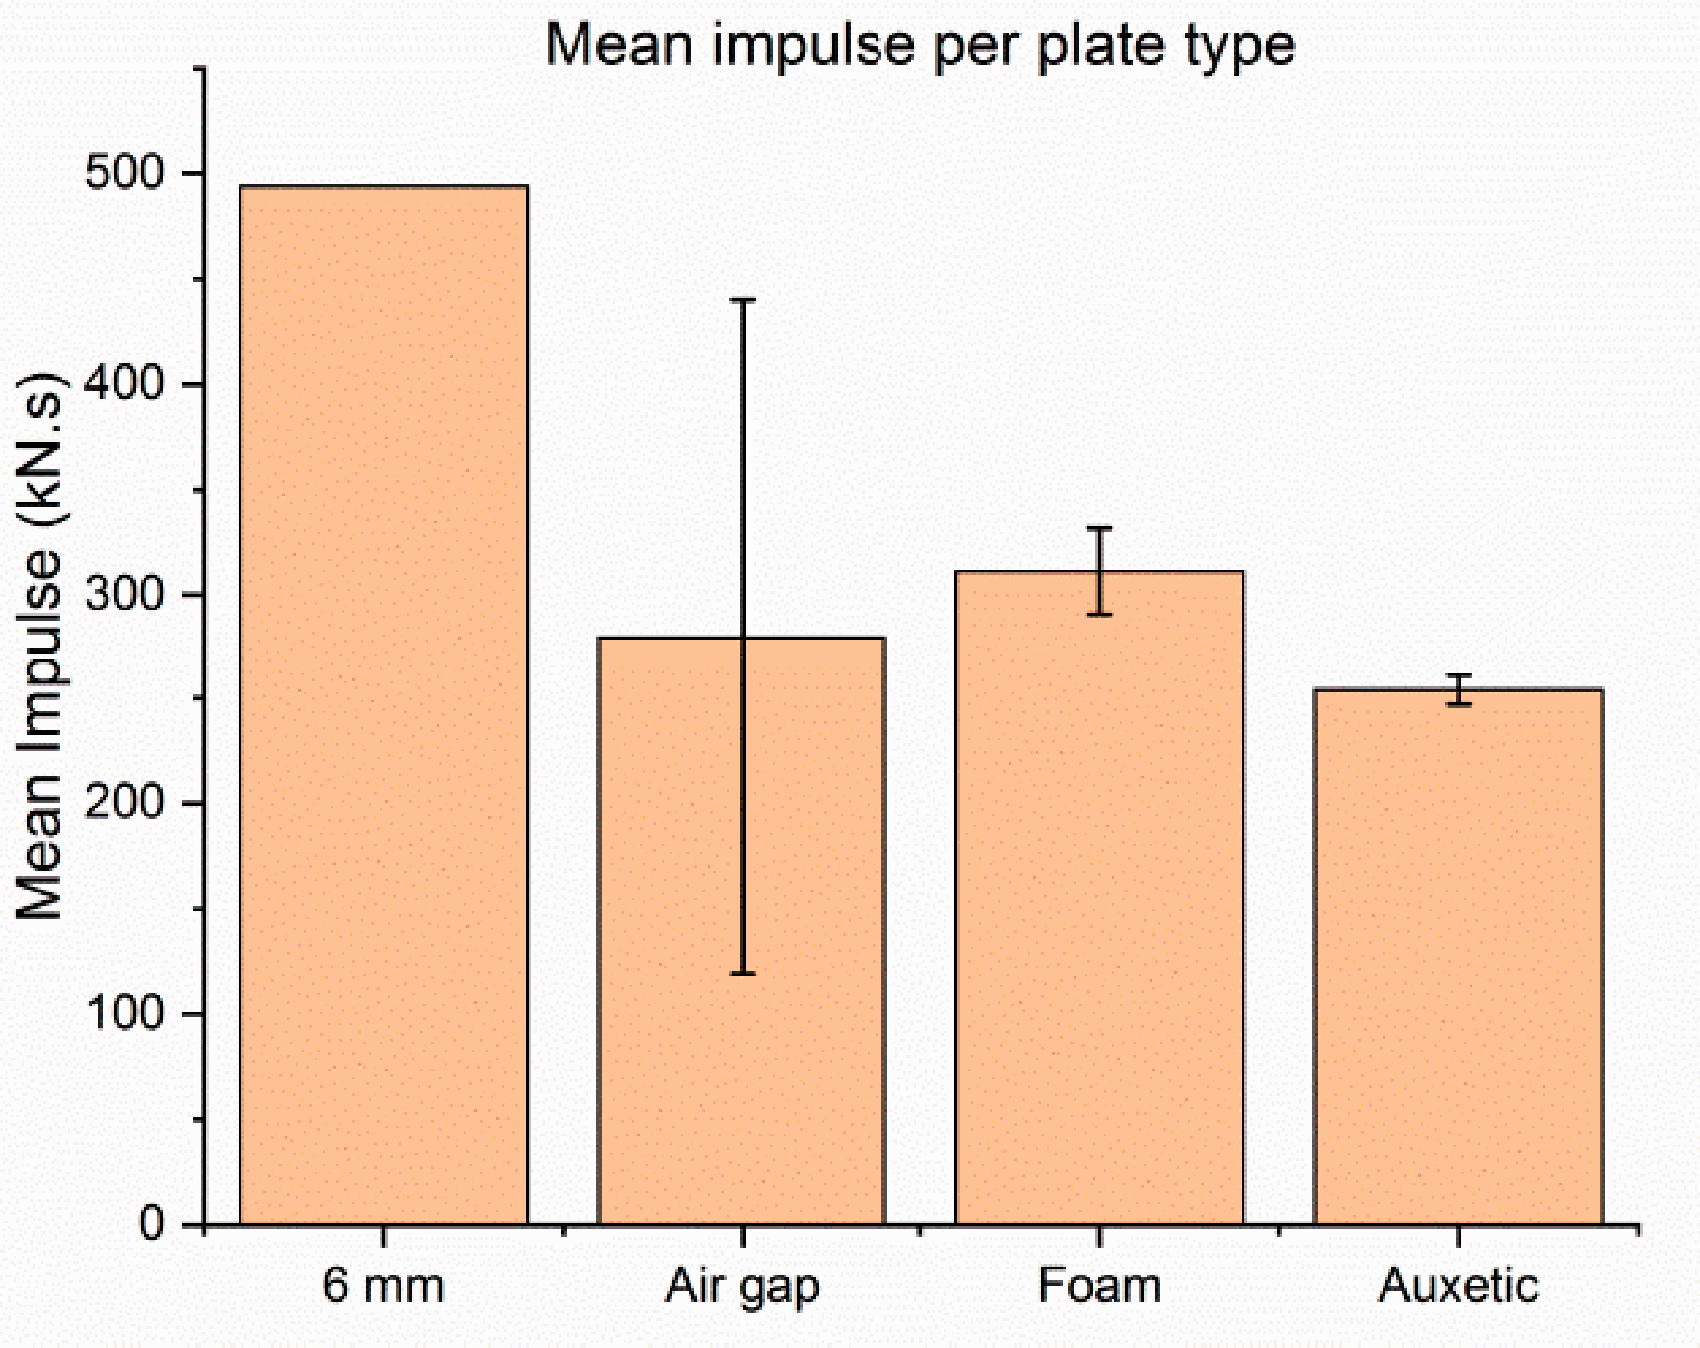
Mean impulse per panel type where errors represent standard deviation.
In this study, the non-dimensional parameters did not fulfil the requirements. All variables were input in the equation and compared both results of total impulse in the MATLAB and LS-DYNA. Both the MATLAB and LS-DYNA models yielded comparable results of 649 and 650 kN.s, respectively. Even though the 15% reduction is a range between the intervals of 1.8 factor, this reduction is caused by the non-fulfilment of the parameter limitations required. However, by scaling down the total impulse in LS-DYNA, the numerical results were expected to show similar deflection compared to the experimental observation.
By scaling down the total impulse in the simulation setup, the simulation showed expected results with similar deflection compared to the experimental observation, as shown in the next sub-section. The mean impulse for all panels, excluding 6 mm was approximately 300 kN.s. Solving Tremblay to calculate the vertical impulse of buried mine [54] using the experimental parameters herein, an impulse of 650 kN.s was produced; a value significantly different than the observed result. It is suspected that the deviation between experimental and calculated value as the parameter criteria did not fulfil the Tremblay function limitation, as detailed in Table 1. In light of this, the mean impulse value for each panel configuration was used in the numerical analysis by scaling the impulse to replicate the actual deflection response.
Deflection response
Figure 12 shows an example of deflection-time profiles recorded by the laser. Noise was removed 5-point rolling average filter and normalized about the zero. Mean maximum deflection data the laser system and HSV is provided in Figure 13.
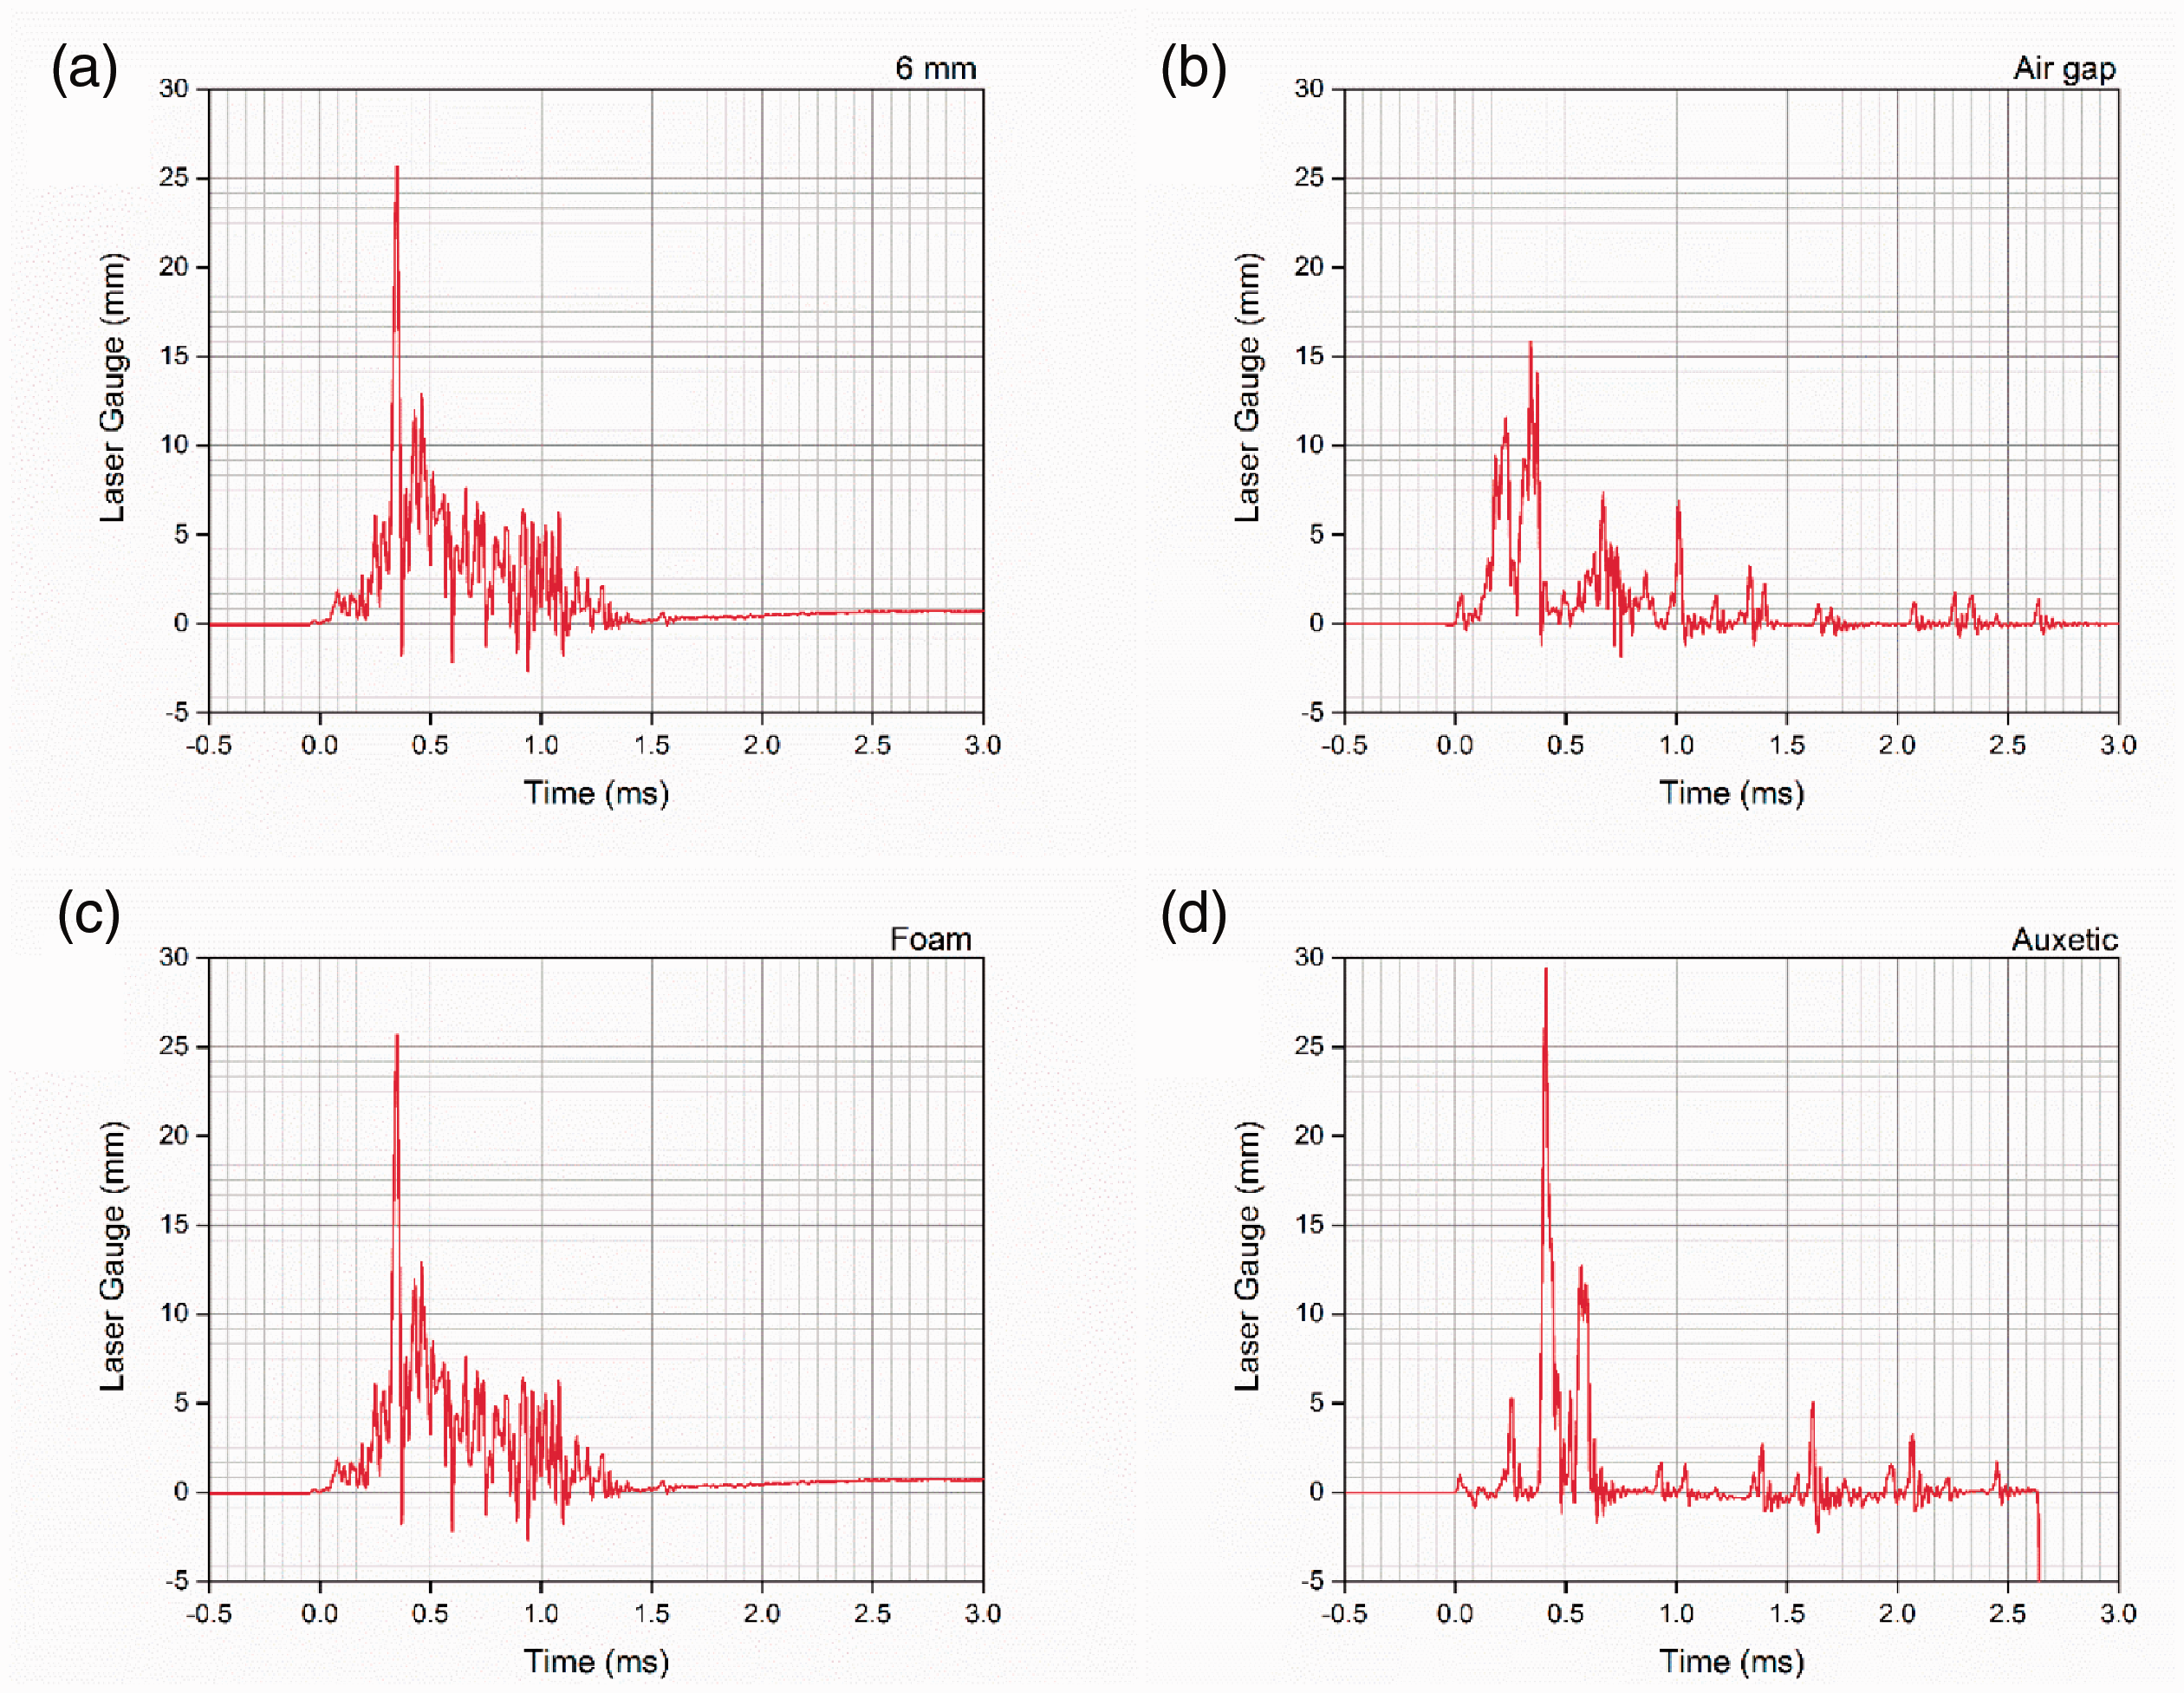
Deflection-time profile based on the laser signal result for (a) 6 mm Plate, (b) Air Filled Panels, (c) Foam filled Panels and (d) auxetic filled panels.
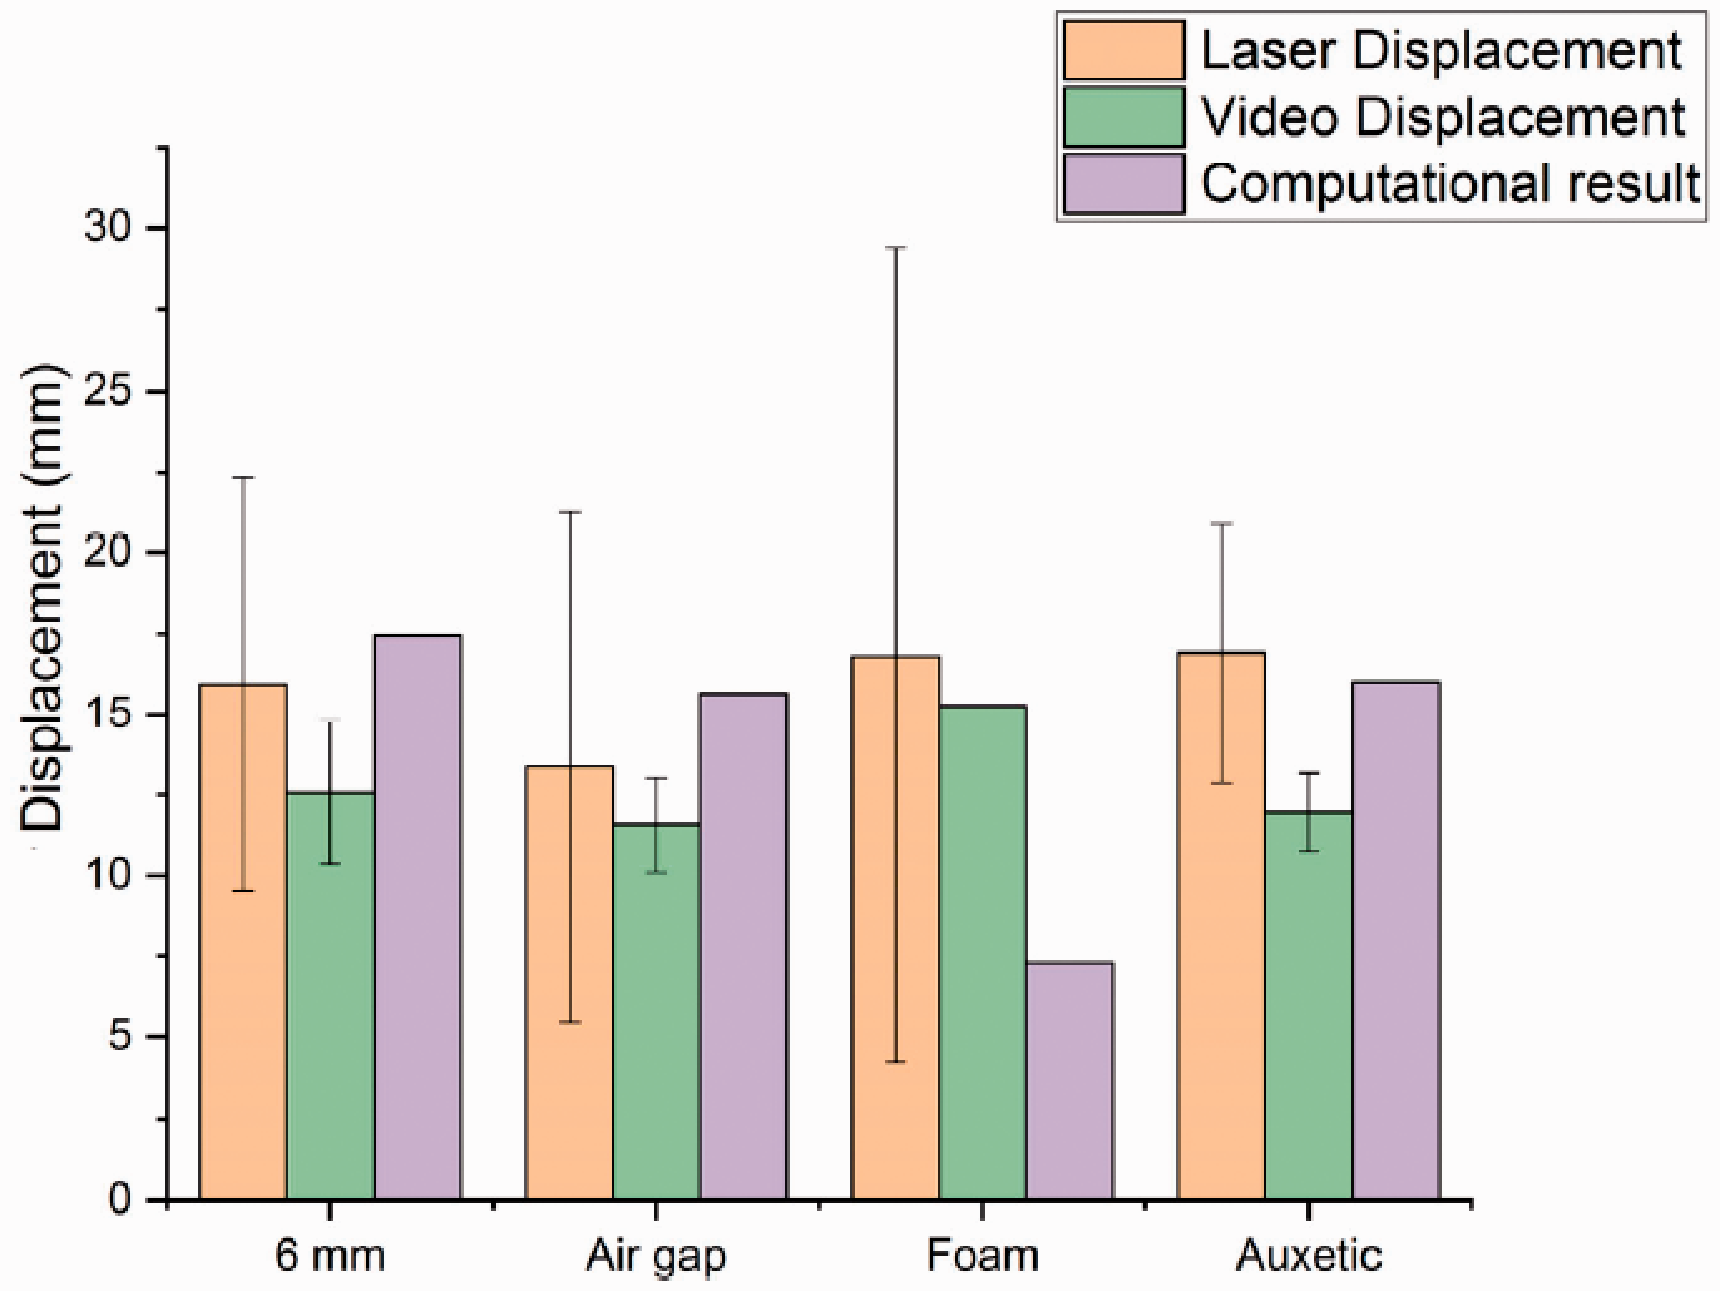
Mid-point displacement of the panels: experimental vs numerical result. Laser system provides physical location measurement (panel displacement) during testing to provide comparison to secondary measurement from HSV and provide validation to computational model.
The air filled panels exhibited the lowest displacement, followed by the 6 mm, foam, and auxetic respectively. Similarly the laser system, HSV indicated that the lowest mean displacement was exhibited by the air panels, followed by auxetic, 6 mm, and foam infills respectively.
All instances, HSV recorded consistently a smaller displacement than the laser by up to 29%. Both systems were considerably variable with error (given by standard deviation) ranging from 23% to 75% and 10% to 17% of the mean displacement for the laser system and HVS respectively. The maximum deflection occurs at the interval between 0.5 – 1 ms on all panels. Both systems were relatively comparable with mean deflections recorded between 13 mm to 27 mm, and 11 mm to 15 mm being recorded for the laser system and HSV respectively.
Analysis of the temporal dominion found that displacement occurred between a mean duration of 2.0 ± 0.6 ms and 3.6 ± 0.65 ms for the laser system and HSV, respectively (Figure 14). Interestingly, the laser system showed that as the panels went from a single panel, to a more composite panel, the displacement duration decreased, with the auxetic panels being the lowest. Alternatively, the HSV presents that changing from a single plate to a composite panel the displacement duration either increases (air filled and auxetic core) or remains comparable.
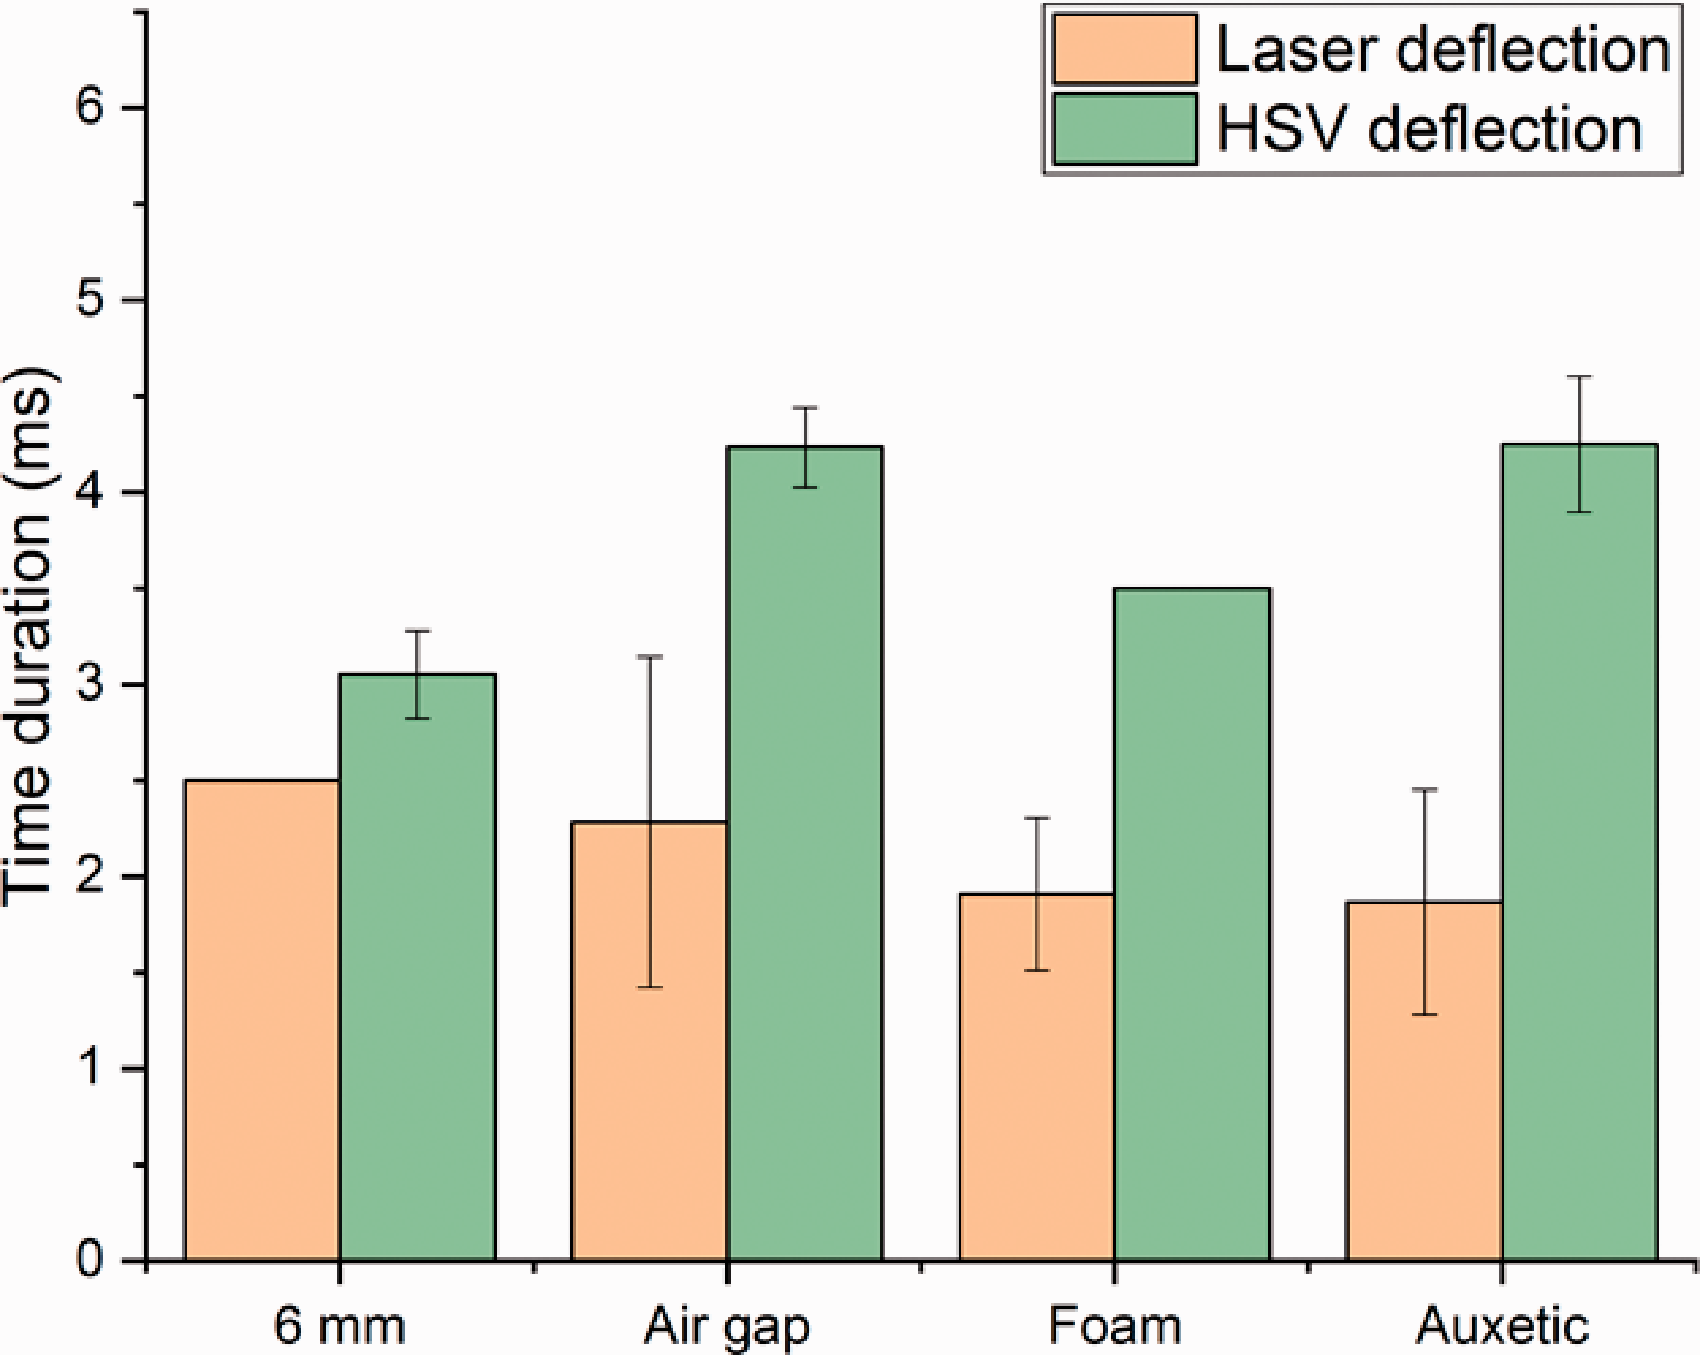
Time duration of displacement per panel type using laser system and HSV.
Interestingly stand deviation between panels was also shown to be influenced by measurement technique. The laser system reported a more broad range of variance from 8% to 32%, while the video had a variance of 1% to 3% of the mean displacement mean duration respectively. The differences between measured displacements are likely due to a number of factors, the most influence being location of the sensing system. In the case of the HSV, the camera was protected from the majority of the blast effects by the Pendine wall allowing for a continued observation of the event. While interactions of the blast products on the mirror are likely to play a role, the low error between datasets suggests that its influence is likely minimal. On the contrary, the laser system was directly located above the panel system and was more subjected to the blast products, as evident by the many dislocation of the laser system post explosive tests. Data capture rate is also likely to play a role in the fidelity of the data, however the influence of such factor is not considered herein.
When compared against the models (Figure 13 and Table 4), the difference between maximum model deflections and the mean panel deflections recorded by laser system and the HSV were -56% to 16% and -52% to 38% respectively, with the biggest deviation exhibited by the foam filled panels. These deviations are likely caused by a coupling of idealised conditions induced through computer modelling along with assumptions and simplifications made within material modelling. For example instead of developing the smooth negative exponential of stress-strain function, a plastic kinematic material model was used which only generates a trapezoidal function [55]. This simplification may also account large deviation observed between the foam experimental and numerical results. Unlike in the experimental where the foam would be compressed and compact until densification, the model did not replicate the densification effect.
During the densification, the modulus is drastically changed from the sloping plateau to the steep second modulus. However, in the numerical, the foam material absorbed the impact energy by shrinking the element. This stage worked in stress plateau region. After that, the second modulus is input similarly with the first elastic modulus due to the lack of true stress-strain data. It contributes to reduce the deflection of back plate because we assume that the foam core would still absorb the energy in densification region, instead of loading the back plate. It is also suspected that the application of using a deletion mechanism on the foam element when it has reached the failure stress due to the pressure traveling from the face plate, where in reality the foam would continue to load the back plate.
A notable deviation was also observed for the auxetic panel where it was found that 160 grams of PE4 failed to initiate re-entrant behaviour to absorb the energy, although some transversal deflection did occur (Figure 15). Without being able to observe the auxetic core loading and deflection during the explosive event, it is difficult to confirm if this behaviour was isolated to the model or indicative of real world behaviour. Interestingly post impact there was evident of damage to the auxetic core in the way spot weld failure between the auxetic cells (Figure 16), and is likely one of the principle mechanisms of blast load absorption. This behaviour failed to be replicated in the auxetic model as the spot welding was not modelled, and thus could influence the model response as it did not have natural failure locations.
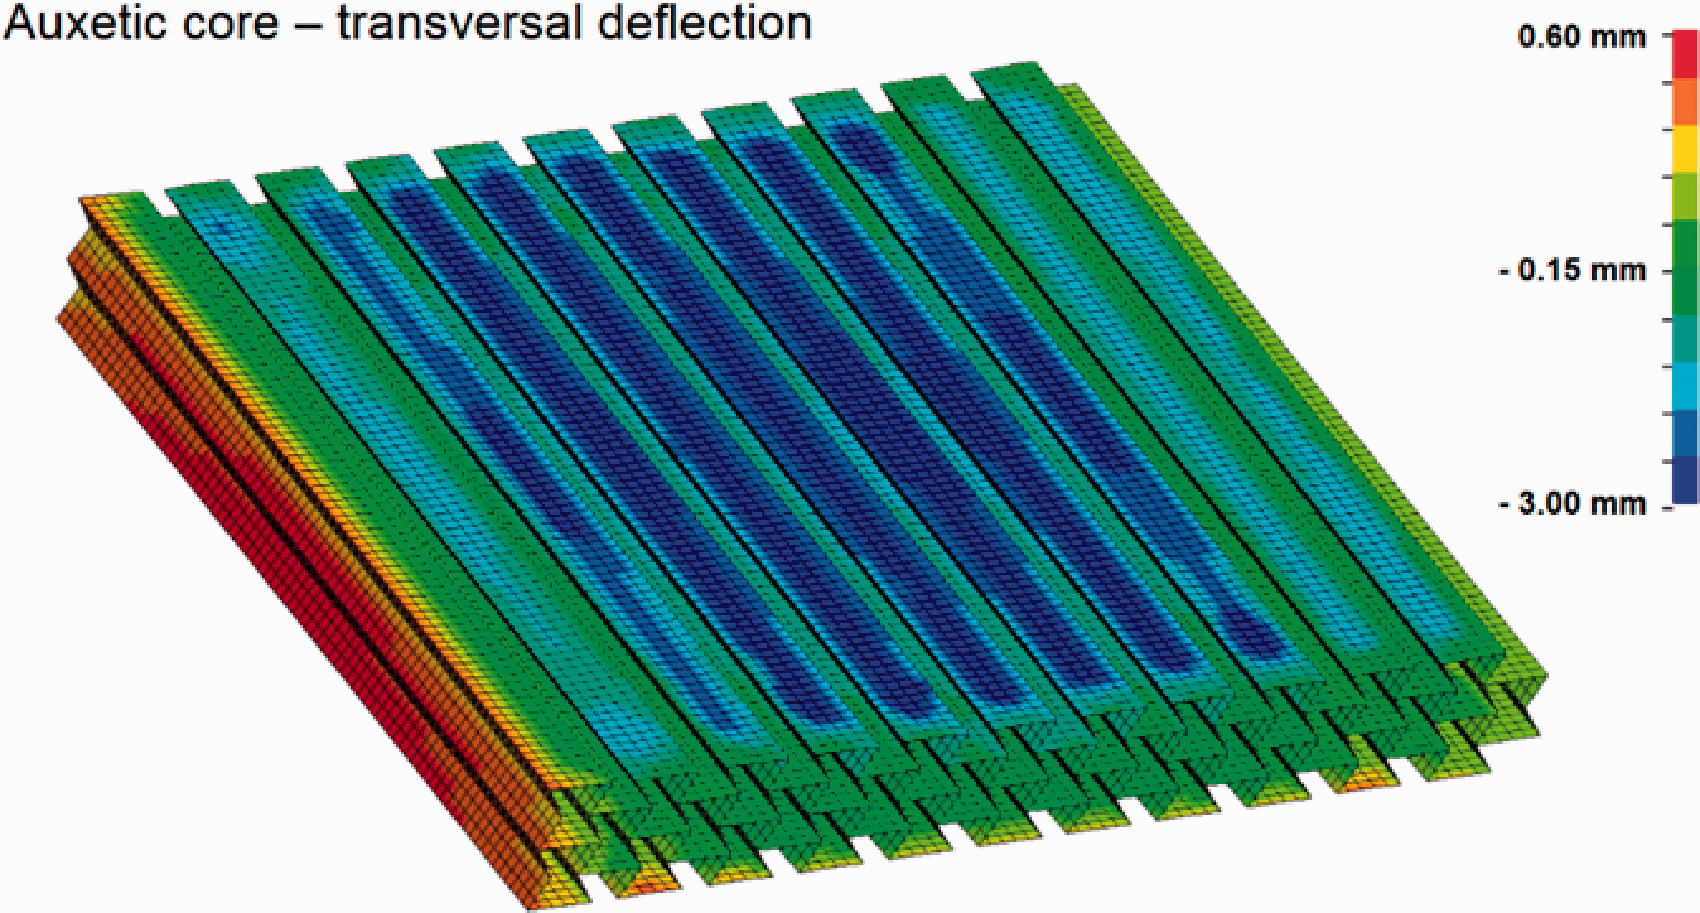
The transversal deflection profile of auxetic core at 0.9 ms. The face part shows the higher deflection due to the first momentum transfer directly from the face plate.
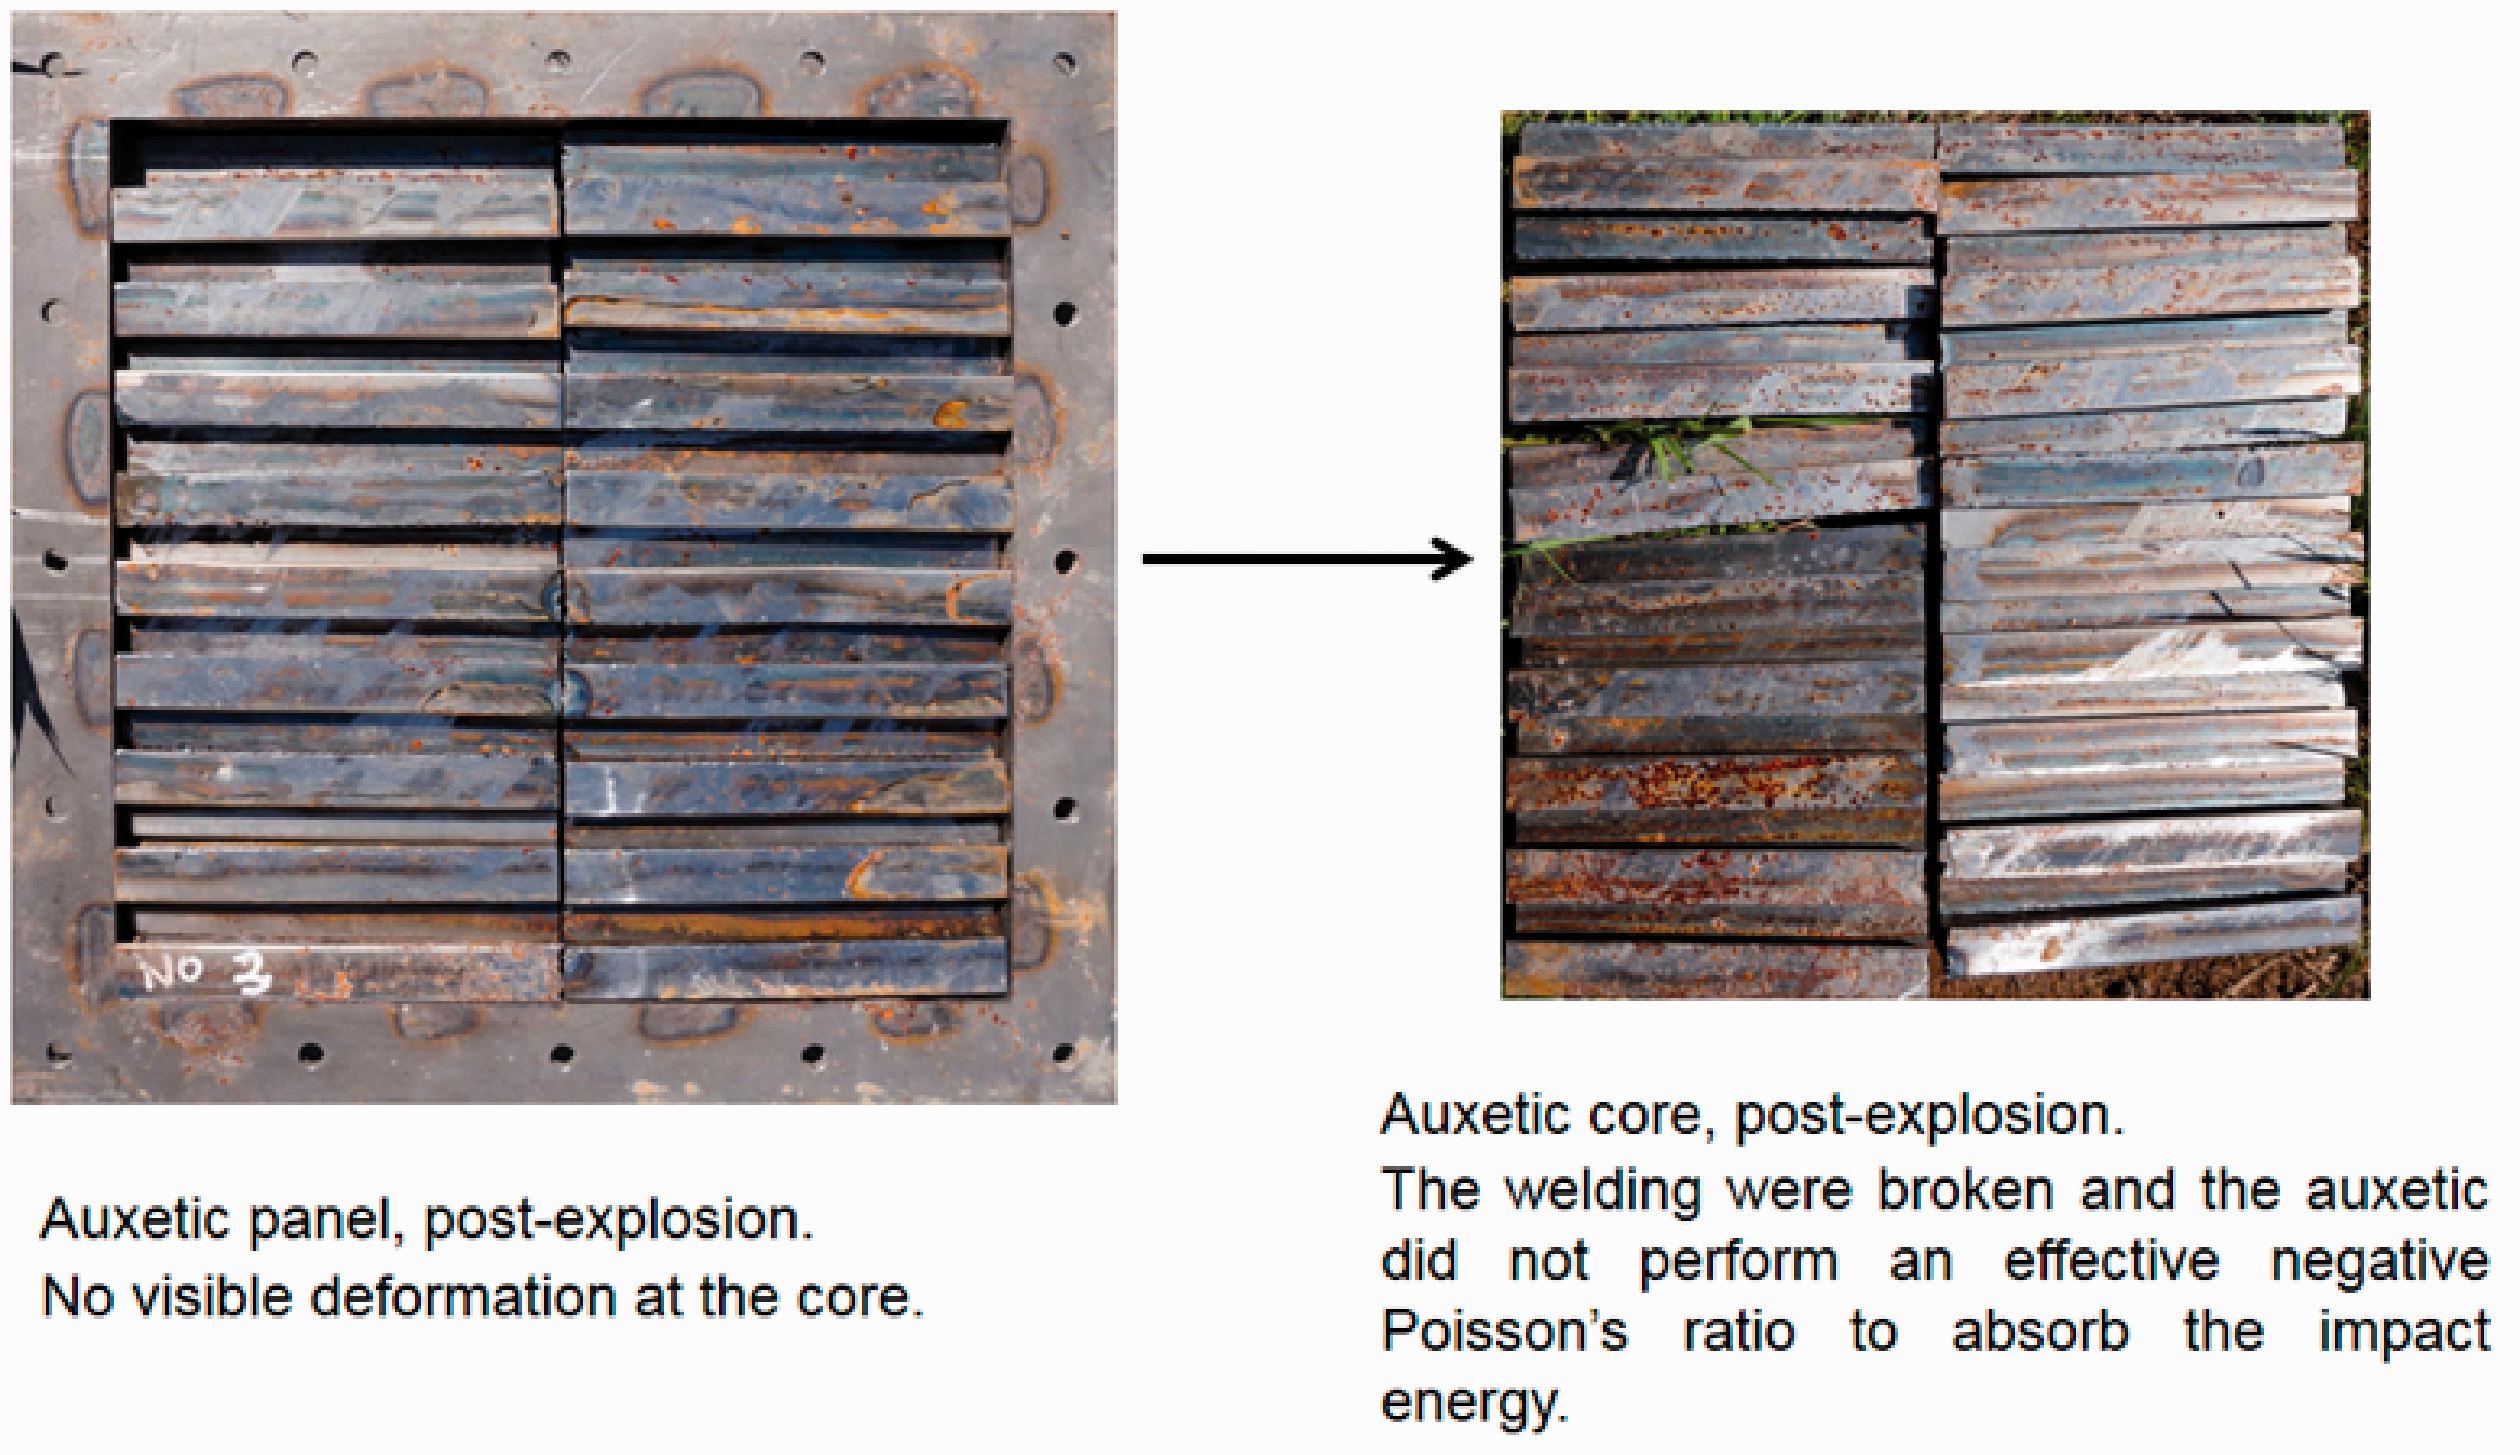
Auxetic sandwich panel post-test condition highlighting weld failure and compression of the lattice structure.
The auxetic model also saw the back plate deflect further than the face plate due to several possibilities. The absence of adhesive between each plate could oscillate each layer during the explosion and also the mechanism of absorption of explosive energy that could be mistaken. We assume that the stiffness of the same thickness face plate and back plate is the cause. The 3 mm panel configuration on the top and bottom behaves like a solid structure and only transfer the loading from the front to the bottom. Whereas the face plate should have been the first side to be hit by the sand ejecta, then the loading was transferred to the core so that the auxetic shrink. This shrinkage behaviour should be an absorbent of impact energy so that deflection can be reduced at the back of the plate. This result may be different if the back plate that is on the inside has a thicker size or vice versa, the face plate is thinner.
Other notable damage to occur throughout testing was the presence of denting on the front panels (Figure 17). While every effort was taken to ensure the sand was levelled prior to testing, the spread of denting indicates that either the soil ejecta didn’t load uniformly or that clumping occurred. This non uniform loading could explain the variance in each panel configuration as shown in Table 4.
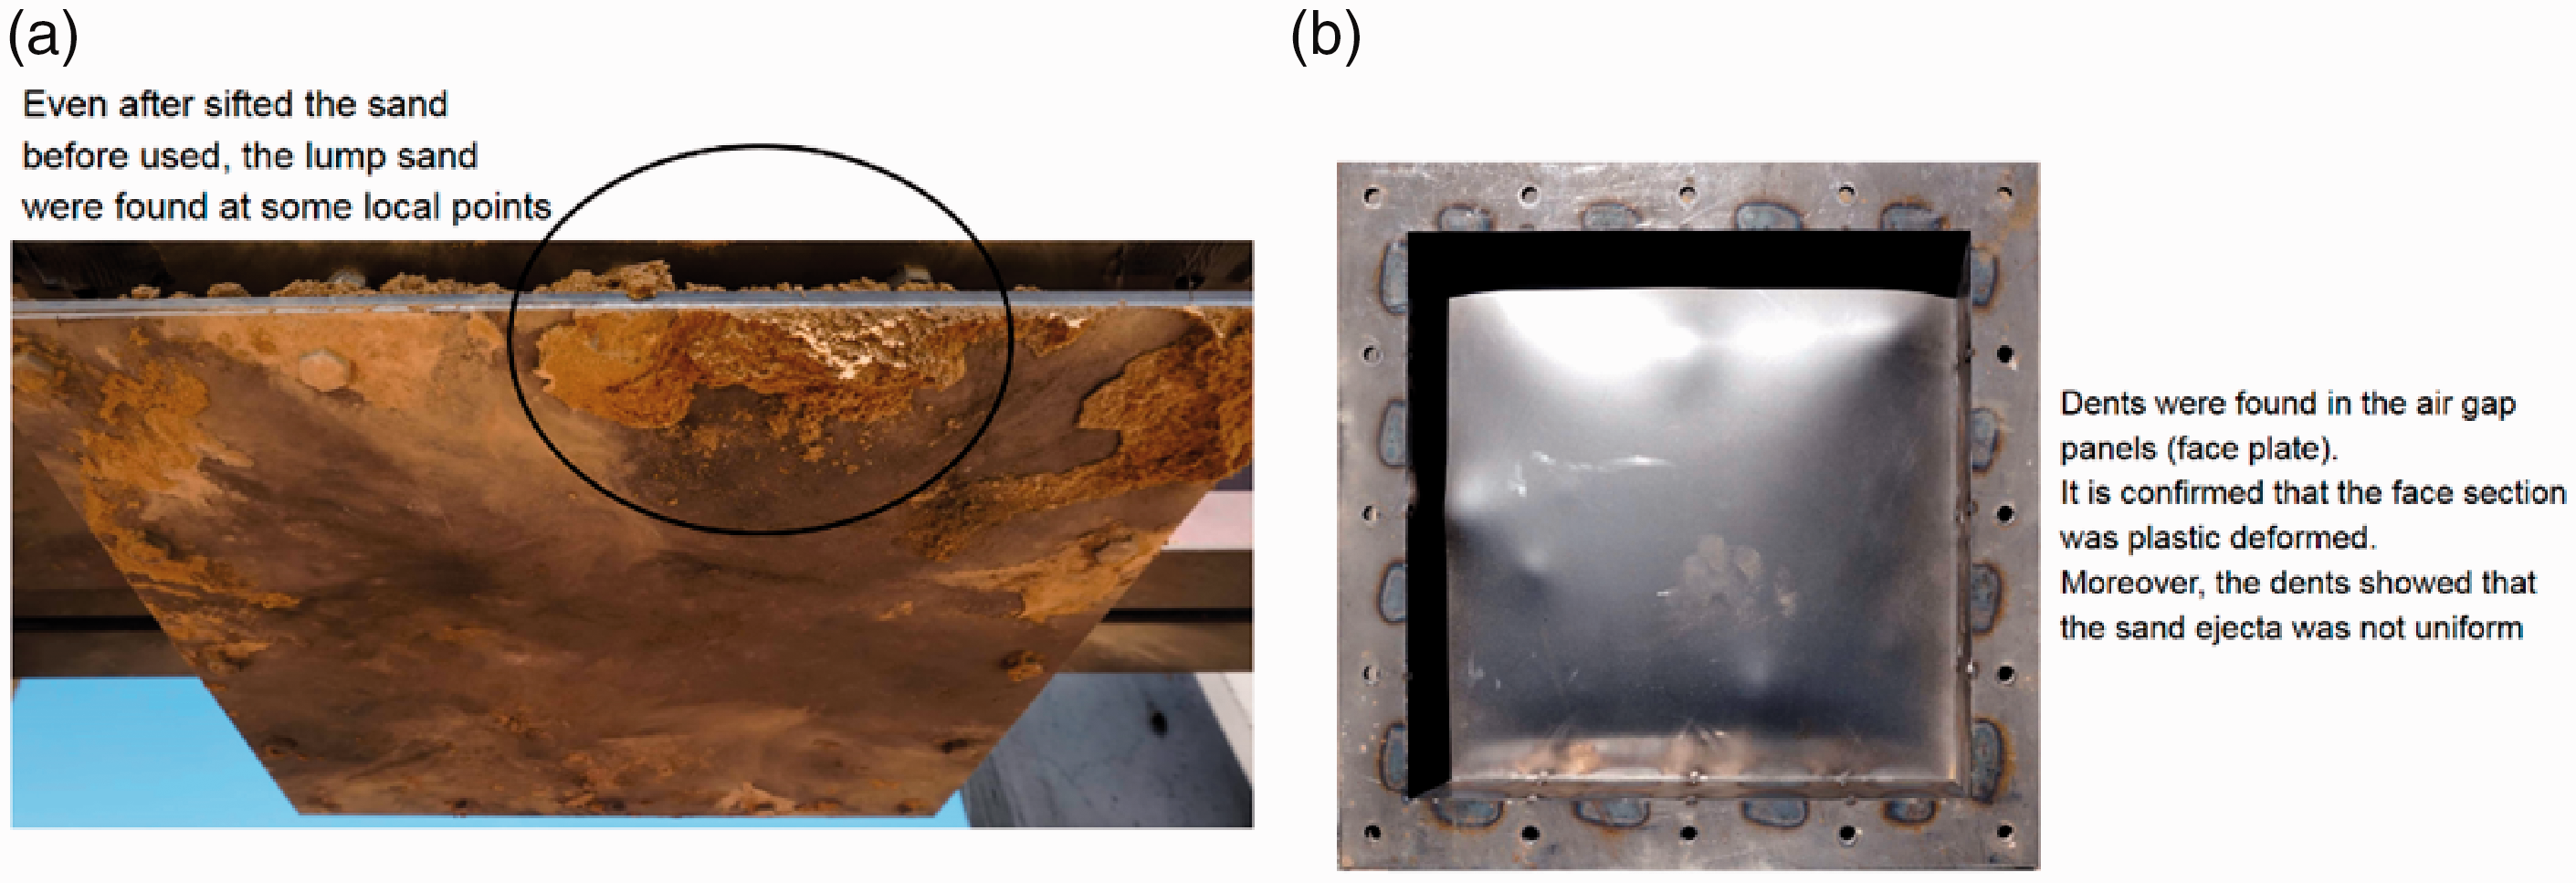
Dent damage observed on (a) front panel for monolithic and air gap panels, highlighting potential non-uniform sand ejecta, and (b) rear panel.
Panel response with respect to panel mass
Figure 18 shows the plot comparison per panel against mass for maximum force, impulse and deflection. The mass of panel type were approximately 7.5 kg, 7.5 kg, 7.8 kg, and 18.7 kg for 6 mm panel, air filled, foam core and auxetic, respectively.
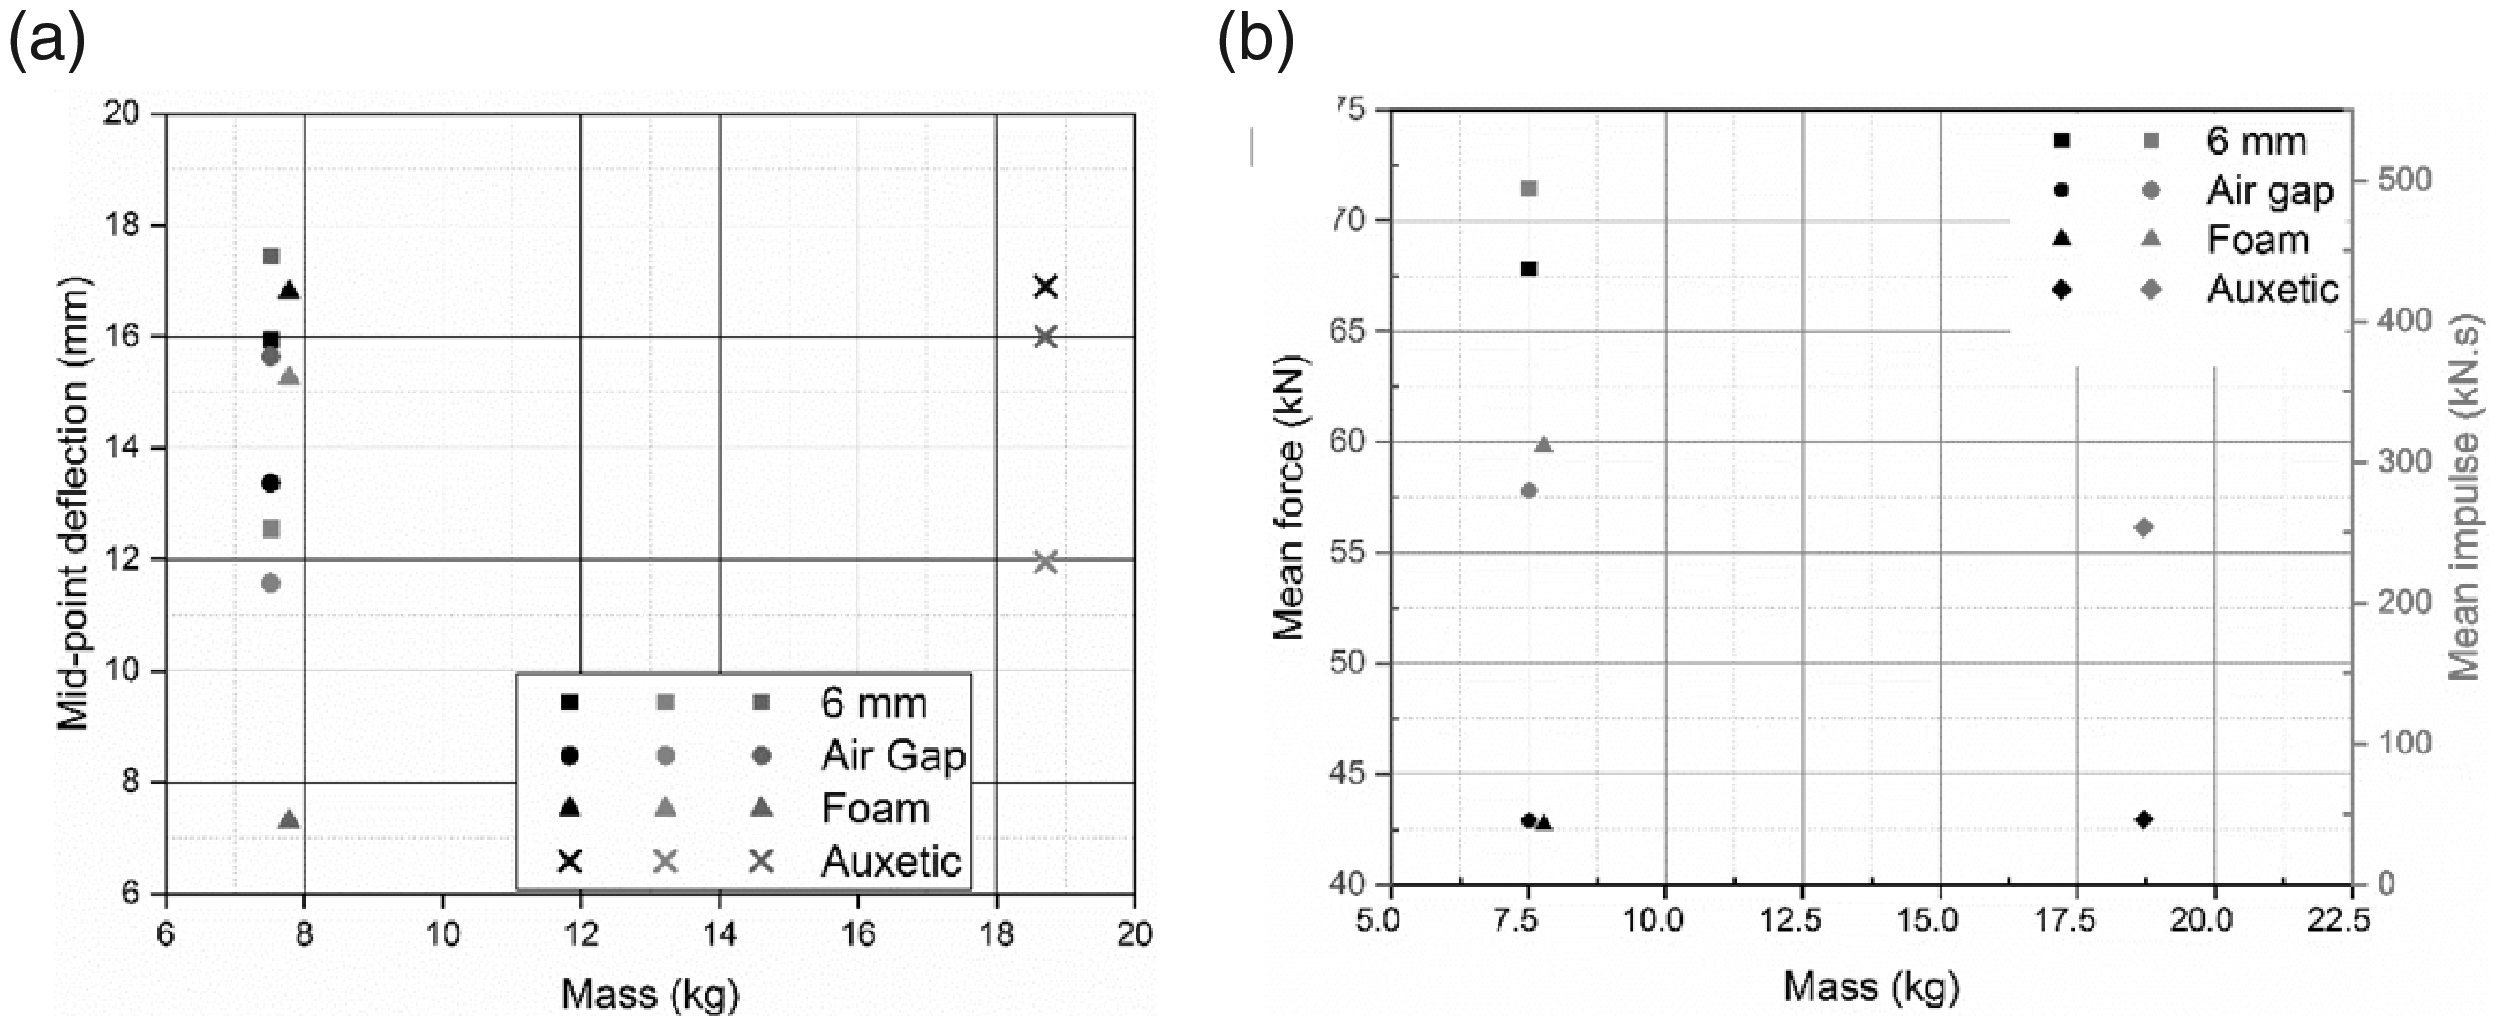
(a) Maximum deflection per panel type against mass; black = laser deflection, red =HSV deflection, blue = simulation deflection, (b) Mean force and mean impulse per panel type against mass.
As presented in Figure 16(a)), comparison of each of the deflection measurements (i.e. laser system, HSV, and numerical modelling) found that foam panels were predicted to be the most effective, with the air filled experimental panels being the most efficient per unit mass. Alternatively the, auxetic core was comparable to the other systems in deflection behaviour but at a significant mass increase, making it an unfavourable strategy to deter the blast loading due to several reasons. Furthermore, Figure 16(b)) shows that the mean force and mean impulse against mass equal to the deflection response. The air filled panel could absorb the energy by deformed the face plate and reduced the received force and impulse in the back plate. By against it mass, the air filled panel is seen the most effective to deter 160 gram PE4 because due to the graph, that the response mean impulse and mean force of air filled panel placed in the most left and corner which means that the air filled is the least weight with the most effective in response. Contrary the auxetic core panel was under performed, even when normalized by the mass. The auxetic filled panel could absorb the impact energy and reduce the mean force and impulse, however by normalizing it by its mass makes the panel is heavier compared to the other panels.
Furthermore, we found the effect of sand humidity is not that sensitive in this study. As presented in Table 5 that the sand humidity recorded in the charge location of auxetic core panel test 4 is a slightly dense than other, approximately 46% below the PE4 charge, even the surrounding humidity is relatively similar for each test. The moister sand could not increase the explosion momentum. It is noticed that the recorded momentum in SX4 test and the other auxetic tested panels with lower humidity are not far different. Rather, we presume that the momentum transfer mechanism through the panel core could determine the panel response.
In monolithic plates, the incoming shock wave imparts a velocity only to the face plate. The face plate is accelerated in responses to the impulse loading. The face plate would deform and vibrate to dissipate the energy. Meanwhile, in sandwich panels, the face panel would meet the core. The face panel immediately decelerated whilst the core and rear panel are accelerated. The energy lost is assumed as a dissipated energy due to the panel deformation or core compression [86]. In air filled panels the face plate would receive a transfer momentum from the shock wave of buried charge. The face plate would be displaced and deformed until 5 mm before contact with the back plate. The energy is dissipated as plastic deformation of face plate before impact the back plate. In foam filled panel, impact energy is dissipated into three components, i.e. face plate, solid foam, and back plate. Similarly with the foam filled, auxetic core panel will absorb the energy by three components, i.e. face plate, auxetic core, and back plate.
The authors are unclear why the sandwich panels do not exhibit the presumption performance. The relatively similar deflection could be caused by (i) the momentum transfer is insufficient to cause permanent displacement of the back plate and (ii) the layer at each panel behave independently because there is no bonding between them. Interestingly in [51], it was reported that there is a tendency with the 500 mm stand-off distance and 208 grams of TNT equivalent mass that the single panel is deflected relatively comparable with the sandwich configurations. This could be caused by the elastic behaviour of the panel. Moreover, related to the insufficient of loading impulse, the panel would displace independently instead of move together as a one sandwich panel as seen in Figure 19. In Figure 17(a), the trace of mid-point of monolithic is presented. The single point move freely, there is no momentum transfer, thus the panel would absorb the energy by a single plate. Meanwhile, Figure 17(b), c), d) shows a mid-point trace in the sandwich panels. In those panels, the momentum transfer occurred at the moment of impact between the layers. The air filled panels in Figure 17(b) shows a momentum transfer between the face and bottom plates. The face plate was plastically deformed until it reaches the bottom plate surface. It pushed the bottom plate and then the face plate was pushed back to forward direction and vibrated. In Figure 17(c) the trace of mid-point of foam filled panel was displayed. It can be observed that there is a delay between the first and the second momentum transfer. The first momentum transfer occurred at approximately 0.1 ms made the face plate and the top surface of the foam collided each other, while the second momentum occurred slightly after it at approximately 0.5 ms. Figure 17(d) shows the mid-point trace of auxetic core panels. The momentum transfer between the layers occurred almost at the same time, approximately at 0.45 ms. However, as stated before that it can be seen there is similarity mechanism between the sandwich panels that the plates of the panels deflected independently. At some time, the layers moved far apart at the momentum transfer. Meanwhile, at the other time they moved closer and impact occurred, the plates damped each other's movements.
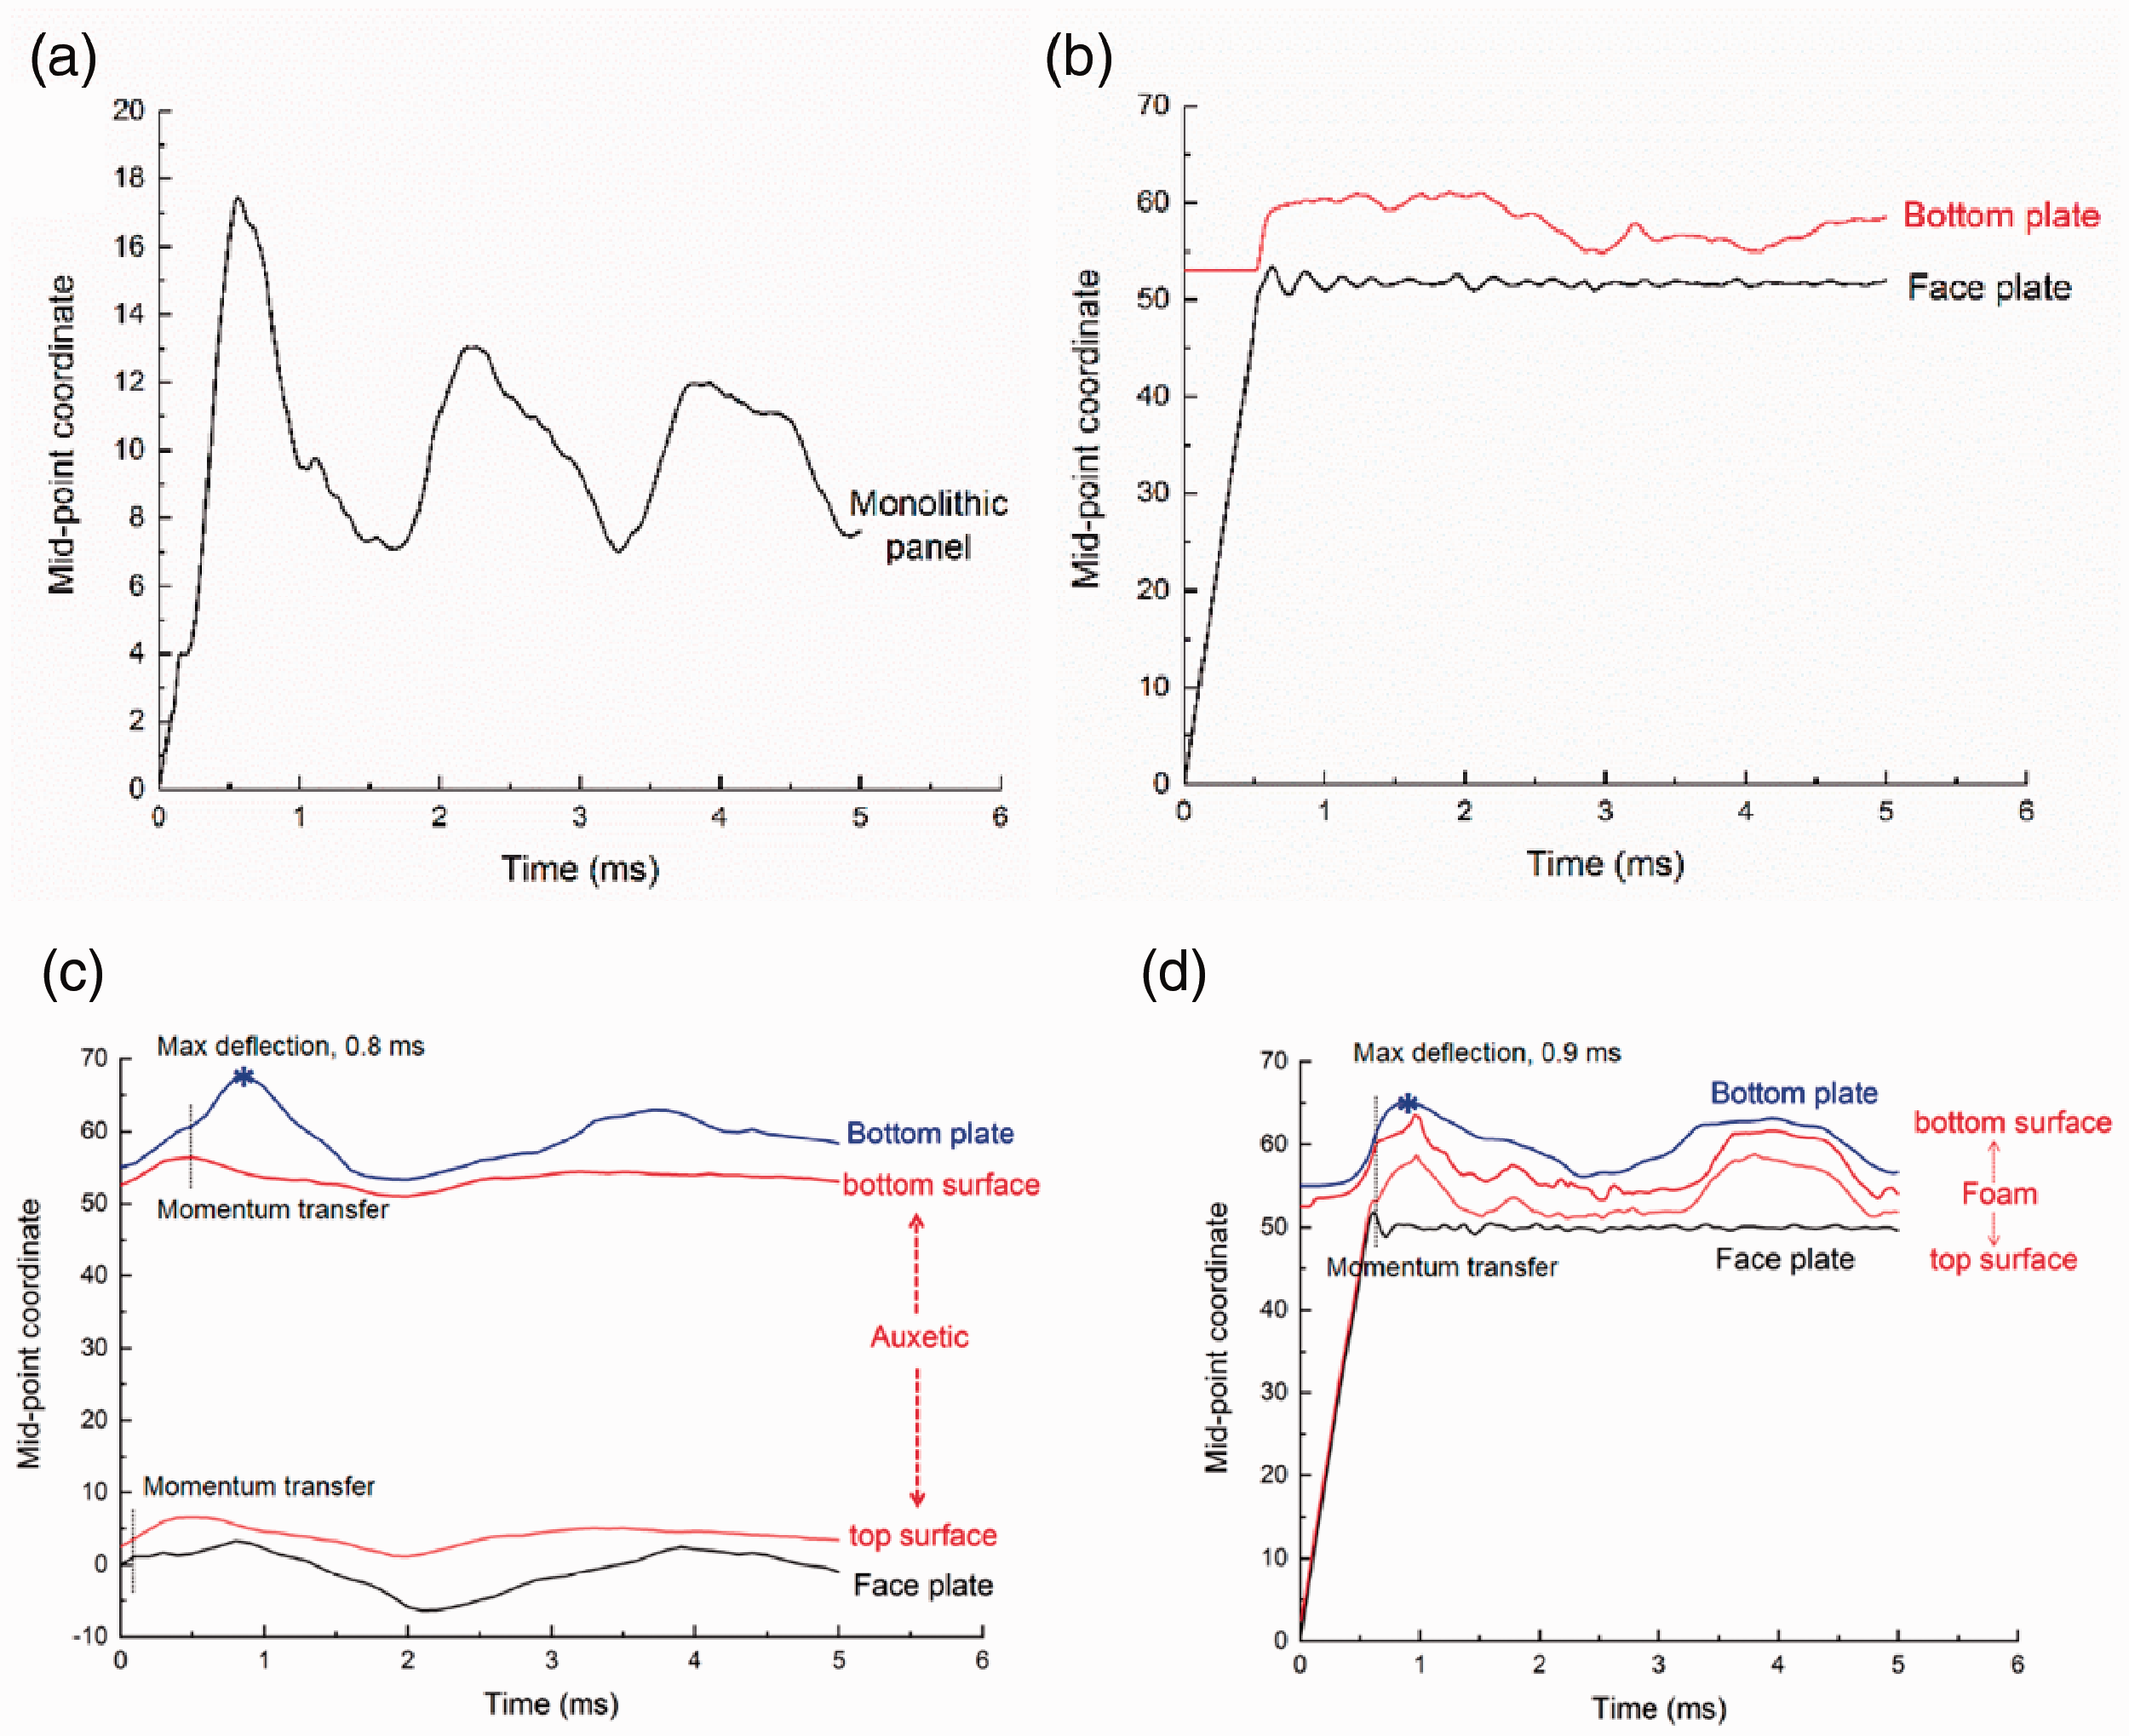
Mid-point momentum co-ordinate profile during explosion in transversal axis (z) for (a) monolithic, (b) air, (c) foam and (d) auxetic panels.
In auxetic core panels, at the time of momentum transferred the core plate would be accelerated and hit the back plate. At this stage, the core plate was decelerated and the back plate is accelerated. The plates behave independently because they are not tied by an adhesive or plastic deformation, thus the transferred momentum push the back plate and deflect it. It is possible to exhibit the comparable displacement between the auxetic and monolithic panel because the mass of back plate of auxetic panel is only 3 mm CR4 steel which is less than 6 mm monolithic panel (The 3 mm panel could have plastic deformation and hit the 50 mm back plate in air filled panel). Thus, the remaining energy of transferred momentum in back plate is still capable to deflect it until 11 to 16 mm.
In addition, it is also unclear that the dissipated energy of the compressed foam core could not damp the back plate in foam panels. We assume that the same transferred momentum mechanism occurred in the foam filled panels.
Conclusions
Auxetic and foam core panels are a promising structure against buried mines, as they demonstrated a lower loading response compared to the monolithic panels of the same material. Deflection measurements were highly variable throughout testing, with the laser system reporting errors as great as 75%; a behaviour likely caused by its near location to the blast event. Nonetheless the air filled panels were the most promising at minimising rear plate deflection as confirmed by all three methods (HSV, laser system and computational modelling). Numerical modelling provided a good prediction of the plate deflections responses with some variation, which were likely caused by the simplified material models employed. Once normalised against panel weight, to understand how mass efficient each system was, the air filled panels were experimentally the most efficient per unit mass, with the auxetic core being the least effective.
Footnotes
Acknowledgement
We would particularly like to thank to ERDA officers and Cranfield Workshops, especially Karl Norris, and Chris Williams for the manufacturing of the samples. The authors would also like to thank Mike Teagle, Dave Miller and Alan Peare for their assistance during testing and ensuring trouble free data collection. Lastly we would like to thanks LSTC for providing the on LS-DYNA academic license to undertake the computational modelling element of this work.
Declaration of Conflicting Interests
The author(s) declared no potential conflicts of interest with respect to the research, authorship, and/or publication of this article.
Funding
The author(s) received no financial support for the research, authorship, and/or publication of this article.
Appendix 1. Sand humidity
Sand humidity around the charge, four points were measured around the charges and one point at the centre of the charge, respectively.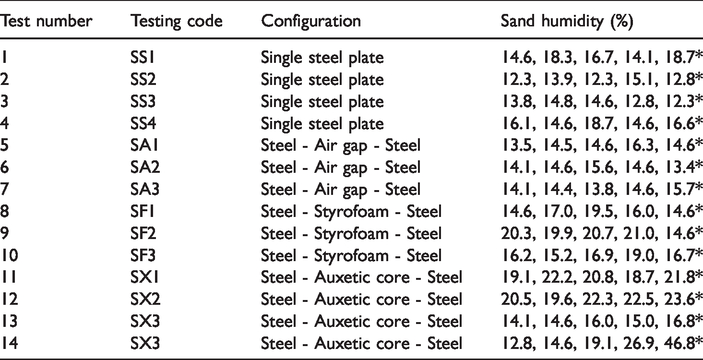
Test number
Testing code
Configuration
Sand humidity (%)
1
SS1
Single steel plate
14.6, 18.3, 16.7, 14.1, 18.7*
2
SS2
Single steel plate
12.3, 13.9, 12.3, 15.1, 12.8*
3
SS3
Single steel plate
13.8, 14.8, 14.6, 12.8, 12.3*
4
SS4
Single steel plate
16.1, 14.6, 18.7, 14.6, 16.6*
5
SA1
Steel - Air gap - Steel
13.5, 14.5, 14.6, 16.3, 14.6*
6
SA2
Steel - Air gap - Steel
14.1, 14.6, 15.6, 14.6, 13.4*
7
SA3
Steel - Air gap - Steel
14.1, 14.4, 13.8, 14.6, 15.7*
8
SF1
Steel - Styrofoam - Steel
14.6, 17.0, 19.5, 16.0, 14.6*
9
SF2
Steel - Styrofoam - Steel
20.3, 19.9, 20.7, 21.0, 14.6*
10
SF3
Steel - Styrofoam - Steel
16.2, 15.2, 16.9, 19.0, 16.7*
11
SX1
Steel - Auxetic core - Steel
19.1, 22.2, 20.8, 18.7, 21.8*
12
SX2
Steel - Auxetic core - Steel
20.5, 19.6, 22.3, 22.5, 23.6*
13
SX3
Steel - Auxetic core - Steel
14.1, 14.6, 16.0, 15.0, 16.8*
14
SX3
Steel - Auxetic core - Steel
12.8, 14.6, 19.1, 26.9, 46.8*