
Abstract
Objectives
The aim of this study was to evaluate the intra- and inter-rater reliability of epaxial muscle cross-sectional area measurement on feline CT images and to determine the relationship between normalized epaxial muscle area (EMA) and subjective muscle condition score (MCS).
Methods
Feline transverse CT images including the junction of the 13th thoracic vertebrae/13th rib head were retrospectively reviewed. Right and left epaxial muscle circumference and vertebral body height were measured and an average normalized EMA (ratio of epaxial area:vertebral height) was calculated for each image. Measurements were performed by three individuals blinded to the clinical data and were repeated 1 month later. Intra- and inter-rater reliability of EMA was assessed with concordance correlation coefficient (CCC), and Bland–Altman analysis was performed to assess bias and limits of agreement (LoA) between and within observers at different time points. In cats for which MCS data were available, EMA was compared between differing MCSs via the Kruskal–Wallis test, with Bonferroni-corrected Wilcoxon rank-sum post-hoc analysis.
Results
In total, 101 CT scans met the inclusion criteria for reliability analysis, 29 of which had muscle condition information available for analysis. Intra-rater EMA CCC ranged from 0.84 to 0.99 with minimal bias (range –0.16 to 0.08) and narrow LoA. Inter-rater EMA CCC ranged from 0.87 to 0.94, bias was larger (range –0.46 to 0.66) and LoA were wider when assessed between observers. Median EMA was significantly lower in cats with severe muscle atrophy (2.76, range 1.28–3.96) than in all other MCS groups (P <0.0001 for all comparisons).
Conclusions and relevance
Measurement of EMA on CT showed strong intra-rater reliability, and median EMA measurements were significantly lower in cats with severe muscle wasting, as assessed on physical examination. Further studies correlating EMA to lean muscle mass in cats are needed to determine whether this method may be useful to quantify muscle mass in patients undergoing a CT scan.
Introduction
Cachexia, a preferential loss of muscle mass in excess of fat mass, is a common sequela of multiple chronic human and veterinary diseases, including chronic kidney disease (CKD), cardiac failure and neoplasia.1–8 In humans, cachexia has been found to be predictive of morbidity and mortality in many of these disease states.1,2,5,9 Similar studies evaluating the prognostic effect of cachexia are lacking in feline medicine, and detection of cachexia may be difficult in earlier stages, while muscle mass loss is subtle or masked by changes in fat and body water volumes.
A subjective feline muscle condition scoring system exists based on assessment of temporal, scapular, epaxial and ilial musculature. It has been validated against dual-energy X-ray absorptiometry (DEXA) evaluation of feline lean body mass (LBM).10,11 These areas are low in fat stores and are therefore a better reflection of LBM. Typically, the thoracic and lumbar epaxial musculature are sites in which muscle loss can be identified in earlier stages. 12 Objective measures of LBM exist (DEXA, quantitative magnetic resonance, deuterium oxide dilution, bioelectrical impedance, etc), but cost and availability are a significant barrier to their use. CT, while still costly, is more widely available than the above diagnostic tests and is more commonly used in routine disease evaluation.
In humans, skeletal muscle volume can be estimated via a single cross-sectional abdominal MRI or CT image, and this estimated value correlates well with measurements of skeletal muscle volume via whole-body MRI scans and DEXA.13,14 Unfortunately, similar validated LBM estimations have not been evaluated in cats and dogs. Single cross-sectional abdominal CT images of epaxial musculature at the thoracolumbar junction have been assessed for evaluation of muscle mass in Golden Retrievers. Subjective severity of muscle atrophy was higher, and epaxial muscle area (EMA) normalized to vertebral body height was lower in older vs younger dogs. 15 This same study evaluated the quadriceps and temporal muscle groups similarly, and these muscle groups did not differ with age. 15 Recently, a technique for measurement of a vertebral epaxial muscle score (epaxial muscle height:T4 length) was evaluated in healthy cats with an ideal body condition. The epaxial muscle height was determined via ultrasonography, and the length of the fourth thoracic vertebra was determined from a lateral radiograph. 16 This provides a non-invasive, objective measurement of epaxial muscle condition, independent of the cat’s size. However, the use of ultrasound to measure epaxial height may create more variability in technique than CT scanning, and validation in cats in various muscle conditions is needed. Epaxial ultrasonography and radiography may also require additional testing. Alternatively, if a cat is already having CT performed as part of its diagnostic work-up, information about epaxial musculature could be collected. To our knowledge, no studies exist evaluating whether CT-generated feline EMA can be repeatably and reliably measured within and between different observers.
The aim of this retrospective pilot study was to determine the inter- and intra-rater reliability in the measurement of the epaxial musculature on CT imaging in cats. A secondary aim was to evaluate the relationship between measured EMA on a single cross-sectional CT image at the 13th thoracic vertebra (T13) and muscle condition as assessed on physical examination.
Materials and methods
Case inclusion and medical records
Medical records from the Ohio State University Veterinary Medical Center from January 2005 to November 2017 were searched for feline patients undergoing thoracic or abdominal CT scans as a part of routine diagnostic work-up. This included cases with diseases associated with diffuse muscle atrophy (CKD, neoplasia, cardiac disease, etc), while cases in which focal pathology existed at the level of T13 were excluded. Cases were also excluded if the cat was <1 year old, if the CT image quality was too poor for reasonable assessment of the epaxial musculature, if the image did not include the entirety of the T13–L1 junction, if the cat had a transitional T13 or L1 vertebra, or if the cat was poorly positioned or was not in sternal recumbency for the CT scan. If a cat had more than one CT scan performed, only the first scan was included in the analysis. Data retained from the medical record included signalment, date of birth, date of CT scan, CT scanner used, the reason the CT scan was performed, body weight (BW), muscle condition score (MCS), body condition score (BCS), final diagnosis and comorbid conditions.
BCS was recorded in the medical record based on a 5-point or 9-point scale at the discretion of the attending clinician. For statistical analysis, values using the 5-point scale were converted to the 9-point scale as follows: 1/5 = 1/9; 1.5/5 = 2/9; 2/5 = 3/9; 2.5/5 = 4/9; 3/5 = 5/9; 3.5/5 = 6/9; 4/5 = 7/9; 4.5/5 = 8/9; 5/5 = 9/9. This conversion scale was utilized after consultation with a board-certified veterinary nutritionist (VP), as no authoritative protocol exists for conversion of BCS from a 5- to 9-point scale. Muscle wasting was categorized by severity and assigned an MCS as follows: none (0), mild (1), moderate (2) or severe (3). 10
When possible, the primary diagnosis and comorbid conditions for each cat were recorded. Primary diagnosis was assigned to the disease process that prompted the CT scan; comorbid conditions were defined as chronic conditions that preceded the CT scan visit, or conditions identified at the CT scan but unrelated to the primary active condition. Cats with pulmonary nodules identified on the CT scan were classified as having pulmonary neoplasia if no primary tumor was identified.
Epaxial muscle measurements
Transverse CT images for each cat were windowed and leveled to a standard value (W2500, L480) (E-Film 3.3; Merge Healthcare). Each image was then magnified 2.5 times. A slice including the body wall, right and left epaxial muscle groups, mid-body T13 vertebra, and the heads of the right and left 13th ribs was identified, and the image was centered on the body of T13, preventing visualization of the abdominal organs. A 1 cm calibration line was added to each image, and the image was then copied into ImageJ software (National Institutes of Health) for further evaluation.
In ImageJ software, the 1 cm line was measured, and the measurement was calibrated to correlate image pixels with length in cm for each image. The height of the T13 vertebral body was measured three times, and the result was recorded in centimetres. The right and left epaxial muscle groups were then outlined freehand by three observers: a board-certified radiologist (EMG); a board-certified internist (JMQ); and a resident in the internal medicine program at the Ohio State University Veterinary Medical Center (LHR). Observers were blinded to each cat’s signalment, diagnosis, BCS, MCS and other medical record data. After the right or left epaxial muscle group was outlined, the area (in cm2) was calculated using ImageJ software, and this value was recorded. This measurement was repeated three times for the right and left epaxial muscle groups, alternating which side was measured first. All measurements were repeated a second time by each of the three observers, approximately 1 month after the first set of measurements was completed.
Mean values for left epaxial cross-sectional area, right epaxial cross-sectional area and T13 mid-body vertebral height were calculated from the average of the three measurements for each. The average of the mean left and right cross-sectional areas was also calculated to give an overall epaxial cross-sectional area for each cat. Values for the mean right, left and overall epaxial cross-sectional areas were then divided by the mean mid-body vertebral height to provide the left (LEMA), right (REMA) and average overall epaxial area:vertebral height ratios (EMA), to normalize this value for the overall size of the cat.
Statistics
Descriptive statistics, such as mean and SD for continuous variables, and count and percentage for categorical variables, were provided. Intra-rater reliability was assessed for each observer with concordance correlation coefficients (CCC). The average measurements of the REMA, LEMA and EMA across time points for each observer were calculated, and inter-rater reliability of the average values were also assessed via CCC. Bland–Altman plots were generated to assess bias and limits of agreement (LoA) for the REMA, LEMA and EMA between observers and within observers. In the subset of cats with recorded MCS, median overall EMAs were compared between the four MCS groups using the Kruskal–Wallis test, with pairwise comparisons between MCS groups performed with Wilcoxon rank-sum test at a significance level of 0.0083 (0.05/6 comparisons) with Bonferroni correction for multiple comparisons. P values <0.05 were considered significant. All analyses were performed in Stata version 15.1 (Stata Corp).
Results
Review of the medical records identified 167 feline abdominal and thoracic CT scans. Of these, 62 were excluded according to the criteria described above. Four cats had more than one CT scan performed and only the first scan was included. In total, 101 feline CT scans from three CT scanners (Revolution EVO [GE Healthcare]; PQS [Picker Corporation]; LightSpeed Ultra [GE Healthcare]) remained in the final analysis; 21 were abdominal and 80 were thoracic scans. Of these, MCS was commented on in the medical records of 29 cats.
Signalment and body composition characteristics of 101 included cats are presented in Table 1. The median age of included cats was 10.9 years (range 1.68–19.3 years). Median weight was 4.85 kg (range 2.24–11.8 kg). Forty-five of 101 cats were female (four intact) and 55/101 cats were male (one intact). Sex was unknown for one cat. Breeds included domestic shorthair (n = 61), domestic longhair (n = 12), domestic mediumhair (n = 8), Maine Coon (n = 4), American Shorthair (n = 3), Abyssinian (n = 2), Persian (n = 2), Siamese (n = 2) and one each of six other breeds (Exotic Shorthair, Ragdoll, Japanese Bobtail, Himalayan, domestic longhair–Bengal cross and unspecified mixed breed). Breed information was not recorded for one cat. Out of 58 cats, one had a BCS of 1/9, 2/58 had a BCS of 2/9, 11/58 had a BCS of 3/9, 7/58 had a BCS of 4/9, 14/58 had a BCS of 5/9, 4/58 cats had a BCS of 6/9, 15/58 had a BCS of 7/9, 0/58 had a BCS of 8/9, and 4/58 had a BCS of 9/9. Of the 29 cats with muscle condition information available, 14 were classified as having normal muscling, six as having mild, five as having moderate and four as having severe atrophy.
Signalment and body composition of cats

Data are median (range), or n (%) as appropriate or unless otherwise indicated
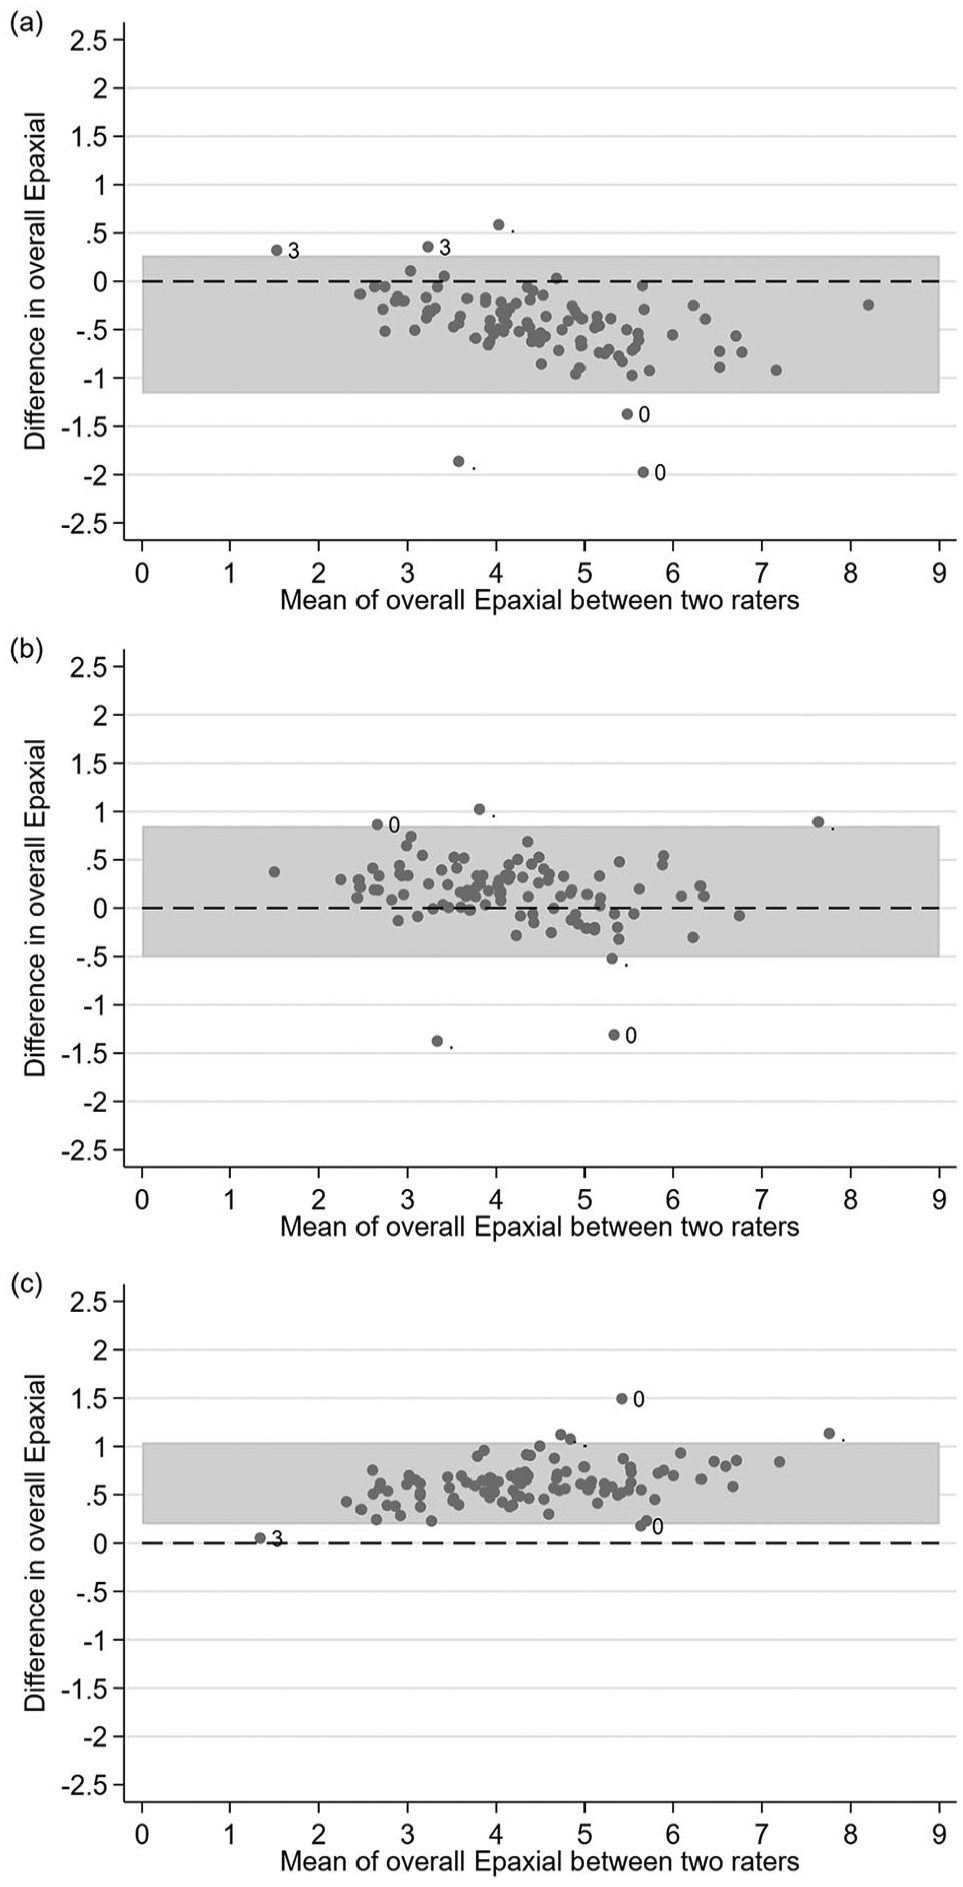
Intra-rater reliability of the epaxial muscle measurements is summarized in Table 2. CCCs between first and second epaxial measurements for all observers for REMA, LEMA and EMA ranged from 0.84 to 0.99. Agreements for measurement of the REMA and LEMA were similar across observers, indicating little to no effect of the side of the epaxial musculature measured on measurement agreement. However, for observers LHR and JMQ, the averaged value of both sides (EMA) showed better agreement between time points than the REMA or LEMA. For observer EMG, the EMA showed equal agreement to the REMA and better agreement than the LEMA. For these reasons, the EMA was used for Bland–Altman analysis. Bland–Altman analyses of the measured EMA for each observer at both time points are presented in Figure 1. Numerical values for bias and LoA are presented in Table 2. Overall, bias was minimal for each observer between time points (range –0.16 to 0.08). LoA were narrowest for the observer with the least radiology-specific training (LHR).
Intra-rater reliability assessed by concordance correlation coefficient (CCC) and bias (n = 101 CT scans)

REMA = right epaxial muscle area; LEMA = left epaxial muscle area; EMA = epaxial muscle area; CI = confidence interval; LoA = limits of agreement

Bland–Altman plots showing the intra-rater reliability for overall epaxial muscle area measured approximately 1 month apart: (a) rater EMG; (b) rater JMQ; (c) rater LHR. The muscle condition score is indicated for outlying points, when available. n = 101 feline CT scans
Inter-rater reliability, bias and LoA for the averaged REMA, LEMA and EMA from both time points are summarized in Figure 2 and Table 3. CCCs between observers were poorer than within observers for all observer comparisons for REMA, LEMA and EMA (range 0.85–0.94). Bias was increased when comparing measurements between observers vs measurements by the same observer at different timepoints (range –0.46 to 0.66). The largest positive bias occurred between observers JMQ and LHR (0.58–0.66), and the largest negative bias occurred between observers EMG and JMQ (–0.44 to –0.46). The width of the LoA was similar for comparisons between all observers.
Inter-rater reliability assessed by concordance correlation coefficient (CCC) and bias (n = 101 CT scans)

The two readings from each rater were averaged due to high intra-rater reliability
REMA = right epaxial muscle area; LEMA = left epaxial muscle area; EMA = epaxial muscle area; CI = confidence interval; LoA = limits of agreement
Bland–Altman plots showing the inter-rater reliability for overall epaxial muscle area: (a) rater EMG vs JMQ; (b) rater EMG vs LHR; (c) rater JMQ vs LHR. Muscle condition score is indicated for outlying points, when available. n = 101 feline CT scans
Box plots of the EMA for each muscle condition category are shown in Figure 3. Results of EMA for each observer and the average for all observers were compared for cats with different MCSs (Table 4). Descriptively speaking, median EMA was consistently lower in the severe atrophy group than other MCS groups for all three observers at both time points, but none of the these comparisons reached statistical significance at P <0.05. When looking at the overall data across observers and time points, a significant difference in median EMA was observed between MCS groups. Post-hoc pairwise comparison revealed that the severe muscle atrophy group had significantly lower median values than the groups with no, mild and moderate muscle atrophy noted (all three P values <0.0001).

Box and whisker plots of epaxial muscle area (EMA) in cats with known muscle condition scores (n = 29) for each rater at each time point
Comparison of epaxial area:vertebral height ratio to severity of muscle atrophy
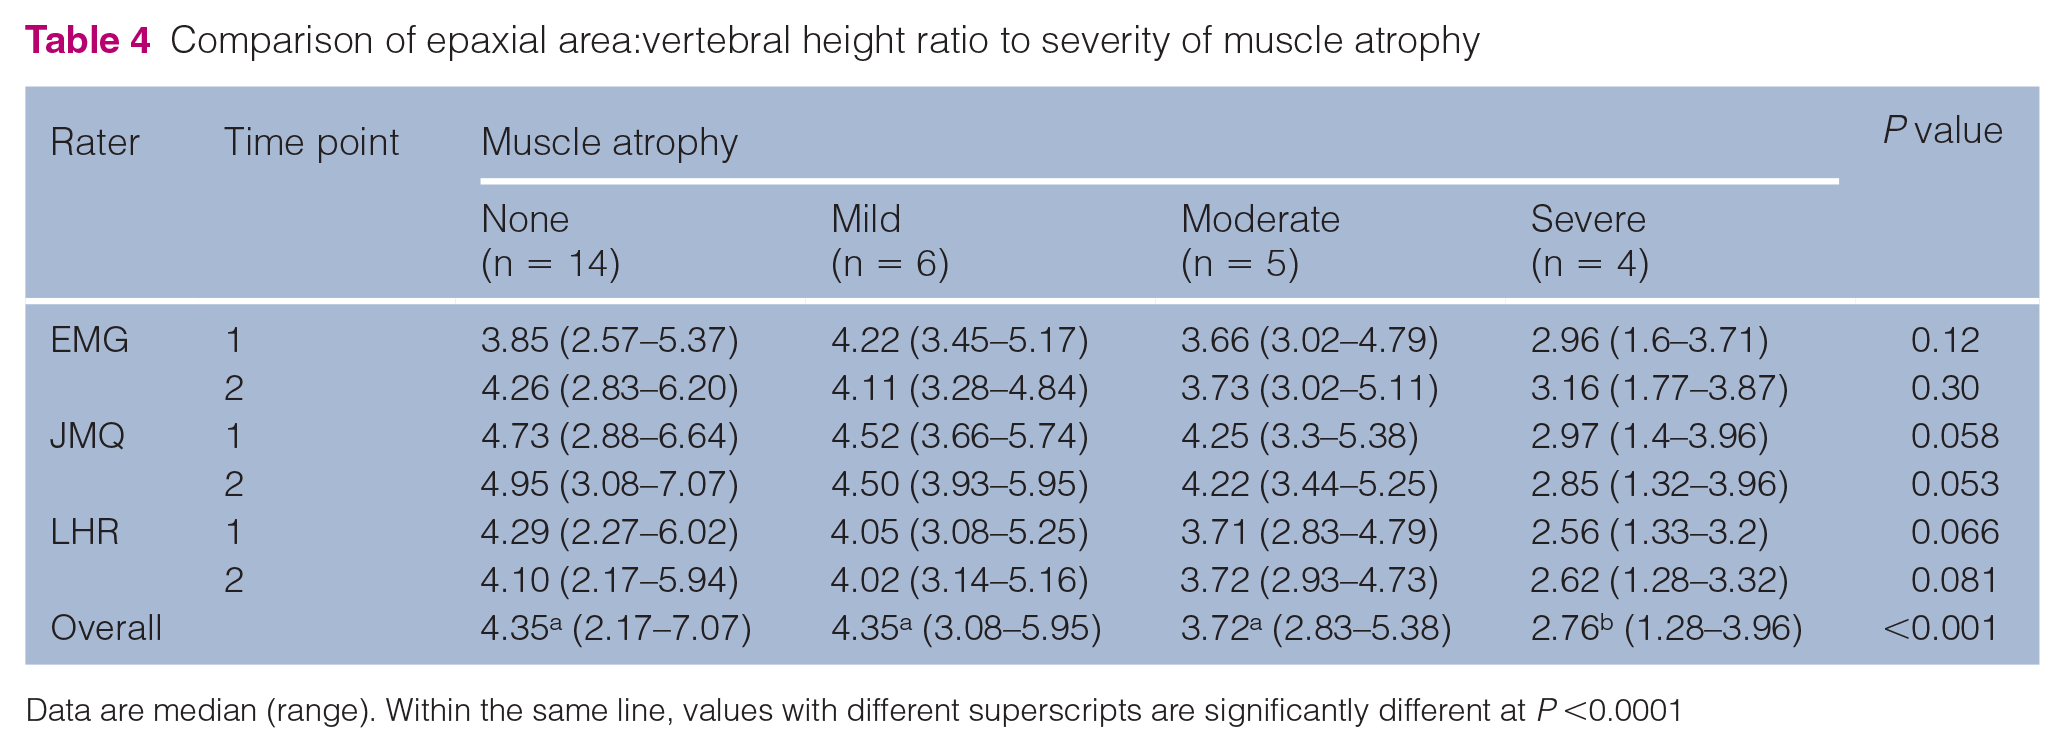
Data are median (range). Within the same line, values with different superscripts are significantly different at P <0.0001
Information on final diagnosis was available for 100/101 cats, and a definitive diagnosis was reached in 96 cats (see Table 1 in the supplementary material). Forty-three cats had one comorbidity, 15 cats had two comorbidities and four cats had three comorbidities at the time of the CT scan. Sixty-two cats had a diagnosis of neoplastic disease at the time of the CT scan, and five cats had two or more forms of neoplasia. One cat had a meningioma with pulmonary nodules, which may have been metastatic or primary pulmonary neoplasia.
Discussion
The results of this study demonstrated that measurement of cross-sectional EMA on CT images showed moderate to substantial agreement when the same observer performed the measurement at different times. Agreement was poorer when compared between observers. The side of the epaxial musculature measured did not have a significant effect on intra- or inter-rater reliability of the measurement. Radiology-specific training did not appear to influence these results, and the highest intra-rater CCC values occurred between the observers with the most (EMG) and least (LHR) radiology-specific training. This indicates that this measurement technique could be performed with consistency, even by clinicians without specific training in radiographic techniques, and could be useful in quantifying muscle mass in cats undergoing CT scan.
More bias was identified between different observers compared with one observer repeating the measurement. The largest bias identified between observers in this study was 0.66 (JMQ vs LHR, LEMA). Cats assessed to have severe muscle wasting had a median EMA of just 2.76, and the smallest EMA measured in this study was 1.02. An inter-rater bias of 0.66 represents a large percentage of the EMA of cats with very little epaxial musculature and is likely to be an unacceptable inter-rater difference if the EMA is being used in a research setting or to track muscle mass changes within a single cat being evaluated clinically. Therefore, for optimal consistency, it would be recommended to have a single observer perform measurements to compare cats with each other or to track changes in muscle condition in a single cat over time. However, it is unclear what effect training in the method would have on reliability between observers; perhaps with practice different observers would be able to achieve better agreement for the EMA than was found in the current study. Additionally, in the Bland–Altman plots comparing EMG with JMQ and JMQ with LHR, the magnitude of the bias appears to increase as the EMA increases (proportional bias). As such, calculating a single value for bias as the average difference between raters may over- or underestimate actual bias depending on the magnitude of the measured EMA.
Upon initial review of the CT images, a hypothesis was that cats with more severe muscle wasting would be more difficult to measure and would produce greater differences between observers. Although the subset of cats with recorded moderate or severe muscle wasting was too small for statistical analysis of reliability, the results shown in Figure 3 do not imply poorer inter-rater reliability with more severe muscle atrophy. On the contrary, the cats with reportedly normal muscle condition have subjectively greater sample variability in EMA, differences between time points and differences between observers. This may be due to the larger sample size in this group compared with other MCS groups, or may be due to a stock physical examination template that existed during a portion of the study period that described adequate muscle condition. If this template was not changed appropriately by the clinician on each case, cats with muscle wasting could have been erroneously recorded as being normal.
Owing to the retrospective nature of the study, only a small subset of cats had information on MCS available for analysis. However, the data demonstrated a greater decrease in EMA for cats with severe muscle atrophy than for all other groups (Figure 3 and Table 4). This finding may illustrate a difficulty in subjectively evaluating subtle differences in muscle condition until loss becomes severe, leading to an overlap in epaxial muscle indices between all but the most severely affected group.
The eventual goal of this research is to establish objective measures of lean body mass for use in both the tracking of clinical patients and in research on cachexia in veterinary patients that would allow for quantification of more subtle degrees of muscle mass loss. CT scan is performed much more commonly in clinical practice than measures directly evaluating lean body mass such as DEXA. Therefore, establishing CT-derived EMA as a sensitive marker for lean body mass could be a first step toward identifying prognostic indicators for treatment response in specific disease states, as well as possible areas of intervention to counteract cachexia. This pilot study represents the first step toward this research goal and shows that measurement of feline epaxial muscle groups at the level of T13 can be repeatably performed by the same observer. Based on our data, it is unclear whether the poor ability of EMA to distinguish between MCS groups 0–2 represents a lack of sensitivity of the EMA, a high variability in subjective MCS scoring or a combination of these effects. To answer this question, further studies evaluating this method prospectively within specific diseases states with varying degrees of muscle atrophy and compared with a ‘gold standard’ lean body mass measurement (such as DEXA) are needed.
Human studies have established cachexia as an important predictor of morbidity and mortality in multiple diseases. For example, in human cancers, cachexia has an estimated prevalence of 60–80%, and the severity of cachexia can be used as a prognostic indicator for survival, in addition to affecting tolerance of chemotherapy.1,5 In human patients with end-stage renal disease, muscle mass has been shown to decrease with worsening disease severity, and decreases in muscle mass have been associated with an increased risk of death in human patients receiving chronic dialysis.2,9
Similar studies assessing the prevalence, severity and prognostic value of cachexia in veterinary patients are lacking. In a study in cats with a diagnosis of neoplasia, muscle wasting was present, and BCS and decreased BW were found to be negative prognostic indicators for remission and survival. 6 However, MCS was not included in the prognostic analysis. Another study evaluating the effect of BW and BCS on survival of cats with heart failure identified a ‘U-shaped’ correlation between BW and survival, in which cats with the lowest and highest BW had the highest risk of death, but MCS was not evaluated in these cats. 3 Analysis of BW in cats with CKD showed a similar ‘U-shaped’ relationship: cats with the highest and lowest BW at diagnosis had the highest risk of death. 4 Again, MCS was not evaluated in this study.
Further studies investigating cachexia in cats with chronic diseases are indicated; however, performing such research requires a repeatable objective measure of LBM independent of fat mass and BW. Fat mass and LBM can vary independently in disease states in both humans and animals.6,9,14,17 Decreases in LBM may occur simultaneously with increases in fat mass, leading to stable or minimally affected BW despite progressive losses of muscle. Early or subtle decreases in LBM may be difficult to detect via changes in BW alone. BW is also affected by pathologies such as dehydration, effusion or tumor growth, which may confound identification of losses in fat and muscle mass. BCS systems are designed to detect losses in fat mass and may miss decreases in LBM, especially if subtle. 10 Muscle mass, specifically, can be evaluated on physical examination using the MCS system described by Michel et al. 10 However, this system is subjective and showed only modest correlation to LBM, as determined by DEXA. Clearly, more objective and accessible assessments of muscle condition are needed before reliable research into the effect of cachexia on morbidity and mortality in chronic disease can progress. Without such measures, cachexia progression, correlation to biomarkers of muscle breakdown and catabolism, and tracking response to therapy cannot be precisely characterized.
This study is limited by its retrospective nature. The variety of disease processes that prompted the CT scans and the small number of cats with recorded MCSs prevented the assessment of differences in EMA according to disease process and severity. Information on MCS and BCS was not available for all cats, and final diagnosis, comorbid conditions, signalment, and CT scanner and technique used to obtain the images were not controlled. It cannot be determined whether differences in image quality obtained with the different CT scanners in the study affected the raters’ ability to precisely measure the EMA. Missing MCS data points may have affected the relationship of muscle condition as observed on physical examination to EMA, but it is unlikely that they affected the observers’ ability to perform the measurements, which was the primary interest of the present study. Diagnostic work-up to determine the final diagnosis and comorbidities was also not controlled. The MCS conferred to the cats was subjective and availability was clinician-dependent, as, unfortunately, the importance of MCS documentation has yet to be fully adopted as a crucial part of physical examination.
Conclusions
Measurement of feline cross-sectional EMA on CT showed promising intra-rater reliability. However, owing to greater bias between observers, a single observer should perform measurements when comparison between cats or over time is desired. CT EMA was significantly lower in cats with severe muscle wasting as assessed on physical examination. This methodology may serve as an objective assessment of muscle mass in patients undergoing CT during diagnostic evaluation. However, further studies correlating CT-evaluated EMA to objective measures of lean BW and subjective MCSs are needed.
Supplemental Material
Supplementary Table 1
Definitive diagnoses for included cats (n = 96).
Footnotes
Author note
The results of this study were presented, in part, as a research abstract at the American College of Veterinary Internal Medicine Annual Forum, Phoenix, AZ, USA, 2019.
Supplementary material
The following file is available online:
Supplementary Table 1: Definitive diagnoses for included cats (n = 96).
Conflict of interest
The authors declared no potential conflicts of interest with respect to the research, authorship, and/or publication of this article.
Funding
This study was funded by Buttons Fund for feline CKD research.
Ethical approval
This work did not involve the use of animals and therefore ethical approval was not required.
Informed consent
This work did not involve the use of animals and therefore informed consent was not required. No animals or humans are identifiable within this publication, and therefore additional informed consent for publication was not required.
References
Supplementary Material
Please find the following supplemental material available below.
For Open Access articles published under a Creative Commons License, all supplemental material carries the same license as the article it is associated with.
For non-Open Access articles published, all supplemental material carries a non-exclusive license, and permission requests for re-use of supplemental material or any part of supplemental material shall be sent directly to the copyright owner as specified in the copyright notice associated with the article.