
Abstract
Objectives
The aim of this study was to assess serum lipoprotein profiles using rapid single-spin continuous lipoprotein density profiling (CLPDP) in healthy control cats and cats with hepatic lipidosis (HL).
Methods
Analysis of serum lipoprotein profiles using the CLPDP was performed in 23 cats with HL and 20 healthy control cats. The area under the curve for each lipoprotein fraction, triglyceride (TG)-rich lipoproteins (TRLs), low-density lipoproteins (LDLs) and high-density lipoproteins (HDLs), was calculated. Serum cholesterol and TG concentrations were measured using a clinical chemistry analyzer.
Results
Serum cholesterol and TG concentrations were not significantly different between healthy control cats and cats with HL (P = 0.5075 and P = 0.2541, respectively). LDL content was significantly higher in cats with HL than in healthy control cats (P = 0.0001), while HDL content was significantly lower in cats with HL than in healthy control cats (P = 0.0032). TRL content was not significantly different between the two groups (P = 0.0699). The specific fraction (1.037–1.043 g/ml) within nominal LDL in serum distinguished healthy control cats from cats with HL with a sensitivity of 87% and a specificity of 90%.
Conclusions and relevance
Serum lipoprotein profiles were altered in cats with HL, even though serum cholesterol and TG concentrations were not significantly different compared with healthy control cats. The CLPDP might be a useful tool for assessing lipid metabolism in cats with HL.
Introduction
Feline hepatic lipidosis (HL) is the most common hepatobiliary disease in cats and is characterized by excessive accumulation of lipid within hepatocytes, which can lead to intrahepatic cholestasis and severe hepatic dysfunction. 1 One study in cats with idiopathic hepatic lipidosis showed that 34% of hepatic mass was triglycerides (TGs) vs 1% in healthy control cats. 2 The development of feline HL is associated with a period of anorexia. 1
Although the pathophysiology of feline HL is complex and still not completely understood, it is known that intense adipose tissue lipolysis and alterations in hepatocellular lipid metabolism occur during anorexia, leading to TG accumulation in the hepatocytes. 3 A previous study showed that cats with HL had increased plasma non-esterified fatty acids (NEFAs) vs healthy cats. 4 In addition, similarities were reported in the fatty acid composition (eg, stearate, oleate, linoleate and linolenate) of both liver and adipose tissues in cats with HL, which supports the notion of the mobilization of fatty acids from adipose tissue to the liver. 2 The literature suggests that cats with HL have enhanced very-low-density lipoprotein (VLDL) assembly in the liver owing to increased TG synthesis led by excessive mobilization of fatty acids from adipose tissues to the liver. However, the relationship between HL and VLDL kinetics is not clear because of conflicting results of both increased and decreased plasma TG or VLDL concentrations from different studies.4–7 The liver is central to lipid and lipoprotein metabolism. A recent retrospective study by Kuzi et al found that impaired liver function was predictive of mortality, as was hypocholesterolemia. 7 These previous reports suggest that assessment of the complete continuous density distribution of lipoproteins – the lipoprotein profile – would aid in understanding lipid metabolism in cats with HL.
Previous studies have used either sequential or continuous-density gradient ultracentrifugation methodology to study dyslipidemia in feline HL.4,6,8 Those earlier methodologies required larger sample volume, long centrifugation times (>24 h) followed by measurement of lipid concentrations (eg, TG or cholesterol) in isolated fractions by enzymatic assays or colormetric stains. In contrast, continuous lipoprotein density profiling (CLPDP) was developed to simplify gradient formation and increase sensitivity of density distribution imaging. 9 The CLPDP method uses a self-generating density gradient solution, bismuth sodium EDTA (NaBiEDTA) and a fluorescent probe, N-[7-(4-nitrobenzo-2-oxa-1,3-diazole)]-6-aminocaproyl-D-erythro-sphingosine (NBD C6-ceramide).9,10 The advantages of this technique are that it requires only one ultracentrifugation, lasting 6 h, and allows immediate visualization of a continuous distribution of lipoproteins (lipoprotein profile). This imaging allows quantification of the lipoprotein subfraction masses by calculating the area under the curve (AUC).
Demacker et al used an older continuous-density gradient technique to characterize lipoproteins in healthy cats and showed that cats and humans have similar lipoprotein density cut-off intervals. 8 However, the distribution of lipids among density classes differ as cats are high-density lipoprotein (HDL)-dominant species. 11 This group also noted that feline low-density lipoprotein (LDL) was smaller than human LDL, whereas HDL of both species migrated a similar distance on gradient gel electrophoresis but did not provide actual dimensions of these particles as might be determined by transmission electron microscopy (TEM). 8
We hypothesized that cats with HL would possess altered serum lipoprotein profiles using the CLPDP compared with healthy control cats owing to intensive peripheral lipolysis in adipose tissue and alterations in hepatocellular lipid metabolism. The objective of our study was to compare lipoprotein profiles in healthy control cats and cats with HL using CLPDP to examine the disease-associated changes in their lipid profile. Prior to the assessment of lipoprotein profiles, we examined the shapes and diameters of feline lipoproteins separated by the CLPDP with TEM. In addition, a receiver–operating characteristic (ROC) curve was generated to determine a sensitivity and a specificity of identified changes in density distribution to distinguish healthy control cats from cats with HL.
Materials and methods
Sample population
Twenty privately owned healthy cats and 23 cats with HL were enrolled into the study. The study protocol was approved by the Institutional Animal Care and Use Committee (IACUC) of Texas A&M University (AUP2012-241) and written informed consent was obtained from all owners of the enrolled cats. Healthy cats had no clinical signs (eg, vomiting, diarrhea and anorexia) within 3 months prior to the study enrollment and were defined as healthy controls based on physical examination, a serum chemistry profile (ie, glucose, blood urea nitrogen, creatinine, calcium, phosphorus, albumin, globulin, total protein, total bilirubin, alkaline phosphatase [ALP], alanine aminotransferase [ALT], aspartate aminotransferase, gamma-glutamyl transferase, cholesterol and TG) and urinalysis collected by cystocentesis. Food was withheld for at least 12 h prior to the blood collection in healthy control cats.
Cats with HL were presented with various conditions and consequent diagnostic work-up was not standardized. However, diagnosis of feline HL was made based on a combination of consistent clinical findings (eg, vomiting, anorexia, weakness or weight loss), consistent laboratory findings (eg, elevated bilirubin, ALP or ALT), consistent abdominal ultrasound findings (eg, diffusely hyperechoic liver) in the absence of hemolysis and extrahepatic bile duct obstruction and the diagnosis of lipid-type vacuolation on cytological evaluation of the liver. The evaluation of cats for potential underlying disorders was left to the discretion of their attending veterinarians. Food was not withheld for the purpose of this study in cats with HL. However, most cats were anorexic and had not eaten for about 8–12 h prior to admission by the owner. The blood samples were collected into tubes without an anticoagulant and left at room temperature for at least 40 mins. The samples were then centrifuged for 15 mins at 1600 g and 20°C, and sera were removed from the tubes. Serum samples were transported with ice packs to the gastrointestinal laboratory at Texas A&M University. Serum samples were kept at −80°C until lipoprotein profiling. The CLPDP for both healthy control cats and cats with HL was performed within 3 months of sample collection.
Measurement of serum cholesterol and TG concentrations
Serum cholesterol (Stanbio Cholesterol LiquiColor) and TG (Stanbio Triglyceride LiquiColor) concentrations were measured using a clinical chemistry analyzer (Stanbio; Sirrus).
Assessment of lipoprotein profiles
Lipoprotein profiles were assessed using the CLPDP technique. 12 In brief, 1280 µl of 0.18 M NaBiEDTA density solution (Tokyo Chemical Industry) was mixed with 10 µl serum and 10 µl NBD C6-ceramide (Cayman Chemical Company). Then, 1150 µl of the mixture was transferred into a polycarbonate centrifuge tube (Beckman Coulter). The sample tubes were centrifuged at 867,747 g and 4ºC for 6 h in an ultracentrifuge (Optima MAX-LP; Beckman Coulter) with a fixed-angle rotor (MLA-130; Beckman Coulter). After centrifugation, the tubes were immediately imaged by a fluorescence imaging system consisting of a digital camera (Quantifire XI; Optronics) and a metal halide continuous light source (Dolan-Jenner Industries). Following ultracentrifugation, the image of each tube was converted to a density profile using a software program (OriginPro7.5; OriginLab). The tube coordinate (mm) on the x-axis of the lipoprotein profile corresponded to an actual centrifuge tube coordinate (mm). Zero millimetres indicated the top of the tube and 33 mm indicated the bottom of the tube. The average intensity of fluorescence was plotted on the y-axis to produce a lipoprotein profile. The less-dense particles, such as TG-rich lipoproteins (TRLs), migrated near the top of the tube, whereas more dense particles, such as HDLs, migrated towards the bottom of the tube.A numbering nomenclature was created for statistical analysis (Table 1). Subfraction #1 (F1) was determined based on the first peak (d <1.019 g/ml), which corresponds to TRLs, such as chylomicrons and VLDLs. Subfractions #2 (F2) to #11 (F11) were created by measuring the density of the solution collected every 2 mm (tube coordinate) from the top of the tube. Total lipoprotein intensity and fractional intensities of each region (F1–F11) were determined by measuring the pixel value of the AUC of the entire fluorescence trace and each region (F1–F11), respectively. In addition, AUCs for nominal TRLs, LDLs and HDLs were determined based on the density ranges of d <1.019 g/ml (F1), 1.019–1.065 g/ml (F2–8) and 1.065–1.178 g/ml (F9–11), respectively. Each AUC value was normalized by the total AUC and presented as AUC%.
Nomenclature for lipoprotein profiling

This table shows the density interval (g/ml) of each fraction, its physical location in the vertical axis of the tube (mm) and determined density assignment of the 11 fractions
TRL = triglyceride-rich lipoproteins; LDL = low-density lipoprotein; HDL = high-density lipoprotein
Lipoprotein diameters
A blood sample was obtained from a healthy cat. The study protocol was approved by the IACUC of Texas A&M University (AUP2017-0190CA). The cat was fed commercial dry food 1 h prior to the blood collection. The blood sample was collected in a serum tube without any additives and left at room temperature for at least 40 mins. The sample was then centrifuged for 15 mins at 1600 g and 20°C. After centrifugation, 10 µl of serum and 1280 µl of the NaBiEDTA density solution were mixed well. The sample solution was centrifuged at 867,747 g for 6 h at 4°C. After centrifugation, two fractions corresponding to nominal LDL and HDL ranges were manually removed from the top of the tube by a pipette based on the tube coordinate (mm). Each fraction was desalted using a 0.15 M sodium chloride solution and a centrifugal filter, Amicon Ultra-0.5ml (MilliporeSigma). After desalting, the fractions were stored at 4°C until further analysis. The particles in each fraction of feline serum were adsorbed to a carbon-filmed grid and negatively stained with 2% phosphotungstate. The grids were examined with TEM (Philips Morgagni 268 TEM) and representative fields were imaged at a magnification of × 180,000. The diameters of 600 particles in each fraction were measured by an image processing program (ImageJ).13,14
Statistics
The normality distribution of the data was assessed based on a Shapiro–Wilk test and visual inspection. A non-parametric test (Wilcoxon rank sum test) and parametric test (two-sample t-test) were performed where appropriate. A χ2 test was performed to test homogeneity on sex and breeds of the sample population. Significance was set at P <0.05. A metabolomic data analysis software, MetaboAnalyst 3.0, 15 was used to generate a principal component analysis (PCA) plot in order to show the clustering/overlap among lipoprotein profiles based on %AUCs of 11 subfractions in healthy control cats and cats with HL. A ROC curve was used to calculate sensitivity and specificity at an optimal cut-off AUC% of individual lipoprotein fractions that differed significantly between healthy control cats and cats with HL.
Results
Study population
Table 2 shows the breeds, sex, sexual status and age of the healthy control cats and cats with HL. The breeds and sex did not significantly differ between healthy cats and cats with HL. Age distribution significantly differed between healthy cats (mean ± SD 5.3 ± 2.9) and cats with HL (mean ± SD 7.8 ± 3.2; P = 0.011). Cytological evaluation of the liver included severe lipid type vacuolation consistent with feline HL (n = 23), mild cholestasis (n = 8), inflammatory response (n = 3), bile duct hyperplasia (n = 1), lymphoma (n = 1) and histoplasmosis (n = 1).
Signalment of healthy control cats and cats with hepatic lipidosis (HL)
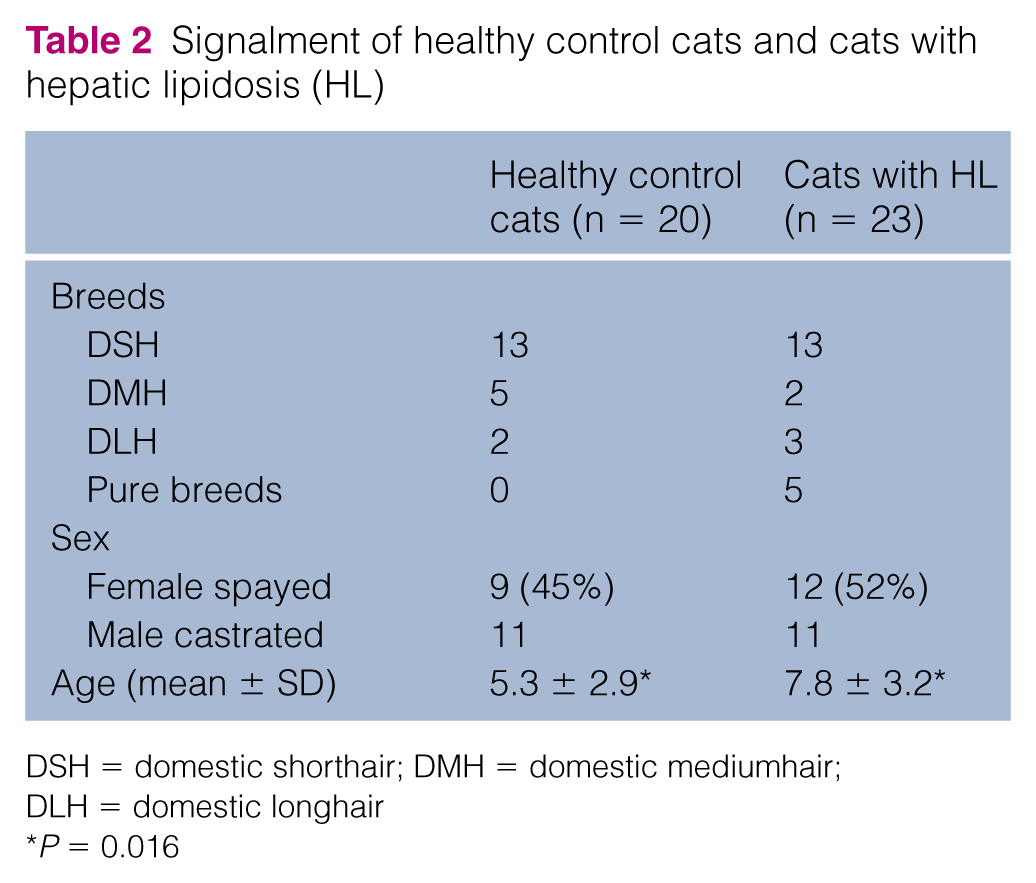
DSH = domestic shorthair; DMH = domestic mediumhair; DLH = domestic longhair
P = 0.016
Measurement of serum cholesterol and TG concentrations
Serum cholesterol concentrations (reference interval [RI] 73–265 g/ml) did not significantly differ between healthy cats (mean ± SD 172 ± 42 g/ml) and cats with HL (mean ± SD 189 ± 98 g/ml; P = 0.46). We were not able to obtain TG concentrations in two cats with HL. Serum TG concentrations (RI 25–133 g/ml) did not significantly differ between healthy cats (median 78 g/ml [range 32–281 g/ml]) and cats with HL (median 102 g/ml [range 38–1300 g/ml]; P = 0.25).
Lipoprotein profiles
Figures 1 and 2 display overlay lipoprotein profiles for healthy control cats and cats with HL, respectively. The figures demonstrate that cats with HL have markedly different lipoprotein profiles than healthy control cats. Large LDLs appeared as a different feature in the lipoprotein profiles of cats with HL in combination with a reduction in HDLs. The PCA plot (Figure 3) shows the closely clustered values of healthy control cats, which reflects the nearly uniform lipoprotein profiles of this group. However, the lipoprotein profiles of cats with HL were divergent from one another. According to the PCA plot, 10 cats with HL showed lipoprotein profiles similar to the ones observed in healthy control cats.

Overlay of lipoprotein profiles from 20 healthy control cats. The x-axis shows the tube coordinate (mm) and the y-axis displays the fluorescent intensity. Most cats had similar patterns characterized by a high peak at subfraction #10
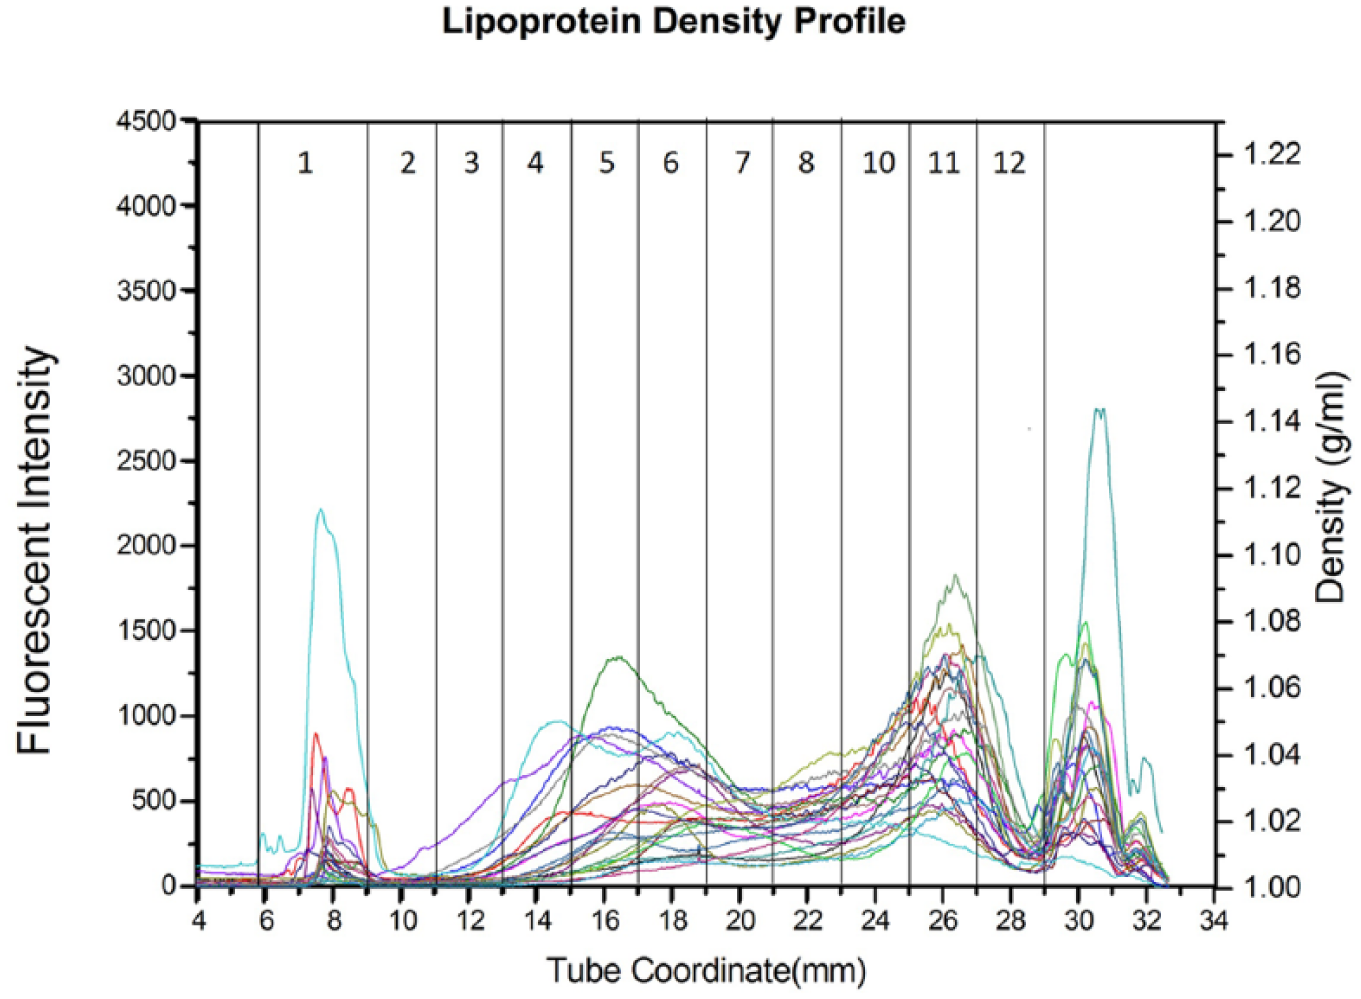
Overlay of lipoprotein profiles from 23 cats with hepatic lipidosis
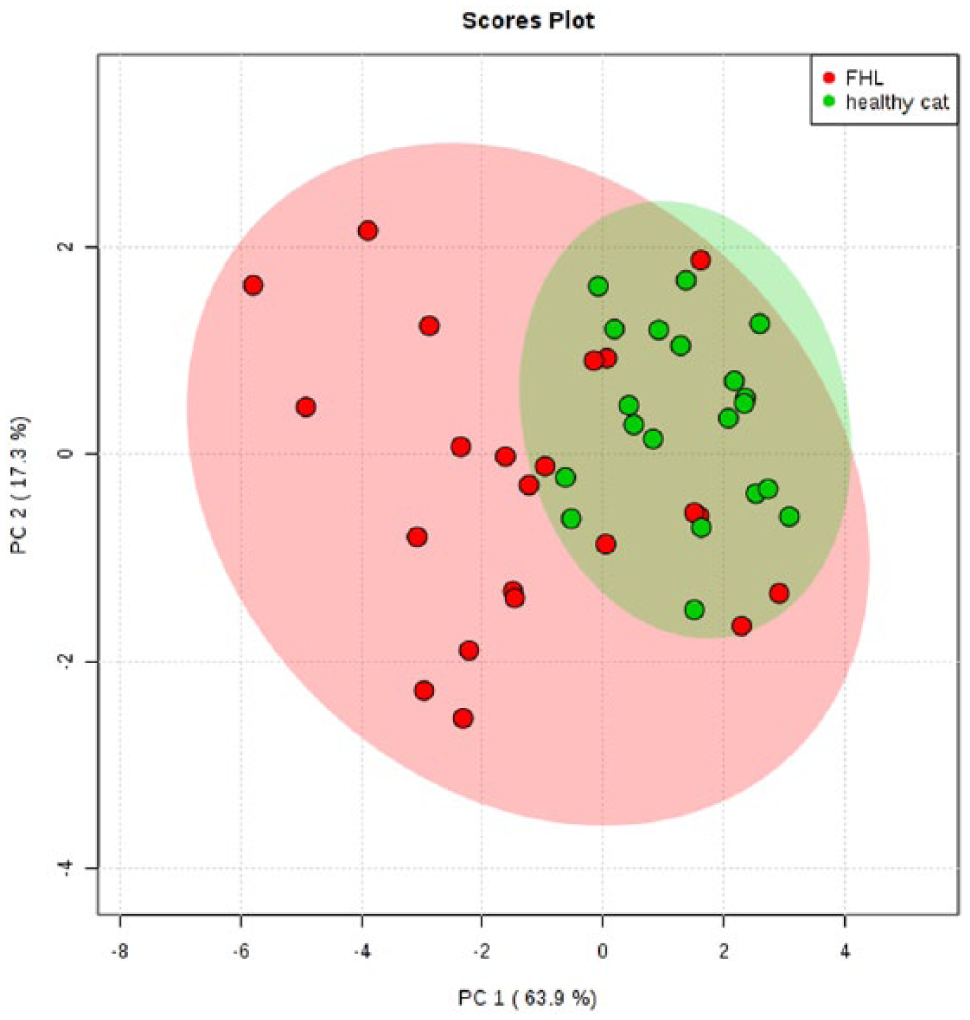
Principal component analysis plot showing the relationship of lipoprotein profiles between healthy control cats (green) and cats with hepatic lipidosis (red). Ninety-five percent confidence regions are displayed with each representative color
The AUC% for each fraction from F2 to F7 in cats with HL was significantly higher than those in healthy cats, with P values ranging from <0.03 to <0.0001. In contrast, the AUC% for each fraction from F9 to F11 in cats with HL were significantly lower than those in healthy control cats, with P values ranging from <0.0002 to <0.0001. The AUC of the nominal TRL fraction did not significantly differ between healthy control cats and cats with HL (P = 0.0796). The AUC of nominal LDLs and total AUC of cats with HL were significantly greater than those of healthy control cats (P <0.0001 and P = 0.0263, respectively). The AUC of nominal HDLs in cats with HL was significantly lower than that in healthy control cats (P = 0.00911). When each AUC was normalized to the total AUC (AUC%), the AUC% of nominal TRLs did not significantly differ between healthy control cats and cats with HL (P = 0.2525). However, cats with HL had a significantly greater proportion of LDLs (AUC%) than healthy control cats (P <0.0001; Figure 4). Also, the AUC% of nominal HDLs in cats with HL was significantly lower than healthy control cats (P <0.0001; Figure 5).

Comparison of area under the curve (AUC)% for low-density lipoproteins (LDL) between healthy control cats and cats with hepatic lipidosis (FHL). P <0.0001
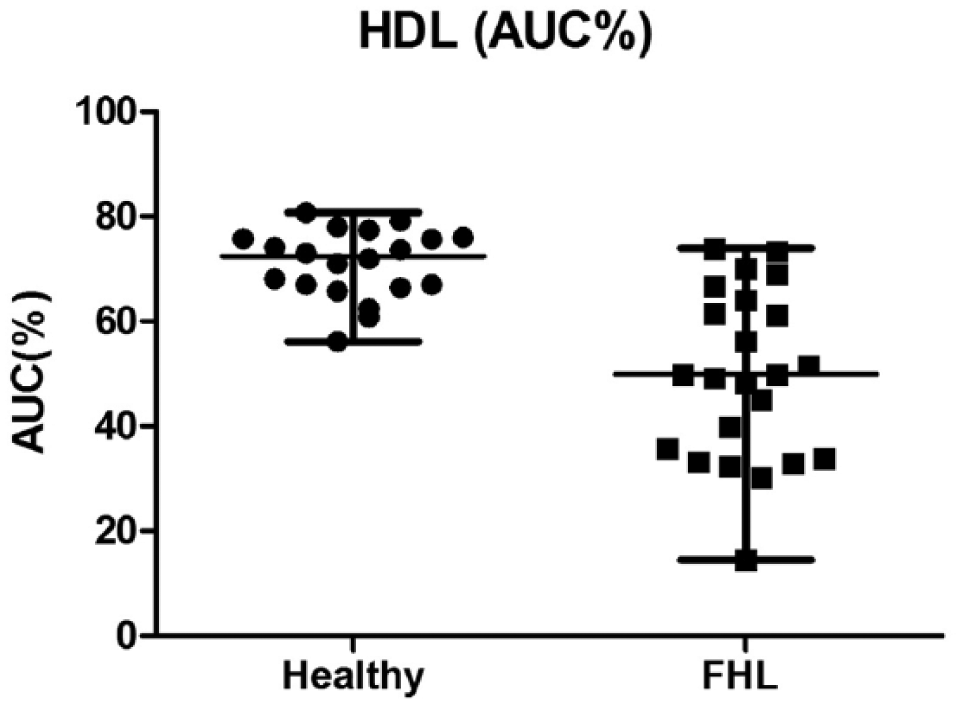
Comparison of area under the curve (AUC)% for high-density lipoproteins (HDL) between healthy control cats and cats with hepatic lipidosis (FHL). P <0.0001
Of 11 subfractions, the AUC% of F6 (1.037–1.043 g/ml; Figure 6) distinguished cats with HL from healthy control cats at an optimal cut-off of 7.6% with a sensitivity of 87% (95% confidence interval [CI] 73–100%), a specificity of 90% (95% CI 80–100%) and an area under the ROC curve of 93% (95% CI 84–99%; Figure 7).

Comparison of fraction 6 (F6) between healthy control cats and cats with hepatic lipidosis (FHL)

Area under the curve (AUC)% of fraction 6 (F6: 1.037–1.043 g/ml) distinguished cats with hepatic lipidosis from healthy control cats at an optimal cut-off of 7.6% with a sensitivity of 87%, a specificity of 90% and an area under the receiver–operating characteristic curve of 93%
Table 3 summarizes serum cholesterol, TG concentrations and F6 values between healthy control cats and cats with HL. Twenty-five percent of cats with HL had serum cholesterol concentrations above the RI vs 5% in healthy control cats (P = 0.065). Also, 33% of cats with HL had serum TG concentrations above the RI, whereas it was 15% in healthy control cats (P = 0.182). In cats with HL, 85% of the cats had F6 above 7.6% vs 10% in healthy control cats (P <0.0001).
Number and percentage of the cats that had serum cholesterol and triglyceride concentrations above the reference interval, and F6 above the cut-off value of 7.6%

χ2 test was performed. Data are n (%)
HL = hepatic lipidosis; F6 = fraction #6, the ratio indicates (number of cats that had above the reference interval)/(total number of cats in each group), percentage
TEM
Electron microscopy examination showed spherical particles in both LDL and HDL density ranges. The particles within the density range of nominal LDLs (1.019–1.065 g/ml) ranged in size from 7.6–34.6 nm (median 12.6 nm; Figures 8 and 9). The particles within the density range of nominal HDLs (1.065–1.178 g/ml) ranged in size from 8.3–16.2 nm (median 9.9 nm; Figures 10 and 11). Approximately 83% of lipoproteins within the LDL range were 9–16 nm in diameter, whereas more than 90% of lipoproteins within the HDL range were 9–11 nm in diameter.

Distribution of diameters (nm) of feline lipoproteins within the density range of nominal low-density lipoprotein (1.019–1.065 g/ml). The diameters of 600 particles from each density range were measured
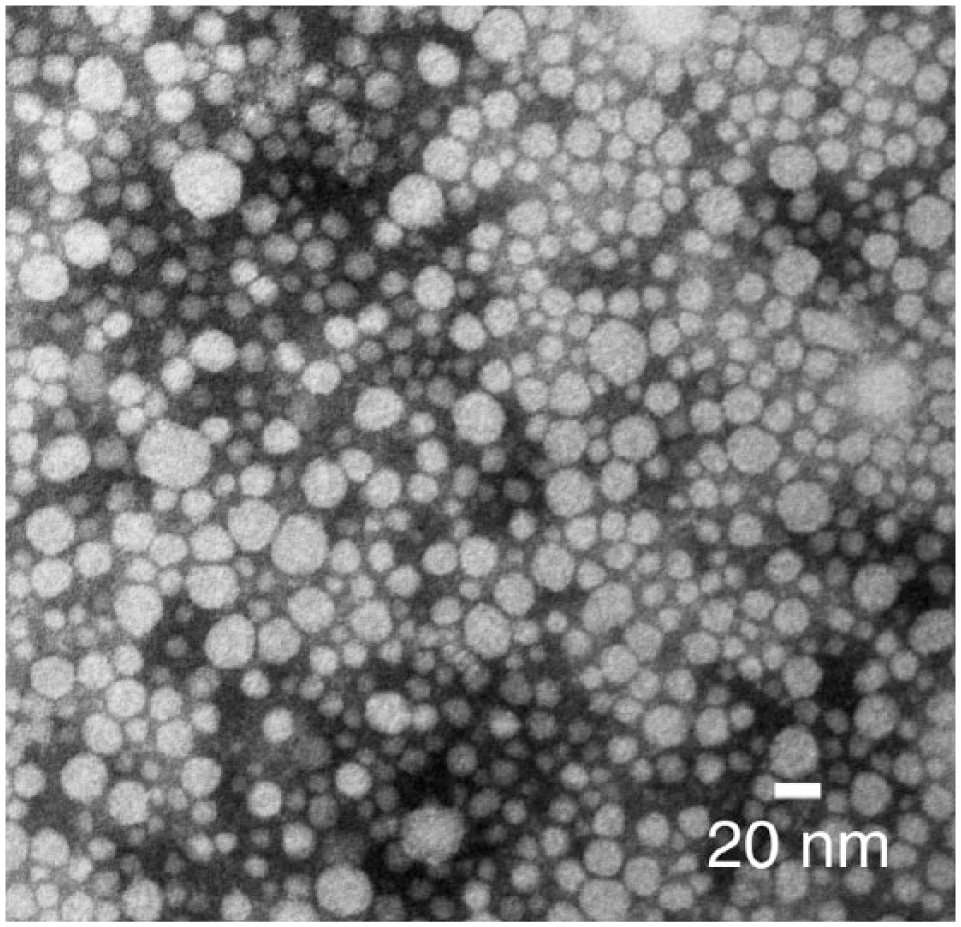
Negatively stained (2% phosphotungstate) feline lipoproteins of the density range of nominal low-density lipoprotein (1.019–1.065 g/ml)

Distribution of diameters (nm) of feline lipoproteins within the density range of nominal high-density lipoprotein (1.065–1.178 g/ml). The diameters of 600 particles from each density range were measured

Negatively stained (2% phosphotungstate) feline lipoproteins of the density range of nominal high-density lipoprotein (1.065–1.178 g/ml)
Discussion
Although the pathophysiology of feline HL is not completely understood, it is currently thought that increased NEFAs mobilized from peripheral tissue due to excessive lipolysis play a pivotal role in initiating the alternation in lipoprotein metabolism in cats with HL. 3 In the present study, we successfully used CLPDP to demonstrate the marked differences in lipoprotein profiles between healthy control cats and cats with HL. We identified a complex dyslipidemia characterized by increased LDLs and decreased HDLs. This dyslipidemia occurred despite similar serum concentrations of cholesterol and TG between healthy control cats and cats with HL.
Cats with HL in the present study had significantly higher amounts and proportions of LDLs compared with healthy control cats, whereas TRLs (VLDLs), as well as serum TG concentrations, did not significantly differ between healthy control cats and cats with HL. It has been proposed that various hormones during the prolonged anorexia, such as glucagon, corticosteroids, adrenocorticotropic hormone or catecholamines, excessively activate hormone-sensitive lipase that regulates lipolysis in adipocytes. 1 Triacylglycerol in adipocytes is hydrolyzed into three molecules of fatty acid and one of glycerol. The NEFAs released from adipose tissue are bound to plasma albumin in the circulation and are taken up either by muscle cells for energy production through beta-oxidation or by the liver for synthesis and/or storage of acylglycerols.16,17 The NEFAs entering the liver can either be metabolized to ketones or resynthesized into acylglycerols, which are assembled and secreted as VLDLs. 1 High rates of NEFAs metabolism can cause liver damage through mitochondrial reactive oxygen production.18,19 In addition, it has been reported that in humans and rats albumin unbound-NEFAs in the blood have cytotoxicity on multiple tissues including skeletal and cardiac myocytes, hepatocytes and pancreatic beta cells, leading to cellular dysfunction and injury.17,20–22 A previous study showed that plasma NEFA concentrations in cats with HL were increased vs healthy cats. 4 As liver function becomes compromised, albumin synthesis is impaired, leading to hypoproteinemia and hypoalbuminemia. 7 That being said, plasma concentrations of albumin unbound NEFAs might be increased in feline HL cases with hypoalbuminemia, contributing to disease progression of HL. In fact, Kuzi et al found hypoproteinemia and hypoalbuminemia to be significant prognosticators of mortality of feline HL. 7
The finding of an increased serum VLDL mass in some studies suggests that even though the liver is able to respond to excessive influx of NEFAs by increasing secretion of VLDLs, its response may be inadequate to prevent hepatic steatosis in some cats, that is, hepatic TG formation exceeds its secretion through the formation of VLDLs. VLDLs are hydrolyzed to VLDL remnants in peripheral tissues and further metabolized by hepatic lipase to become LDLs. 23 However, in the present study, serum TG concentrations and TRL levels did not significantly differ between healthy control cats and cats with HL. Non-elevated serum TG concentrations in cats with HL was also found in a previous study. 5 These findings suggest that the liver might have a limited capacity of VLDL secretion when hepatic TG accumulation was excessive in cats with HL.5,24 In addition, the presence of increased amounts and proportion of LDLs might indicate that VLDL secretion had previously been elevated even if the admitting blood work showed no current TG or TRL elevation. 25 The authors speculate that this may be due, in part, to the shorter half-life of VLDLs vs LDLs. Thus, VLDL secretion and circulating TG concentrations may increase early in feline HL and then decrease as the disease progresses. However, further studies are needed to determine whether or not this is the case.
The current study also shows that cats with HL have significantly lower serum HDLs compared with healthy control cats. 26 HDLs are assembled with apolipoprotein AI (apoAI). 27 Lipid-poor apoAI is secreted from the liver and intestines, and acquires phospholipids and free cholesterol from peripheral tissues and TRLs to become mature HDLs. The mechanism of reduced HDLs in cats with HL is still unknown. In humans, reduced HDLs is a common feature in hypertriglyceridemia, especially in conjunction with insulin resistance. 28 Obesity is one of the predisposing factors to develop feline HL, 3 and obesity in humans is often associated with dyslipidemia featuring decreased HDL cholesterol. Hepatic lipase that hydrolyzes TG-rich HDL shows increased activity in humans with obesity. 29 During hydrolysis of HDLs mediated by hepatic lipase, lipid-poor apoA1 is released from HDLs particles. Even though lipid-poor apoAI can be used to form HDL particles, it is also cleared by the kidney. 30 This renal apoAI loss is one of the mechanisms that could contribute to the reduced HDLs that we observed in cats with HL. In addition, apoAI synthesis in the liver might be impaired as a result of HL. Further studies to assess hepatic lipase activity and urinary apoAI loss in cats with HL are warranted.
Measurement of preprandial serum cholesterol and TG concentrations is currently the standard for diagnosing lipid abnormalities and assessing response to treatment. 31 In the current study, serum TG and cholesterol concentrations were similar in healthy control cats and cats with HL, suggesting that both are of limited use for assessing lipid metabolism in this disease. Both density distributions (overlay graphs) and PCA plots showed a high degree of similarity for healthy control cats. In marked contrast, the profiles of cats with HL were divergent from one another and often differed dramatically from those of healthy control cats. ROC analysis showed that lipoprotein density fraction #6 (F6; d = 1.037–1.043 g/ml) with a cut-off value of 7.6% had a sensitivity of 87% and a specificity of 90% for distinguishing healthy control cats and cats with HL. This is the region that Demacker et al reported as feline LDL, which carried 14% of plasma cholesterol. 8 Future studies to identify whether particular lipids or apolipoproteins are contained in these particles might provide insight into the pathophysiology of HL or support development of additional treatment strategies. Interestingly, Valtolina et al identified changes in fatty acid compositions associated with feline HL. 5 Lipidomic assessment of the LDL fractions identified here may be warranted.
The advantages of the CLPDP technique include a shorter centrifugation time (6 h) and the ability to immediately visualize lipoprotein density distributions. Moreover, the use of a fluorescent probe reduces sample volume requirements and direct imaging of density profiles obviates the need for additional chemical measurements. The CLPDP was initially developed to analyze lipoprotein density distributions (lipoprotein profile) in human plasma. Later, this technique was used to analyze lipoprotein profiles in dogs, 10 as well as other species.32,33 In the present study, electron microscopic examination showed that feline lipoproteins were spherical and the diameters of the majority of lipoproteins that fell into the LDL density range were larger than those that fell into the HDL density range as has also been reported in humans and dogs.34,35 In addition, feline lipoproteins in this study were smaller in diameter than what has previously been reported for lipoproteins in humans and dogs.34,35 These findings suggest that the CLPDP separates feline lipoproteins well and can be used to evaluate lipoprotein density distributions or prepare fractions for further analysis.
There were some limitations to this study. We examined serum lipoproteins with TEM only from one healthy cat; thus, this result might not represent lipoprotein sizes in other healthy cats. A larger sample size is needed to further investigate average diameters of feline lipoproteins. The other limitations of this study include that we were not able to obtain body condition scores from all enrolled cats, meaning that some of healthy control cats might have been obese and might have affected interpretation of the results. In addition, we were unable to collect follow-up samples from the cats with HL. Additional samples from follow-up check-ups would provide insight into how lipid metabolism changes in response to treatment and would help to investigate whether the lipoprotein profile result might serve as a prognostic marker for cats with HL.
Conclusions
In the present study, we used CLPDP to show that cats with HL had altered lipoprotein profiles with elevated LDL and decreased HDL levels vs healthy control cats. These significant density redistributions occurred despite the similarity of serum TG and cholesterol concentrations between healthy cats and cats with HL. Amounts of lipid within the d = 1.037–1.043 g/ml fraction of serum (fraction #6) distinguished healthy control cats from cats with HL at a cut-off of 7.6% with a sensitivity of 87% and a specificity of 90%.
Footnotes
Author note
This paper was presented in part at the 2017 American College of Veterinary Internal Medicine Forum.
Conflict of interest
The authors declared no potential conflicts of interest with respect to the research, authorship, and/or publication of this article.
Funding
The authors received no financial support for the research, authorship, and/or publication of this article.