
Abstract
Objectives
The objective of this study was to develop a valid, reliable, web-based generic feline health-related quality-of-life (HRQoL) questionnaire instrument to measure the affective impact of chronic disease.
Methods
A large initial item pool, obtained through interviews with cat owners, was reduced using predetermined criteria, survey scores for relevance and clarity, and the ability of individual items to discriminate between healthy and sick cats when owners completed a prototype questionnaire. Using these data, factor analysis was used to derive a scoring algorithm and provide evidence for factorial validity. Validity was demonstrated further in a field trial using a ‘known groups’ approach (sick vs healthy cats will have a different HRQoL profile, and the HRQoL profile of cats will deteriorate as comorbidities increase). Test–retest reliability was assessed using intra-class correlation coefficients (ICCs).
Results
In total, 165 items were reduced to 20 and, on the basis of a factor analysis that explained 72.3% of the variation in scores input by 71 owners of 30 healthy and 41 sick cats using the prototype, these were allocated to three domains (vitality, comfort and emotional wellbeing [EWB]) with a scoring algorithm derived using item loadings. Subsequently, the owners of 36 healthy and 58 sick cats completed one or two (n = 48) assessments. Median scores (healthy vs sick) for all domains were significantly different (P <0.001), 78% of cats were correctly classified as healthy or sick and for comorbidities the correlation coefficients were moderate (vitality 0.64; comfort 0.63; EWB 0.50). Test–retest reliability was good (ICC vitality 0.635; comfort 0.716; EWB 0.853).
Conclusions and relevance
This study provides initial evidence for the validity and reliability of a novel HRQoL instrument to aid the assessment and management of chronic diseases of cats.
Introduction
It is the unpleasant feelings (affective component) associated with chronic disease that cause an individual to suffer. The medical profession recognises the importance of the valid and reliable measurement of how people feel and has addressed this through the development of instruments to measure health-related quality of life (HRQoL) for disease detection (discriminative purposes) or to measure change in health status over time (evaluative purposes). 1 Structured questionnaire instruments are developed and tested using well-established psychometric methodology.2–4
Instruments to measure HRQoL in companion animals consist of questions for the owner, who is well placed to report on the subtle changes in behaviour, attitude and demeanour that occur with chronic disease. While several feline disease-specific instruments exist,5–9 to date no validated generic HRQoL instrument exists for the purpose of comparing treatments or disease states. 10 A generic instrument (CHEW [Cat HEalth and Wellbeing]), based on owner-perceived health status has been reported, 11 but not validated, in sick cats. Similarly CatQol (Bijsmans) focuses on general health, eating, behaviour and management, but has been validated only in cats with chronic kidney disease (CKD). 12 More recently, Tatlock et al have described an owner-reported feline quality-of-life (QoL) scale for healthy cats. 13
Briefly, the psychometric approach to instrument design consists of the generation of a pool of items (questions), most often through interviews with key informants, reduction of these by various techniques, including expert judgement of the relevance and adequacy of items, 14 the identification of items that do not discriminate well between known groups of subjects, 15 and the use of a statistical technique called factor analysis (FA), 16 before pretesting and then testing for validity and reliability.
Evidence for any new instrument’s validity and reliability is essential before use in a clinical context. Various kinds of validity may be sought. For example, content validity is a measure of the extent to which the items included in a questionnaire are relevant and adequate for its purpose: it is established during its construction and assessed by expert judgement. Criterion validity is the agreement of a new instrument with some existing ‘gold standard’, but where that does not exist, evidence can be gathered to support concurrent criterion validity (comparison with a validated measure of a related construct) or predictive criterion validity where performance of the new measure successfully predicts that of a later measure. Construct validity – evidence that the instrument is measuring the construct that it is intended to measure – is considered to be the most robust and fundamental form of validity. 1
A construct is something that is not directly observable or measurable, such as ‘happiness’. The construct being measured here is HRQoL, which is the subjective evaluation by an individual of its circumstances, which include an altered health state and the impact of related interventions. 17 Construct validity is established by a process of hypothesis testing, where hypotheses are based upon how an instrument should perform if it is measuring the construct of interest. For example, factorial validity applies if FA of data generated using the instrument reveals an interpretable factor structure that fits the construct the instrument was designed to measure. 18 In a ‘known-groups’ approach to construct validation, predictions are made about how scores obtained with the instrument will differ between groups, such as healthy and sick animals, or will reflect disease burden, and these predictions are tested.
A reliable instrument will produce the same score when an unchanging subject is measured at two time points by the same observer (repeatability/intra-rater reliability), or when two people measure the same subject at one time (reproducibility/inter-rater reliability). 2
Previously a novel generic instrument to measure HRQoL in dogs was developed in which most of the items reported aspects of behaviour that owners believed were expressions of a dog’s subjective experience (feelings),17,19 and evidence for the validity and reliability of a web-based version was reported. 15 Subsequent shortening resulted in a 22-item instrument that retains the capacity of the prototype to measure the animal’s feelings. 20 The aim of this study was to develop an equivalent generic instrument for cats and to provide first evidence for its content validity, construct validity and intra-rater reliability.
Materials and methods
Ethical approval was granted by the University of Glasgow, and all participants gave informed consent.
Item generation and initial selection
Semi-structured interviews were conducted with the owners of healthy cats and cats with conditions likely to affect QoL, recruited through the University of Glasgow Small Animal Hospital (UGSAH) and several veterinary practices. The interviews were recorded and transcribed verbatim to generate items consisting of terms and phrases used by interviewees to describe their cats when healthy and sick. Interviews were continued until no new information emerged and redundancy was reached.2,10 Questions (open and closed) were worded carefully to limit response bias.21,22 Qualitative analysis of the transcripts was conducted using established methods in grounded theory, a methodology commonly used in the social sciences that involves the gathering and analysis of data to construct a theoretical framework for whatever is being studied. This is in contrast to conventional methods, which adopt an existing theoretical framework, and then collect data to show whether or not it applies to the phenomenon being studied. 23
Each item was considered by the authors and excluded if it was deemed to be related to individual personality traits; disease-specific; lacking in clarity/readability; more relevant to clinical examination rather than owner report; not relevant to HRQoL; or where a more appropriate description of that observation had been offered.
Content validation
An online survey (SurveyMonkey, San Mateo, CA, USA) of the remaining items was conducted in which groups of cat owners and clinicians were asked to judge their clarity and their relevance to the measurement of feline HRQoL. Relevance was scored using a 4-point Likert scale (0 = ‘not relevant’, 3 = ‘very relevant’). 24 The clarity of each item was determined using binary response options, ‘clear or not clear’. 25 Participants were asked for feedback on why they found an item not relevant or unclear, and were invited to suggest additional items.
Degree of relevance scores were then dichotomised by assigning scores of 0 and 1 as ‘not relevant’ and scores of 2 and 3 as ‘relevant’. Content validity index scores for relevance (I-CVIR) and clarity (I-CVIC) of each item were derived by averaging the scores given to each item and dividing by the number of respondents. 24 Items were excluded if I-CVIR ⩽0.60 or considered for revision/exclusion if I-CVIC <0.70.
Prototype construction and pre-testing
In the prototype instrument, each item was accompanied by a 7-point Likert scale (0 = ‘not at all’, 6 = ‘couldn’t be more’) to allow the respondent to rate the extent to which the item described his or her cat. Some of these anchors were re-worded to suit the form (word or phrase) of the item.
Software developers, Kyria Ltd (www.kyria.co.uk) produced a web-based prototype instrument for pre-testing with a number of cat owners. The prototype was revised as required to ensure optimal utility, functionality and lack of ambiguity.
To compare owners’ impressions of health status with that of clinicians, which has been found to differ in the dog according to previous work (unpublished), an additional owner question, ‘Is your cat perfectly healthy?’ – Yes/No, was included in the prototype instrument but did not form part of the assessment.
Field test 1 for item reduction, factorial validation and determination of scoring algorithm
Cat owners were recruited from first-opinion practices, feline specialist practices and the UGSAH. Owners completed one assessment for their cat and the attending clinician completed a general health assessment (supplementary material Appendix S1) to verify the cat’s health status.
The research team reviewed dot plots of the response scores (0–6) generated for each of the items and eliminated any item that was judged by all not to discriminate well between healthy and sick cats.
To establish evidence for factorial validity, and to determine a scoring algorithm for the instrument, a FA (principal components method with a varimax rotation) was performed with remaining items. The scores attributed to each item by the owners were used for the FA. The analysis allocates each item to a factor with a loading (0–1), which determines the closeness of its relationship to the factor. Resulting loadings were sorted, and any item with a loading <0.4 was excluded. A scree test and the Kaiser criterion were used to identify the optimum number of factors and the interpretability of a range of factor models was examined. Factors were interpreted based on how those items loading onto a particular factor were related, and a factor model was chosen that accounted for an acceptable amount of the variability in the data, was readily interpretable and did not include any factors containing only one or two items. An algorithm, based on the item–factor associations of the selected factor model, was derived in order to generate a domain score for each of the resultant factors/domains.
Field test 2 for construct validity and reliability testing
A new group of cat owners was recruited from first opinion practices, feline specialist practices and the UGSAH. The attending clinician completed a general health assessment (supplementary material Appendix S1) to verify the cat’s health status.
Owners of healthy and sick cats, grouped according to the clinical judgement of the consulting clinician, completed at least one assessment. A number of owners of healthy cats completed two assessments, 2 weeks apart, and test–retest reliability was assessed using the intra-class correlation coefficient (ICC). A one-way random model was assumed where the subjects (cats) are assumed random. 26
Using the first assessment for each cat, box plots and descriptive statistics were used to identify differences between healthy and sick cats, followed by formal statistical analysis using non-parametric Mann–Whitney tests owing to the non-normality of the data. Linear discriminant analysis was used to determine the ability of the instrument to differentiate healthy from sick cats. The correlation between the number of comorbidities affecting each cat and their HRQoL scores was investigated using linear regression and Pearson correlation coefficient for all three domains was calculated for healthy cats, cats with 1–2 comorbidities and cats with ⩾3 comorbidities.
The following hypotheses were tested: (1) that the HRQoL profile of scores will differ between healthy cats and sick cats; and (2) that the HRQoL profile will be worse for cats with poorer health status, as defined by the number of comorbidities present in individuals.
Results
An overview of the development process is shown in Figure 1.
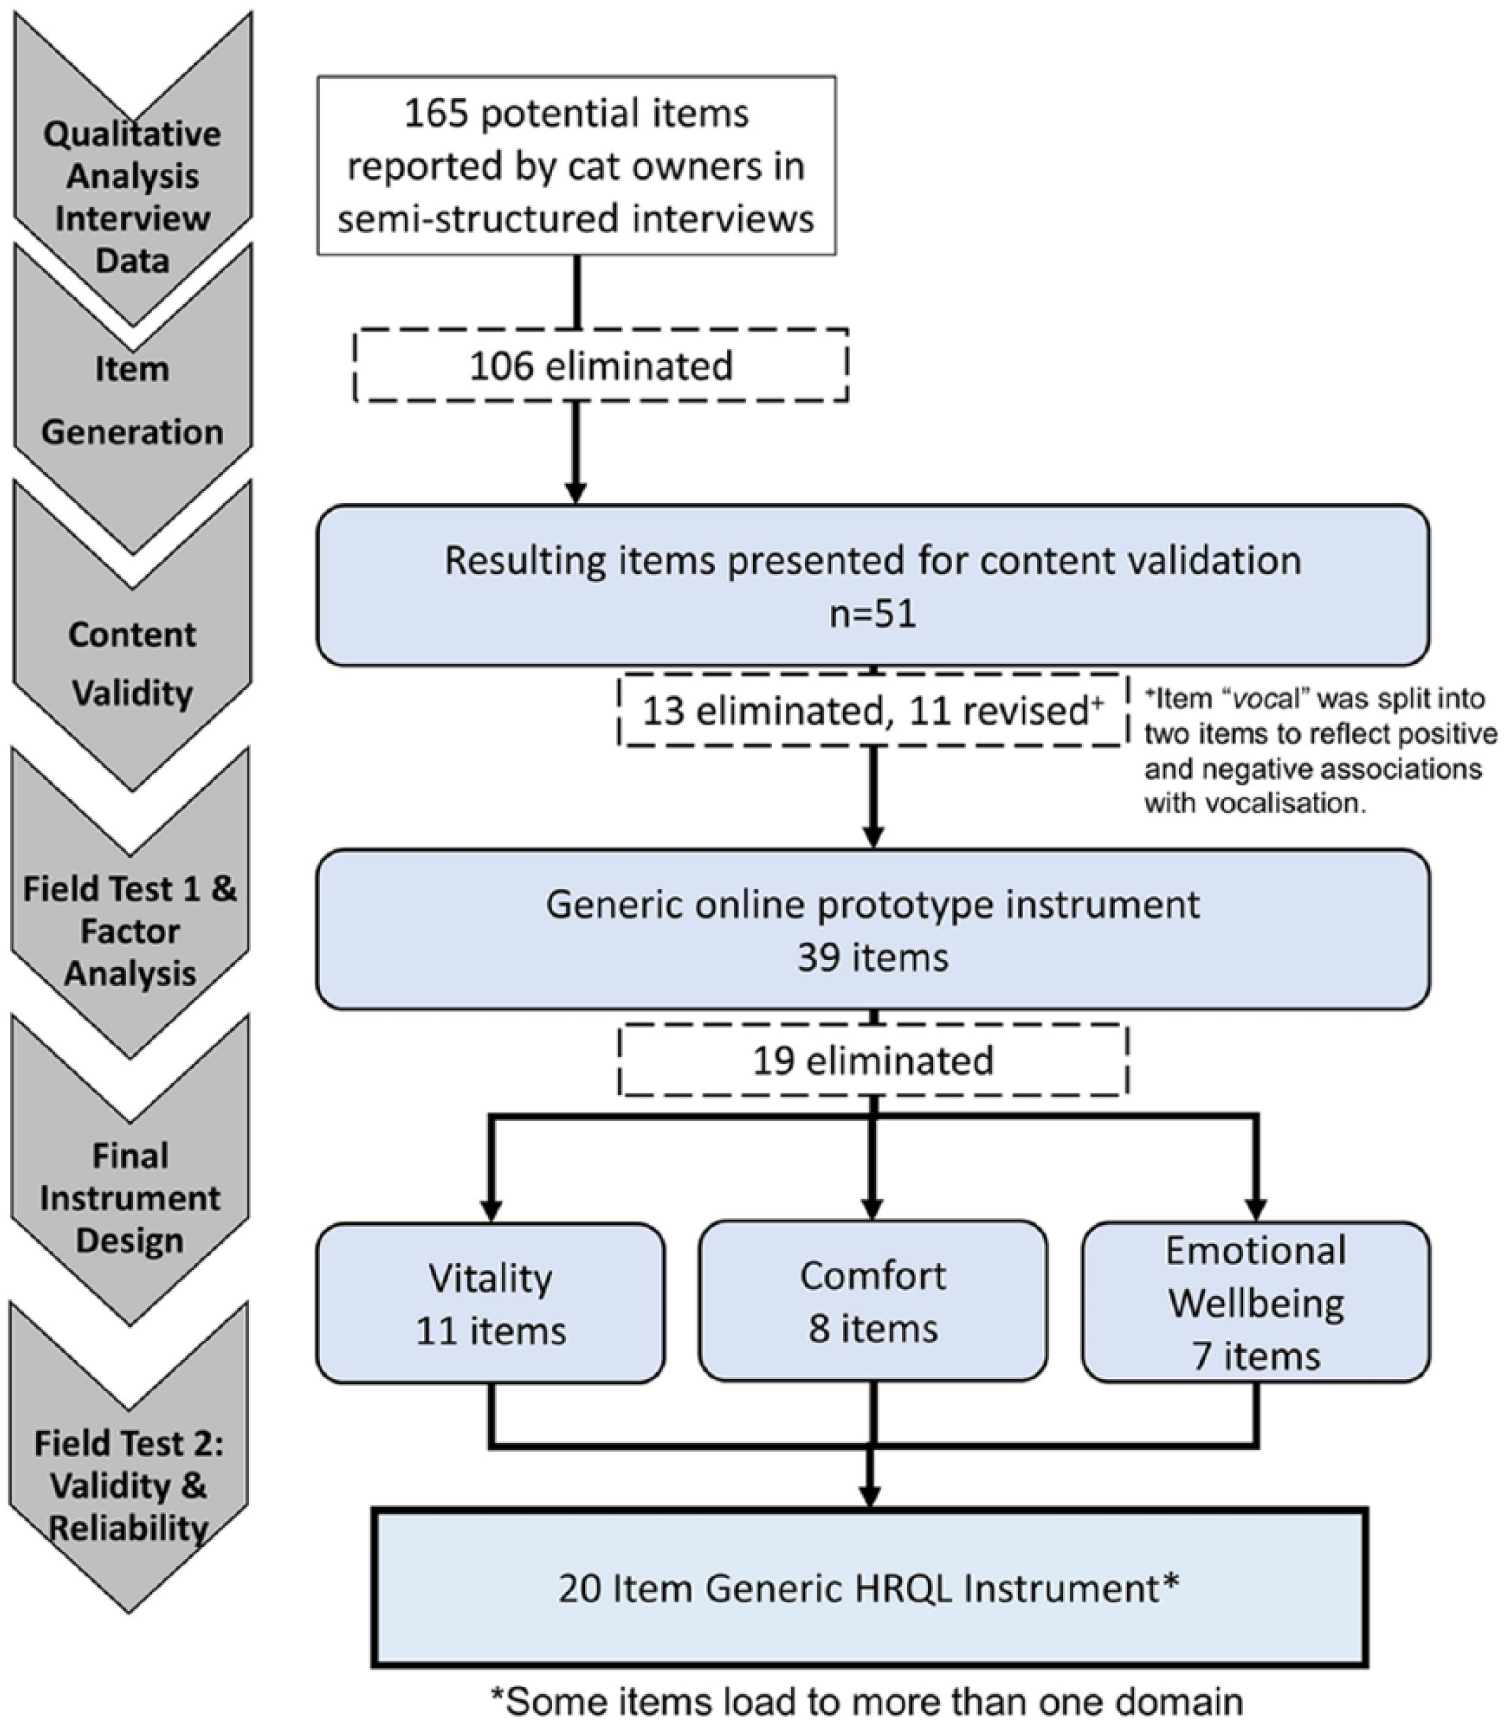
Summary of the study design for developing a generic health-related quality-of-life (HRQoL) instrument for cats
Item generation and initial selection
Semi-structured interviews conducted with the owners (n = 18) of healthy (n = 19) and sick (n = 10) cats generated an initial pool of 165 items for consideration (Table 1). Table 2 illustrates the format of interview questions. One hundred and six items met our criteria for exclusion or revision (for examples see Table 3). Fifty-one items were retained for content validation.
Details of owners and cats involved in different stages of instrument development and validation including semi-structured interviews, field test 1 (item reduction and scoring algorithm generation) and field test 2 (validity and reliability testing)
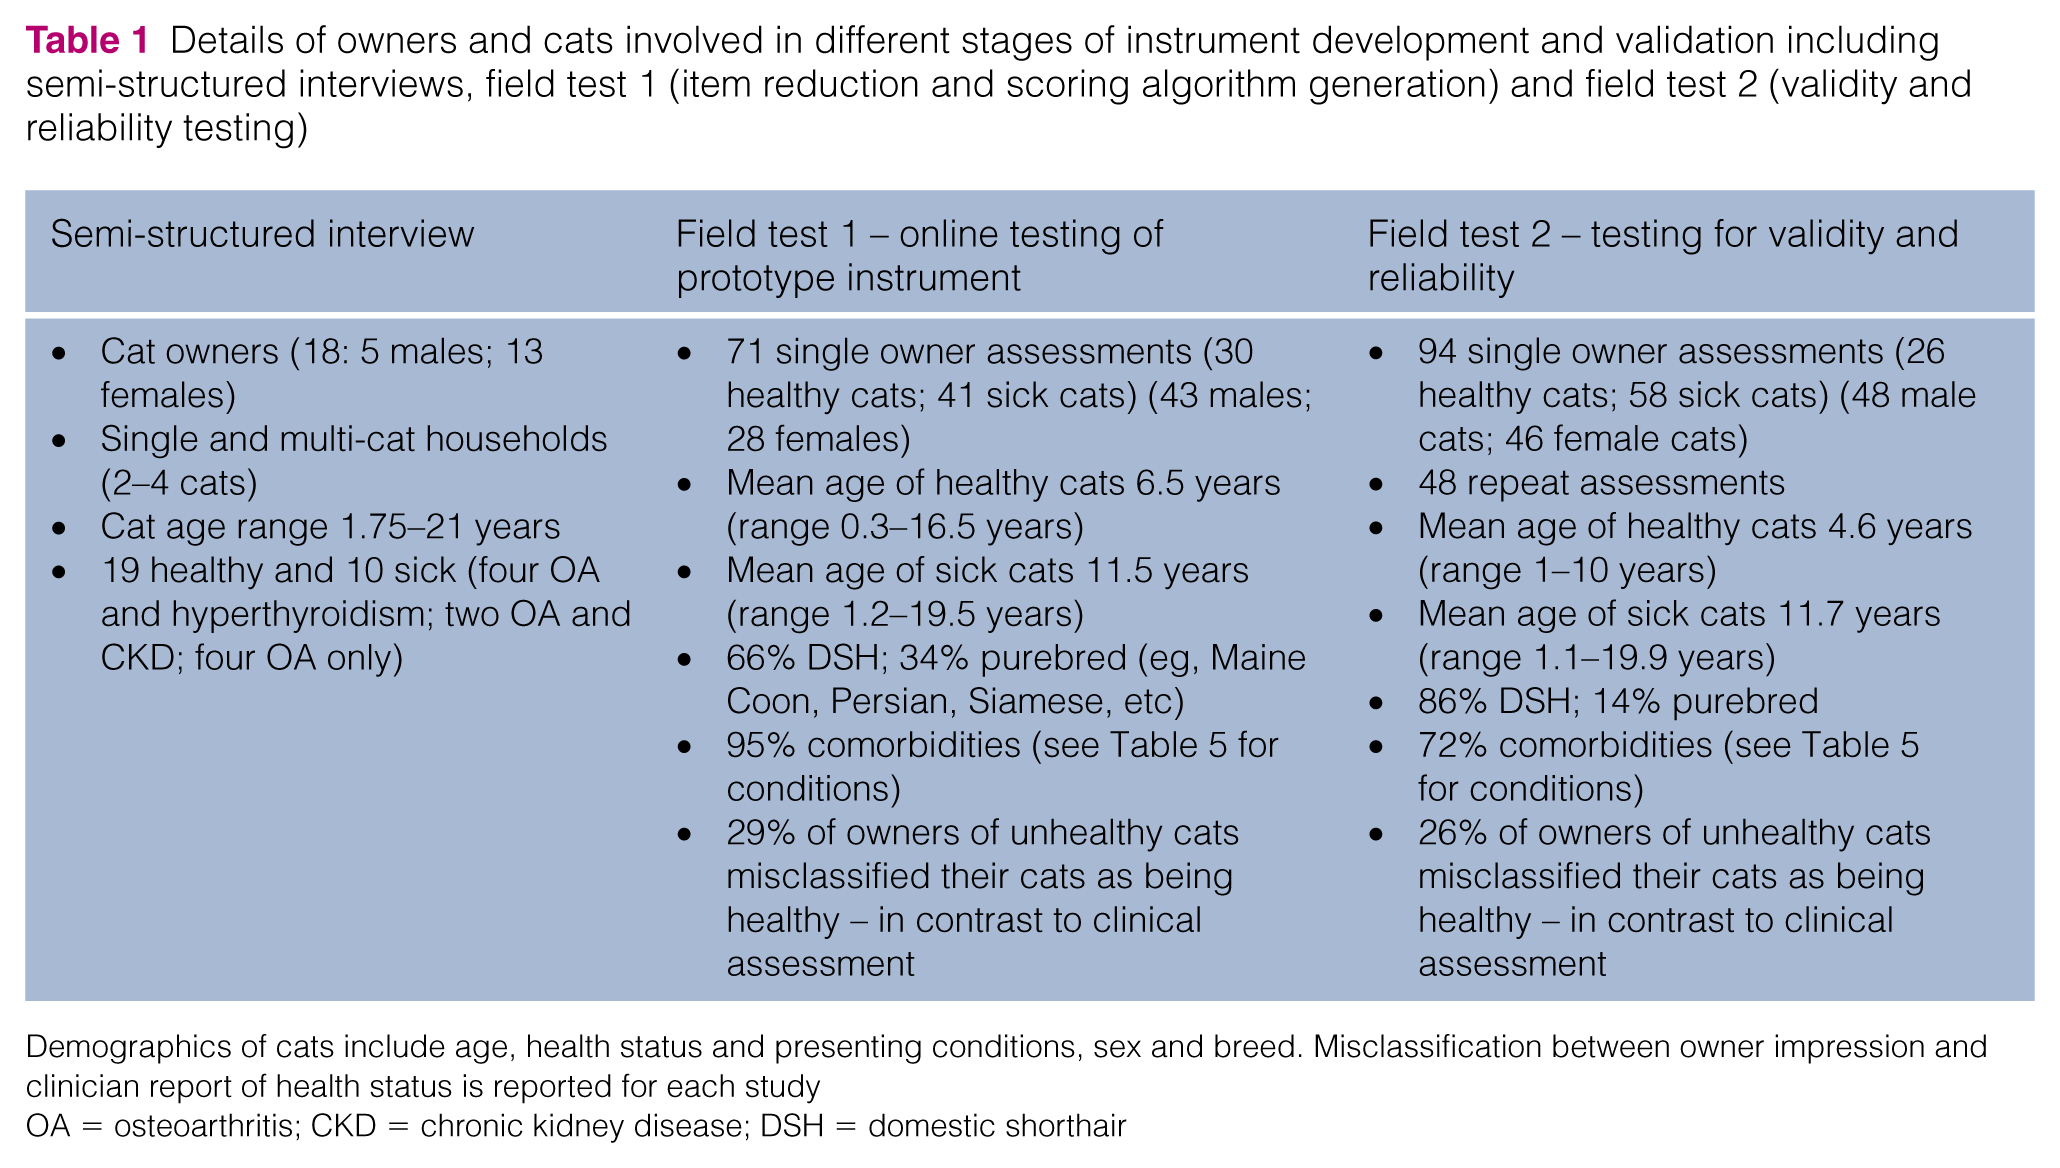
Demographics of cats include age, health status and presenting conditions, sex and breed. Misclassification between owner impression and clinician report of health status is reported for each study
OA = osteoarthritis; CKD = chronic kidney disease; DSH = domestic shorthair
Examples of questions asked of owners during semi-structured interviews

Number of potential items reported by cat owners that were eliminated or revised throughout development following review by the research team (CN, LW, MS, AN, JR), including the rationale and select examples
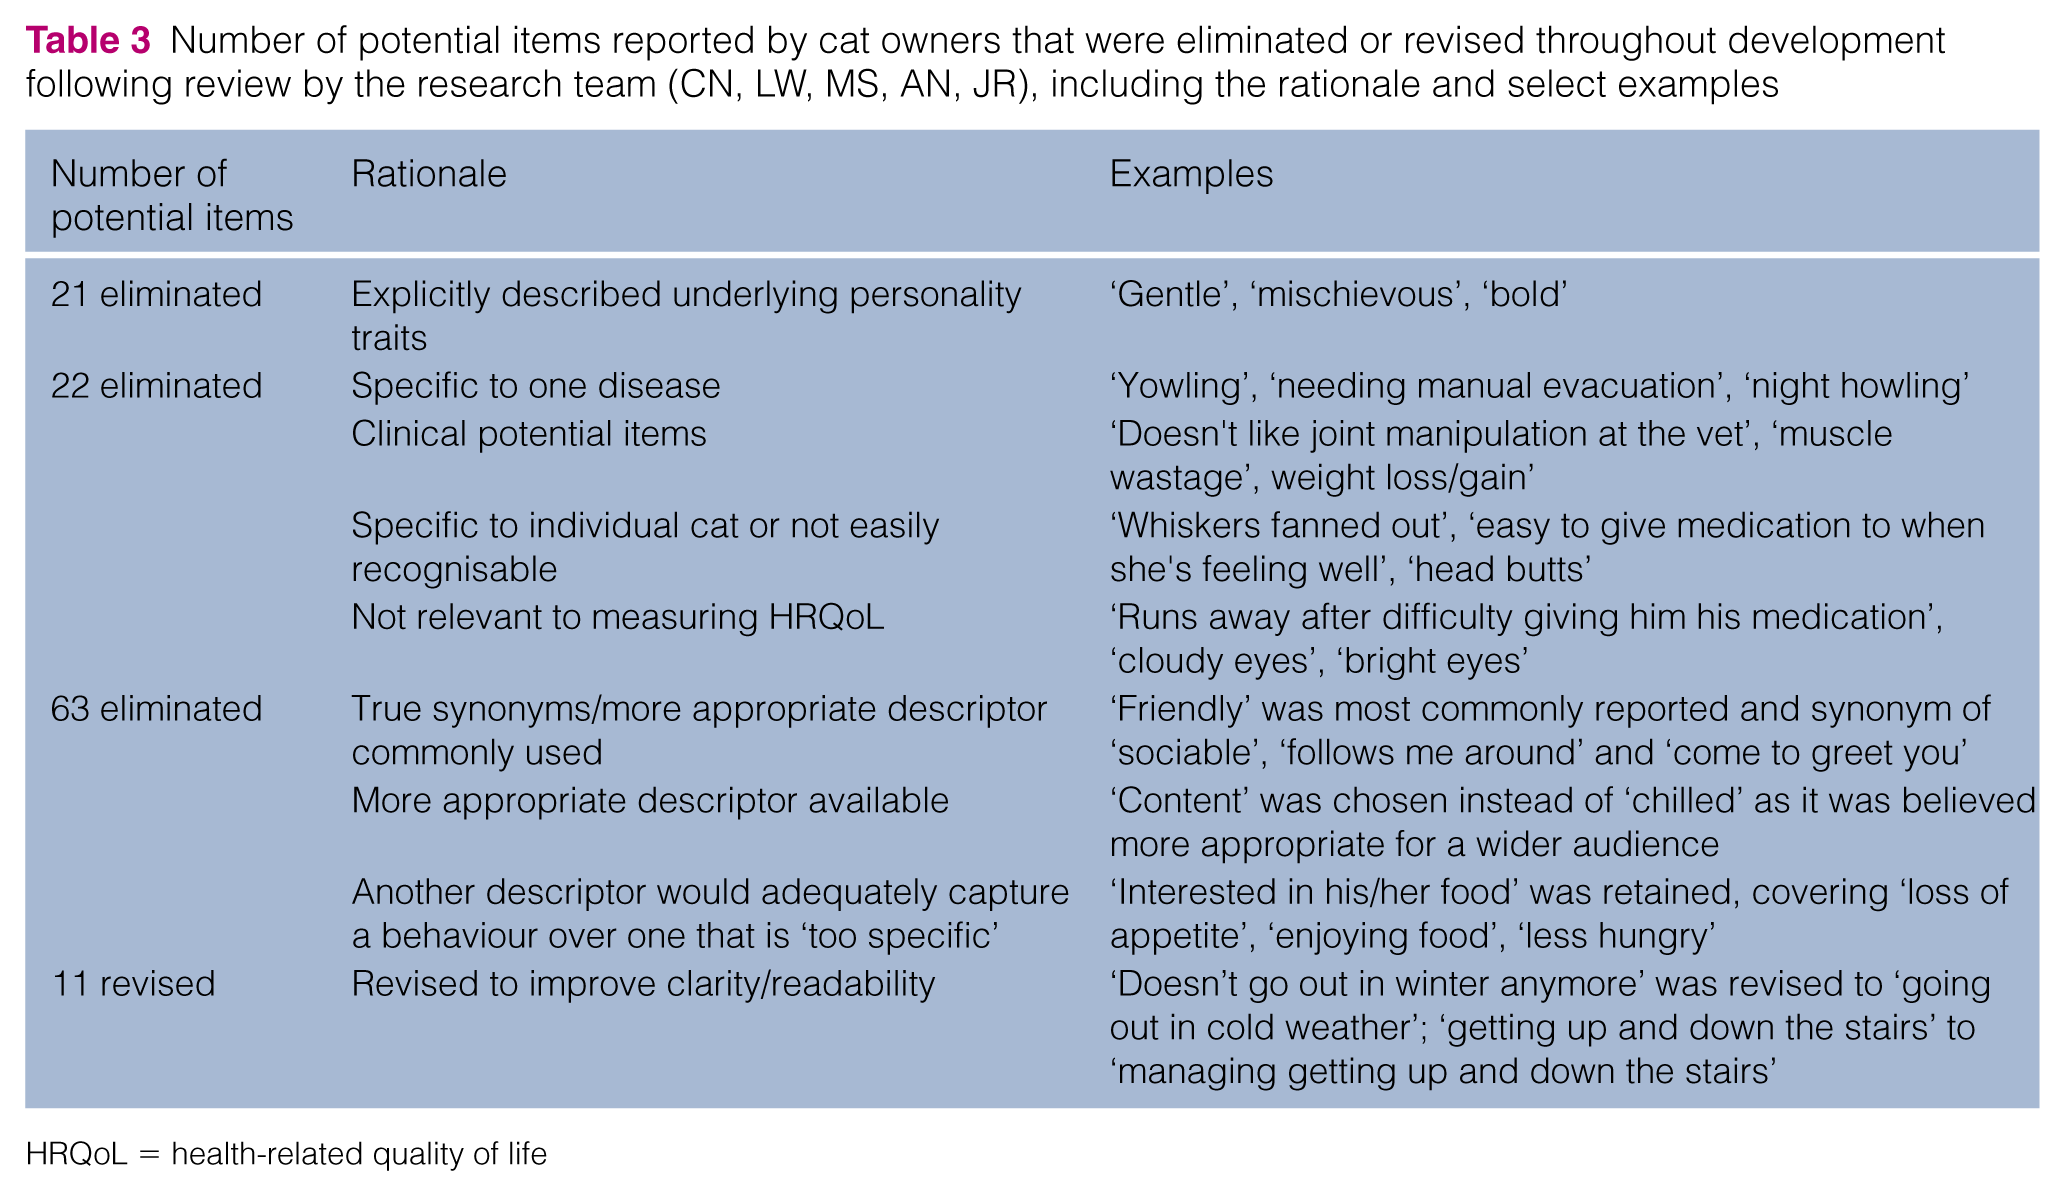
HRQoL = health-related quality of life
Content validation
Fifty-eight participants (48 owners of 14 sick cats and 34 healthy cats) and 10 clinicians completed surveys assessing the clarity and relevance of the remaining 51 items. As a result of not having met I-CVI criteria, 13 of these items were eliminated and 11 items were revised, with one of those being split into two separate items (Figure 1).
Prototype construction and pre-testing
The prototype for field test 1 consisted of 39 items, 27 single words with the standard response option (0 = ‘not at all’; 6 = ‘couldn’t be more’) and 12 items where response options were reworded to suit the form of the item (eg, ‘hiding away’ – not hiding away at all/ couldn’t be hiding away more).
Pre-testing of the online instrument was conducted with 15 owners of five healthy cats and 10 sick cats. Following this, response options for two items – ‘Jumping or climbing up/down’ and ‘Usual sleeping patterns and/or places’ – were revised to improve readability and comprehension.
Field test 1 for item reduction, factorial validation and determination of scoring algorithm
Using the online prototype instrument for field test 1, 71 owner and clinician assessments from UGSAH, five general practices and one feline specialist practice were completed over a period of 5 months for 30 healthy cats and 41 cats diagnosed with a chronic condition expected to affect QoL (Table 1). Ninety-five percent of cats presented with 1–6 comorbidities (Table 5). Review of dot plots of these item responses suggested that 19 items were unlikely, in the opinion of the research team, to discriminate between sick and healthy cats (Figure 2); these were removed leaving 20 items to be included in the instrument for field test 2 (Table 4).
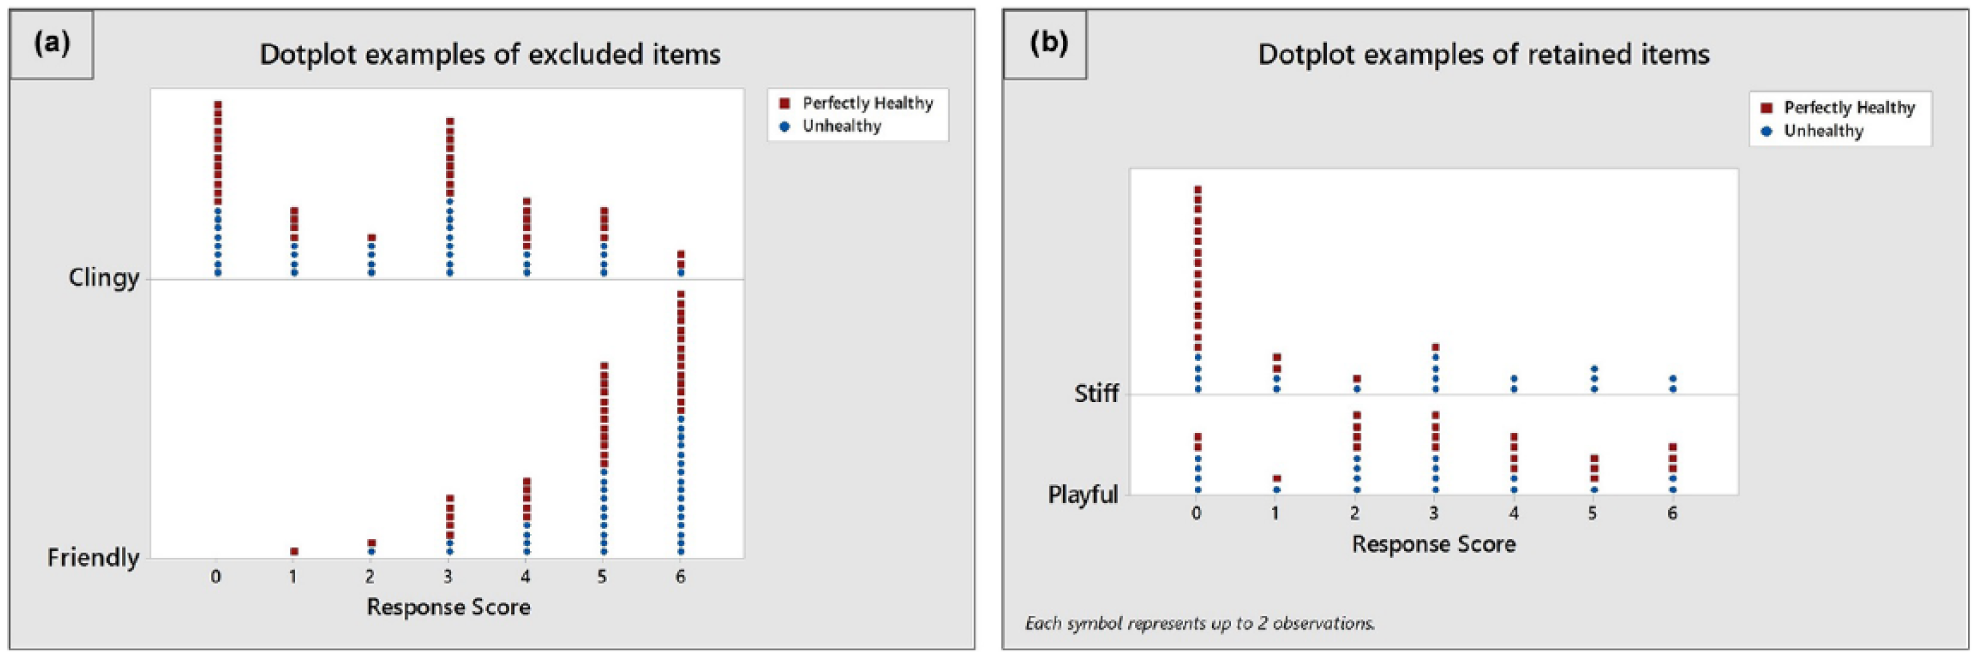
Examples of dot plots for items that were (a) excluded and (b) retained on the basis of their discriminatory potential as assessed by the research team. The x-axis represents the response values selected by owners of healthy (red square) and unhealthy (blue circle) cats
Twenty items that make up the feline health-related quality-of-life scale and their response options

A FA was conducted using the responses to these 20 items, all of which had loadings >0.4. A model containing three factors was considered to be optimal, accounting for 72.3% of the variance in the owner response data and consisting of factors that could be interpreted as HRQoL domains which were named by the research team as ‘vitality’ (11 items), ‘comfort’ (eight items) and ‘emotional wellbeing’ (EWB) (seven items). Some items loaded onto more than one factor. An algorithm, based on the item–factor associations for the three-factor model, was derived in order to generate three domain scores. However, for commercial reasons a description of the factor composition and the algorithm are not presented.
Field test 2 for construct validity and reliability testing
Using the resulting online instrument for field test 2, the owners of 36 healthy cats and 58 sick cats as determined by clinician assessment, representing a comprehensive range of breeds (Table 1), completed one assessment and, of these 94 owners, 48 owners completed two assessments. According to their responses to a direct question, a total of 26% of owners of sick cats believed their cat to be perfectly healthy, despite a clinician diagnosis of ill health. Sick cats presented with a range of conditions and 72% had 1–6 additional comorbidities (Table 5).
Conditions reported by clinicians for each assessment completed for 41 cats from field test 1 and the 58 cats from field test 2 that in the clinician’s opinion were not perfectly healthy

Comorbid conditions were reported in 95% and 72% of cases in field tests 1 and 2, respectively
Other conditions included: field test 1 – cognitive decline (n = 3), cancer in remission (n = 2), diabetes (n = 2), proliferative gum disease (asymptomatic), liver disease and otitis externa right ear and scratches to pinna; field test 2 – hypertension (n = 2)
Construct validity
Differences between healthy and sick cats existed for all three domains (Table 6), supporting hypothesis 1 (null hypothesis: no difference in median score between healthy and sick cats, rejected at P <0.01), with greater variability in the sick group than in the healthy group (Figure 3). Linear discriminant analysis (using cross-validation) showed that the instrument correctly classified as either healthy or sick 78% (healthy 71%; sick 89% classified correctly) of the cats assessed. An increase in the number of comorbidities was associated with a deterioration in HRQoL profile (Figure 4). The Pearson correlation coefficients for vitality, comfort and EWB, and comorbidities (healthy, 1–2 and >3) were −0.64, −0.63 and −0.50, respectively.
Descriptive statistics and Mann–Whitney test results comparing the scores of healthy and sick cats for each of the three domains (vitality, comfort and emotional wellbeing [EWB])

IQR = interquartile range; CI = confidence interval
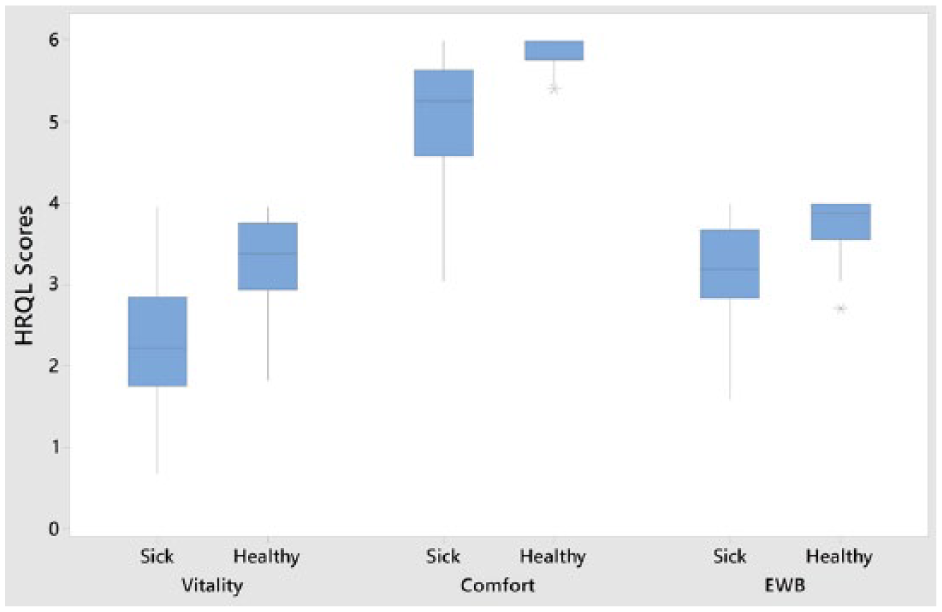
Plots of scores for three domains of health-related quality of life (HRQoL; vitality, comfort and emotional wellbeing [EWB]) generated by the owners of 36 healthy control cats and 58 sick cats using the 20-item web-based generic HRQoL instrument. Each blue box represents the scores obtained for between 25% (bottom line) and 75% (top line) of the group, with the line in the middle representing the median score

Fitted line plots of linear regressions performed for three domains of the health-related quality-of-life (HRQoL) instrument. Statistics presented include the residual standard deviation (S) and r 2 values for the three domains. The number of presenting conditions is on the x-axis, whereas the HRQoL scores are on the y-axis
Reliability
Forty eight owners completed a second assessment for their cats with a minimum of 14 days between assessments and the ICCs (95% confidence intervals [CIs]) for vitality, comfort and EWB were 0.635 (0.044–0.862), 0.716 (0.256–0.893) and 0.853 (0.615–0.945), respectively.
Discussion
One hundred and sixty-five potential items were collected from the owners of sick and healthy cats using best practice for qualitative research. 2 As information obtained from key informants underpins content validity, comprehensive representation of all relevant populations is necessary. Freeman et al described a generic HRQoL scale for cats, 11 where key informants were restricted to owners/caregivers of healthy cats. Similarly Tatlock et al used pet owners of healthy cats as key informants. 13 However, 29% and 27% of owners (field tests 1 and 2, respectively) in this study thought their cats were healthy when clinicians deemed them to be sick, reinforcing that such judgement may be unreliable. 27 Bijsmans et al used owners as informants for CatQol, but no details are available regarding the health status of these cats. 12 In contrast, the health status of the 19 healthy cats and 10 sick cats belonging to owners recruited as key informants in this study was verified by a veterinary surgeon. Although this number of cats could be considered to be low, interviews were conducted until no new information emerged. In addition, 48 different owners involved in the content validation process were invited to suggest additional items if they felt the collection of items was inadequate. Initial reduction of the 165 items was based on criteria devised by the investigators, an approach considered to be appropriate in human medicine.28–30
In veterinary science, many rely on cognitive debriefing interviews to establish the content validity of an instrument scale,11,31 or simply ask owners to judge whether the instrument appears to be capable of measuring what it is intended to measure (face validity). 32 However, in this study a group of vets, as well as a large group of owners, were involved in the validation process, adding to the robustness of this stage in the process.
In human medicine and the social sciences, the quantification of content validity has been introduced. One approach, used here, asks relevant ‘experts’ to rate the relevance and clarity of items using a rating scale, and those ratings are used to calculate a CVI for each individual item on the scale (I-CVI), providing objective information to guide researchers in revising, deleting, or substituting items. 33 The instrument described here is the first instrument in veterinary science to quantify and establish content validity of each item using this technique.
Following field test 1, 19 items were excluded based on research team judgement that they did not discriminate healthy from sick cats. Although it was considered unlikely that an item that was unable to discriminate healthy from sick cats would prove useful in an evaluative context, the possibility cannot be discounted and items removed at this stage may be reassessed for inclusion if the instrument proves not to be responsive to clinical change in further longitudinal studies.
The remaining 20 items all loaded >0.4 in the FA. Factor loadings of 0.3, 0.5 and 0.7 are generally considered to be low, medium and high, respectively, 34 with loadings of 0.3 deemed to be the minimum consideration level for FA. Increasing the loading threshold to 0.4 may have accounted for the fact that no further items were removed at this stage. Furthermore, the fact that the majority of loadings were >0.6 indicates stability of the factor model. 35 Although FA provides any number of factor models for a given data set, there are established methods of identifying how many factors could sensibly be extracted, including the scree test and the Kaiser criterion, 36 both considered in this study. The three-factor model adopted here, accounting for 72% of the variability in the owner response data, compares favourably with the canine HRQoL (64%) 15 and 72% for the shortened instrument, 20 an 11-factor questionnaire designed to measure the behaviour and temperament of pet dogs (57%) 37 and a four-factor QoL questionnaire regarding infants (45%), 38 and confirms factorial validity.
Scores in all three domains of HRQoL were significantly different between healthy and sick cats. The fact that domain scores in the sick cats showed more variation than the healthy cats is not surprising given the heterogeneity of disease in the sick cat population. Interestingly, the variability in healthy cat vitality was similar to that of the sick cats, but this probably reflects the tendency for the individual variation in vitality that tends to exist in this species. Furthermore, cats with greater comorbidity had lower HRQoL scores, indicating a poorer QoL, with moderate Pearson correlation coefficients for all three domains, 39 thus upholding known-groups hypothesis, providing additional evidence for construct validity.
Evidence for known-group validity relating to health status of other generic HRQoL instruments in cats is sparse. Freeman et al investigated the validity of their scale in a large group of 1303 cats, 11 but only eight of these were categorised as being ‘not very healthy’ or ‘not at all healthy’ by their owners – in any case a judgement that we have shown in this study to be unreliable. Bijsmans et al demonstrated that their instrument detected difference between healthy cats and those with CKD, 12 but this evidence is of limited value in relation to the proposed generic nature of their instrument.
Discriminant analysis indicated an overall misclassification rate of 22% vs that reported for dogs with chronic pain (12% misclassification) 19 and for a proxy instrument for pain measurement in communicatively impaired children (13%). 40 Misclassifications in the study reported here may have been a result of measurement error, or may have occurred because the QoL of some healthy cats was compromised at the time for reasons other than poor health, or because some sick cats may have been experiencing a good QoL at the time.
Criterion validity was not carried out because no gold standard instrument for the measurement of HRQoL exists, but the authors do not discount the possibility of being able to demonstrate concurrent or predictive criterion validity in future studies when suitable measures become available.
Test–retest reliability was carried out on data for healthy cats only, for which health status would be less likely to change over a 2 week period than would that of sick cats. A 2 week period between the completion of questionnaires is commonly chosen for this purpose, being a short enough period for change in health status to be unlikely but being a long enough period for respondents to be unlikely to remember their previous responses. The ICC values for the comfort and EWB domains were >0.7 and >0.8, respectively, indicating that test–retest reliability for those domains was good, and it was moderate for vitality (ICC >0.6). 41
Conclusions
The measurement of feline HRQoL is becoming more necessary as chronic diseases such as CKD, hyperthyroidism, cognitive decline and osteoarthritis affect the QoL of an increasing number of ageing cats, and evidence-based medicine requires that robust measures of clinical impact be developed. This study has provided initial evidence for the reliability and validity of a novel generic instrument that measures the affective component of the chronic disease experience. However, it is important to emphasise that validity is not determined by a single statistic, but by a body of research that supports the claim that the instrument is valid for particular purposes, with defined populations and in specified contexts. 2 Accordingly, future research will seek to provide such evidence, as well as evidence for the instrument’s responsiveness to clinical change including that following treatment. The instrument is available for clinical use and for clinical trials from NewMetrica (www.newmetrica.com). For further information please contact the corresponding author.
Supplemental Material
Appendix S1
Veterinary assessment
Footnotes
Acknowledgements
The authors wish to thank all the cat owners, as well as the veterinary surgeons and nurses in practice and at the University of Glasgow Small Animal Hospital, who willingly participated in our studies
Supplementary material
Appendix S1: Veterinary assessment.
Conflict of interest
Professor Reid is a shareholder of NewMetrica, which is the developer and supplier of the instrument.
Funding
We acknowledge Scottish Enterprise for the award of a SMART grant, which enabled us to undertake the study, and Boehringer Ingelheim for additional financial support.
References
Supplementary Material
Please find the following supplemental material available below.
For Open Access articles published under a Creative Commons License, all supplemental material carries the same license as the article it is associated with.
For non-Open Access articles published, all supplemental material carries a non-exclusive license, and permission requests for re-use of supplemental material or any part of supplemental material shall be sent directly to the copyright owner as specified in the copyright notice associated with the article.