
Abstract
Objectives
The objective of the study was to investigate the associations of a nine-point body condition score (BCS) with survival time and lifespan in cats.
Methods
Electronic patient records from a cat-dominant primary practice in metropolitan Sydney, Australia, where the body condition of cats was regularly recorded using a nine-point BCS scale were obtained. The maximum BCS of each cat during the visits was used as the primary exposure variable. Two survival analyses were conducted to evaluate the associations of BCS with cats’ survival and lifespan.
Results
In total, 2609 cats met the selection criteria from 4020 cats screened. The median of the maximum BCS was 6 (interquartile range [IQR] 5–7). Compared with cats with a maximum BCS of 6, increased hazards of death were observed in cats with a maximum BCS of 3 (hazard ratio [HR] 4.67, 95% confidence interval [CI] 3.00–7.27), 4 (HR 2.61, 95% CI 1.95–3.49), 5 (HR 1.43, 95% CI 11.5–1.76) and 9 (HR 1.80, 95% CI 1.11–2.93). Median lifespan was 15.8 (IQR 13.5–17.6) years. Compared with cats reaching a maximum BCS of 6 in the same age group, cats reaching a maximum BCS of 4 (HR 4.15, 95% CI 1.26–13.67) or 5 (HR 1.75, 95% CI 1.07–2.85) between age 1 and 3 years, and a maximum BCS of 3 (HR 6.09, 95% CI 1.47–25.25) and 9 (HR 2.27, 95% CI 1.27–4.04) between the age of 3 and 11 years had shorter lifespans.
Conclusions and relevance
There are significant associations of nine-point body condition scoring with survival and lifespan, and BCSs <5 and of 9 were found to be negatively associated with both. The study yielded information regarding a desirable BCS for cat longevity that veterinarians could consult with.
Introduction
The World Health Organization defines overweight and obesity (O&O) as ‘abnormal or excessive fat accumulation that presents a risk to health’. 1 Similar to humans, O&O have been reported to have positive associations with several health conditions in cats, such as dermatological conditions,2,3 hypertrophic cardiomyopathy,4,5 lower urinary tract conditions6–11 and diabetes mellitus.2,3,12,13 O&O are also shown to be associated with a shorter lifespan in humans,14–17 but, to our knowledge, this association in cats from a general population has not been investigated.
Before determining the associations between feline O&O and longevity (and health conditions), it is important to define O&O in cats. Body condition score (BCS) has been the most common method of measuring body composition of cats in veterinary practice and research. Most studies on the frequency of and risk factors for feline O&O determined O&O using body condition scoring. Body condition scoring was originally developed by Jefferies 18 in sheep and has been applied to livestock (pigs, goats, cattle) and companion animals (dogs, cats and horses).19–26 It is a semi-quantitative method that divides the continuum of the superficial body composition into a finite number of ordinal categories.21,27
In cats, BCS assessments usually involve palpation of subcutaneous fat and visual observation of superficial bony prominences and waist. 28 Notably, dual-energy x-ray absorptiometry has demonstrated that the levels of nine-point body condition scoring correspond well to the percentage of body fat mass.21,29,30 However, the cut-off points of underweight, ideal-weight, overweight and obesity in body condition scoring in cats were determined without epidemiological evidence of their impact on longevity or health. In other words, it is presumed that cats with a BCS of 6 or 7 are overweight and that cats with a BCS 8 or 9 are obese, without verifying that they are more susceptible to impaired health than cats with a BCS of 5. In contrast, in human medicine, the cut-off points of body mass index (BMI) – the most commonly used method to determine underweight, overweight and obesity – were based on epidemiological evidence, 31 although the practice of using BMI has been questioned owing to its representation of percentage fat that varies by sex, age and race/ethnicity group. 32
The objectives of the study were to investigate the associations of nine-point body condition scoring with (1) survival time and (2) lifespan in cats with the goal of comparing the results with the current cut-off values for underweight, overweight and obesity in cats.
Materials and methods
The procedures for the study were approved by the University of Sydney Human Research Ethics Committee under the broader approval for the VetCompass Australia project (approval number: 2013/919).
Electronic patient records were obtained from a cat-dominant primary practice in metropolitan Sydney, Australia, where a nine-point BCS evaluation for cats has been regularly applied. Cats visiting the clinic twice or more after turning 1 year of age between 3 January 2005 and 21 June 2015 were enrolled in the study.
Detailed information about the study population and the dataset has been previously described. 33 Briefly, the data obtained from the clinic contained: (1) demographic information, including animal identification, microchip number, species, breed, sex, neuter status, date of birth, date of death, cause of death, outdoor access and the postcode of the owner’s place of residence; (2) information about each visit including date of visit, BCS and body weight of cats, attending veterinarian, notes taken by the veterinarian; and (3) chronic health conditions of cats diagnosed and specifically documented by veterinarians.
The date of the first visit at the maximum BCS among all recorded BCSs of each cat was extracted, and the age at this specific visit (‘age at visit’) was calculated. The maximum BCS (‘maxBCS’; it is used when the maximum BCS is a variable) for each cat was selected as the primary exposure variable because: (1) excessive fat accumulation is responsible for increasing the risk for health but usually not contrariwise; (2) average BCS could mask the actual effect of undesirable BCS on survival and lifespan; and (3) diseases often result in leanness. Cats with a maxBCS of 1 (n = 0) and 2 (n = 8) were excluded from analyses owing to there being only a few observations. Health conditions with extant evidence of association with O&O in cats,2–13,34,35 dogs 36 and humans37–54 that occurred in cats enrolled were data-mined with keywords in fields for: (1) cause of death; (2) the notes taken by veterinarians during visits; and (3) chronic health conditions, and then combined. These health conditions are listed in Table 1. Data were cleaned and preliminarily managed in Microsoft Excel 2010 (Microsoft Corp. Redmond, Washington, United States), OpenRefine 2.0 and imported into the R program version 3.3.0 (R Core Team) in Rstudio interface for further management with the ‘car’ package. 55
Number (%) with each health condition for the 2609 cats presented at least twice to a clinic in Sydney, Australia, after the age of 1 year from January 2005 to June 2015

Statistical analysis
Descriptive and statistical analyses were conducted in the R program with the use of ‘survival’, 56 ‘survminer’ 57 and ‘ggplot2’ 58 packages. Two survival analyses were conducted with maxBCS as the primary exposure variable. Cats with no record of death or with a missing date of death were censored in both analyses. The censoring date was the day of their last visit to the clinic in the dataset. Statistical significance level was set at 0.05 for all analyses.
Survival analysis for the time from the first visit at the maximum BCS to death
The outcome variable for the first survival analysis was the time from the first visit at the maxBCS to death. Cats were excluded from this analysis if: (1) the first maxBCS was recorded at the last visit to the clinic or (2) dying within 3 days after the first maxBCS because, for the former, the time variable was 0, and, for the latter, the BCS was likely to be affected by the sickness, resulting in selection bias.59,60 Apart from maxBCS, age at visit was examined as a confounder to account for the effect of age on survival.
Kaplan–Meier survival curves were used to compare the survival times of cats with different maxBCSs (3–9). Univariable and multivariable Cox regression analyses were then conducted for both the explanatory variables, and their interaction to generate hazard ratios (HRs; ie, the exponentiated coefficients in Cox regression models), the ratio of two instantaneous rates per unit time (ie, hazard rate) for the event to occur and their CIs. 61 The linearity of the numeric variable was evaluated by: (1) plotting the coefficients of the quantilised numeric variable in univariable Cox regression against midpoints of each quantile and (2) plotting Martingale residuals against the numeric variable, and categorised if the relationship was non-linear. The assumption of proportional hazards was examined using Schoenfeld residuals and plots.
Survival analysis for cat lifespan
Lifespan (ie, time from birth to death) was the time variable in the second survival analysis. Besides testing maxBCS and age at visit, the health conditions of cats were included as explanatory variables. All the explanatory variables were examined by Kaplan–Meier curves and univariable Cox regression. maxBCS and age at visit were used as the base of the multivariable models. However, because age at visit violated the proportional hazard assumption, it was stratified into: (1) ⩾1 to <3 years (‘young age’); (2) ⩾3 to <11 years (‘middle age’); and (3) ⩾11 years (‘old age’), based on the different likelihood of being O&O in different age groups. 33 The health condition variables with P <0.20 in the univariable Cox regression analyses were included in the multivariable analysis. Variable selection for the final model used a forward construction process. Pairwise interactions between biological meaningful variables were tested. The proportional hazard assumption was tested using Schoenfeld residuals and plots.
Results
Over 11 years from 3 January 2005 to 21 June 2015, 2609 cats had made at least two visits after turning 1 year of age. There were more females (52.2%) than males (47.8%) in the dataset, and most cats (99.4%) were neutered. Domestic cat (ie, mixed breed) was the predominant breed (56.3%), followed by Burmese (11.0%). The median age of cats reaching their maxBCS was 5.4 (interquartile range [IQR] 2.4–9.7; range 1.0–21.0) years. The cats with maxBCSs of 5, 6 or 7 accounted for 84.5% of the study population with the cats with a maxBCS of 6 being most frequent (37.3%; Figure 1). The median maxBCS was 6 (IQR 5–7). The frequency of the health conditions is shown in Table 1, and oral conditions were the most prevalent (50.2%).
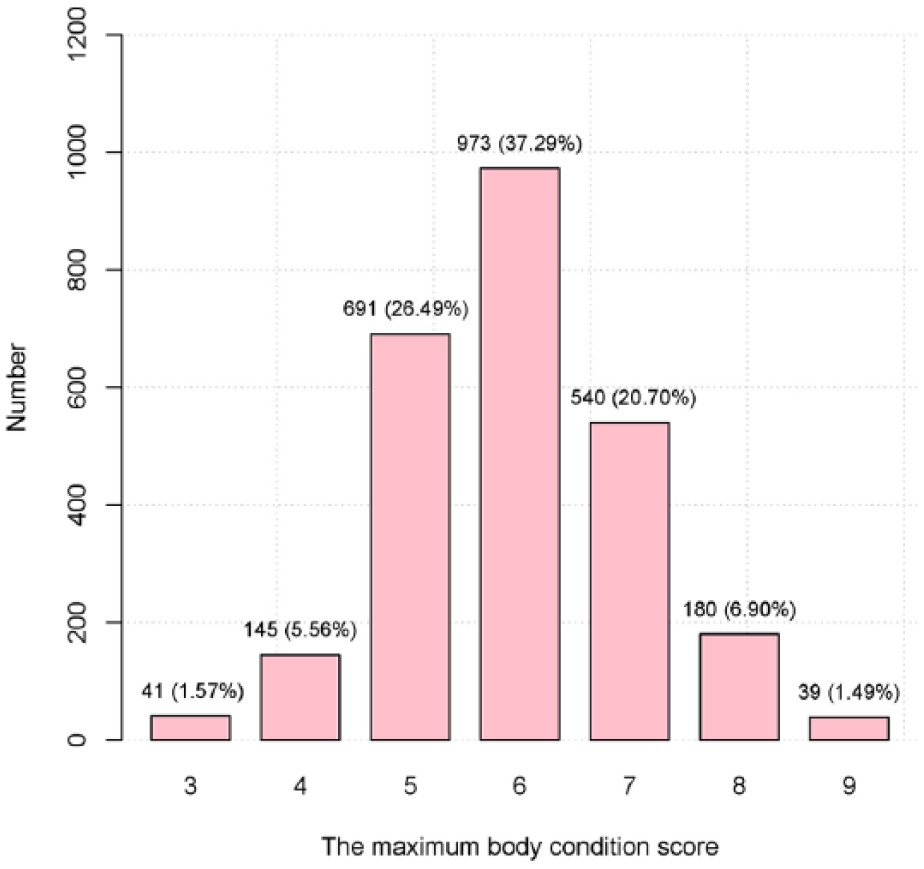
Numbers of cats with different maximum body condition score among all the visits of each cat (n = 2609) presented at least twice to a clinic in Sydney, Australia, after the age of 1 year from January 2005 to June 2015
Survival analysis for the time from the first visit at the maximum BCS to death
A total of 2281 cats met the inclusion criteria in the first survival analysis, of which 644 (28.2%) had died during the study period. The median survival time was 5.8 years (IQR 3.0–8.9) and the median survival times for cats with different maxBCSs are shown in Table 2.
Median survival time (years) of cats with different maximum body condition scores (maxBCSs) presented at least twice to a clinic in Sydney, Australia, after the age of 1 year from January 2005 to June 2015 in two survival analyses

The outcome of analyses 1 and 2 was the time from the first visit at the maxBCS to death and cat lifespan, respectively
MST = median survival time (years); IQR = interquartile range; NA = not available
The Kaplan–Meier curve of maxBCS suggests that cats with a maxBCS of 6 had the highest survival probability over time and that the survival probability decreased for a maxBCS less than or more than 6 (Figure 2). Both the explanatory variables were significant in the univariable and multivariable Cox regression models, and the interaction between them was non-significant (Table 3). After adjusting for age of visit, a maxBCS of 6 had the lowest hazard, but the hazards for both a maxBCS of 7 and 8 were not significantly different. Cats with a maxBCS of 3 had the highest hazard of all-cause mortality. The models met the proportional hazard assumption.
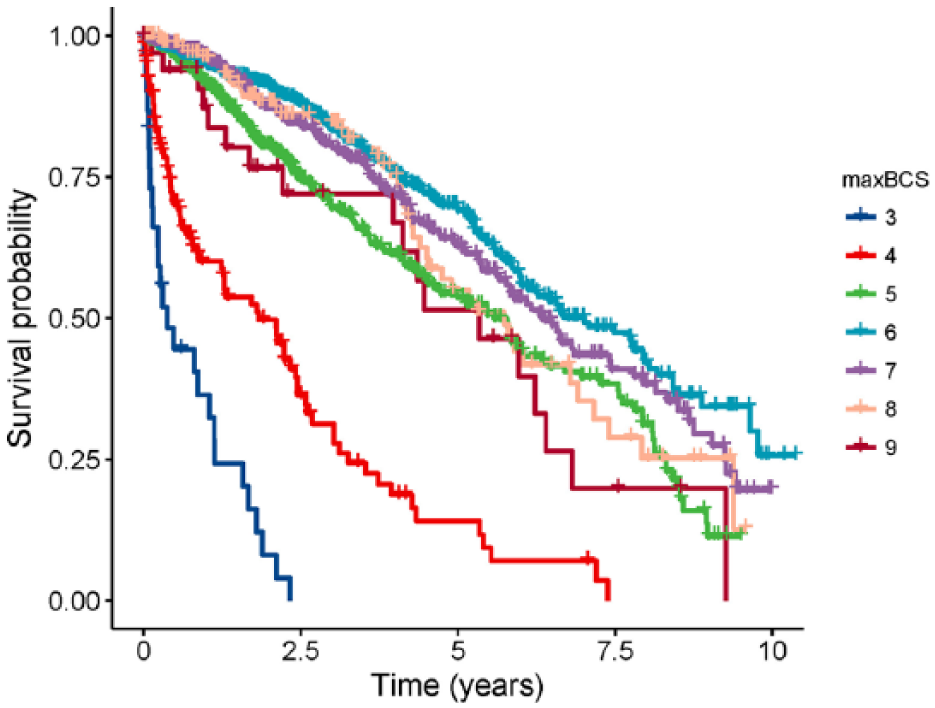
The Kaplan–Meier curve of the time from the first visit at the maximum body condition score (maxBCS) recorded to death of all causes for 2281 cats that presented at least twice to a clinic in Sydney, Australia, after the age of 1 from January 2005 to June 2015
Cox regression results for the associations of the maximum body condition score (maxBCS) with the time from the first visit at the maxBCS to death (all-cause mortality) before and after adjusting for the age at this visit (age at visit) in 2281 cats that presented at least twice to a clinic in Sydney, Australia, after the age of 1 from January 2005 to June 2015

CI = confidence interval
Survival analysis for cat lifespan
There were 2609 cats in the second survival analysis of which 655 (25.1%) had died. The median lifespan was 15.8 (IQR 13.5–17.6) years, and median lifespans with different maxBCSs are displayed in Table 2. Non-stratified univariable Cox models for maxBCS, age at visit and health conditions are presented in Table 4, and the final multivariable stratified Cox model is shown in Table 5 for maxBCS and Table 6 for health conditions. There were 799, 1319 and 491 cats in the groups of young, middle and old age, respectively, with 79 (9.9%), 271 (20.5%) and 305 (62.1%) deaths with known dates. In the cats reaching the maxBSC in young age, cats with a maxBCS of 4 and 5 had 4.15 (95% CI 1.26–13.67) and 1.75 (95% CI 1.07–2.85) times the hazard of death, respectively, compared with cats with a maxBCS of 6. In the middle age strata, cats with an extreme maxBCS (ie, 3 and 9) had significantly higher hazards of death than those with a maxBCS of 6. In the old age strata, the only significant level was a maxBCS of 7, for which the hazard was 1.49 (95% CI 1.01–2.20) times higher than a maxBCS of 6.
Univariable Cox model results for the associations of lifespan with (a) the maximum body condition score (maxBCS) recorded among all the visits for each cat, (b) the age when reaching the maxBCS (age at visit) and (c) 21 health conditions (present vs absent) in 2609 cats presented at least twice to a clinic in Sydney, Australia, after the age of 1 year from January 2005 to June 2015
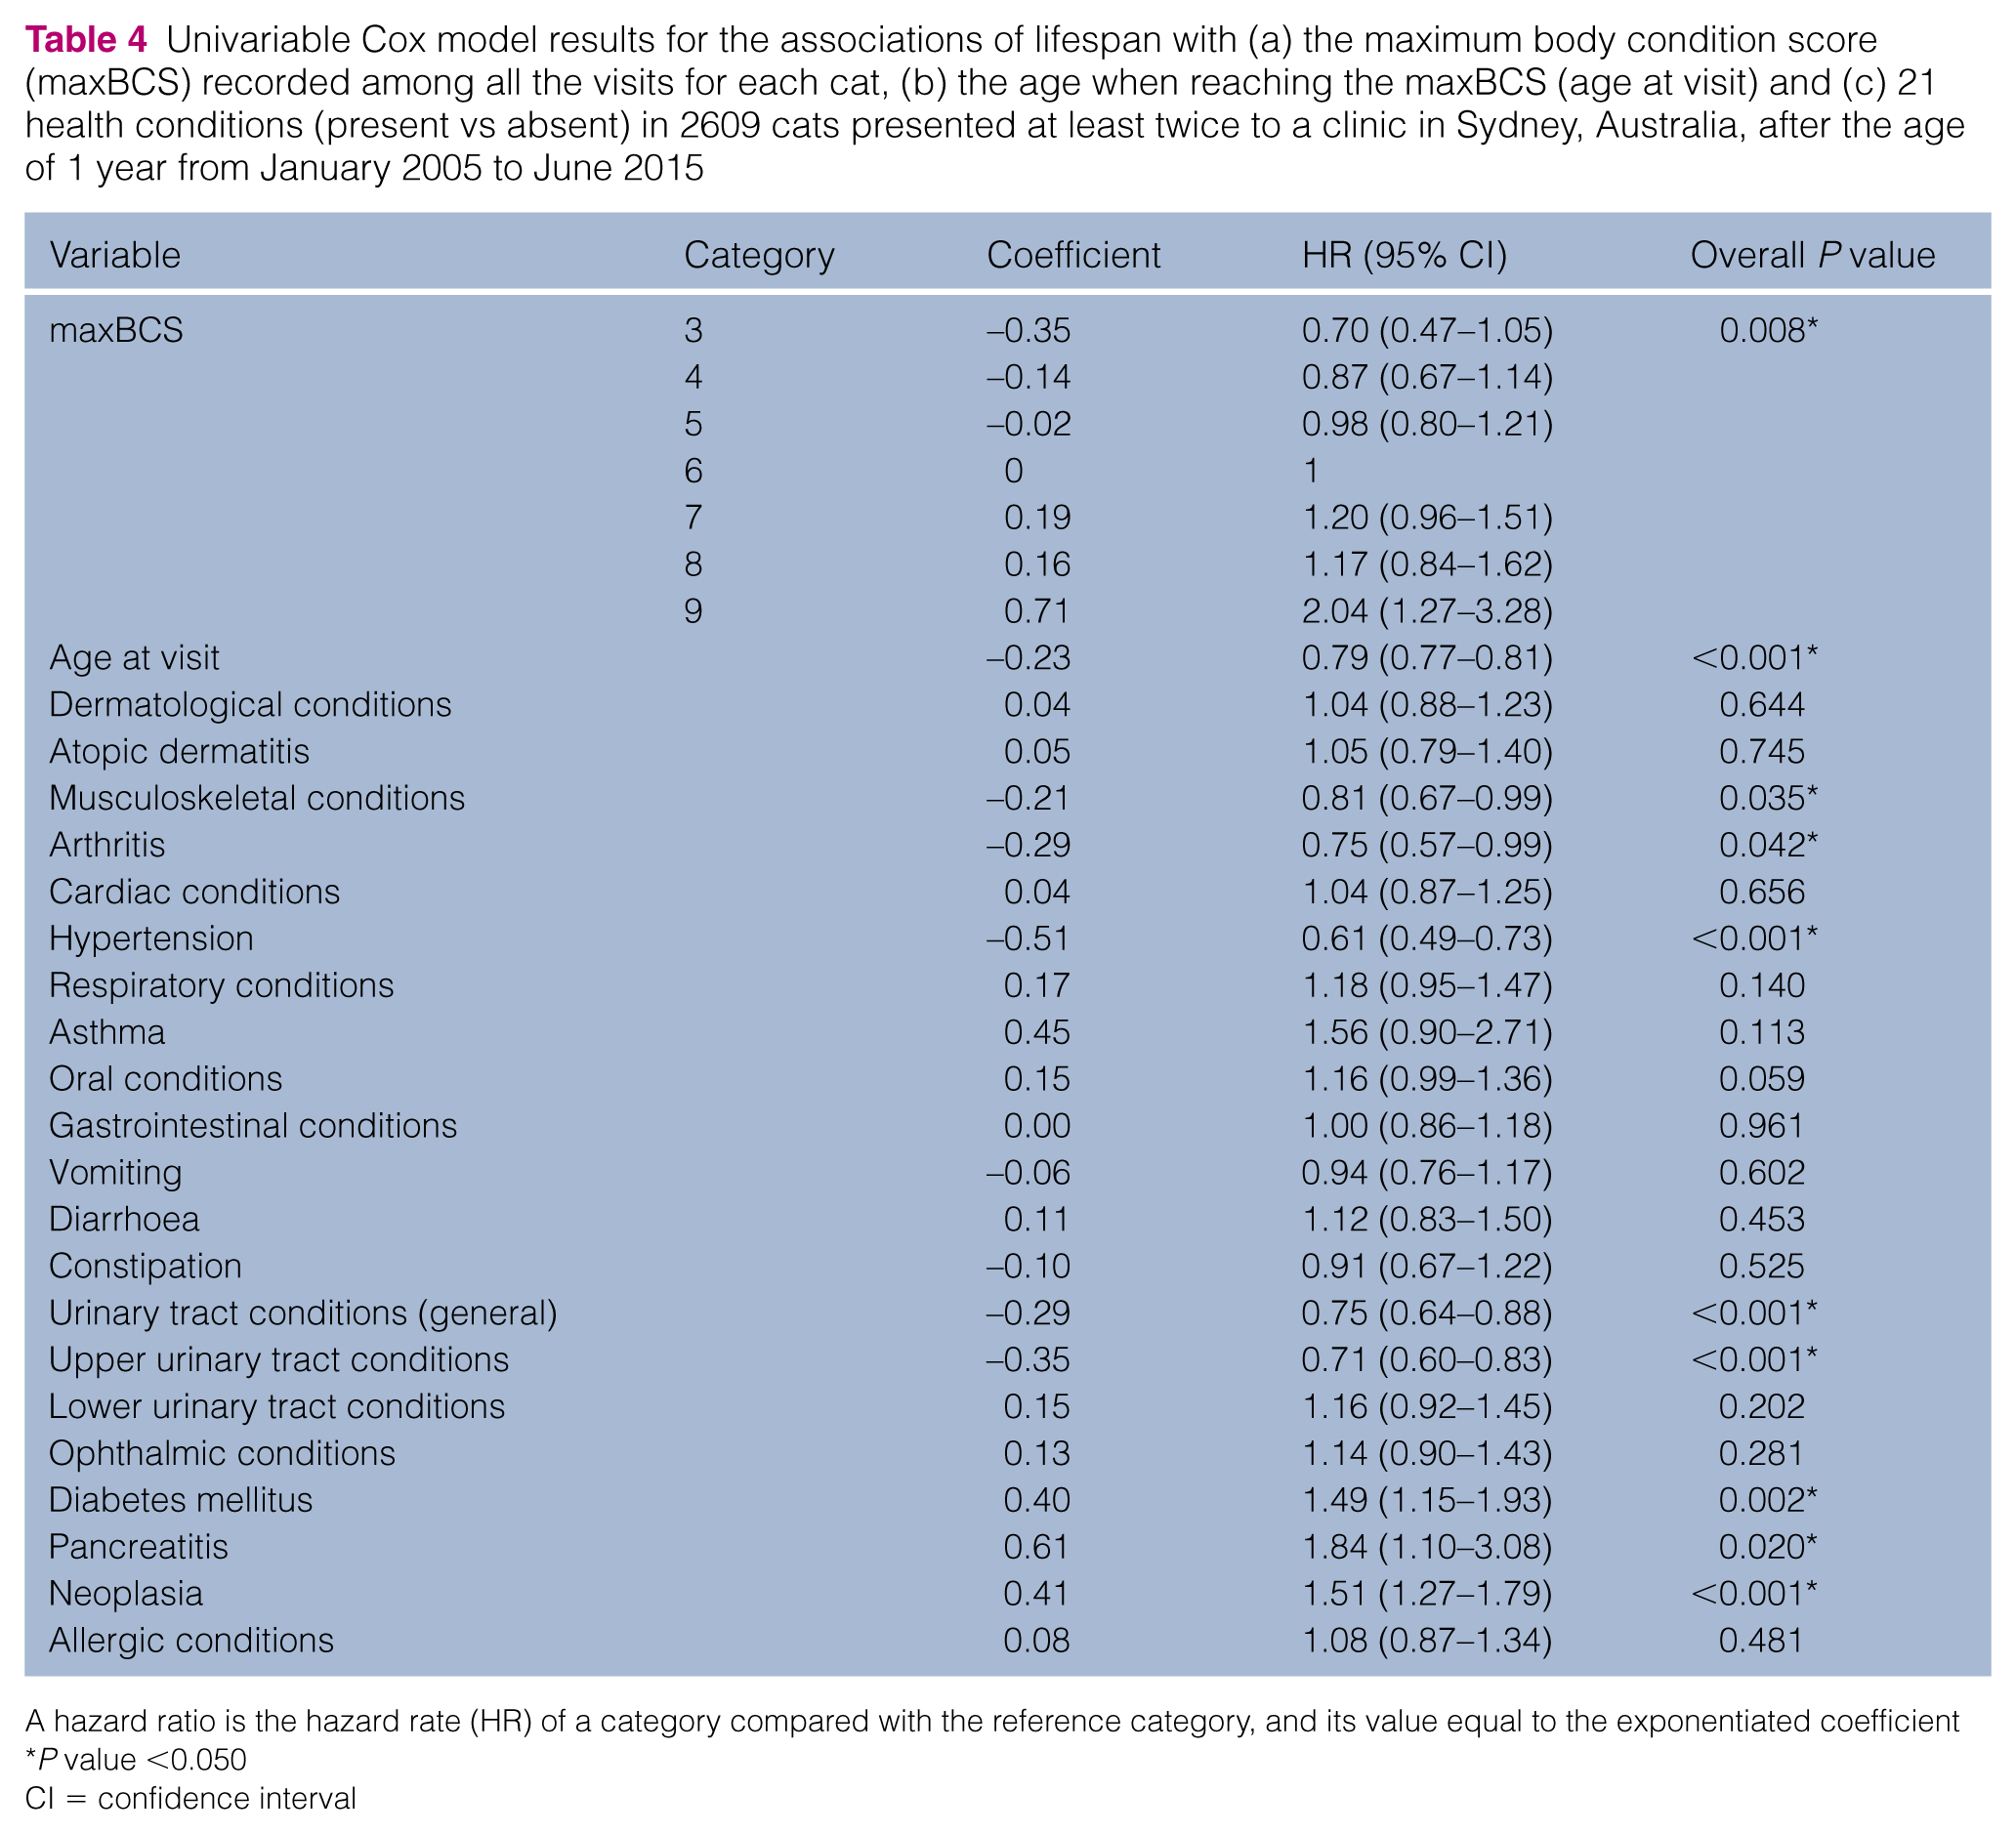
A hazard ratio is the hazard rate (HR) of a category compared with the reference category, and its value equal to the exponentiated coefficient
P value <0.050
CI = confidence interval
Final multivariable Cox model results for the associations of lifespan with the maximum body condition score (maxBCS) recorded among all the visits of each cat, stratified by the age when reaching their maxBCS in cats (n = 2609) presented at least twice to a clinic in Sydney, Australia, after the age of 1 year from January 2005 to June 2015

P value <0.050
No cats in this category died
HR = hazard ratio; CI = confidence interval
Final stratified multivariable Cox model results for the associations of lifespan with health conditions in cats (n = 2609) presented at least twice to a clinic in Sydney, Australia, after the age of 1 year from January 2005 to June 2015

HR = hazard ratio; CI = confidence interval
Musculoskeletal conditions, hypertension, oral conditions, upper urinary tract conditions, diabetes mellitus and neoplasia were significantly associated with the length of lifespan. While both diabetes mellitus (HR 1.72, 95% CI 1.31–2.26) and neoplasia (HR 1.76, 95% CI 1.47–2.10) shortened the lifespan of the cats, even being diagnosed with other health conditions was related to longer lifespan than cats not being diagnosed with those health conditions. The proportional hazard assumption was well met for all the variables in the final model apart from oral conditions.
Discussion
To our knowledge, this is the first study to investigate the associations between nine-point body condition scoring and survival and lifespan in cats. In the current study, significant associations of nine-point body condition scoring with survival and lifespan were found, and a maxBCS less than 5 and of 9 were shown to be negatively associated with both.
Cats with a maxBCS of 3, 4 and 5 were shown to have higher hazards than those with a maxBCS of 6 in the current study. Being thin alone could have an impact on survival in cats, 62 and underweight was reported as an independent risk factor for mortality in elderly humans. 63 However, the high hazards of death in lean cats might be related to the sickness that results in leanness.59,60 In this case, the low maxBCSs serve as risk markers rather than risk factors. Doria-Rose and Scarlett (2000) showed that emaciated cats had a significantly lower survival rate than cats with optimal weight. However, after accounting for age and excluding cats that died within one year after the BCS evaluation, the association became statistically non-significant. 64
Among the cats reaching their maxBCS between 1 and 3 years of age, a maxBCS of 4 and 5 had significantly higher hazards of a shorter lifespan than a maxBCS of 6. We expect that cats with a maxBCS of 3 could have had an even higher hazard than those with maxBCS of 4 if the sample size had been sufficient (there was only one cat with a maxBCS of 3 in the young age group). This trend may be explained by a higher occurrence of systemic infectious disease, which was not examined in the analysis, in young cats, resulting in both a low maximum BCS and a shorter lifespan. 65 However, as cats in middle age are not as susceptible to systemic infectious disease as those in the young age group, the higher hazard of shorter lifespan in cats with maxBCS of 3 might denote that maxBCS of 3 is an independent risk factor for shortened longevity among cats that reach their maximum BCS between 3 and 11 years of age.
Surprisingly, although conventionally BCSs of 6 and 7 are regarded as overweight and a BCS of 8 is obesity, in the current study, cats with a maxBCS of 6, 7 or 8 had the greatest survival and longevity. We consider two explanations for these results. On the one hand, a BCS of 6–8 in cats may have the least negative effects on both survival and lifespan. This does not necessarily mean that a BCS of 6–8 in cats exerts the least adverse impacts on health. As known, excessive fat accumulation increases risks for chronic rather than acute illnesses. Therefore, the adverse health impact of excessive fat accumulation might not be reflected by decreased longevity but by the higher occurrence of chronic illnesses that negatively affect cats’ quality of life.2–13 However, in humans, O&O are associated with an increase in both the risks of many disorders43,45,46,49,53,66,67 and the all-cause mortality.14–17 This difference between cats and humans may be owing to the different obesity-related diseases in these two species.
On the other hand, a maxBCS between 6 and 8 might indicate more care from owners due to closer relationships with their cats, 68 leading to longer survival and lifespan in cats. Even if there are negative impacts of excessive fat accumulation in cats with a BCS of 6, 7 or 8, the care from those owners might outweigh the impact. However, cats with a maxBCS of 9 still had a higher hazard of death than cats with a maxBCS of 6. The amount of body fat in cats with a BCS of 9 might have more detrimental effects on survival than the benefits of care they obtained from the owners. Interestingly, a maxBCS of 9 only significantly related to a shorter lifespan in cats reaching the maximum BCS in middle age. In humans, obesity in childhood and youth has been shown to result in premature mortality in adulthood. 69 However, only three observations for cats with a maxBCS of 9 in the young age group might have compromised the power of this part of the analysis accordingly.
Two explanations were considered for why hypertension, musculoskeletal conditions, oral conditions and upper urinary tract conditions were linked to increased lifespan. First, the longer the lifespan, the greater the frequency of health conditions that characteristically occur in old age, and all of the four health conditions in question are associated with old age. 65 Although neoplasia and diabetes mellitus are age-related, which seems to align with this explanation, both conditions substantially decrease longevity in cats.70–73 Second, cats without any of the four health conditions might be brought to the veterinarians for other, more severe, conditions. As many of the disorders within the four health conditions are chronic (ie, hypertension, arthritis, periodontitis, gingivostomatitis and chronic kidney disease), they would not substantially affect the lifespan until the late stages.
There are several limitations that we would like to acknowledge. First, the data used in the study were derived from one feline-dominant clinic in metropolitan Sydney, which could introduce selection bias (detailed discussion can be found in Teng et al 33 ). However, using data from a single source can also be a strength because the BCS of the cats was assessed by trained veterinarians following a standard protocol with high inter- and intra-observer agreements. 33 Nonetheless, such agreements are only within the clinic, so there is still a possibility that the BCS evaluation was systemically overestimated or underestimated, requiring future studies to verify the results. Second, the extent to which the identified health conditions reflect the true health status of each cat in the study depended largely on: (1) correct diagnosis; (2) complete details in the patient records; and (3) thoroughness of data-mining. Third, although in the current study the impact of the duration of the maximum BCS on survival was not evaluated, it is likely that having an undesirable weight for a long period would have an accumulatively negative impact on survival. Last, very low numbers of cats with a low (ie, 1–3) and high (ie, 9) maxBCS limited the power of some parts of the analyses.
Conclusions
The study yielded information on the desirable BCS for cat longevity that veterinarians could consult with. There are significant associations of nine-point body condition scoring with survival and lifespan, and BCSs less than 5 and of 9 were found to be negatively associated with both. In particular, a BCS ⩽5 should be avoided in young cats. Although conventionally BCSs of 6/7 and 8 are regarded as overweight and obesity, respectively, BCSs between 6 and 8 were associated with the longest survival and lifespan in the current study. However, greater longevity does not necessarily equate to a better quality of life. Cats living longer with chronic diseases might link to unsatisfactory welfare instead. Future studies of a more generalised cat population should elucidate the relationships between BCS and health, survival and longevity.
Footnotes
Acknowledgements
The authors greatly thank Professor Alex German, Dr Randolph Baral and Dr Peter Thomson for selflessly sharing their expertise to facilitate the completion of the study, and Mr Doug Bail for technical help in data extraction.
Conflict of interest
The authors declared no potential conflicts of interest with respect to the research, authorship, and/or publication of this article.
Funding
The authors are grateful to the Sydney School of Veterinary Science, University of Sydney, for funding this project.