
Abstract
Objectives
Chronic kidney disease (CKD) is the most common renal pathology diagnosed in geriatric cats, and its prevalence increases with age. The arterial resistive index (RI) is important when evaluating vascular resistance and compliance, and can be applied in the kidney (renal RI [RRI]), allowing the evaluation of its vascular haemodynamics. The present study aimed to: (1) investigate in cats with CKD the relationships between the RRI and the following parameters: age, sex, body weight, plasmatic creatinine, blood urea nitrogen, potassium, urine specific gravity, urine protein:creatinine ratio and systolic arterial pressure; and (2) evaluate the potential use of the RRI as a preliminary diagnostic tool in cats with CKD.
Methods
The present study involved 24 cats of both sexes. Six were healthy cats (control group [CG]) and 18 had CKD, but did not have any concomitant diseases and were not being treated with any medications (study group [SG]). For RRI measurement we used colour Doppler ultrasound (CDUS).
Results
RRI differed significantly between the CG and SG (P <0.01) and was higher in the SG. A statistically significant correlation was only achieved between the RRI and the body weight of the patients and it was negative. A strong and positive correlation was noted between the mean RRI of both kidneys (r = 0.66). Receiver–operating curve analysis allowed us to establish an admissible cut-off for the RRI value of 0.639 for a preliminary diagnosis of CKD for both kidneys.
Conclusions and relevance
No differences were found for the RRI between the left and right kidneys, suggesting that evaluation of only one kidney is sufficient to provide an estimate of the RRI value for both organs. RRI measurement, which can be achieved with CDUS, is an easy-to-use diagnostic tool that, with a cut-off value of 0.639 for both kidneys, is useful in establishing a preliminary diagnosis of CKD.
Introduction
Chronic kidney disease (CKD) is the most common renal pathology diagnosed in geriatric cats, and its prevalence increases with age. 1 Lawson et al registered values around 28% in cats aged >12 years, rising to 31% in cats >15 years. 2 The most common morphological diagnosis associated with CKD is chronic tubular–interstitial inflammation and fibrosis. 2 Regardless of aetiology, the progression of fibrosis will result in a decline in renal function with destruction of the remaining functional nephrons, promoting continuous development of the disease. IRIS created a staging system based on blood creatinine concentration (CREAT) and sub-staging based on proteinuria and blood pressure levels, allowing for better follow-up of patients. 3 According to Boyd et al, 4 the IRIS staging based on CREAT values at the time of CKD diagnosis is strongly associated with survival in cats.The use of ultrasound (US) with spectral and colour Doppler is important for the diagnosis of renal diseases as it provides additional information and assists vascular haemodynamic evaluation.5,6 In 1970, Pourcelot introduced a new Doppler index – the arterial resistive index (RI). This index measures the arterial resistance in the peripheral vessels by calculating the ratio between the peak systolic velocity (PSV) and the end diastolic velocity (EDV), which is independent of the angle and position of the transducer, allowing accurate and reproducible measurements. 6 In the kidney, vascular haemodynamic evaluation can use the renal, interlobar or arcuate artery to determine vascular renal resistance. The index used is calculated as follows: RI = (PSV – EDV)/PSV. 7 RI analysis is important when evaluating vascular resistance and compliance. It is known that the interaction between renal vascular resistance and compliance is important, and that the Doppler analysis does not distinguish between different types of kidney disease. An early renal RI (RRI) increase is not only associated with a higher vascular resistance, but can be associated with a lower vascular compliance and renal tissue lesions.5 In fact, many studies have demonstrated that the major factors affecting this index are vascular compliance and renal tissue lesions. Because of this, RRI has been proposed as a useful tool for the diagnosis of kidney diseases. 6 The present study was developed in cats and aimed to: (1) investigate in CKD cats the relationships between RRI and the following parameters: age, sex, body weight, blood urea nitrogen (BUN), potassium, CREAT, IRIS staging, urine specific gravity (USG), urine protein: CREAT ratio (UPCR) and systolic arterial pressure (SAP); and (2) evaluate the potential use of the RRI as a preliminary diagnostic tool for CKD in cats.
Materials and methods
The study included 24 cats of domestic breed and both sexes that were evaluated at the Anjos of Assis Veterinary Medicine Centre, Portugal. The cats were included in one of two groups: the control group (CG) was composed of healthy animals (n = 6) undergoing elective surgery such as ovariohysterectomy for females and orchiectomy for males, and the study group (SG) was composed of cats with CKD (n = 18). Patients with concomitant diseases or under any medication protocols were automatically excluded from the study. The cats were admitted to the study only after signed written consent was obtained from the owners. No sedation was used during any procedure. The clinical signs of the SG individuals were registered. Both groups (CG and SG) had blood levels of CREAT, BUN and potassium measured. The cats had blood pressure (BP) measurements taken, urinalysis in order to obtain USG and UPCR values, and an US examination followed by colour Doppler US (CDUS) to obtain the RRI of both kidneys.
CREAT, BUN and potassium levels were measured using a blood sample collected from the cephalic vein after topical bupivacaine gel was applied. This was performed as part of the preoperative routine examinations in the CG and to evaluate the laboratory clinical condition in the SG individuals. The oscillometric method with the Contec 08A device was used to measure BP. All measurements were carried out by the same person, with a total of six measurements for each patient, discarding the first. The BP cuff was placed on the left forelimb above the elbow and the examination took place in a quiet room prepared for the purpose. The measurements were only started after an adjustment period of 5 mins.
Urine collection was performed by cystocentesis and the urinalysis was carried out using the Uranotest 11C urine strip system with special attention paid to the USG and UPCR parameters. To evaluate the US findings in both kidneys, an ALOKA Pro Sound SSD-3500 Plus US device was used. After a trichotomy of the ventrolateral abdominal region, the cats were positioned in lateral recumbency, which varied according to the kidney to be scanned, and the US examination was performed using a multifrequency probe (5.0–7.5 MHz). It was used in conjunction with CDUS for better visualisation of renal vascular structures to help determine the RRI. During the CDUS the Doppler was aligned parallel to the vascular wall and always with an angle of 60º or less.8,9 The CDUS was performed over the renal artery, which provides best signals for vascular assessment, and then the RRI measurement was automatically accomplished by the US station (Figure 1). The left kidney was evaluated first, followed by the right kidney, and three measurements were recorded for each, with the mean of all three being used for statistical analysis.For data analysis we used the software R 3.3.1 e R Commander. Normality distributions were tested with the Shapiro–Wilk test. For parametric data, the comparisons were made with the Student’s t-test and one-way ANOVA; for non-parametric data, comparisons were made using the Wilcoxon test. For the SG, Pearson’s correlation coefficient was used to investigate the correlations between the RRI and the different parameters studied. We also performed a receiver–operating curve (ROC) analysis for determination of the RRI cut-off value for a preliminary diagnostic test. The values were considered as statistically significant when P <0.05.

Colour Doppler ultrasound image and the measurement of the renal resistive index
Results
A characterisation of the sample parameters, clinical signs, kidney US morphological changes and IRIS staging assessment is provided in Tables 1 and 2. Renal artery identification was easy in all healthy cats (100% in CG) and difficult in 16% of diseased cats (SG). There was one SG cat in which it was not possible to perform measurements of the left kidney.The RRI differed significantly between CG and SG cats (P <0.01), and the RRI values were higher in cats with CKD (SG) than in healthy cats (CG) for both kidneys (right and left) (Table 3). In both kidneys, no correlation was achieved between the RRI and the studied parameters (age, SAP, CREAT, potassium and USG [P >0.05 for all]). However, it was possible to establish a negative correlation with body weight (Figure 2); a moderate correlation with the right kidney (r = −0.57; P = 0.04) and a strong correlation with the left kidney (r = −0.72; P <0.01) (Table 4). No statistically significant differences were registered between the mean RRI of both kidneys in the cats in the SG (P = 0.28), but a strong positive correlation (r = 0.66; P = 0.02) was seen between them (Figure 3, Tables 3 and 4). Sex did not seem to affect the RRI in either kidney in cats in the SG (right kidney, P = 0.83; left kidney, P = 0.85) (Tables 3 and 4). One-way ANOVA revealed no statistically significant differences in the mean RRI with regard to IRIS staging characterisation. However, there was a tendency for higher mean RRI values in cats classified as IRIS stage 4 in both kidneys (Table 3). With ROC analysis, it was possible to establish an admissible cut-off for an RRI value of 0.639 for a preliminary diagnosis of CKD for both kidneys, with a sensitivity and specificity value of 100% (area under the curve 100%) (Figure 4).
Sample characterisation regarding sex, age, body weight, blood levels of creatinine (CREAT), blood urea nitrogen (BUN) and potassium (K), systolic arterial pressure (SAP), diastolic arterial pressure (DAP), renal resistive index (RRI), urine specific gravity (USG) and urine protein:creatinine ratio (UPCR)

Normal reference intervals considered for cats were as follows: CREAT = 0.8–1.8 mg/dl; BUN = 17.6–32.8 mg/dl; K = 3.4–4.6 mEq/l; SAP = 120 mmHg; USG = 1.013–1.034; UPCR = non-proteinuric (<0.5), borderline (0.2–0.4, and should be re-evaluated within 2 months), proteinuric (>0.4, and should be re-evaluated within 2 months)
Study group characterisation according to clinical signs, kidney ultrasound (US) morphological changes and IRIS staging assessment

BK = both kidneys; RK = right kidney; LK = left kidney; CREAT = creatinine; PD/PU = polydipsia/polyuria; UPCR = urine protein:creatinine ratio; SAP = systolic arterial pressure
Comparisons of renal resistive index (RRI) values between the healthy cats (control group; CG) and cats with chronic kidney disease (study group; SG) with respect to the right and left kidneys
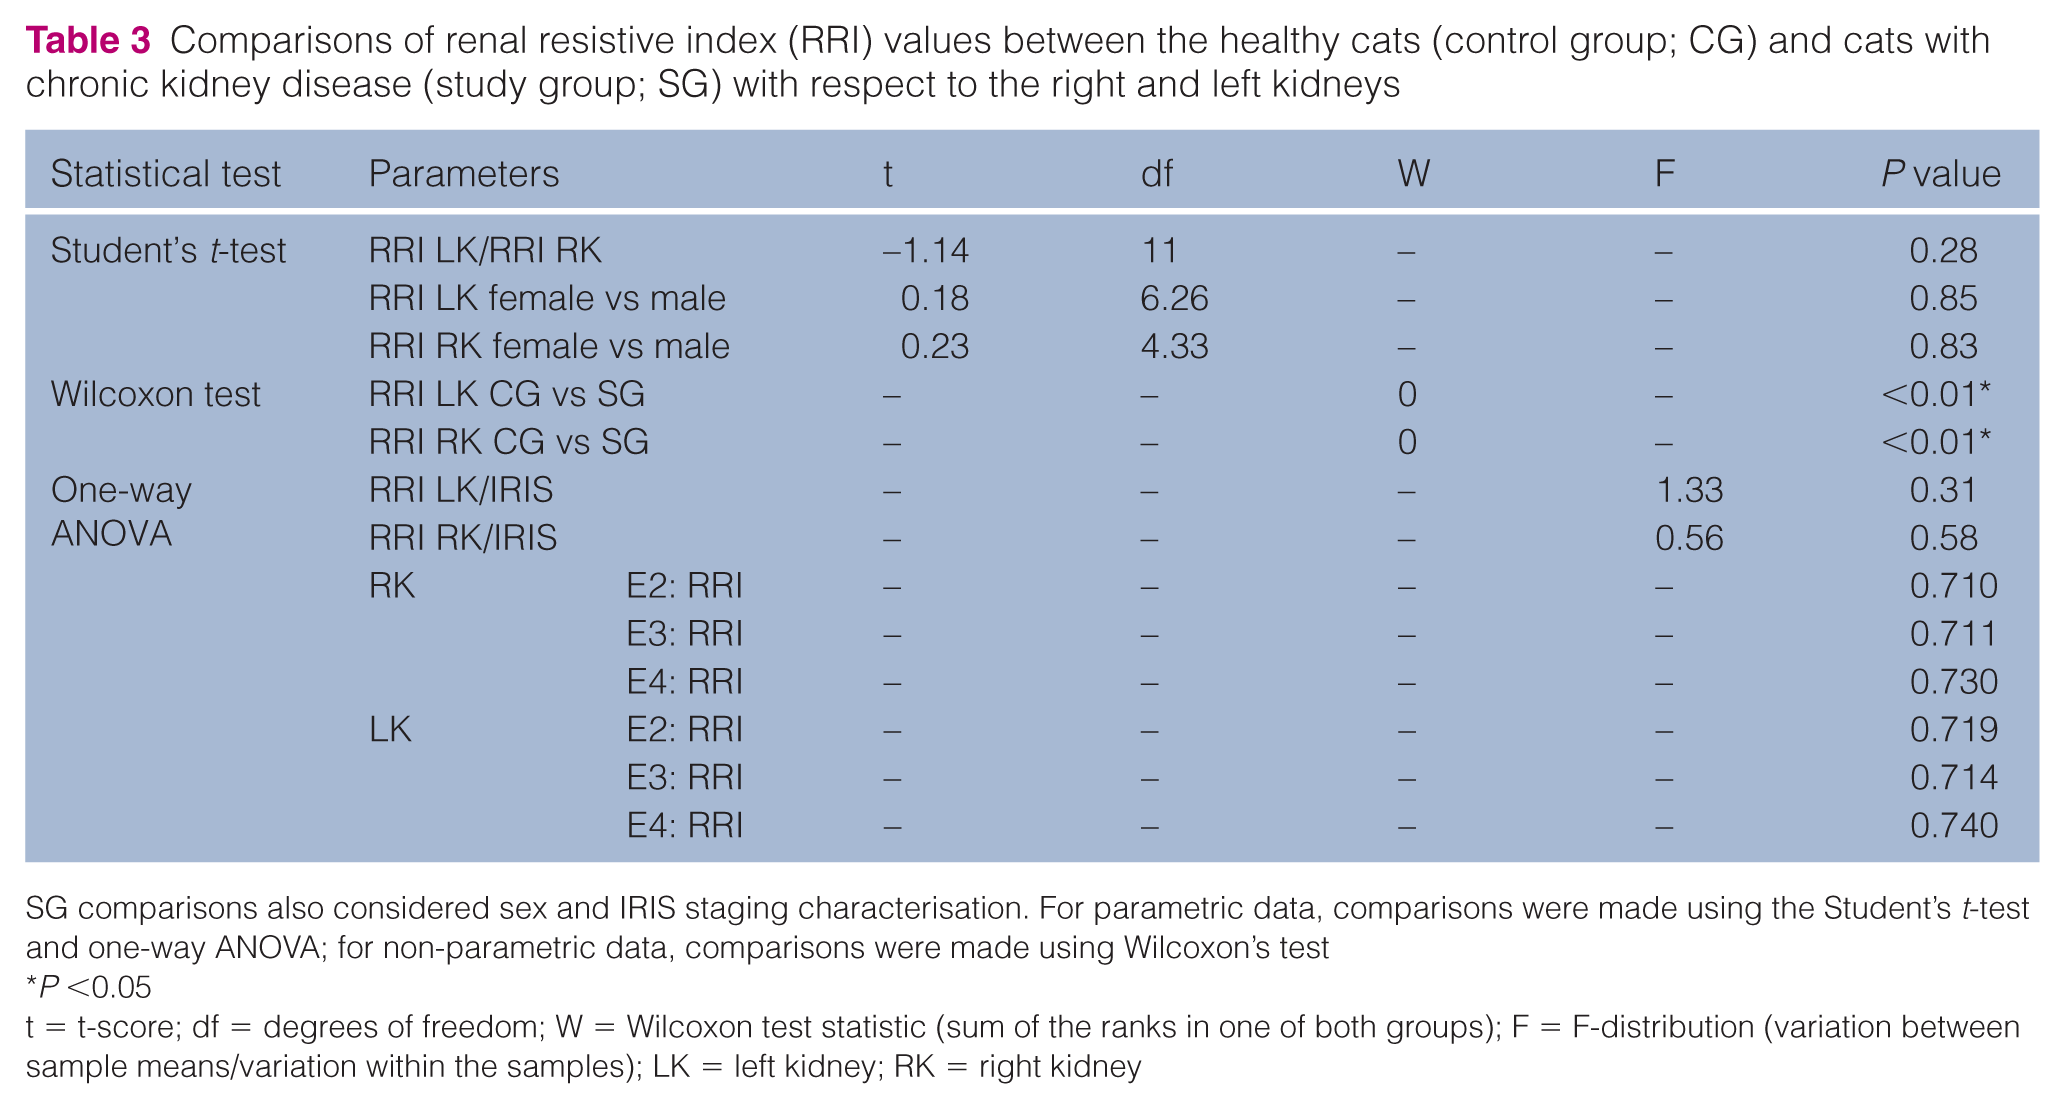
SG comparisons also considered sex and IRIS staging characterisation. For parametric data, comparisons were made using the Student’s t-test and one-way ANOVA; for non-parametric data, comparisons were made using Wilcoxon’s test
P <0.05
t = t-score; df = degrees of freedom; W = Wilcoxon test statistic (sum of the ranks in one of both groups); F = F-distribution (variation between sample means/variation within the samples); LK = left kidney; RK = right kidney
Study group results of Pearson’s correlation for the multiple parameters studied

P <0.05
RRI = renal resistive index; LK = left kidney; RK = right kidney; BW = body weight; CREAT = creatinine; K = potassium; USG = urine specific gravity; SAP = systolic arterial pressure

Correlation between renal resistive index in the right kidney and in the left kidney and body weight in the study group

Correlation between renal resistive index in the right and left kidneys in the cats in the study group

Receiver–operating curve analysis with determination of cut off, sensitivity and specificity values
Discussion
Good restraint of each cat was essential in order to avoid situations of stress and excessive manipulation that could prevent a successful CDUS examination. The examination took an average of 12 mins in cats in the CG and 20 mins in cats in the SG, with no sedation or anaesthesia of the cats. According to the results, CDUS proved to be a non-invasive, repeatable and easy-to-perform diagnostic procedure to evaluate the vascular haemodynamics of the renal artery in both kidneys and achieve an RRI value, which is in line with the results of other studies. 10
Sensitivity for detection of a significant change in a given vessel (renal, inter-lobar or accurate arteries) with CDUS is the same for both main renal and intra-renal arteries.11–13 The selection of the renal artery to measure the RRI was based on the literature, which points out that the best signals for vascular assessment are always from large segmental arteries (renal and inter-lobar in kidney) and thus the arcuate arteries from the kidney periphery should be avoided.8,9,14,15 To access the renal artery, all cats were positioned in lateral recumbency, which was a useful approach with which to identify both the renal artery and the intra-renal vasculature (arcuate and inter-lobar arteries).9,10,16,17 Obesity, bowel meteorism, tachypnoea associated with stress or pain, or poor haemodynamics due to severe renal injury are considered major factors that can limit the performance of the CDUS.16–18
The renal artery was recognised as the flow directed towards the transducer with red colour, contrary to the vessel displayed in blue, 19 and was easy to identify in all CG subjects (100%) and in the majority of the SG subjects (83.4%). Renal artery identification was more difficult to achieve in those cats (16.6% of the SG) that presented greater morphological changes in the normal renal architecture on US. A decrease in renal vasculature made it more difficult to detect the Doppler signal and required repositioning of the transducer probe for new views of the location of the renal artery. 17
According to the study results, RRI values for the healthy cats (CG) were lower than previously described normal values for the species. The reason for this might be the use of the renal artery (large segmental artery) instead of the arcuate arteries, as performed in the previous articles to measure the RRI. The SG cats presented higher RRI values than the CG cats, which was in line with the literature.6,20,21 This can be explained by the increase in vascular resistance due to the vasoconstriction suffered by the kidney during the injury process at either a glomerular, tubular–interstitial or vascular level.
Diastolic blood flow velocity is decreased at a more superior level than systolic blood flow velocity, thus reflecting a higher decrease of the end diastolic velocity than systolic peak velocity and therefore increasing the RRI value.20,21
The mean RRI values obtained from the cats in the SG were similar to the RRI results of Novellas et al and Tipisca et al,6,20 which were measured using the inter-lobar and arcuate arteries instead of the renal artery. It is known that blood velocity decreases from the renal artery to the inter-lobar arteries and from these to the arcuate arteries as they branch into the kidney parenchyma. Thus, the RRI should be higher in the renal artery than in the inter-lobar artery and higher in the inter-lobar artery than in the arcuate arteries. However, if intrinsic renal diseases are present, such as hypertension or tubular–interstitial disease, the RRI values might be increased, assuming values in the intra-renal arteries are closest to those registered at the renal artery.14,15
In this study, no statistically significant differences were registered between the RRI values measured in the right and left kidneys and it was possible to identify a strong and positive correlation between them. This might be considered an advantage, particularly in those cases where it is only possible to perform the RRI measurement in one kidney during the CDUS examination owing to the renal architecture changes associated with CKD evolution, which makes the CDUS technique more difficult to perform and more time consuming.
There was no statistically significant correlation between both kidney RRI values in SG cats and age, sex and plasmatic BUN levels, which is in line with the results of other studies.6,22–25 Five cats in the SG presented a hypokalaemic condition with clinical signs, probably due to the level of renal function loss associated with CKD evolution and consequent and persistent dehydration. 1 However, no statistically significant correlation was achieved between the RRI and the plasmatic potassium levels.Although no statistically significant correlation was seen between the RRI and the plasmatic levels of CREAT, which is in accordance with the studies of Rivers et al and Schiemann et al,21,23 it was possible to register a tendency for the right kidney to increase the RRI value as the CREAT level progressed. Considering this, it is possible that by increasing the number of sample individuals, a statistically significant relationship between the RRI value and the plasmatic CREAT level could be achieved. According to the results, it was possible to verify a trend that registered higher RRI values in both kidneys in cats classified as IRIS stage 4 according to the plasmatic CREAT concentration. However, no statistically significant correlation was found.Three SG cats were found with a USG of 1.040, which can be explained by the fact that these individuals were dehydrated. When USG values were normal or decreased, even when dehydration overlapping with polydipsia and polyuria was recorded, it is likely that the cat already had an inadequate urine concentration as a result of the diagnosed clinical condition. This is because water intake is not sufficient to compensate for urinary losses, promoting dehydration as a consequence of an efficient lack in water reabsorption capacity.1,26,27 Also, no statistically significant correlation was seen between the RRI values and the USG.It was possible to verify in 75% of the SG cats an increase in the UPCR, classified as proteinuric. It is important to note that for all SG cats, the absence of a urinary infection was always checked in order to ensure that the UPCR evaluated had an exclusively renal origin. No statistically significant correlation was achieved between the RRI values and the UPCR, which is in concordance with the study by Rivers et al. 21 No statistically significant correlation was achieved between the RRI and SAP; this is in accordance with the study of Bude and Rubin, 28 which concluded that the RRI value becomes progressively independent of renovascular resistance to the degree that vascular compliance is impaired. This explains why it is possible to see small increases in RRI values in some patients with end-stage renal disease and advanced hypertensive vascular lesions. Blood pressure was measured using the oscillometric method because it was the most affordable method. Although this is not as accurate as Doppler, the method has been reported to provide a consistent measurement of SAP in conscious cats.29–33 In the present study, all the SG cats had an SAP higher than the normal values for the species. According to IRIS classification, three individuals were characterised as hypertensive, one of which was considered severely hypertensive. This cat also presented as proteinuric, which is a clinical condition associated with severe hypertension in cats and also indicative of renal injury. 34 However, none of the cats presented a clinical condition specifically related to systemic arterial hypertension. It is important to point out that some of these cats may have had a higher stress level, making the SAP values higher than reality and thus falsifying the measurements and inducing erroneous diagnoses of systemic arterial hypertension.
A statistically significant negative correlation was achieved between the RRI values measured and the cat’s body weight. It was possible to verify that patients with lower body weights and higher RRI values also had clinical signs, such as cachexia, higher dehydration levels, severe gastrointestinal signs and a tendency to present higher CREAT values. As CKD evolves, damage and remodelling of the renal parenchyma in combination with its concomitant loss of function induces changes in the renal vasculature and, consequently, in its haemodynamic pattern. This results in vascular resistance and compliance changes with late repercussions in the RRI value, with individuals tending to present higher RRI values.21,22
ROC analysis aims to evaluate the validity of a test, estimating it sensitivity and diagnostic specificity. 35 In this study, the analysis was performed with the purpose of determining a cut-off value from which it is possible to assume a diagnosis of CKD in cats. Based on the RRI values obtained in the CG and in the SG, the ROC analysis allowed us to achieve a cut-off value of 0.639 for both kidneys. Thus, it can be assumed that cats with an RRI value higher than this threshold might have the benefit of this preliminary diagnostic tool of CKD with a sensitivity and specificity of 100%.
Conclusions
In this study it was possible to conclude that cats with CKD always presented higher RRI values than healthy cats. There were no differences for the RRI measurements between the left and right kidneys, which suggests that evaluation by CDUS of one kidney is sufficient to provide an estimate of the RRI value for both organs. Statistically significant correlation was only achieved between the RRI and the body weight of the patients, and it was negative. The results also suggest that RRI measurement, which can be achieved with CDUS, is an easy-to-use diagnostic tool that, with a cut-off value of 0.639 for both kidneys, is useful in establishing a preliminary diagnosis of CKD.
Footnotes
Conflict of interest
The authors declared no potential conflicts of interest with respect to the research, authorship, and/or publication of this article.
Funding
The authors received no financial support for the research, authorship, and/or publication of this article.