
Abstract
Objectives
Real-time PCR provides quantitative information, recorded as the cycle threshold (Ct) value, about the number of organisms detected in a diagnostic sample. The Ct value correlates with the number of copies of the target organism in an inversely proportional and exponential relationship. The aim of the study was to determine whether Ct values could be used to distinguish between culture-positive and culture-negative samples.
Methods
This was a retrospective analysis of Ct values from dermatophyte PCR results in cats with suspicious skin lesions or suspected exposure to dermatophytosis.
Results
One hundred and thirty-two samples were included. Using culture as the gold standard, 28 were true positives, 12 were false positives and 92 were true negatives. The area under the curve for the pretreatment time point was 96.8% (95% confidence interval [CI] 94.2–99.5) compared with 74.3% (95% CI 52.6–96.0) for pooled data during treatment. Before treatment, a Ct cut-off of <35.7 (approximate DNA count 300) provided a sensitivity of 92.3% and specificity of 95.2%. There was no reliable cut-off Ct value between culture-positive and culture-negative samples during treatment. Ct values prior to treatment differed significantly between the true-positive and false-positive groups (P = 0.0056). There was a significant difference between the pretreatment and first and second negative culture time points (P = 0.0002 and P <0.0001, respectively). However, there was substantial overlap between Ct values for true positives and true negatives, and for pre- and intra-treatment time points.
Conclusions and relevance
Ct values had limited usefulness for distinguishing between culture-positive and culture-negative cases when field study samples were analyzed. In addition, Ct values were less reliable than fungal culture for determining mycological cure.
Introduction
Real-time PCR detects the presence of DNA or RNA in diagnostic samples, allowing rapid identification and speciation of microorganisms. In addition to detecting infection, real-time PCR provides quantitative data about the number of organisms, or DNA copies.1,2 The PCR cycle threshold (Ct) value is the number of PCR amplification cycles at which the fluorescence generated within a reaction crosses the fluorescence threshold (a signal significantly above background fluorescence). The more target DNA present, the stronger the signal and the fewer cycles required for a positive result. The Ct value is on a logarithmic scale, with a difference of three units representing a 10-fold difference in the starting concentration of DNA. The Ct value therefore correlates with the number of copies of the target organism in an inversely proportional and exponential relationship.
PCR results are typically reported as positive, indeterminate or negative, 3 or simply as positive or negative, as was the case for the dermatophyte PCR panel in the current study. However, the quantitative results that are generated in real-time PCR could potentially be used to distinguish between clinical infection and a subclinical carrier state, 4 and may correlate with clinical severity. 3 These results are not always reported, but may be available from a reference laboratory upon request.
A field study comparing fungal culture and PCR in cats for the diagnosis of Microsporum canis dermatophytosis found that PCR had high sensitivity and specificity for diagnosis but was unreliable for determining mycological cure. 5 False-positive dermatophyte PCR results were quite common at the time of diagnosis and many PCRs remained positive at the time of mycological cure (two negative cultures).
Given its ability to detect as few as three DNA copies, 6 the analytical sensitivity of PCR is inherently greater than that of traditional methods and false-positive results are therefore to be expected, compared with the traditional gold standard. 7 It is therefore important to be able to assess the clinical significance of a positive PCR result. The goal of this study was to determine if Ct values could be used in a field setting to distinguish between culture-negative and culture-positive cats.
Materials and methods
Institutional review and approval
The study was approved by the chief executive officer of the shelter.
Study overview
This study was a follow-up to a field study in a shelter setting, comparing fungal culture and dermatophyte PCR for the diagnosis of dermatophytosis and determination of mycological cure. 5 Briefly, cats were assessed at intake and hair samples were collected for fungal culture and PCR. Weekly fungal cultures and PCRs were obtained during treatment for dermatophytosis.
Cats were classified as dermatophytosis-positive if M canis was grown on the initial fungal culture, regardless of the presence or absence of skin lesions. They were designated as true positive (TP; positive culture, positive PCR), false positive (FP; negative culture, positive PCR) or true negative (TN; negative culture, negative PCR). Mycological cure was defined as two consecutive negative cultures.8,9 Data from 132 cats from the initial study were included. For analysis during treatment, TP cats were included if they had complete data until the second negative culture (NC2), while FP and TN cats were included if they had complete data until the 14 day culture result (pretreatment, day 7 and day 14).
Real-time PCR assay
PCR was performed by a commercial diagnostic laboratory (IDEXX Reference Laboratories, Ringworm [Dermatophyte] RealPCR panel, test code 3565 RealPCR test; see Appendix 1 in the supplementary material).
The PCR result was reported as positive or negative for Trichophyton or Microsporum species. Ct values and DNA counts were provided; DNA counts were calculated from the Ct values (see Appendix 1 in the supplementary material). The cut-off Ct value was 40; any Ct value ⩽39.99 was reported as positive and values >39.99 were reported as negative.
Statistical analysis
Receiver operating characteristic (ROC) curves were generated to determine the diagnostic accuracy for Ct values, prior to and during treatment. Results were pooled for the intra-treatment analysis. A cut-off Ct value was considered acceptable if both sensitivity and specificity were >90%.
An unpaired t-test was used to compare pretreatment Ct values between the TP and FP groups. ANOVA was used to compare Ct values between the pretreatment, NC1 and NC2 time points. For the purposes of statistical analysis, a negative PCR was designated as having a Ct value of 40.
GraphPad Prism Version 7 was used for statistical analysis. The significance threshold was set at 0.05.
Results
Study population
As reported previously, 5 based on the history and the nature of their skin lesions, 61 cats were considered to be at high risk for dermatophytosis, 30 exposed and 41 at low risk. Of the high-risk group, 39.3% were fungal culture positive compared with 6.7% of the exposed group and 4.9% of the low-risk group.
Twenty-eight of the 132 cats were classified as TP, 12 as FP and 92 as TN. 5 Thirty-nine cats had complete data for analysis of the Ct values during treatment: 17 were TP, eight FP and 14 TN. The second negative culture occurred at day 14 for 13 TP cats, day 21 for three and day 35 for one, providing 40 intra-treatment data points (Table 1). There were 44 intra-treatment data points for the eight FPs and 14 TNs (day 7 and day 14 for each) (Table 1).
Intra-treatment data points for 39 cats

TP = true-positive PCR result compared with fungal culture; FP = false positive; TN = true negative
ROC curves
For the pretreatment curve, Ct values were analyzed from 28 culture-positive and 104 culture-negative cats. For the intra-treatment curve, the 84 pooled data points (Table 1) included 76 negative culture results, of which 36 were PCR positive, and eight positive culture results, of which six were PCR positive.
The pretreatment area under the curve (AUC) was 96.8% (95% confidence interval [CI] 94.2–99.5; P <0.0001), indicating high diagnostic accuracy (Figure 1a). At this time point, sensitivity was 92.3% and specificity 95.2% at a Ct cut-off value of <35.7 (interpolated DNA count approximately 300). Accuracy was lower during treatment, with an AUC of 74.3% (95% CI 52.6–96.0; P = 0.0231) (Figure 1b). During treatment, there was no Ct cut-off value at which both sensitivity and specificity were >90%, and the highest sensitivity reached was 75%.
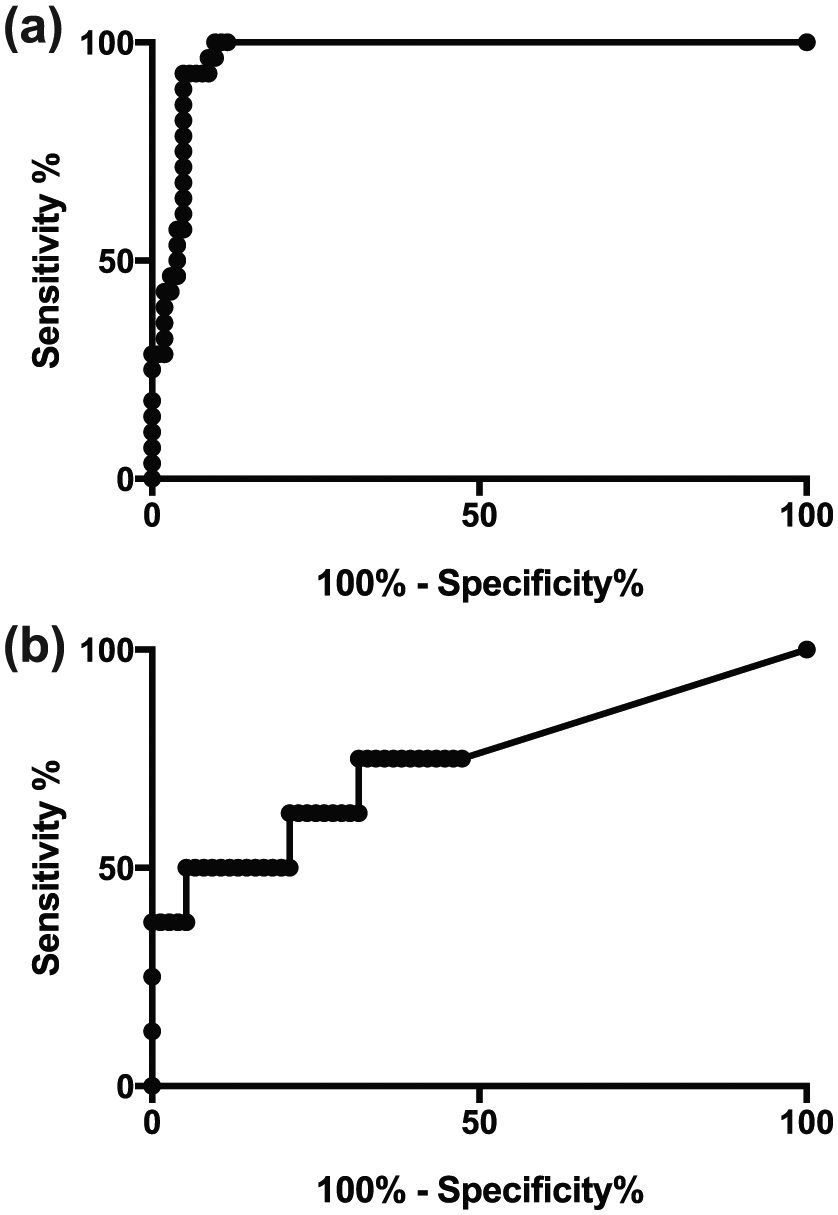
Receiver operating characteristic curves for PCR cycle threshold values. (a) Curve for 28 culture-positive and 104 culture-negative samples prior to treatment; (b) curve for six culture-positive and 76 culture-negative samples during treatment
Ct values
The lowest Ct value in the study was 20.26, corresponding to 12,565,433 DNA copies, and the highest was 39.51, or 21 DNA copies. Raw data for Ct values are provided in the supplementary material (Appendices 2–6).
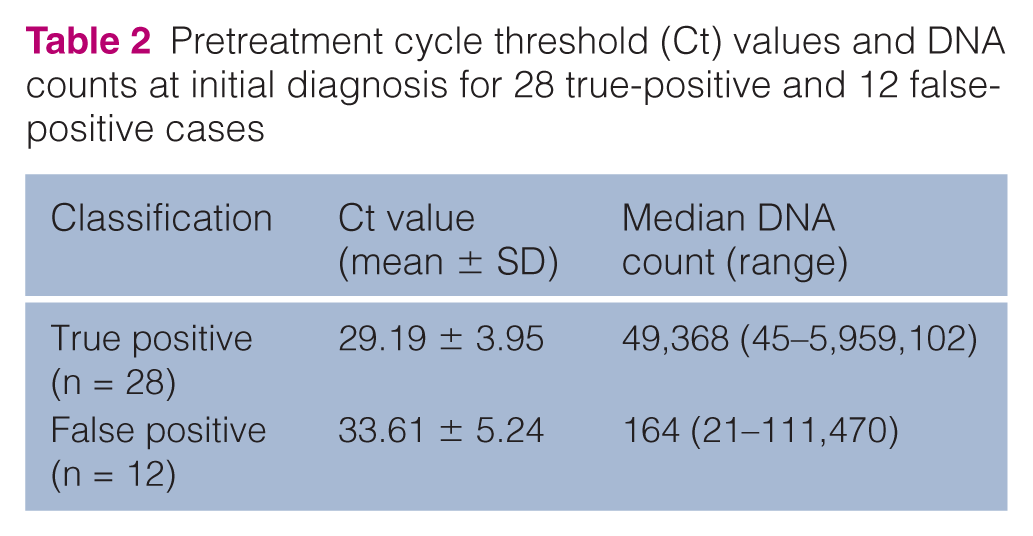
Pretreatment Ct values for 28 TP and 12 FP cases are summarized in Table 2. There was a significant difference between the Ct values (P = 0.0056); however, there was substantial overlap between the groups (Figure 2).
Pretreatment cycle threshold (Ct) values and DNA counts at initial diagnosis for 28 true-positive and 12 false-positive cases
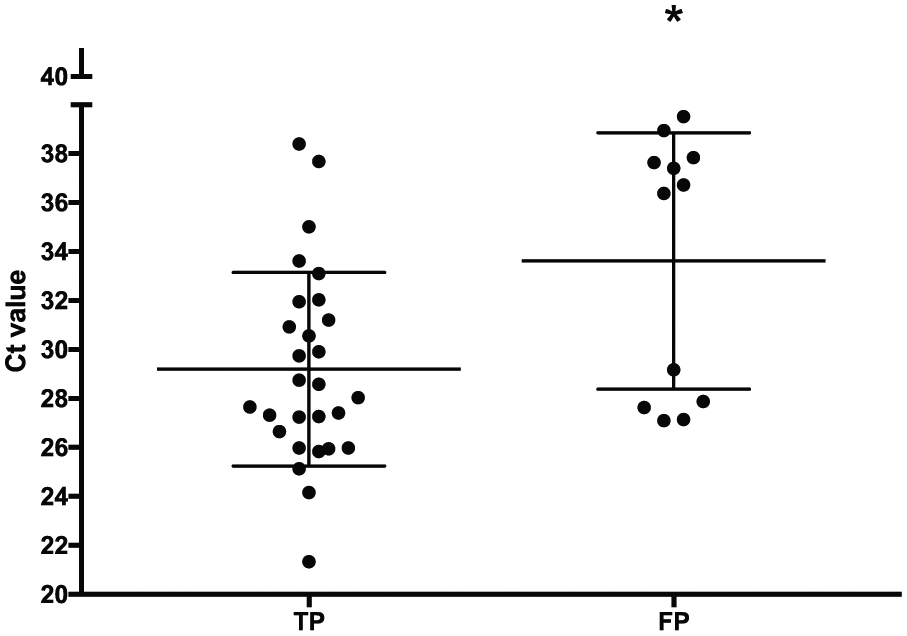
PCR cycle threshold (Ct) values for 28 true-positive (TP) and 12 false-positive (FP) cats prior to treatment. Classification was based on pretreatment fungal culture results. Bars show mean ± SD. *Indicates a statistically significant difference
Summary data for Ct values and DNA counts before and during treatment for 17 TP, eight FP and 14 FN groups are provided in Table 3.
Ct values and DNA counts before and during treatment in 39 cats

NC = negative culture
For the TP cases, there was a significant difference between Ct values at initial diagnosis and both NC1 (P = 0.0001) and NC2 (P <0.0011) but no significant difference between NC1 and NC2 (Figure 3). There was substantial overlap between Ct values for the different time points (Figure 3).

PCR cycle threshold (Ct) values at initial diagnosis, first negative culture (NC1) and second negative culture (NC2) in 17 cats with Microsporum canis dermatophytosis. Bars show mean ± SD. *Indicates a statistically significant difference compared with the pretreatment time point
Two of the FP cats had M canis-positive cultures at day 7 and/or day 14 (Table 4). These cats were classified as FP based on the study definition (ie, the initial fungal culture result was negative).
PCR cycle threshold (Ct) values for two cats in the false-positive group that had subsequent positive cultures

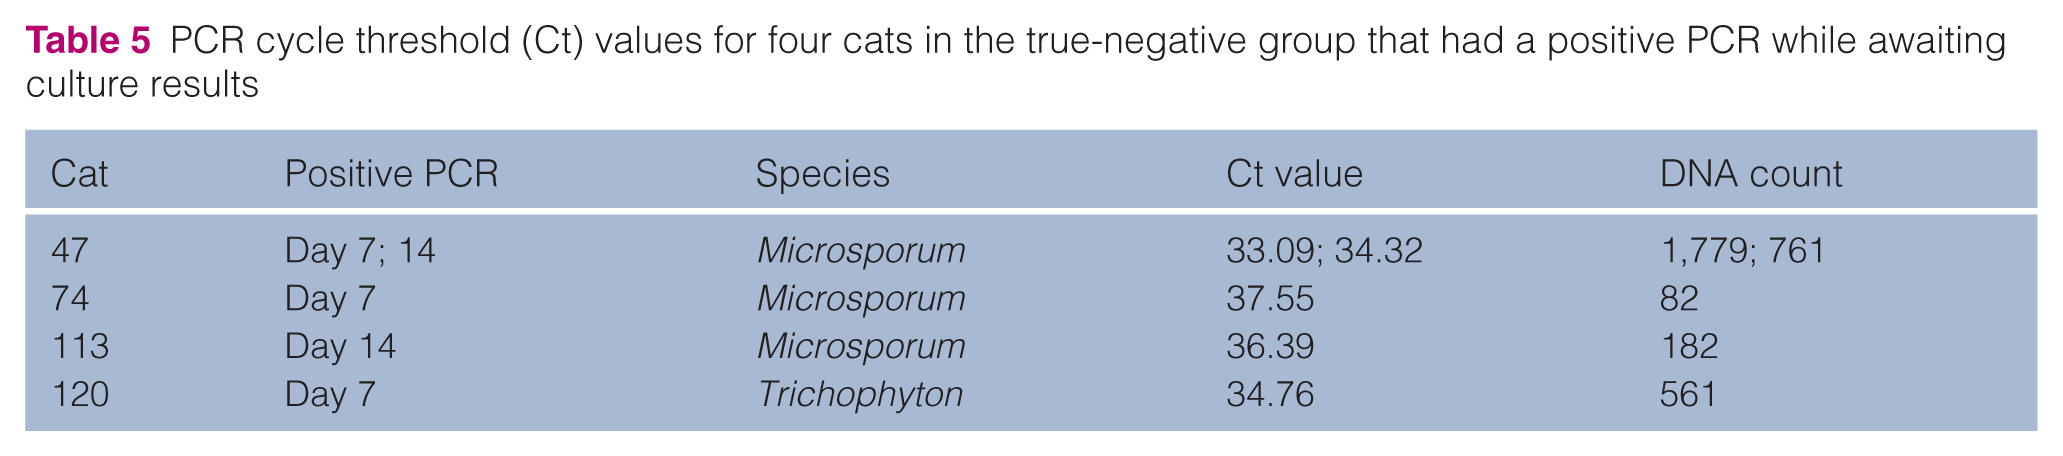
Four of 14 TN cats had one or more positive PCR results while in isolation and awaiting culture results (Table 5). These cats were on treatment during this period.
PCR cycle threshold (Ct) values for four cats in the true-negative group that had a positive PCR while awaiting culture results
Discussion
An AUC of 100% indicates perfect accuracy and 50% indicates that a test is no better than chance for discriminating between disease-positive and disease-negative patients. 10 Although a significant P value for the intra-treatment ROC curve suggests that the results were better than chance, the AUC of 73% was not adequate for clinical use. The AUCs reflected the previous finding that the PCR was sensitive and specific before treatment, but unreliable during treatment. 5
A few studies have analyzed quantitative real-time PCR data in feline infectious diseases.11–13 Studies of Chlamydophila felis and Mycoplasma haemofelis were carried out in specific-pathogen-free animals in controlled laboratory conditions and showed more consistent Ct values than the current study.12,13 A retrospective shelter study showed agreement between the amount of feline herpesvirus detected and certain histopathological lesions but did not follow Ct values over time. 11
In the current study, initial Ct values for the FP group appeared to cluster into two groups, one at the low and one at the high end of the range (Figure 2). This might reflect true infection in some of these cases and FP results in the others. Using the cut-off Ct value of 35.7 identified in the ROC curve analysis, 7/12 FP cats and 2/28 TP cats would have been considered dermatophytosis negative.
For the purposes of comparing Ct values before and during treatment, the Ct value was designated as 40 (and the DNA count as 0). This implies a known and absolute limit of detection, and could be misleading. 6 However, these data points could only be compared statistically by assigning a numerical value to negative results. Although this, of necessity, leads to some inaccuracy, it was considered a reasonable compromise, as the alternatives (including only positive values or guessing at theoretical Ct values >39.99) were unacceptable. Although there was a significant difference between the pre- and intra-treatment time points, reflecting a reduction in organism numbers, the data points did not cluster in a tight range and only 4/17 cats had Ct values ⩾35.7 at both NC1 and NC2.
The inconsistency in Ct values, particularly during treatment, may have resulted from the presence and detection of dead fungi,14,15 uneven fungal loads as an artefact of splitting the sample for culture and PCR, 7 and contamination (of hair coats, cages, instruments and diagnostic samples). Small changes can be greatly magnified by the exponential amplification process that is fundamental to PCR. Quantification in real-time PCR can also be affected by factors such as inherent biological variation between organisms in samples from different animals. 1
The results did not correct for different amounts of hair and hair follicles in different samples (this is also true for fungal culture). It has been recommended that real-time PCR results should be normalized against a known measure, such as animal cell counts in submitted samples or the volume of tissue in the sample. 6 In one veterinary study in which results were normalized in four different ways, 16 the clinical relevance of the results and the trends were not substantially affected, although some methods of normalization were prone to more variation than others. 16 It seems unlikely that the extent of variation in the current study could be accounted for by differing amounts of hair between the samples.
The fact that this study was located in a shelter, and relied on shelter staff rather than a dedicated research assistant for sample collection, is both a strength and a weakness. The results are likely to reflect those that would be obtained in many busy shelters. At the same time, the many factors that could have affected the results make it difficult to assess where the problems lay and whether, and how, test performance could be improved. At the very least, however, it is clear that meticulous attention should be paid to avoiding contamination during sample collection, as this could certainly have accounted for some of the variability in this study.
Using a cut-off Ct value of 35.7 for pretreatment decision-making might have merit, but more data are needed to confirm this. In addition, this cut-off reduces the sensitivity of the PCR test from 100% to only 92.9%. 5 A higher sensitivity has the advantage of not missing TPs, but the disadvantage of identifying more FPs. No cut-off Ct value could be identified during the treatment period.
The general tendency for Ct values to be lower for positive cases and higher for negative cases suggests that, in individual cases, the Ct values could be used to assist in clinical decision making. A combination of the absence of a history suggesting exposure, absence of skin lesions, negative Wood’s lamp findings and high Ct value could be used to support a negative diagnosis. Ct values representing DNA counts in the hundreds, rather than thousands, could reasonably trigger a query as to whether a result might be a FP.
Conclusions
Ct values had limited usefulness for distinguishing between positive and negative fungal cultures. However, Ct values may be helpful for assisting in decision making for some individual cases.
Supplemental Material
Click here for Supplementary Material
Technical information on the IDEXX Reference Laboratories, Ringworm [Dermatophyte] RealPCR panel, test code 3565 RealPCRTM test is provided in Supplementary Materials, Appendix 1. Raw data for Ct values and DNA counts are provided in Appendices 2-6
Footnotes
Acknowledgements
The investigators would like to express their gratitude to the management and staff of the Toronto Humane Society and the Winn Feline Foundation.
Supplementary material
The following files are available: Appendix 1: Technical information on the IDEXX Reference Laboratories, Ringworm [Dermatophyte] RealPCR panel, test code 3565 RealPCRTM test.
Appendices 2–6: Raw data for Ct values and DNA counts.
Conflict of interest
The authors declared no potential conflicts of interest with respect to the research, authorship, and/or publication of this article.
Funding
This study was supported by the Winn Feline Foundation (Grant W15-001).
References
Supplementary Material
Please find the following supplemental material available below.
For Open Access articles published under a Creative Commons License, all supplemental material carries the same license as the article it is associated with.
For non-Open Access articles published, all supplemental material carries a non-exclusive license, and permission requests for re-use of supplemental material or any part of supplemental material shall be sent directly to the copyright owner as specified in the copyright notice associated with the article.