
Abstract
Objectives
The objective was to compare urine protein, urine protein to creatinine ratio (UPC) and N-acetyl-β-D-glucosaminidase (NAG) index between cats with idiopathic cystitis and clinically normal cats.
Methods
Urine and blood samples were collected from 19 clinically normal cats and 19 cats with idiopathic cystitis without azotaemia at the time of first presentation. Urine protein, urine creatinine and UPC were measured. Additionally, the urinary NAG concentration was measured using the colorimetric method, and the NAG index was calculated by dividing the urinary NAG concentration by the urine creatinine ratio.
Results
Urine protein concentration (mean ± SEM) was four times higher in cats with idiopathic cystitis (218.29 ± 58.95) than in clinically normal cats (56.13 ± 9.95) (P <0.05). The UPC (mean ± SEM) of cats with idiopathic cystitis (0.70 ± 0.19) was also five times higher than that of clinically normal cats (0.14 ± 0.02) (P <0.05). The mean ± SEM NAG index in cats with idiopathic cystitis (4.79 ± 1.53 U/g) was two times higher than that in clinically normal cats (2.14 ± 0.48 U/g). The log UPC was positively correlated with the log NAG index in cats with idiopathic cystitis at moderate levels (r2 = 0.512; P <0.05).
Conclusions and relevance
Cats with idiopathic cystitis had increased amounts of urine protein and an increased UPC. Further study is needed to address the role of urinary NAG and its relationship with glycosaminoglycan levels in cats with idiopathic cystitis.
Introduction
Feline idiopathic cystitis (FIC) is a common diagnosis in cats with lower urinary tract diseases.1,2 In Thailand, 27.1% of cats visiting the Small Animal Hospital at Chulalongkorn University with feline lower urinary tract diseases (FLUTDs) were reported to have FIC. 3 Common clinical signs are irritative voiding, such as dysuria, stranguria, haematuria, pollakiuria and periuria (inappropriate urination). 4
The cause of FIC is unknown. Previous studies have suggested that FIC is caused by abnormalities of the urinary bladder lumen (local external abnormalities), layer of urinary bladder (intrinsic abnormalities) and other organs (internal abnormalities). 5 Significant aspects of the pathophysiology of FIC have been suggested to be caused by stimulation of the central nervous system, adrenal hypofunction during chronic stress and/or changes in urinary bladder permeability. 6
One urinary enzyme, N-acetyl-β-D-glucosaminidase (NAG), has previously been used in human medicine as a biomarker for detection of renal tubular damage. 7 This enzyme is a lysosomal glycosidase product of the proximal convoluted tubule of the kidney and is found in various tissues, such as liver and nervous tissues and synovial fluid. Nevertheless, NAG does not infiltrate the glomerular basement membrane because of its large molecular weight of between 130,000 and 140,000 daltons. 7 Urinary NAG is stable despite circadian variation in people, dogs and cats. It is also stable across pH and temperature changes.7,8 No difference in urinary NAG concentration between sexes has been reported. 9
Urinary NAG is widely used to measure tubular function in people,7,10 as it increases in patients with kidney disease and related complications.11,12 Urinary NAG has been proposed to be an early indicator of glomerulonephritis in cats, 13 and other studies have shown elevated urinary NAG concentration in cats with chronic kidney and urinary diseases.9,14 However, few studies have been conducted on the role of urinary NAG in cats with FIC. The urothelium of a normal urinary bladder is lined by glycosaminoglycans (GAGs),15,16 and one hypothesis for the cause of FLUTD and FIC is therefore decreased urinary GAG levels and increased degradation of endogenous urinary GAGs in cats. 17 NAG can degrade mucopolysaccharides and glycoproteins in the renal tubular epithelium. 18 Additionally, it has been proposed that bacteria or crystals in urine contact pain receptors on the urothelium and cause FIC in cats. 4 Changes in urinary NAG concentration may affect GAGs lining the urinary bladder and induce FIC. If urinary NAG plays a role in the pathophysiology of FIC in cats remains to be investigated.
Materials and methods
Cats diagnosed with idiopathic cystitis were targeted. All cats with irritative voiding signs, such as dysuria, stranguria, pollakiuria, haematuria and periuria presented to the Small Animal Hospital at Chulalongkorn University, Bangkok, Thailand, between April 2014 and August 2015 were included in the FIC group, which comprised 19 cats. Non-inclusion criteria were calculi, neoplasia and/or congenital abnormalities based on double-contrast radiography or ultrasonography, urinary tract infection based on quantitative urine culture results or any history of urinary tract infection, azotaemia, diabetes mellitus, hyperthyroidism and any glucosamine administration within 1 month prior to inclusion. To establish a control group, data were obtained from clinically healthy client-owned cats that were brought to the same hospital for neutering and/or vaccination. Each clinically normal cat underwent a standard physical examination by the veterinarian present at its first visit. The haematology, blood chemistry and urinalyses of these cats were within the normal reference intervals. 19
Samples of urine (5 ml) were collected by voiding (midstream), catheterisation and/or cystocentesis at the time of initial presentation. A commercial dipstick (Combur 9 Test) was used for analysis of pH, protein, glucose, ketone, bilirubin, leukocyte and erythrocyte levels. Urine specific gravity was measured using a refractometer. Urine sediment (cast, red blood cell, white blood cell and crystals) was examined under a microscope within 30 mins of collection. 20 The urine was both collected and submitted for quantitative urine culture and drug sensitivity by the Department of Veterinary Pathology, Faculty of Veterinary Science, Chulalongkorn University, within 1 h. The cut-off point for positive urine bacterial culture is >104 CFU/ml for urine collection by cystocentesis and catheterisation. Midstream urine samples were considered positive when bacterial culture was >105 CFU/ml. 21
Owners were asked to allow their cats to be studied, and to sign consent statements. The study protocol was approved by the Ethics Committee for Human and/or Animal Experimentation, Faculty of Veterinary Science, Chulalongkorn University.
Laboratory examination
The urine supernatant was separated by centrifugation at a relative centrifugal force of 1519 × g for 5 mins and stored at −80 °C for further analysis of urine creatinine, urine protein and urinary NAG. Urinary creatinine (mg/dl) was determined using the alkaline picrate endpoint reaction (colorimetric) method, 22 as a picrate–creatinine complex is formed by the reaction of creatine and picrate ions in alkaline conditions. Urine protein (mg/dl) was analysed using the Bradford (colorimetric) method. 23 A dye-binding assay was conducted in which the Coomassie Brilliant Blue G-250 dye (Bio-Rad Protein Assay) changed in acidic conditions, depending on the protein concentration in the urine sample. The urine protein to creatinine ratio (UPC) was calculated by dividing the urinary protein concentration by the creatinine concentration.
Urinary NAG concentration (U/l) was quantified using a colorimetric assay in which a 3-cresolsulfonphthaleinyl-N-acetyl-β-D-glucosaminidase substrate was hydrolysed by NAG with the release of 3-cresolsulfonphthalein (3-cresol purple) in alkaline conditions. 24 The NAG index (U/g) was calculated by dividing the NAG concentration into the urine creatinine concentration ratio.
Statistical analysis
All statistical data were analysed using SPSS Statistics, version 17.0 (IBM). The significance level was considered to be P <0.05, and quantitative data on urinary NAG concentration, NAG index, urine protein and UPC were taken as the logarithm (log) for normalised distribution. Quantitative data were reported as mean ± SEM. The differences between groups of NAG indexes were tested using an independent t-test, and the correlation between the log NAG index and serum creatinine or the log UPC was drawn using the Pearson correlation.
Results
Thirty-eight cats were included in the study: 19 clinically normal cats and 19 FIC cats. The mean ± SD ages of the clinically normal cats and the FIC cats were 3.42 ± 0.81 and 3.55 ± 0.56 years, respectively, and the mean ± SD weight of the FIC cats (4.38 ± 0.21 kg) was higher than that of the clinically normal cats (3.58 ± 0.22 kg) (P <0.05). Domestic shorthair cats (33/38; 86.8%) were the most prevalent breed in this study. There were also four Persians (10.5%) and one (2.6%) American Shorthair in the FIC group. There were eight intact males (8/19; 42.1%), five castrated males (5/19; 26.3%), one intact female (1/19; 5.3%) and five neutered females (5/19; 26.3%).
The completed blood count and blood chemistry results for all cats were within reference intervals, 19 and the urine specific gravity of each cat was >1.035. Most cats (35/38; 92.1%) had a urine pH of between 6.0 and 7.0. Only 1/19 (5.3%) FIC cats had a urine pH of 8.0. A dipstick protein reaction of 3+ was found in the urine samples of FIC cats (4/19; 21.1%). All clinically normal cats and some of the FIC cats (7/19; 36.8%) had more than three white blood cells per high power field in their urine samples. However, cats with idiopathic cystitis (9/19; 47.4%) had numerous red blood cells (more than three cells per high power field). Struvite was the most common crystal found in the urine of FIC cats (4/19; 21.1%) (Table 1).
Urinalysis results in clinically normal cats and cats with idiopathic cystitis

FIC = feline idiopathic cystitis; USG = urine specific gravity; uWBC = white blood cells in urine; HPF = high power field; uRBC = red blood cells in urine; CaOX = calcium oxalate
Proteinuria and NAG index analysis
Although the mean ± SEM of the NAG index in cats with idiopathic cystitis (4.79 ± 1.53 U/g) was higher than that in clinically normal cats (2.14 ± 0.48 U/g), NAG index was not significantly different between groups (Table 2; Figure 1). FIC cats had a higher mean ± SEM of urine protein than did clinically normal cats (P <0.05). In the same trend, the mean ± SEM of the UPC in FIC cats (0.70 ± 0.19) was higher than that in clinically normal cats (0.14 ± 0.02) (P <0.05) (Table 2; Figures 2 and 3).
Urine creatinine (UCr), N-acetyl-β-D-glucosaminidase (NAG), NAG index, urinary protein (Uprotein) and urine protein to creatinine ratio (UPC) in clinically normal cats and cats with feline idiopathic cystitis (FIC)

Data are mean ± SEM
P<0.05 when compared with clinically normal cats

Box plot of the mean ± SEM urinary N-acetyl-β-D-glucosaminidase index according to group. FIC = feline idiopathic cystitis
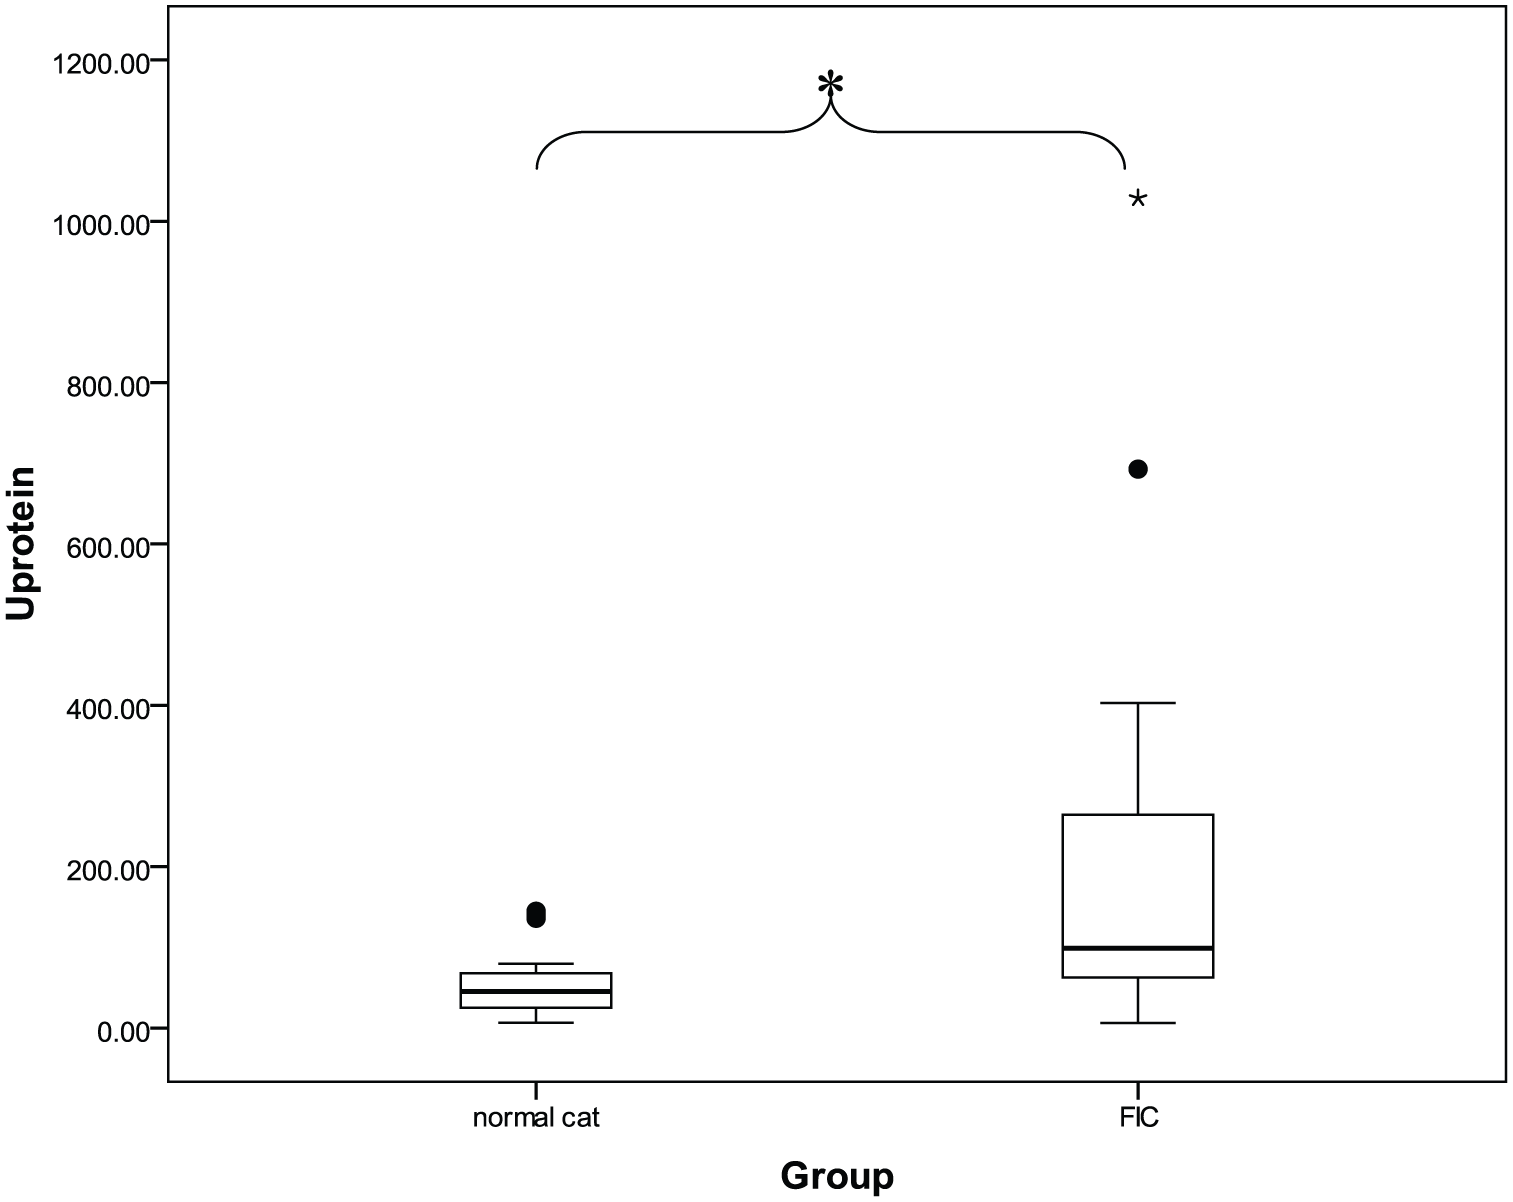
Box plot of the mean ± SEM urine protein according to group, revealing a significant difference (P <0.05) between the normal cat group and the feline idiopathic cystitis (FIC) group tested using an independent t test
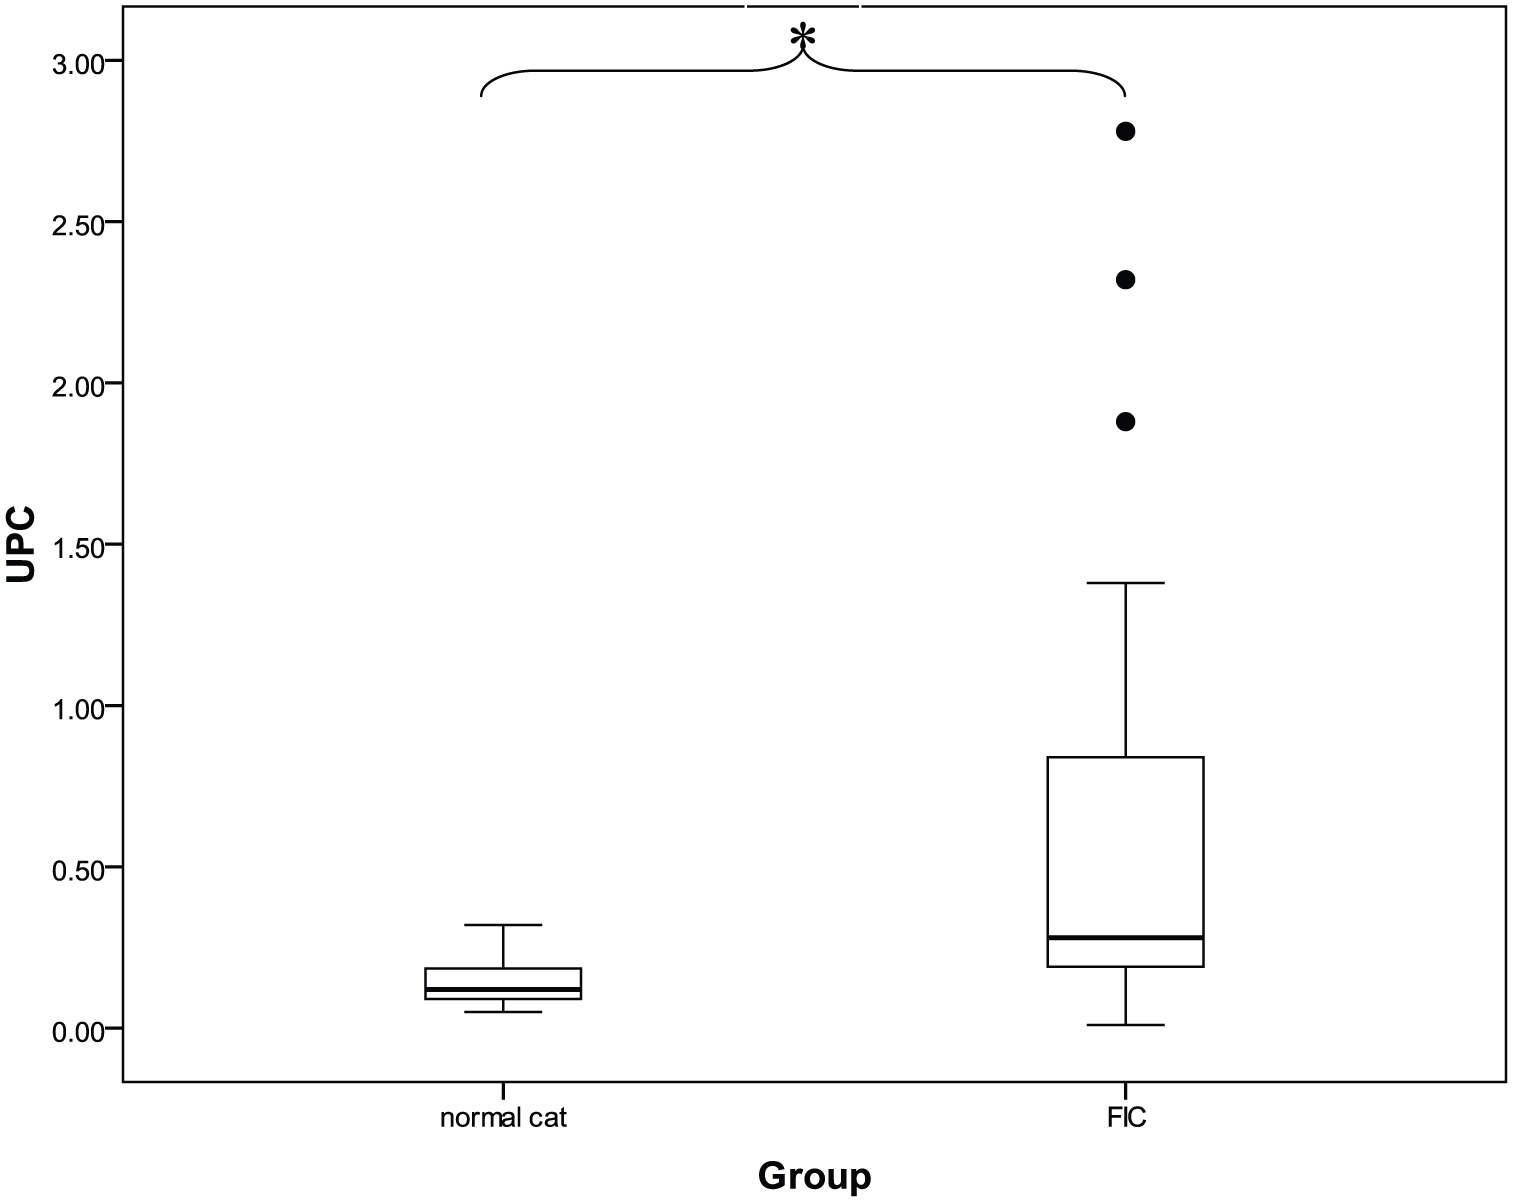
Box plot of the mean ± SEM urine protein to creatinine according to group, revealing a significant difference (P <0.05) between the normal cat group and the feline idiopathic cystitis (FIC) group tested using an independent t test
Relationships of log NAG index and serum creatinine or log UPC
When the relationship between log NAG index and serum creatinine was determined, the log NAG index and the log UPC in the FIC group demonstrated a moderate positive correlation (r2 = 0.512; P <0.05) (Figure 4), but there was no significant relationship between log NAG index and serum creatinine.

Scatter plot of the Pearson correlation between log urinary N-acetyl-β-D-glucosaminidase (NAG) index and log urine protein to creatinine (UPC) in cats with feline idiopathic cystitis (FIC) (Pearson correlation, r2 = 0.512; P <0.05)
Discussion
Each cat with FIC in the present study had a urine specific gravity of >1.035, indicating that its kidneys could concentrate urine. In general, the urine pH of normal cats is between 6.0 and 7.0. 20 One cat in the FIC group had a urine pH >7.0, which may have been due to cystitis. The permeability of the urinary bladder is increased in cats with cystitis, and plasma protein can therefore leak into the urine. Some studies have indicated that alkaline urine might result from stress in cats with urinary disorders. 25 Struvite crystals were found in four cats with FIC, due to crystal formation in alkaline urine. 26 However, food and collection time of the urine samples may also affect urine pH. 21 FIC cats in the present study had proteinuria, which usually accompanies haematuria or inflammation of the urinary bladder. Cats with macroscopic haematuria often present with a dipstick protein reaction of at least 3+. 21
FIC cats had higher UPC levels than did clinically normal cats. An increased UPC in FIC cats may be caused by inflammation or haemorrhage in the lower urinary tract, 21 or by increased permeability of the urinary bladder wall, which results in plasma protein leakage into the urine. 21
The roles of different types of protein in the lower urinary tract have been proposed to be associated with the pathogenesis of FIC. Lemberger et al have demonstrated that cats with idiopathic cystitis have significantly lower Trefoil factor 2 (TFF2) concentrations than do control cats. 27 They believe the TFF2 protein might play a role in the healing process of the epithelium and stabilisation of the bladder mucous layer. Other research groups have analysed the role of fibronectin and reported increased levels in cats with idiopathic cystitis compared with normal cats, cats with urolithiasis and cats with bacterial urinary tract infections.28,29 Increased levels of fibronectin in urine are caused by fibronectin lost from the urinary bladder when the urinary bladder epithelium is damaged. 28
The NAG index in FIC cats was two times higher than that in clinically normal cats. However, statistical testing for the mean of the two groups revealed that the values were not significantly different. The increased mean in the FIC group might be related mostly to a few individuals with extreme values. Increase in NAG activity or NAG index has been previously related to renal (glomerular) proteinuria. In that case, this could be attributed to an increased tubular lysosomal protein processing. Another hypothesis would be that a significant part of the proteinuria observed in cats diagnosed with FIC was, in fact, of glomerular origin.
Our findings followed the same trend as one previous study, which reported that cats with LUTD had a NAG index within the range of that of normal cats. 9 In that study, five cats with FLUTD were studied, and the NAG index ranged between 1.1 and 3.2 U/g, with the NAG index (1.78 ± 0.38 U/g) and NAG measured using different methods. Panchaphanpong et al have reported that cats with FIC have a significantly lower urinary GAG to creatinine ratio. 30 The trend of an increased NAG index in the present study may explain why a lower GAG to creatinine ratio has been observed in cats with FIC. NAG has been proposed to be involved with the degradation of GAGs in circulation, 31 and one characteristic of FIC is proteinuria. 32 Some limitations of the present study were also presented, including small sample size and a different method of urine collection, which potentially may influence the results of the urinalyses.
Conclusions
Changes in urinary NAG concentration are associated with increased levels of proteinuria and may be related to pathological abnormalities in cats with FIC. However, further study is needed to determine the relationship between urinary GAGs and NAG index in cats with FIC.
Footnotes
Conflict of interest
The authors declared no potential conflicts of interest with respect to the research, authorship, and/or publication of this article.
Funding
The present study was supported by grants from the 90th Anniversary of Chulalongkorn University, Rachadapisek Sompote and TJ Animal Health (Thailand) Co, Bangkok, Thailand.