
Abstract
Objectives
The aim of the study was to describe the morbidity pattern of different diagnostic categories in insured cats in Japan by age, sex and breed.
Methods
The annual incidence rates of having at least one insurance claim were calculated overall and stratified by diagnosis, age, sex and breed using data from insured cats in the period April 2008 to March 2013.
Results
The overall annual incidence rate of having at least one insurance claim was 4632 (95% confidence interval 4608–4656) cats per 10,000 cat-years at risk. The highest annual incidence rate was obtained for digestive system disorders, followed by urinary tract disorders and dermatological disorders. The incidence rates varied between breeds for most diagnostic categories: for cardiovascular system disorders, Scottish Fold, American Shorthair, Persian, Maine Coon, Norwegian Forest Cat, Ragdoll and Bengal had a higher annual incidence rate than crossbreeds.
Conclusions and relevance
This study provides comparative and quantitative estimates of morbidity pattern in insured Japanese cats. These estimates can be utilised by veterinary practitioners, breeders and owners in diagnostic decision-making, breeding and when selecting a new pet, respectively.
Introduction
As in many countries, in Japan the cat is one of the most popular companion animals. 1 It is estimated that approximately 10 million cats are currently owned in Japan and 10% of households own at least one cat. 1 Despite substantial medical advances at an individual cat level, there is a shortage of health information on cats at a population level. 2 Health information at population level can be utilised by veterinary practitioners to guide diagnostic decision-making, by breeders when planning breeding programmes and by owners when acquiring a new pet.
Data kept by pet insurance companies can be a potentially useful source of information regarding diseases in the owned population of cats and dogs.3–9 A benefit of using pet insurance data is that the population at risk is known and estimates of disease prevalence and/or incidence can be calculated.7,8,10
Data on an insured dog population in Japan have been used to estimate the life expectancy of dogs, 11 as well as the annual prevalence of different diagnostic categories of dog diseases by age, sex and breeds. 12
The purpose of this study was to describe the pattern of morbidity in cats, as reflected by claims for veterinary care insurance in cats insured by the Anicom insurance company during 2008–2013. Findings are presented overall and stratified by age, sex, breed and diagnosis.
Materials and methods
Insurance procedures
Healthy cats younger than 11 years old are eligible to enter the Anicom insurance programme. The insurance policy term is 1 year from enrolment. The owner can renew the policy at the end of each policy year until the cat dies, or terminate the policy at any time if he or she so desires. The Anicom pet insurance programme covers veterinary care costs. If a cat receives veterinary care, the owner gets between 50% and 90% of the cost reimbursed, depending on the type of insurance programme the cat is covered by. There is a maximum amount of reimbursement set for veterinary care without hospitalisation, veterinary care with hospitalisation and veterinary care with surgery, but there is no fixed deductible cost. The insurance claims are settled by the attending veterinarians, who submit the claims to the insurance company either electronically or on paper. Basic data, such as the date of birth, breed and sex, are submitted at the time of the cat’s enrolment into the insurance programme. Date of visit to the veterinarian, amount paid for the veterinary care and reason for the claim are submitted with the claim.
Data management
Data on all cats aged 0–21 years that entered an insurance programme or that had an insurance policy renewed during the period from 1 April 2008 to 31 March 2013 were entered into a database for the calculation of annual incidence. The variables included in the database were age, sex and breed at entrance into, or renewal of, the insurance programme. Sex was either male or female because recording and timing of neutering could not be reliably determined from the database. Fifty-five breed codes were used in the insurance database. Data on claims for veterinary care, including the reasons for claims, were also entered into the database.
The reasons for claims stated on the claim form were used as diagnostic information and were divided into one of the 18 diagnostic categories by type of disease or body system. These were disorders of cardiovascular, respiratory, digestive, urinary, reproductive, neuromuscular and musculoskeletal systems; hepatobiliary and exocrine pancreatic disorders; ophthalmological, otic, dental and dermatological diseases; immunological and endocrine disorders; infectious diseases, parasitic diseases, injuries, neoplasia and unknown. These diagnostic categories have been developed by Anicom based on the International Classification of Diseases (ICD-10), 13 which is also a mixture of organ system and process categories. The process categories were infectious diseases, parasitic diseases, injuries and neoplasia. Diseases overlapping organ and process were classified a priori to process categories; for example, liver tumour was classified as neoplasia. Veterinarians, when they complete the insurance claim form for the owners, supposedly choose one of these diagnostic categories, as well as the clinical signs, that resulted in the veterinary care. In cases where the cause stated on the claim form is only a symptomatic diagnosis, such as loss of appetite, diarrhoea, and so on, and unable to fit into any of these categories, the cause was classified as ‘unknown’.
Calculation of annual incidence rates
The annual incidence rate was used as an epidemiological indicator of cat diseases in this study. The annual incidence rates of having at least one veterinary care event were calculated overall and stratified by age, sex, breed, fiscal year and diagnostic categories. The annual incidence was calculated with the number of cats that had at least one insurance claim for the respective diagnostic categories during the 1 year observation period as numerator, and the exact time at risk (cat-years at risk [CYAR]) as the denominator. A cat with claims submitted for different diagnostic categories appeared in the numerator for all of these diagnostic categories. The incidence rates were expressed as the number of cats with a claim per 10,000 CYAR. Cats were at risk from either 1 April 2008 or the start date of insurance until 31 March 2013 or the date of cancelation of the insurance policy. CYAR was calculated without excluding the time after the date of the claim. A total of 64,575 cats were included in the study and contributed to the CYAR.
We calculated the diagnosis-specific annual incidence rates for age and sex. To correct the age distributions and enable comparison between breeds, we also calculated annual incidence rates standardised for ages for pure-breed cats, using the direct standardisation method, 14 with a population of crossbreeds as the standard population. The 95% confidence intervals (CIs) of the annual incidence rate were calculated using the formula IR ± 1.96*([IR × (1–IR)]/n)0.5, where IR is the incidence rate and n is the number of CYAR. 15 Non-overlapping 95% CIs were used as evidence of statistical difference. We used Microsoft Excel 14.0 for the statistical analysis.
Results
Population and overall morbidity
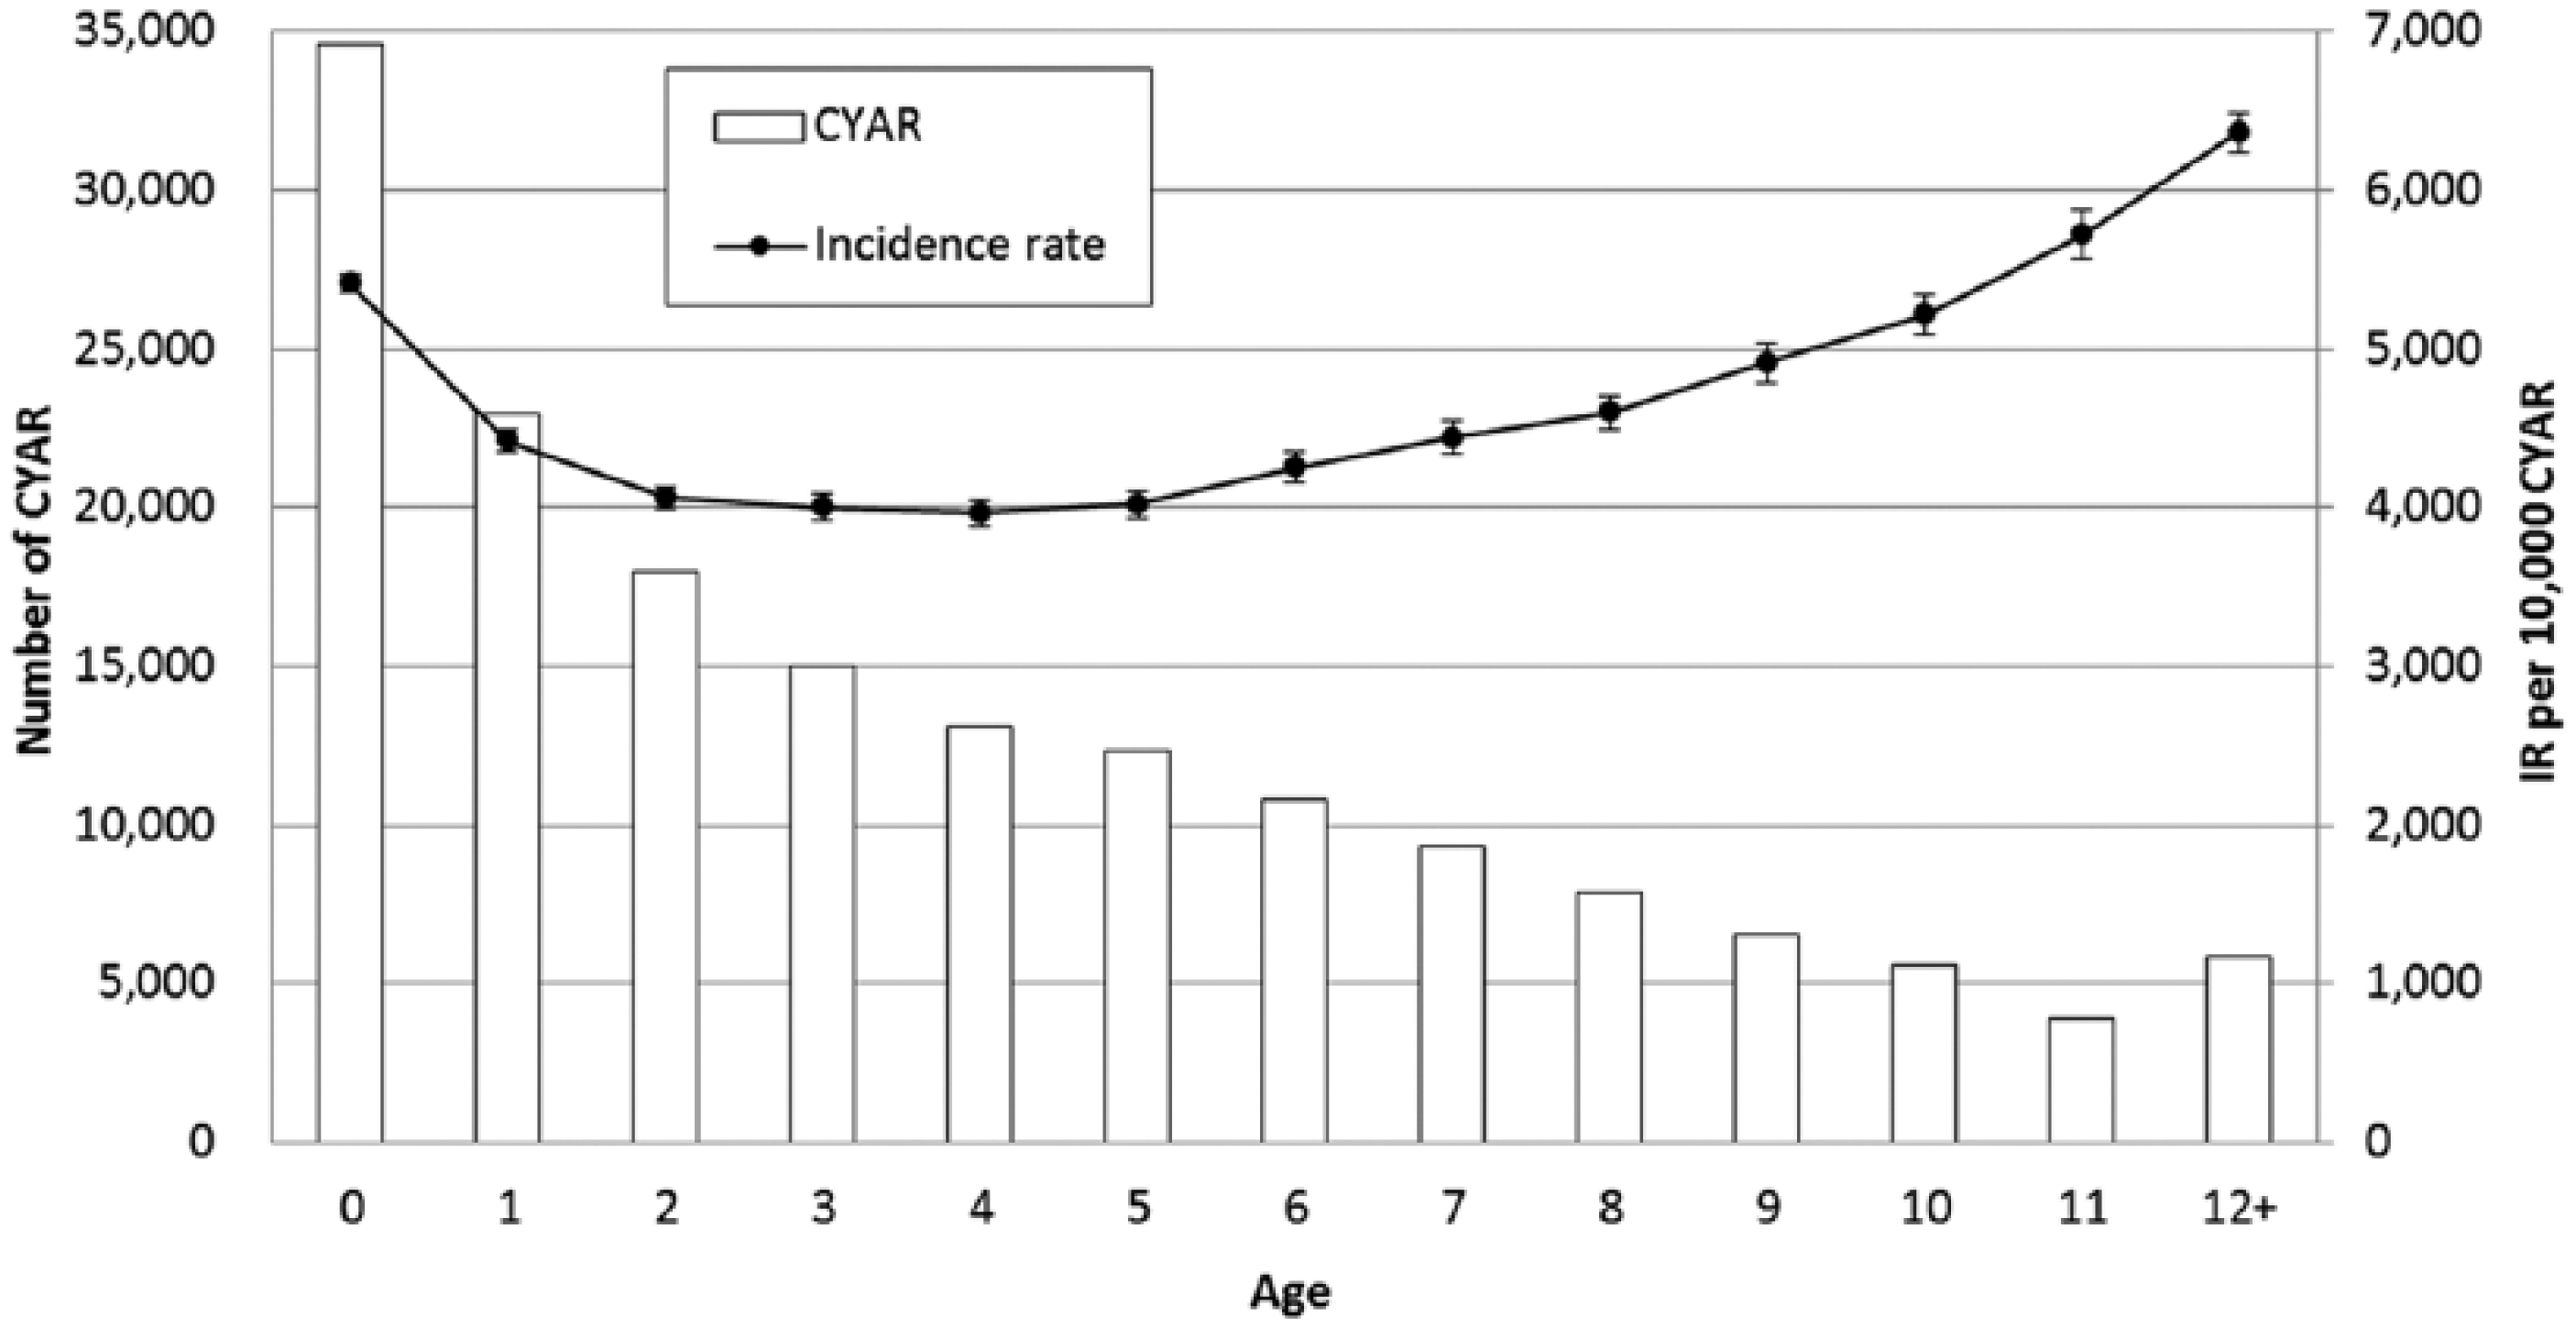
The total number of CYAR was 166,075. The CYAR by sex, breed and age are shown in Table 1. Figure 1 shows the distribution of CYAR by age category. In terms of CYAR, 20.8% of cats were aged 0, 13.8% were aged 1 and 10.9% were aged 2 years. The median and mean age at enrolment of the cats in this study was 2.14 and 3.43 years, respectively, and more than half the cats had been enrolled before 3 years of age. The CYAR was 89,629 (54.0%) for males and 76,446 (46.0%) for females. The breed with highest CYAR was crossbreed (36.2%), followed by Scottish Fold (13.9%) and American Shorthair (12.8%). Figure 2 shows the distribution of CYAR by fiscal year. The number of CYAR increased from 21,456 in 2008 to 48,187 in 2012. The overall annual rate of at least one veterinary care event was 4632 (95% CI 4608–4656) cats per 10,000 CYAR. The lowest and the highest rates were 4174 (95% CI 4108-4240) cats in 2008 and 4947 (95% CI 4903–4992) cats in 2012 per 10,000 CYAR, respectively.
Number of cat-years at risk by age, sex and breed in the insured cat population

Others are purebreed cats other than those specifically listed
American SH = American Shorthair; Norwegian FC = Norwegian Forest Cat
Number of cat-years at risk (CYAR) and annual incidence rate (IR) of having at least one insurance claim by age

Number of cat-years at risk (CYAR) and annual incidence rate (IR) of having at least one insurance claim by fiscal year
Cause-specific morbidity by age, sex and breed
Table 2 shows the annual incidence rates of having one insurance claim for each diagnostic category by sex and breed for insured cats in Japan. The most common diagnostic category was digestive system disorders, with an annual incidence rate of 1172 (95% CI 1156–1187) cats per 10,000 CYAR.
Annual incidence rate (IR) per 10,000 cat-years at risk by diagnostic category, sex and breed for insured cats in Japan

CI = confidence interval
The second major diagnostic category was urinary diseases with an annual incidence of 1091 (95% CI 1076–1106) cats per 10,000 CYAR. Dermatological disorders were found to be the third most common cause of morbidity, with the annual incidence rate of 838 (95% CI 825–851) cats per 10,000 CYAR. The fourth most common diagnostic category was ophthalmological disorders, with an incidence rate of 698 (95% CI 686–711) cats per 10,000 CYAR.
For most diagnostic categories, the incidence rates were significantly different between male and female cats. The highest ratio between sexes was observed for reproductive system disorders (female was higher than male with a ratio of 6.0), followed by cardiovascular system disorders (male was higher than female with a ratio of 1.4) and dental diseases (male was higher than female with a ratio of 1.3).
The pure breeds had a higher ratio than crossbreeds for cardiovascular system disorders (ratio of 2.0), followed by otic disease (ratio of 1.8), reproductive system disorders (with a ratio of 1.6) and musculoskeletal disorders (ratio of 1.5). The crossbreeds had a higher ratio over pure breeds observed for dental diseases (ratio of 2.1) followed by hepatobiliary and exocrine pancreatic disorders (ratio of 1.6), injuries (with a ratio of 1.6) and parasitic diseases (ratio of 1.3).
The age-specific incidence rates by sex for 18 diagnostic categories are shown in Figure 3. The incidence rates increased with age in 8/18 diagnostic categories: cardiovascular, hepatobiliary and exocrine pancreatic, urinary, neuromuscular, dental, immunological, endocrine disorders and neoplasia. Reproductive, ophthalmologic, otic, infectious and parasitic diseases and injuries showed a high incidence rate at younger ages, which remained low at older ages. Dermatological diseases had high incidence rates through all ages. The remaining categories, including respiratory, digestive and musculoskeletal disorders, showed a high incidence rate at both young and old ages.

Annual incidence rate (IR) per 10,000 cat-years at risk (CYAR) of having at least one insurance claim for different diagnostic categories, by sex and age in insured cats in Japan. The solid line with square markers and dashed lines with round markers indicate males and females, respectively
Figure 4 shows the incidence rates standardised for ages of the different diagnostic categories for the major 16 breeds that had a CYAR value >1000. There was a large variation in incidence rates between breeds for most diagnostic categories; for example, with regard to cardiovascular system disorder, Scottish Fold, American Shorthair, Persian, Maine Coon, Norwegian Forest Cat, Ragdolls and Bengals had a higher annual incidence rate than crossbreeds, and Somali had a lower incidence rate than crossbreeds. The incidence rate of cardiovascular system disorder was 9.1 times higher in Maine Coons than in Somalis. The Scottish Fold also had higher incidence rates for otic and musculoskeletal diseases than the crossbreeds. American Curl had high incidence rates for neuromuscular and otic diseases. The crossbreeds had lower incidence rates compared with pure breeds for most diagnostic categories, except for dental disorders and injuries.

Annual incidence rate (IR) of having at least one insurance claim for different diagnostic categories, by 16 major breeds of insured cats in Japan. Error bars indicate 95% confidence intervals. American SH = American Shorthair; Norwegian FC = Norwegian Forest Cat
Discussion
This study was based on insured cats at Anicom, a Japanese pet insurance company. Although this company is the largest pet insurance company in Japan in terms of the number of dogs and cats insured, the number of cats participating in this study represent only 0.7% of the total cat population in Japan. Therefore, the extrapolation of results of this study to the general cat population in Japan must be carried out with due consideration and caution. First, because pet insurance is a growing industry and most of cats enter insurance programmes at young ages, the insured cat population is likely to be biased toward younger ages. Secondly, there will likely be higher proportions of pure-breed cats insured. According to a survey conducted by the Japan Pet Food Association in 2014, crossbreed cats represent 79.8% of the cat population in Japan, 1 while they represent 36.2% of the insured cat population used in this study. Third, given the fact that the proportion of insured cats is higher in urban areas than in rural areas, cats living in urban areas are over-represented in the insured cat population (data of insured cats not shown). 1 Fourth, according to unpublished data from a questionnaire survey conducted by Anicom in 2015, 93.9% of cats are kept indoors, while 71.6% are kept indoors in the general population. 1 Therefore, cats living indoors might be over-represented. In addition, insured cats will be more likely to receive expensive veterinary care than uninsured cats. With these potential sources of bias in mind, the major diagnostic categories for feline morbidity are discussed below.
A similar trend of morbidity in digestive disorder with two peaks at young and old age was reported in a study using the primary veterinary care data in the UK, 2 and a study using pet insurance data in Sweden. 8 For young cats, gastrointestinal parasites might be the major cause of digestive diseases, 16 and for old cats inflammatory bowel diseases, endocrine diseases such as thyroid disease, diabetes mellitus and neoplasia might be involved.17,18
Urinary diseases, the second major diagnostic category, consist of diseases in the upper system (including the kidney and ureter) and the lower system (including the bladder and urethra). In a Swedish study, 8 the morbidity of lower urinary system diseases was 109 (95% CI 103–115) cats per 10,000 CYAR and that for upper urinary system diseases was 41 (95% CI 37–45) cats per 10,000 CYAR. In a UK study, 2 the prevalence did not differ significantly between the lower and upper urinary systems (4.4% and 4.2%, respectively). In the present study, the proportional morbidity was 46.2% and 24.1% for lower and upper urinary diseases, respectively (no information available for the remaining 29.7%) (data not shown). This difference might be caused by a difference in breed distribution between the respective countries, because several breeds have been identified as a risk factor for feline lower urinary tract disease in the US and Sweden.8,19
The morbidity of dermatological disorders did not yield a significant difference between age, sex and breed (pure breed/crossbreed) in this study as in a UK study. 2
In our study, the annual incidence rate of injuries was low compared with previous studies conducted by Egenvall et al and O’Neill et al.2,8 This is probably because most cats insured in Japan are kept indoors (according to Anicom 93.9% of cats are kept indoors [see above]).
In our study, we assumed that the diagnostic categories stated in the claim forms reflect the actual diseases. Also, we excluded the clinical diagnoses that presented only the clinical signs without specifying one of the 18 diagnostic categories. This might have resulted in systematic exclusion of the cases of some specific diagnostic categories. The validity of an insurance company’s database was assessed by Egenvall et al.10,20 They found agreement of ⩾80% on diagnostic information between insurance claims and hospital records in all the diagnostic categories assessed. Further studies are required to validate the diagnostic information of insured cats in Japan.
Conclusions
This study provides comparative and quantitative estimates of annual incidence rates for diagnostic categories in insured Japanese cats. The most common medical problems were digestive, urinary and dermatological diseases, with substantial variations between breeds, sexes and ages. There was a large variation in incidence rates between breeds for most diagnostic categories. Despite the potential biases, our findings can be used to increase our understanding of health problems in cats.
Footnotes
Acknowledgements
We would like to thank Anicom Insurance for providing us with the data of insured cats for this study.
Conflict of interest
The authors declared no potential conflicts of interest with respect to the research, authorship, and/or publication of this article.
Funding
The authors received no financial support for the research, authorship, and/or publication of this article.