
Abstract
Objectives
Rebound hyperglycaemia (also termed Somogyi effect) is defined as hyperglycaemia caused by the release of counter-regulatory hormones in response to insulin-induced hypoglycaemia, and is widely believed to be common in diabetic cats. However, studies in human diabetic patients over the past quarter century have rejected the common occurrence of this phenomenon. Therefore, we evaluated the occurrence and prevalence of rebound hyperglycaemia in diabetic cats.
Methods
In a retrospective study, 10,767 blood glucose curves of 55 cats treated with glargine using an intensive blood glucose regulation protocol with a median of five blood glucose measurements per day were evaluated for evidence of rebound hyperglycaemic events, defined in two different ways (with and without an insulin resistance component).
Results
While biochemical hypoglycaemia occurred frequently, blood glucose curves consistent with rebound hyperglycaemia with insulin resistance was confined to four single events in four different cats. In 14/55 cats (25%), a median of 1.5% (range 0.32–7.7%) of blood glucose curves were consistent with rebound hyperglycaemia without an insulin resistance component; this represented 0.42% of blood glucose curves in both affected and unaffected cats.
Conclusions and relevance
We conclude that despite the frequent occurrence of biochemical hypoglycaemia, rebound hyperglycaemia is rare in cats treated with glargine on a protocol aimed at tight glycaemic control. For glargine-treated cats, insulin dose should not be reduced when there is hyperglycaemia in the absence of biochemical or clinical evidence of hypoglycaemia.
Introduction
Work which led to the original description of rebound hyperglycaemia in human diabetics, frequently also termed the Somogyi effect, was performed in the 1930s, 1 relying on divided urine collections rather than blood glucose measurements. It was published in 1959, and was described as an exacerbation of diabetes by excess insulin action. A common finding was negative urine glucose tests between 22:00 and 02:00, followed by heavy glycosuria. It was assumed that asymptotic hypoglycaemia resulted in a hormonal counter-regulatory response producing fasting hyperglycaemia. Later, a typical definition of rebound hyperglycaemia in humans, based on blood glucose measurements, consisted of asymptomatic nocturnal hypoglycaemia (eg, blood glucose concentration <36 mg/dl [<2.0 mmol/l], or <40 mg/dl [<2.2 mmol/l] for at least 10 mins), followed by fasting hyperglycaemia the next morning (eg, >126 mg/dl [>7.0 mmol/l]).2–4 Additionally, at least one study examined the effect of asymptomatic nocturnal hypoglycaemia on daytime hyperglycaemia. 5
The original work describing rebound hyperglycaemia in cats was performed in a cohort of six cats. 6 Eighteen to 24 h blood glucose curves were measured. Rebound hyperglycaemia in this once-daily dosed cohort was defined as a pre-insulin blood glucose concentration of >370 mg/dl (>20.5 mmol/l), followed by insulin-induced hypoglycaemia (<70 mg/dl [<3.0 mmol/l]) within 4–8 h, followed by hyperglycaemia which was sustained up to 24 h after injection. More recent definitions of rebound hyperglycaemia in cats differ somewhat from those in the original study, although we could find no further original work documenting an evidence basis for making these changes. These newer definitions included blood glucose concentration <65 mg/dl (<3.6 mmol/l) or <80 mg/dl (<4.4 mmol/l), followed by marked hyperglycaemia (>280 mg/dl [>15.5 mmol/l]), measured within 12 h of the glucose nadir.7,8 The rebound hyperglycaemia generally exceeded baseline concentrations, and was often between 400 and 800 mg/dl (22.2 and 44.4 mmol/l). This more recent definition of rebound hyperglycaemia in cats also included marked insulin resistance, which could last from 24–72 h after the asymptomatic hypoglycaemic event, and was evidenced by little or no glucose lowering effect after subsequent insulin injections.9,10
Rebound hyperglycaemia is widely believed to commonly exist in feline diabetics,6–8,11 although there has only been one study of six cats to support this. In contrast, numerous studies in human diabetic patients over the last quarter century have rejected the common occurrence of the Somogyi phenomenon.2–5,12–15 Most such cases in humans are now thought to be associated with a combination of inadequate duration of insulin action in the early morning, coupled with an early morning surge of growth hormone, termed the ‘dawn phenomena’, causing insulin resistance.16,17 Clearly, there is a need for further information on the frequency of rebound hyperglycaemia in cats, given the recent data in humans. The aim of our study was to investigate the prevalence of rebound hyperglycaemia in a large, intensively tested cohort of diabetic cats managed using one treatment protocol in a home-based setting.
Materials and methods
Fifty-five cats diagnosed with diabetes mellitus were included in the study, and data from these cats have been previously reported. 18 Briefly, data were provided by owners who were members of the German Diabetes-Katzen Forum (http://www.diabetes-katzen.net/forum) or an earlier version of the website.
All owners followed the identical protocol of intensive blood glucose regulation using glargine (Lantus; Sanofi-Aventis), which included the requirement for cats to be fed a low-carbohydrate wet-food diet exclusively. 18 Using the protocol, insulin dose is typically increased in a step-by-step manner from the starting dose, followed by a stabilisation phase where the insulin dose is held, followed by a reduction phase where the insulin dose is decreased. 18 Indications for a reduction in insulin dose included biochemical or clinical hypoglycaemia, and when nadir and maximum blood glucose concentrations were in the normal range of a healthy cat every day for at least 1 week, or if inappetence or vomiting were observed. The protocol aims to achieve euglycaemia and utilises home measurement of blood glucose a minimum of three times daily. In our cohort of cats, blood glucose was measured a median of five times per 24 h, and up to a maximum of 13 times per 24 h. Both pre-insulin blood glucose concentrations were measured, and owners typically performed a minimum of two additional measurements 3–6 h apart, but tested more often, for example every 1–2 h, when blood glucose was low normal or subnormal, and in some cases also during the night.
All owners included in the study supplied information regarding the diet fed to their cat in the form of questionnaires. The Forum supplied a list of recommended very low carbohydrate wet foods (⩽5% metabolisable energy from carbohydrate). Only cats eating very low carbohydrate diets were included. Typically, owners also noted deviations from the diet (eg, giving a high-carbohydrate snack) in their data tables. Of the study cats, a small number ate home-prepared diets: four cats ate home-prepared food in combination with low-carbohydrate canned food, while one cat periodically ate the food exclusively. As the home-prepared food was very low in carbohydrates, 19 these cats were included in the study.
For cats that went into remission (35 cats), data were collected for a median of 59 days (1.9 months; range 6 days to 10 months), and for cats that remained insulin dependent (20 cats), the median length of time on protocol was 12.7 months (range 2.6 months to 2.1 years). Overall, 10,767 daily blood glucose curves (approximately 53,000 blood glucose measurements) were assessed in the cohort; the median number of curves per cat was 101 (range 6–763 curves).
The most common glucometers used were the Ascensia Contour (Bayer) and the Accu-Chek Aviva (Roche Diagnostics), with 71% and 19% of cat owners using them, respectively. For feline blood in the normoglycaemic range, they provide precise measurements on average 20% lower at the low end of the normal range than actual glucose concentrations in feline plasma. 20 The range for euglycaemia defined in the protocol using these human-calibrated meters was 50–100 mg/dl (2.8–5.5 mmol/l). High and low blood glucose concentrations that were beyond the measurement ranges of glucometers were very rare occurrences within the cohort. For low values, a blood glucose value of 20 mg/dl (1.1 mmol/l) was used in the calculations, and for high values, a blood glucose concentration of 600 mg/dl (33.3 mmol/l) was used. These thresholds define blood glucose concentrations for which the glucometers gave no numerical value.
We defined rebound hyperglycaemia in two different ways: (1) rebound hyperglycaemia associated with marked clinically evident insulin resistance, which is very similar to the definitions already found in the feline diabetes literature,8–10 and (2) rebound hyperglycaemia, which is an approximation of the typical definition of the human effect, thus lacking the insulin resistance component.2–4
The exact definitions of rebound hyperglycaemia used in the study are as follows:
Rebound hyperglycaemia was defined as a blood glucose concentration of ⩽50 mg/dl (⩽2.8 mmol/l), followed by marked hyperglycaemia of ⩾300 mg/dl (⩾16.7 mmol/l) within 4–10 h. Hyperglycaemia was evident at the time of the next insulin dose, but not beyond.
Rebound hyperglycaemia with insulin resistance was defined as a blood glucose concentration of ⩽50 mg/dl (⩽2.8 mmol/l), followed by marked hyperglycaemia of ⩾300 mg/dl (⩾16.7 mmol/l) within 4–10 h. The two subsequent insulin doses had little glucose lowering effect, with blood glucose concentrations remaining >250 mg/dl (>13.9 mmol/l), and thus the glucose concentrations remained elevated for ⩾24 h.
It should be noted that neither of the definitions we used included fasting hyperglycaemia. In the intensive management protocol, many small low-carbohydrate wet-food meals are fed throughout the day, with one always fed at the time of insulin injection plus a minimum of one further meal between injections. Therefore, cats were rarely in a fasted state, given their prolonged postprandial period. 21 Because owners are likely to feed an extra high carbohydrate meal on detecting hypoglycaemia, and the resulting postprandial hyperglycaemia could exacerbate the magnitude and duration of hyperglycaemia, it is possible rebound hyperglycaemia was overestimated. Therefore, we examined all instances of suspected rebound hyperglycaemia for type and quantity of food fed and/or administered glucose, and thus divided the feedings into four different categories: (1) the food amount fed probably exceeded a quarter of the daily food for an average cat, (2) the food amount fed was probably less than a quarter of the daily food for an average cat, (3) the food amount fed was unknown, and (4) a glucose-containing vitamin paste or sugar paste was fed, usually in addition to food.
To determine if the magnitude of hyperglycaemia after a nadir was influenced by hypoglycaemia, maximum blood glucose concentrations occurring 24 h after hypoglycaemic nadirs (⩽50 mg/dl [⩽2.8 mmol/l]) and non-hypoglycaemic nadirs (>50 mg/dl to ⩽100 mg/dl [>2.8 mmol/l to ⩽5.5 mg/dl]) were compared using two-sample unpaired t-statistics. Two different comparisons were made. First, maximum blood glucose concentrations that occurred after hypoglycaemic and non-hypoglycaemic nadirs were compared for all cats not yet regulated (most daily mean blood glucose concentrations >200 mg/dl [>11.1 mmol/l]). Second, for a subset of cats with marked maximum hyperglycaemia (⩾300 mg/dl [⩾16.7 mmol/l]) after a nadir, mean maximum blood glucose concentrations were compared after hypo- and non-hypoglycaemic nadirs, the former being consistent with the definition of rebound hyperglycaemia. Comparisons were limited to blood glucose curves from cats prior to stablisation (most daily mean blood glucose concentration >200 mg/dl [>11.1 mmol/l]) because once regulated, cats on this protocol had blood glucose concentrations in or close to the normoglycaemic range that varied little during the day, and thus did not produce hyperglycaemic peaks in blood glucose concentration which would be a prerequisite for identifying cats with rebound hyperglycaemia.
To determine if a higher overall insulin dose was associated with rebound hyperglycaemia, we also compared the prevalence of curves consistent with rebound hyperglycaemia in cats receiving maximum insulin doses <5 IU q12h and ⩾5 IU q12h using two-sample unpaired t-statistics.
Results
Prevalence of rebound hyperglycaemia
Curves consistent with rebound hyperglycaemia were measured in 14/55 cats (25%). A median of three such events occurred per affected cat (range 1–11 events per affected cat). Of the 10,767 curves measured, 45 were consistent with rebound hyperglycaemia. This represented 0.42% of all blood glucose curves measured in the study, or a median of 1.5% (range 0.32–7.7%) of curves in affected cats, with each curve considered to represent a 24 h period. Blood glucose curves consistent with rebound hyperglycaemia with insulin resistance were even less frequent, and were confined to four single events in four different cats.
Prevalence of hypoglycaemia and hyperglycaemia
Asymptomatic or biochemical hypoglycaemia occurred in 51/55 cats (93%) using this intensive blood glucose control protocol (Table 1). 18 In the study, 876 nadirs <50 mg/dl (<2.8 mmol/l) were measured that did not subsequently produce peak blood glucose concentrations consistent with the definition of rebound hyperglycaemia. A single clinical hypoglycaemic event was recorded which was associated with a blood glucose concentration <30 mg/dl (<1.7 mmol/l) and involved mild signs including restlessness. This cat did not experience rebound hyperglycaemia after this clinical hypoglycaemic event.
Occurrence of rebound hyperglycaemic and hypoglycaemic events in the cohort
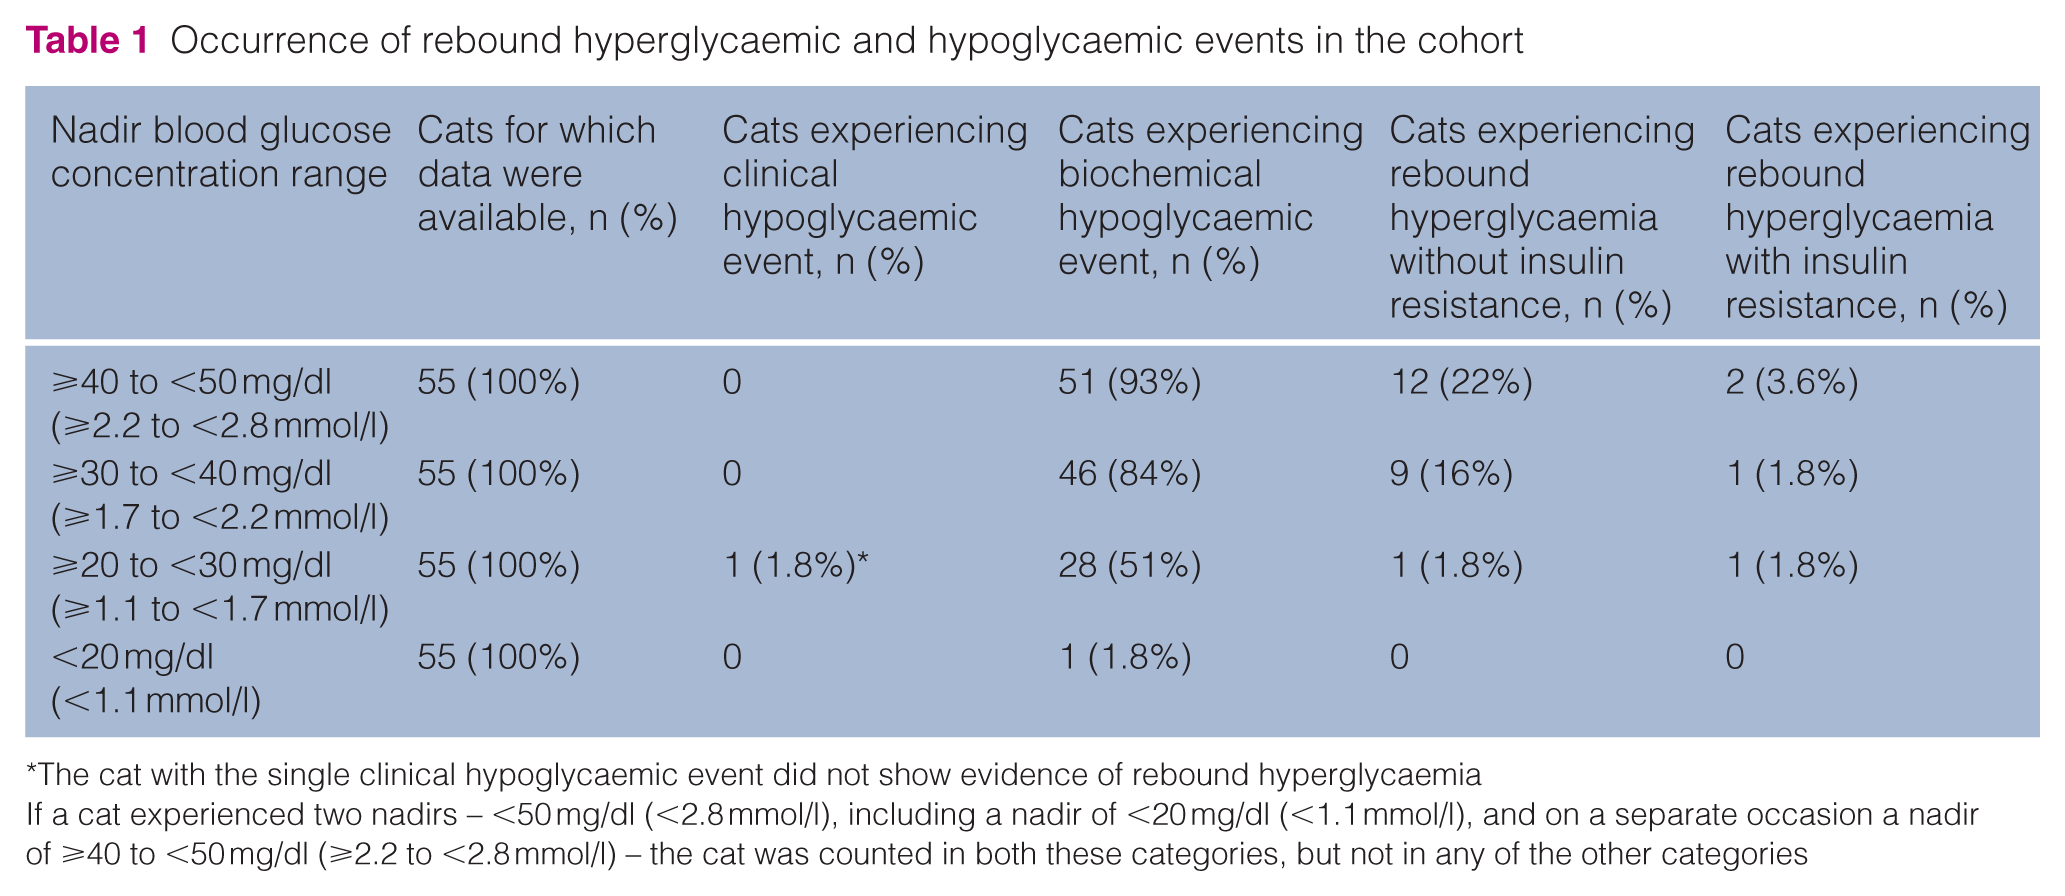
The cat with the single clinical hypoglycaemic event did not show evidence of rebound hyperglycaemia
If a cat experienced two nadirs – <50 mg/dl (<2.8 mmol/l), including a nadir of <20 mg/dl (<1.1 mmol/l), and on a separate occasion a nadir of ⩾40 to <50 mg/dl (⩾2.2 to <2.8 mmol/l) – the cat was counted in both these categories, but not in any of the other categories
Importantly, for daily curves with a hypoglycaemic nadir of ⩽50 mg/dl (⩽2.8 mmol/l) where blood glucose were subsequently >300 mg/dl (16.7 mmol/l; n = 49), the maximum blood glucose was not significantly higher than after a non-hypoglycaemic nadir of >50 mg/dl to ⩽100 mg/dl (>2.8 mmol/l to ⩽5.5 mg/dl; n = 57). Median maximum glucose concentration after hypoglycaemia was 371 mg/dl (20.6 mmol/l), with a range of 300–570 mg/dl (16.7–31.7 mmol/l), whereas after a normoglycaemic nadir, it was 374 mg/dl (20.8 mmol/l), with a range of 301–600 mg/dl (16.7–33.3 mmol/l; P = 0.86). The findings were similar for the comparison of all unregulated cats regardless of maximum concentration: the median maximum after hypoglycaemia (n = 101 curves) was 337 mg/dl (18.7 mmol/l), with a range of 126–570 mg/dl (7.0–31.6 mmol/l), and median maximum after a normoglycaemic nadir (n = 74) was 359 mg/dl (19.9 mmol/l), with a range of 179–600 mg/dl (11.1–33.3 mmol/l; P = 0.27; Figure 1a,b). The results were also similar when only data for the first rebound curve were used in the analysis for cats with more than one episode, to reduce error associated with repeated measurements (results not shown).

(a) Boxplots comparing maximum blood glucose concentrations occurring after the nadir between days when the nadir was ⩽50 mg/dl (⩽2.8 mmol/l) and days when the nadir was >50 mg/dl to ⩽100 mg/dl (>2.8 mmol/l to ⩽5.5 mg/dl) in cats not yet regulated (mean blood glucose >200 mg/dl [11 mmol/l]). (b) For days when blood glucose was ⩾300 mg/dl (⩾16.7 mmol/l) following a nadir, a similar comparison of maximum blood glucose concentrations after a nadir was made between days when the nadir was in the normal range (>50 mg/dl to ⩽100 mg/dl [>2.8 mmol/l to ⩽5.5 mg/dl]) or below normal (⩽50 mg/dl [⩽2.8 mmol/l]; consistent with rebound hyperglycaemia)
During the study, most owners (80%, 44/55) also performed at least one nocturnal measurement (6 h after the evening pre-insulin blood glucose measurement), and this was more frequent (multiple times per week) for owners with cats that tended to have more frequent biochemical hypoglycaemic episodes. Of those cats where blood glucose concentration curves consistent with rebound hyperglycaemia were observed, 5/11 (45%) owners tested during the night preceding the curve, and no hypoglycaemic blood glucose concentrations were observed. In all cases, the pre-insulin blood glucose prior to the nadir was hyperglycaemic.
Effect of insulin dose on the prevalence of rebound hyperglycaemia
Rebound hyperglycaemia was not more frequent in cats receiving doses of insulin ⩾5 IU/cat q12h (n = 8) compared with those receiving <5 IU q12h (n = 47; P = 0.49). Median insulin dose administered on days where blood glucose curves were consistent with rebound hyperglycaemia was 2.75 IU (range 1.5–5.5 IU; Figure 2).

A histogram with a normal curve, showing the first insulin dose (IU) given to each of the 14 cats which produced a curve that was consistent with rebound hyperglycaemia
During the study period, insulin dose was reduced 983 times, which was greater than the number of hypoglycaemic nadirs because of criteria other than hypoglycaemia for insulin dose reductions.
Feeding in the cohort
All cats were fed a small snack, meal and/or glucose-containing paste just after hypoglycaemia was detected in all instances of rebound hyperglycaemia we were able to identify. In almost all cases, the cats were fed high-carbohydrate food (>35–40% of metabolisable energy), and some cats were also fed an additional low-carbohydrate meal.
For rebound hyperglycaemia without insulin resistance, following detection of hypoglycaemia, in 8/45 (18%) instances, the cat was probably fed more than a quarter of its daily food. In 11/45 (25%) instances, the cat was likely fed less than a quarter of its daily food. In 19/45 (42%) cases, the amount of food fed was unknown, and in 7/45 (16%) the cats received a glucose-containing paste. For rebound hyperglycaemia with insulin resistance, following detection of hypoglycaemia, two cats were fed more than a quarter of their daily food, one cat was fed less than a quarter of their daily food, and one cat was fed an unknown amount of food. Cats that received glucose-containing paste typically did not have higher peak blood glucose values than those receiving no glucose-containing paste.
Further characteristics of the cohort
Of the 131 cats in the Forum using glargine at the cutoff date for the study, 76 were excluded because owners chose not to provide blood glucose concentration data for the study (n = 32); owners did very little blood glucose home monitoring or chose not to use the protocol for insulin dose adjustments (n = 21); owners joined the Forum very close to the cutoff and did not have >10 weeks of tight regulation data or did not achieve remission by the cutoff date (n = 11); owners dropped out of the Forum (n = 9); or cats had acromegaly (n = 2) or were on a high-carbohydrate diet (n = 1). Data for the remaining 55 cats were included in this study.
Forty cats (80%) were domestic shorthair, the remainder being Main Coon, Persian, Siamese, mixed breed or unknown. Fifty cats (91%) were first treated with an insulin other than glargine for a median of 15 weeks, but failed to go into remission and were switched to glargine. Only five cats received glargine as their first insulin. The median age when diagnosed was 10.3 years (range 3.1–16.7 years). Further information on the cohort can be found in a previous study by the authors. 18
Discussion
The important finding in our study was that blood glucose curves consistent with rebound hyperglycaemia were very rare in cats treated with glargine, despite blood glucose being measured a median of five times daily for 10,767 days. Only 1/240 (0.42%) blood glucose curves were consistent with rebound hyperglycaemia, and could be found only in a subset (25%) of cats. Furthermore, blood glucose curves that were consistent with rebound hyperglycaemia with insulin resistance were even rarer; four individual events were identified in four cats, representing 1/2692 (0.037%) curves. This was despite biochemical hypoglycaemia occurring at some point during the study in 93% of cats. Notably, the one cat with the clinical hypoglycaemia did not show evidence of rebound hyperglycaemia. Our study only analysed data for the statistical comparisons from cats prior to stabilisation that had most daily mean blood glucose concentrations >200 mg/dl (>11.1 mmol/l).
Typical definitions of rebound hyperglycaemia in insulin-treated diabetic humans, based on blood glucose measurements, involve asymptomatic nocturnal hypoglycaemia (eg, blood glucose concentration <36 mg/dl [<2.0 mmol/l]) followed by fasting hyperglycaemia the next morning (eg, >126 mg/dl [>7.0 mmol/l]). 2 A more recent study, which used a continuous blood glucose monitoring system, defined rebound hyperglycaemia as nocturnal asymptomatic hypoglycaemia of <40 mg/dl (<2.2 mmol/l) lasting for at least 10 mins followed by fasting hyperglycaemia in the morning. 4 Glucose concentrations from 41 to 63 mg/dl (2.3–3.6 mmol/l) were considered possible hypoglycaemia. At least one study examined the effect of asymptomatic nocturnal hypoglycaemia on daytime hyperglycaemia. Ten patients were examined under three different regimens: their normal control regimen, a regimen where nocturnal hypoglycaemia was prevented by glucose infusions and a regimen where nocturnal hypoglycaemia was induced. Nocturnal hypoglycaemia was defined as <50 mg/dl (<2.8 mmol/l). 5 The authors concluded that nocturnal hypoglycaemia did not cause daytime hyperglycaemia in insulin-dependent diabetic patients. Similarly, in our study, there was no difference in peak glucose concentrations in cats that displayed curves consistent with our definition of rebound hyperglycaemia and cats that did not, despite many owners providing food or a glucose-containing syrup after hypoglycaemia was detected. This is suggests that daytime hypoglycaemia is not a significant contributor to daytime hyperglycaemia in cats.
The definition used in our study of rebound hyperglycaemia lacking an insulin resistance component is comparable with initial definitions used in the feline literature, and compares reasonably well with that found in the human literature, except that in cats, hypoglycaemia was not usually nocturnal, blood glucose concentrations following hyperglycaemia were much higher than 126 mg/dl (7 mmol/l), hyperglycaemia was not necessarily first observed in the morning, or a true fasting glucose measurement. In part, this reflects that blood glucose concentrations in unregulated diabetic cats tend to be higher than in human diabetics, 22 most cat owners and veterinarians are not measuring blood glucose during the night, and the postprandial increase in glucose after eating is much longer in cats than in humans, lasting 12–15 h.21,23,24
Numerous studies in human diabetic patients over the past quarter century have rejected the common occurrence of the rebound hyperglycaemia.2–5,12–15 In a seminal study by Gale et al in 1980, 2 patients with apparent rebound hyperglycaemia were found not to have higher levels of growth hormone, cortisol or glucagon than those who had little or no rebound hyperglycaemia. A close inverse correlation was found between blood glucose and free insulin concentrations. Therefore, it was concluded that hyperglycaemia, when present, was more likely to be due to relative insulin deficiency in the latter part of the night than a response to antagonist hormones. A study using continuous blood glucose measurements 4 rejected the existence of rebound hyperglycaemia because mean morning blood glucose concentrations after hypoglycaemic nights were >90 mg/dl (5.0 mmol/l) lower than after nights without hypoglycaemia. Therefore, the risk of nocturnal hypoglycaemia was found to increase progressively as morning blood glucose values decreased. The study which evaluated the occurrence of preceding nocturnal hypoglycaemia on daytime hyperglycaemia 5 concluded that nocturnal hypoglycaemia did not appear to cause clinically important daytime hyperglycaemia. Furthermore, daytime plasma glucose concentrations were unrelated to peak nocturnal plasma glucagon, epinephrine, norepinephrine, growth hormone or cortisol concentrations. Therefore, most apparent cases of rebound hyperglycaemia in humans are now thought to be associated with inadequate duration of insulin action in the early morning, unrelated to any preceding nocturnal hypoglycaemia.16,17
In the only previously reported study of rebound hyperglycaemia in cats, 6 all cats were treated with once daily regimens of either neutral protamine Hagedorn (NPH) insulin or protamine zinc insulin (PZI), and 18–24 h blood glucose curves were measured (Table 2). Rebound hyperglycaemia was defined as a pre-insulin blood glucose concentration of >370 mg/dl (>20.5 mmol/l), followed by insulin-induced hypoglycaemia (<70 mg/dl [<3.9 mmol/l]) within 4–8 h, followed by hyperglycaemia which was sustained up to 24 h after injection. However, a number of more plausible explanations other than rebound hyperglycaemia account for this blood glucose pattern and the observed improvement following changes to the cats’ management (Table 3). NPH typically has its nadir 4 h after insulin injection, and after 7–8 h, there is little exogenous insulin action, and blood glucose concentrations are often at pre-insulin injection values. 25 This action profile is consistent with all four cats initially receiving once daily NPH, where blood glucose concentrations prior to injection were in the same range as 7–8 h after injection, with a steep fall to the nadir at 4 h after injection. Resolution of the rebound pattern in 5/6 cats is consistent with findings in humans that hyperglycaemia after resolution of hypoglycaemia reflects inadequate insulin concentration to control blood glucose concentration adequately. Cats were switched either from once-daily intermediate-acting NPH to longer-acting PZI (4/6), or from once-daily PZI to twice daily (1/6), which would be expected to improve glycaemic control. Use of intermediate-acting insulin and/or once-daily insulin dosing likely resulted in inadequate duration of insulin action to control blood glucose concentrations after the hypoglycaemic nadir10,25 In three cats with very high insulin doses (⩾12 IU), the change to longer-acting insulin and/or increased insulin dosing frequency was also associated with a substantially lower insulin dose, presumably reducing the risk of subsequent hypoglycaemic episodes.
Summary of the insulin types, insulin doses, blood glucose concentrations and further available information on the six cats reported on by McMillan and Feldman 6

NPH = neutral protamine Hagedorn; PZI = protamine zinc insulin
Probable explanations for improvement in cats studied by McMillan and Feldman 6
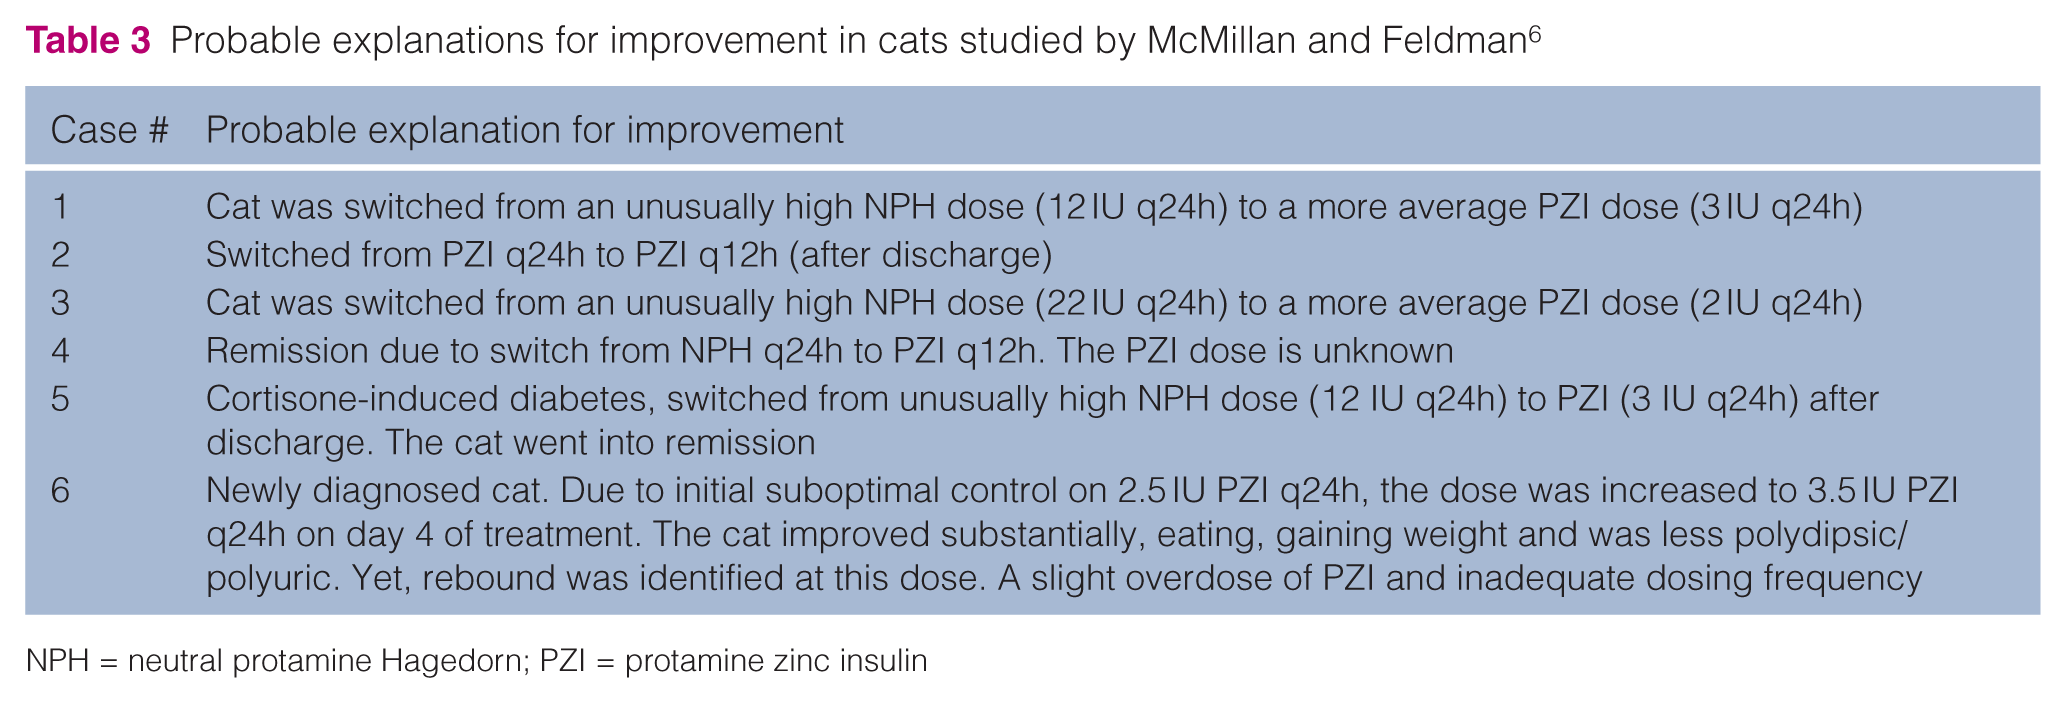
NPH = neutral protamine Hagedorn; PZI = protamine zinc insulin
In our study, median insulin dose administered on days consistent with rebound hyperglycaemia was 2.75 IU (range 1.5–5.5 IU), and higher insulin doses were not more often associated with this rebound pattern. However, none of the cats in our study with curves consistent with rebound hyperglycaemia were on doses >5.5 IU, and all were treated twice daily with a less potent and longer-acting insulin than NPH. The insulin doses associated with rebound hyperglycaemia in our study were very similar to those reported in the original publication 18 where the mean maximum dose of cats that eventually became non-insulin dependent was 2.6 IU q12h (range 1.0–9.0 IU), and for cats which remained insulin dependent, 3.86 IU q12h (range 1.00–9.00 IU).
It is sometimes recommended when rebound hyperglycaemia is suspected as being the cause of marked hyperglycaemia, even when hypoglycaemia is not documented, to test a reduced insulin dose to see if glycaemic control improves. However, this has never been documented to be effective in a peer-reviewed, controlled study. Clinical experience suggests that careful monitoring of glucose and ketones is important if such a test were performed because hyperglycaemia may reflect lack of sufficient frequency of insulin administration. When using long-acting insulin such as glargine, the authors do not recommend this approach, because rebound hyperglycaemia appears to be very rare, and reducing the dose below that required typically results in unnecessary hyperglycaemia. However, the insulin dose should be reduced when hypoglycaemia is documented, or is suspected based on clinical signs. This approach is also recommended for the long-acting insulin detemir (Levemir; Novo Nordisk), as it has a very similar action profile to glargine in cats. 26
Fluctuation in blood glucose concentrations is commonly observed in the first weeks, and more rarely in the first months of treatment 18 with glargine and detemir, and might be mistaken for rebound hyperglycaemia, but this fluctuation generally resolves with time using consistent dosing. It is unknown if the ‘dawn phenomena’ contributes to marked morning hyperglycaemia observed in some diabetic cats, including cats treated with long-acting insulin, most commonly in the first weeks of treatment, or whether it just reflects inadequate duration of insulin action. This needs further investigation in cats. Some cats in our study were considered difficult to regulate, and long-term required continued dose adjustments because of reoccurring hypoglycaemic nadirs, despite typically maintaining mean blood glucose concentrations >200 mg/dl (>11.1 mmol/l). Almost all cats experienced at least one biochemical hypoglycaemic episode (defined as a single blood glucose measurement <50 mg/dl [<2.8 mmol/l]), which is not surprising, given the protocol advised owners of diabetic cats to eventually aim to maintain most blood glucose concentrations between 50 and 100 mg/dl (2.8 and 5.5 mmol/l).
The findings in our study were confounded because all owners fed their cat after detection of hypoglycaemia, usually with a high-carbohydrate meal, which might have contributed to hyperglycaemia following hypoglycaemia. In healthy cats with endogenous insulin secretion, a high-carbohydrate diet (approximately 50% of metabolisable energy) increases peak blood glucose concentration by only 36 mg/dl (2 mmol/l).23,24 Even adding 2 g glucose/kg body weight to a high-protein diet in healthy cats only increases peak blood glucose concentration to 180 mg/dl (10.0 mmol/l) compared with cats consuming the high-protein diet without glucose, which peaked at 72–90 mg/dl (4.0–5.0 mmol/l). 27 This is substantially lower than the concentrations used for definition of rebound hyperglycaemia in cats. However, diabetic cats typically do not secrete insulin, 28 and therefore postprandial increases in glucose concentration would be expected to be higher in diabetic cats than in healthy cats. However, studies examining this have not yet been reported. As the type of food and feeding times were not documented in the original study from 1986, feeding a high-carbohydrate snack might have contributed to hyperglycaemia after hypoglycaemia.
Fasting is not included in the definition of rebound hyperglycaemia in cats, which is understandable because cats have a prolonged increase in glucose after eating which may last for >12–24 h, and are frequently fed ad libitum or more than two meals per day.21,23,24 However, it is difficult to find an explanation for the insulin resistance component that has added to rebound hyperglycaemia in the veterinary literature. 8 The authors know of no published studies which demonstrate that diabetic cats with insulin-induced hypoglycaemia have persistently increased concentrations of counter-regulatory hormones (growth hormone, cortisol or most particularly glucagon or epinephrine), or have insulin resistance for up to 72 h. In fact, there are no studies in cats demonstrating an increase of counter-regulatory hormones in response to hypoglycaemia. Such studies would be particularly interesting, as they would clearly demonstrate that feline and human diabetic patients differ in their counter-regulatory response following asymptomatic hypoglycaemia.
The limitations of the study were that our findings were based on intermittent glucose monitoring, which would underestimate the frequency of rebound hyperglycaemia. However, rebound hyperglycaemia is diagnosed by veterinarians in private practice using in-hospital testing, and a similar number of blood glucose measurements (three to 13) are typically made, especially in practices without after-hours staffing (observation Rand). While in-hospital testing is performed on 1 day per week or per month, the cats in our cohort were monitored daily over weeks, months or years, leading to a much more comprehensive data set. Owners typically tested more often when they first began to detect normoglycaemic blood glucose concentrations, and especially when normoglycaemic blood glucose concentrations were declining, increasing the likelihood of detecting hypoglycaemia in our cohort of cats. However, continuous glucose monitoring would provide greater sensitivity in estimating the true frequency. Conversely, the frequency of rebound hyperglycaemia might have been overestimated because cats were all fed high-carbohydrate food or sugar-containing preparations when hypoglycaemia was detected, which could lead to misclassification of the cause of hyperglycaemia. Other limitations were the retrospective nature of the study, the fact that cases were recruited without direct veterinary involvement, that the majority of cats with owners who posted data on the Forum website were not used in this analysis, and that it is unknown if the cats with owners who chose not to provide data for the study (n = 32) or dropped out of the Forum (n = 9) had cats more prone to rebound hyperglycaemia. In addition, time points for collection of blood glucose measurements were not standardised. However, despite these limitations, based on recent human studies using continuous glucose monitoring and the results of our study involving 10,767 blood glucose curves, rebound hyperglycaemia is likely a rare event following hypoglycaemia in cats.4,15 Further research is required to determine if the rebound pattern of blood glucose concentrations is in fact the result of preceding hypoglycaemia, or the result of inadequate insulin action following unrelated hypoglycaemia.
Conclusions
Rebound hyperglycaemia associated with persistent marked insulin resistance is extremely rare in glargine-treated cats, with fewer than four events in over 10,000 daily blood glucose curves. Rebound hyperglycaemia without persistent insulin resistance is more common, occurring in 25% of cats, albeit infrequently, and in affected cats is evident in <1/50 daily blood glucose curves. When taking both affected and unaffected cats into account, rebound hyperglycaemia without insulin resistance occurs in <1/250 daily curves. It is possible that some cats have milder forms of counter-regulation that are not included in these definitions of rebound hyperglycaemia. Because blood glucose monitoring was intermittent, and all cats were fed after hypoglycaemia occurring, our study may have under- or overestimated the occurrence of rebound hyperglycaemia, and a prospective study using continuous glucose monitoring is warranted. Further investigation of the cause of marked morning hyperglycaemia in diabetic cats treated with glargine is indicated to determine if inadequate duration of insulin and/or a growth hormone surge is the underlying cause. It is also important to determine the frequency of rebound hyperglycaemia when using intermediate-acting insulin, because shorter-acting insulin might have a higher frequency of occurrence. Since some countries require veterinary-licensed insulin to be used, this knowledge would be valuable to assist clinicians managing diabetic cats treated with lente and exhibiting marked morning hyperglycaemia or insulin resistance.
The important clinical implication of our study is that while the dose of glargine should be reduced if the cat develops asymptomatic or clinical hypoglycaemia, it should not be reduced when the blood glucose concentration is high and poorly responsive to insulin. Fluctuations in blood glucose concentration are common in the first weeks, and more rarely months, following the initiation of treatment with glargine, and might be mistaken for rebound hyperglycaemia. This generally resolves with time using consistent dosing. It is unknown if these recommendations also apply to intermediate-acting insulin.
Footnotes
Funding
This research received no specific grant from any funding agency in the public, commercial or not-for-profit sectors.
Conflict of interest
The authors do not have any potential conflicts of interest to declare.