
Abstract
Limited information is available on pre-analytical variations in plasma analytes in cats. The objectives of this study were to assess the effects of the time of sampling and a standard meal on plasma analytes in healthy cats. Eight healthy, adult, fasted cats underwent blood sampling every 2 h from 8 am to 8 pm twice at a 12 day interval. On the days of sampling, four cats were kept fasted and the others were fed just after the first sample, in a crossover design. Plasma glucose, urea, creatinine, sodium, potassium, chloride, CO2, calcium, phosphate, proteins, albumin, cholesterol and triglycerides, alanine aminotransferase and alkaline phosphatase were assayed on each sample. Effects of time of sampling and meal on plasma biochemistry results were tested using a general linear model. Diurnal variations in tested plasma analytes in fasted cats were negligible except for urea and creatinine, which gave noticeably higher plasma concentrations in the afternoon than in the morning. Observed postprandial variations were of some importance for phosphate and creatinine and of indisputable clinical relevance for CO2 and urea.
Introduction
Plasma biochemical analysis has become a routine part of clinical evaluation in small animal medicine. As such, it is commonly used to screen for disease in apparently healthy animals, to diagnose disease and to monitor disease progression and response to treatment. 1 Pre-analytical factors may substantially influence laboratory test results and are known to be responsible for 30–77% of misinterpretations in human and veterinary laboratories.2–5 Among these factors, diurnal variations and effects of meals have been extensively documented as sources of biological variations in plasma analytes in human medicine 6 but reports in veterinary medicine are sparse, especially for cats. Appropriate preparation of the patient for blood sampling is not always possible or is often overlooked in veterinary medicine 7 and this might lead to clinical misinterpretation of test results by the clinician. The objective of the present study was therefore to assess the influence of the time of sampling and of a standard meal on plasma biochemistry results obtained in healthy cats.
Materials and methods
Cats
Eight clinically healthy domestic shorthair cats, three males and five females, all neutered, aged 4.5–5.3 years (median 5.2 years), weighing 3.3–4.5 kg (median 4.2 kg), housed in an indoor research facility with a 12 h light/dark cycle, controlled temperature (18–21°C) and ventilation (250 m3/h, 12 h/day) were used. Cats were declared healthy according to their medical record, clinical examination and results of the plasma biochemistry panels.
Study design
Each cat underwent serial blood sampling every 2 h from 8 am to 8 pm twice at a 12 day interval. Exact times of blood sampling were systematically recorded. On the first day of sampling, a group of four cats was kept fasted (F) and the other four were fed a standard meal (M) at 8 am. On the second day of sampling the groups were switched in a crossover design. The study was performed in accordance with French legal animal welfare regulations and adhered to published guidelines. 8
Diet, feeding and watering
Cats were routinely fed at 8 am with 65 g of a maintenance dry expanded feed (Vet Cat Neutered, Young Male; Royal Canin SAS), of which the nutrient composition is provided in Table 1. According to the modified Atwater formula, this diet provided approximately 39% of energy from protein, 27% from fat and 34% from carbohydrates. Testing was performed after a 24 h fast. According to the study design, on each day of testing, four selected cats were fed as usual just after the first blood sampling and the other four remained fasted throughout the whole sampling period. Cats were allowed free access to water at all times.
Nutrient composition of the diet (Vet Cat Neutered, Young Male, Royal Canin SAS, Aimargues, France)

Approximate energy distribution: protein 39% of dietary ME, fat 27% of dietary ME and carbohydrates 34% of dietary ME calculated using the modified Atwater formula
ME = metabolisable energy; NRC = National Research Council
Sampling procedure
First, the fur covering both jugular veins was clipped. For blood sampling, each cat was gently restrained in a sitting position by a trained handler. Blood samples (1 ml) were collected in heparin lithium tubes (Aquisel; JP Selecta) via direct jugular venepuncture with a 21 G needle (Neolus; Terumo NV) mounted on a 2 ml syringe (Injekt; B Braun). Overt struggling at the time of blood sampling was considered to be a confounding factor as this alone has been shown to influence plasma biochemistry results in cats.9,10
Sample processing
Blood samples were centrifuged (Rotofix 32A; Hettich Zentrifugen) for 5 mins at 4000 rpm within 30 mins of collection. The plasma supernatant was then immediately harvested and stored at −20°C until assayed within 5 days in the same laboratory. Sample stability in such conditions has been described previously. 11 On the days of testing, the plasma samples were allowed to thaw at room temperature for 30 mins before being assayed.
Assays
Plasma biochemistry assays were performed using a dry-slide technology analyser (Vitros chemistry system; Ortho-Clinical diagnostics). Concentrations of glucose, urea, creatinine, sodium, potassium, chloride, CO2, calcium, phosphate, proteins, albumin, cholesterol and triglycerides, together with activities of alanine aminotransferase (ALT) and alkaline phosphatase (ALP), were measured. A detailed description of the validation of these assays in the authors’ laboratory, under the same conditions, has already been published. 11
Statistical analysis
Effects of time of sampling and meal on plasma biochemistry results were tested by use of the following general linear model (GLM) with a statistical software program (Systat version 8.0; SPSS Inc):

With:
Yi, j, k, l, m being the value of variable Y for cat i with sequence k in period j at time m with status l;
µ being the general mean effect;
Cati|Sequencek being the effect of cat nested within sequence (k = M-F or F-M);
Periodj being the effect of day of sampling (j = 1 or 2);
Statusl(k; j) being the effect of status (l = F or M) in period j with sequence k;
Timem being the effect of time of sampling (m = 8 am, 10 am, 12 am, 2 pm, 4 pm, 6 pm or 8 pm);
Time*Statusm, l(k; j) being the status by time of sampling interaction term of the model;
ϵi,j,k,l,m being the error of the model.
A value of P <0.05 was considered significant.
When the GLM revealed a significant effect of time of sampling on a plasma analyte in fasted cats, the results obtained at each sampling time were compared in pairs with those obtained at all other times by use of a Tukey’s Honestly-Significant-Difference test. A value of P <0.05 was considered significant.
When it revealed a significant time by status interaction for a plasma analyte, the results obtained at each sampling time in cats fed a standard meal at 8 am were compared in pairs with those obtained at the same sampling time in the same cats kept fasted. These comparisons were performed by use of a Bonferroni test and a level of significance set at 0.0071 (ie, 0.05 divided by 7 comparisons).
Results
All cats ate the whole amount of food offered and all planned samples were collected. One cat struggled markedly on one occasion (4 pm on a fasted day) and the results for the corresponding sample were discarded from the data set. Therefore, 1665 results from 111, instead of the expected 112, samples were available for statistical analysis. The median absolute difference between nominal and exact times of sampling was 3 mins. Differences observed ranged from −24 to +9 mins.
The GLM evidenced an effect of time of sampling on biochemistry results in fasted cats for 9/15 analytes, namely urea (P <0.001), creatinine (P <0.001), sodium (P = 0.045), CO2 (P = 0.013), calcium (P = 0.011), cholesterol (P <0.001), triglycerides (P = 0.001), proteins (P = 0.039) and ALT (P = 0.043). Pairwise comparisons of results obtained at each sampling time with those obtained at all other times (ie, 20 pairwise comparisons obtained with the seven sampling times) were performed for each aforementioned analyte. Tukey’s Honestly-Significant-Difference test revealed statistically significant differences between times of sampling for urea (concerning 12/20 pairwise comparisons), creatinine (7/20), cholesterol (4/20), triglycerides (4/20), CO2 (2/20), calcium (2/20) and sodium (2/20), but not for proteins and ALT. The maximum amplitude of the differences observed between two different times of sampling for these seven analytes was calculated for each cat (Table 2).
Within-day variations of plasma analytes in eight healthy fasted cats

RI = reference interval
The GLM detected no meal effect on biochemistry results for 8/15 analytes (potassium, chloride, calcium, cholesterol, proteins, albumin, ALT and ALP). The standard meal significantly (P <0.001) altered the plasma concentration time course for glucose, urea, creatinine, sodium, CO2, triglycerides and phosphate (P = 0.001). Results were not significantly different from those obtained at the same time in fasted cats for glucose 4, 6, 8 and 12 h post meal, creatinine 2 h post meal, sodium 8 and 12 h post meal and CO2 8, 10 and 12 h post meal. The greatest differences observed between postprandial and fasted conditions in any individual cat were +8 mmol/l and +7 mmol/l at 10 am for sodium and CO2, respectively, +1.0 mmol/l at 12 am for glucose, +3.4 mmol/l at 2 pm for urea, +0.6 mmol/l and +0.73 mmol/l at 4 pm for phosphate and triglycerides, respectively, and −48.7 µmol/l at 6 pm for creatinine.
Key results are summarised in Tables 2–4 and represented graphically in Figure 1 a–i.

Variations in mean plasma (P) concentrations of the following analytes from 8 am to 8 pm in eight cats kept fasted (black) or fed a standard meal just after the first blood sample at 8 am (red): glucose (a), urea (b), creatinine (c), sodium (d), CO2 (e), calcium (f), phosphate (g), cholesterol (h) and triglycerides (i). Grey dotted lines: lower and upper limits of the reference interval; black curved line: diurnal variations in fasted cats; mean values corresponding to black symbols marked with a different superscript letter are statistically different; maximal amplitude of mean diurnal variations are figured whenever appropriate by a black vertical bar on the right side of the graph and the corresponding value in % is provided just next to the bar; black straight line: mean daily value observed in fasted cats. Red curved line: postprandial variations observed in cats fed a standard meal at 8 am; mean values corresponding to red symbols marked with an asterisk are statistically different from the mean value obtained at the same time in fasted cats. Maximal difference observed between means and corresponding time are figured whenever appropriate by a purple vertical dotted line and the corresponding value is provided in purple type directly on the graph; red straight line: mean daily value observed in cats fed a standard meal at 8 am
Discussion
The primary objective of this study was to determine whether the results of routine clinical biochemistry testing and their clinical interpretation could be influenced by time of sampling or meal ingestion in cats. Appraisal of a significant change in any clinical pathology result can, however, be difficult.
Thus, the first criterion used was statistical significance, which revealed that six variables were affected neither by time of sampling nor by meal (namely chloride, potassium, proteins, albumin, ALT and ALP), two (glucose and phosphate) showed postprandial variations only, two (calcium and cholesterol) were subjected to diurnal variations unaltered by meal ingestion and five (urea, creatinine, sodium, CO2 and triglycerides) were dependent on both factors.
However, a large number of statistically significant differences and discrepancies between the measurements could be found even though their amplitude was in fact very slight and had no relevance. Use of the critical difference or reference change value would be more appropriate to appraise the relevance of the difference observed between results obtained under different pre-analytical conditions. Indeed, the critical difference for a given variable is calculated from the between-subjects variance, the within-subject variance and the analytical variance. 12 This parameter may therefore help to ascertain whether the difference between two measurements obtained from the same individual can be ascribed to biological variation or not. If this difference is less than the critical difference, it may be ascribed to random variations. 12 Such biological variation data has recently been published for all biochemistry variables for which significant diurnal and/or postprandial variations were observed in this study, except triglycerides. 13 Reference change values were therefore used as a second-line criterion to assess the relevance of the differences observed in this study. In the light of this, it was concluded that, at least in some individuals, postprandial variations could be biologically relevant for glucose, urea, sodium and phosphate and that both diurnal and postprandial variations could be of importance for creatinine and CO2 (Tables 3 and 4; Figure 1a–e,g).
Maximal diurnal and postprandial variations observed in mean and individual concentrations of plasma biochemistry analytes in eight healthy cats

RI = reference interval; RCV = reference change value; 13 – = no statistically significant variation; when the amplitude of a variation exceeds the RCV, corresponding analytes and values are in bold type
Twelve hour postprandial variations of plasma analytes in eight healthy cats fed a standard meal at 8 am (as compared with values obtained at the same time of day in the same cats kept fasted)
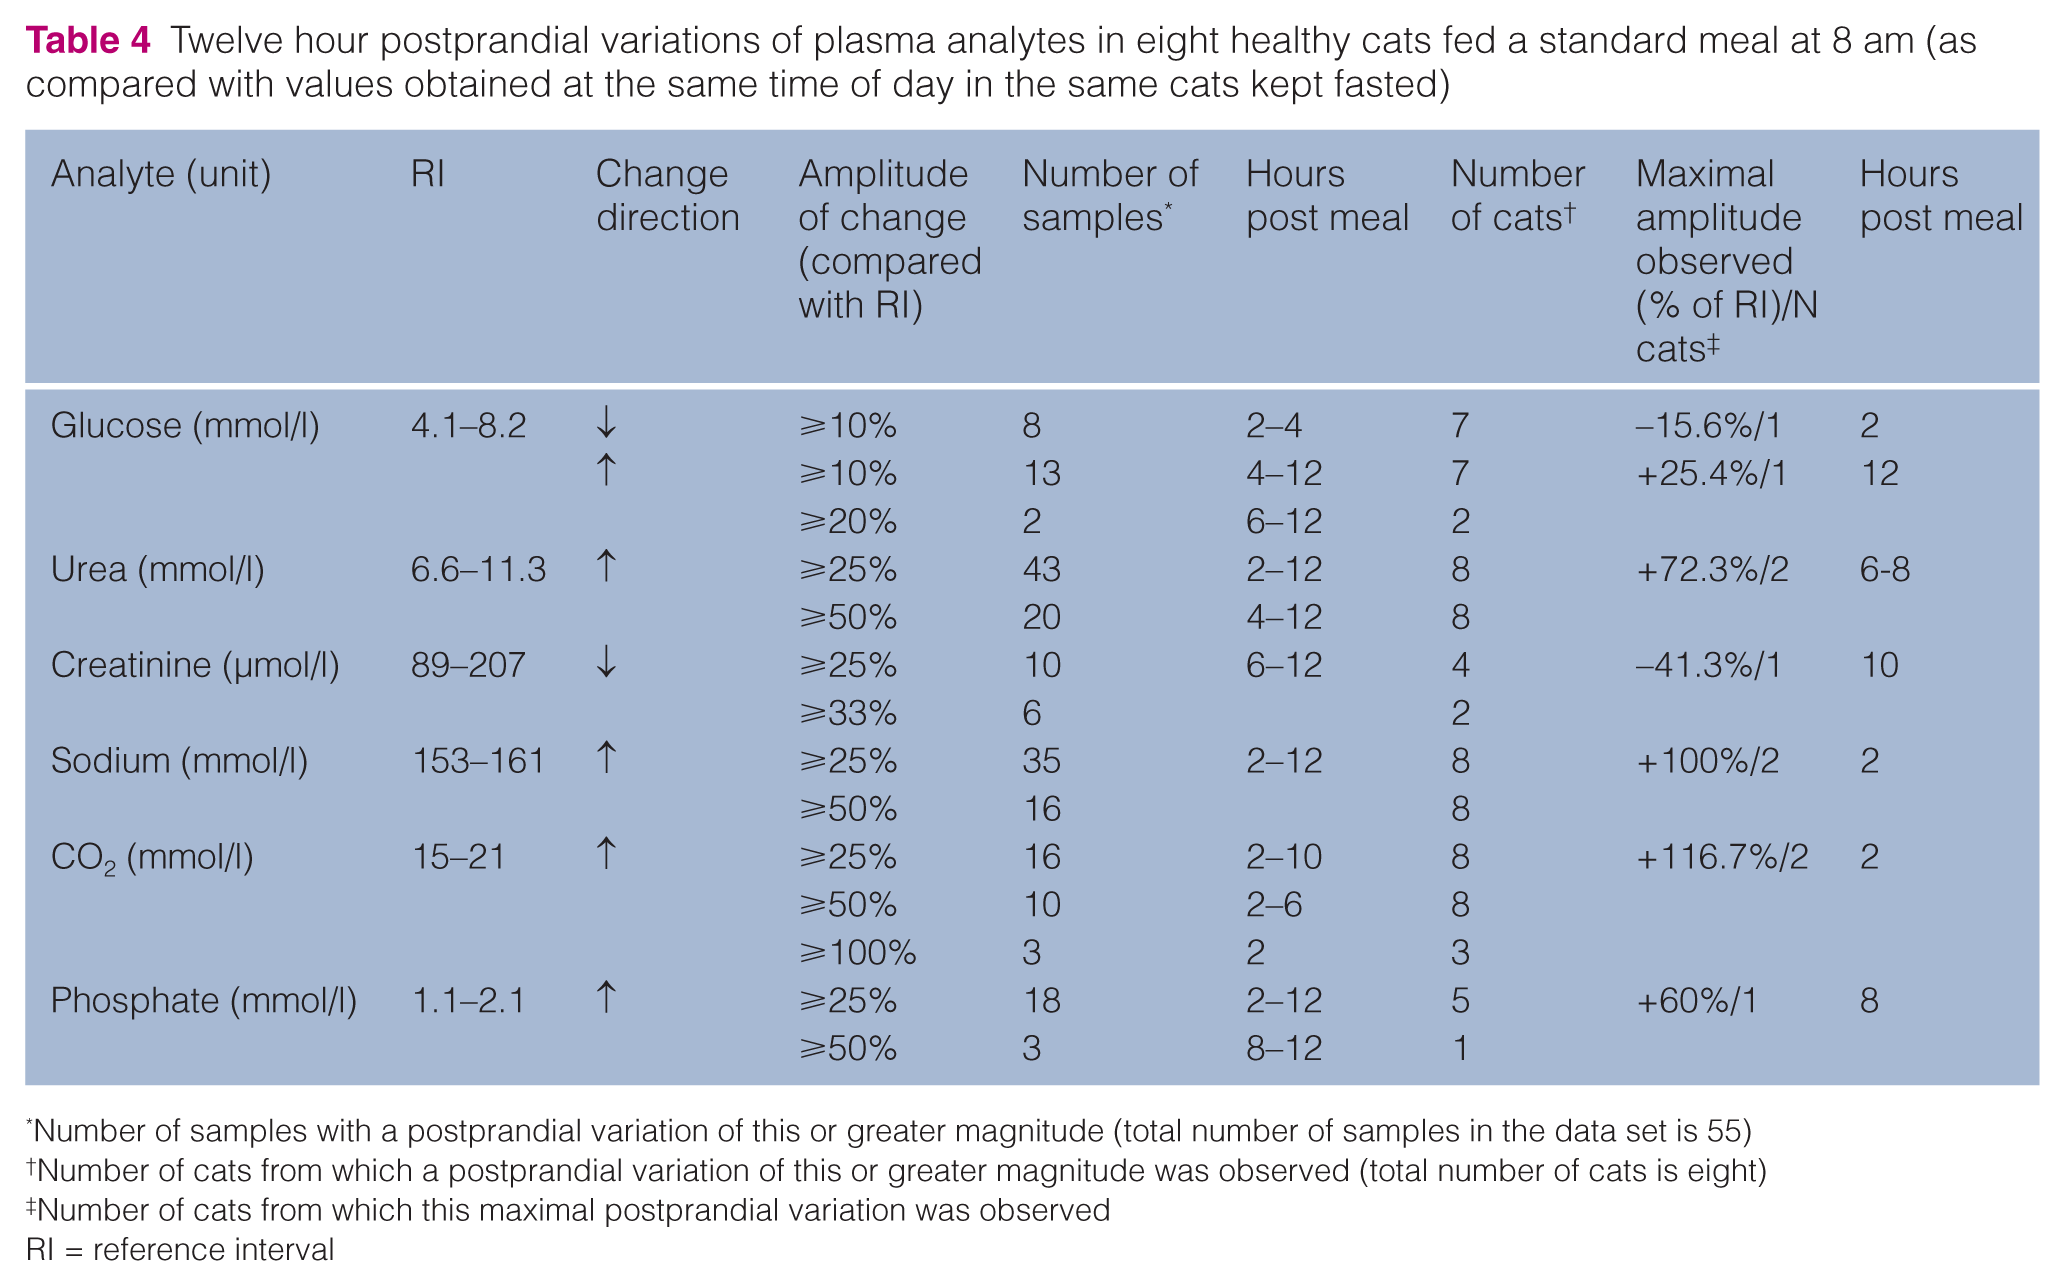
Number of samples with a postprandial variation of this or greater magnitude (total number of samples in the data set is 55)
Number of cats from which a postprandial variation of this or greater magnitude was observed (total number of cats is eight)
Number of cats from which this maximal postprandial variation was observed
RI = reference interval
When reference change values are not available, it has been proposed that the relevance of the difference between two test results can be graded by comparison of the median value of the difference with the corresponding reference interval (RI). 14 Indeed, comparison of the maximal differences observed between plasma triglyceride concentrations in two samples obtained at different times from fasted cats appeared negligible (Table 2; Figure 1i). Similarly, the median of the differences observed between plasma triglyceride concentrations in two samples obtained at the same hour from fed vs fasted cats (0.23 mmol/l) was minor in comparison with the corresponding RI (0.2–1.8) mmol/l. Moreover, a difference greater than one-third of this range was observed only on 5/55 occasions and in 3/8 cats. Although statistically significant, diurnal and postprandial variations in plasma concentration of triglycerides were therefore considered irrelevant (Figure 1i).
A more meaningful criterion would be the clinical relevance of the observed variations. In clinical settings, a relevant change would be one that would affect medical decision making. Unfortunately, such changes are largely assessed subjectively and their relevance may depend on the individual patient.
Postprandial changes in plasma glucose concentrations were biphasic. A decrease was observed in the 4 h following ingestion of the standard meal followed by a sustained increase for the remainder of the day (Table 4; Figure 1a). The delayed and prolonged increase in plasma glucose concentration observed is typical of feline postprandial response and may reflect several specific physiological features. 15 Postprandial insulin secretion is reportedly reduced and delayed; 16 therefore, the decrease in plasma glucose concentration in the couple of hours immediately following meal ingestion was more surprising. However, a similar response has previously been reported in healthy lean and obese cats after ingestion of some commercially available diets and was associated with a high increase in insulin.17,18 Overall, the amplitude of the shifts in plasma glucose concentration was mostly slight and unlikely to be of clinical relevance (Tables 3 and 4). However, postprandial response may notably be affected by gender, 15 carbohydrate content of the diet, 19 carbohydrate source 20 and feeding management. 15 Therefore, postprandial glucose concentrations might be more severely altered in conditions other than those of this study. Stress hyperglycaemia does occur in cats 10 and may be considered as a confounding factor. It is unlikely that our results were biased by such a stress response as the research cats used in this study were familiar with their environment, operators and procedures. Marked struggling during blood sampling occurred only once and the corresponding sample was discarded from the data set. Moreover, no variation in plasma glucose concentration was evidenced when the cats remained fasted, which strongly suggests that the effects of the stress associated with serial blood sampling were overall also negligible when the cats were fed.
Both diurnal and postprandial variations in plasma concentrations of urea and creatinine were observed (Tables 2–4; Figure 1b,c). Mean plasma concentrations of urea and creatinine at 8 pm were 15% and 18% higher than those obtained at 8 am, respectively. Such diurnal variations have not been specifically reported in cats to the best of our knowledge. Plasma creatinine concentration is also reportedly higher in the afternoon than in the morning in humans. 21 It has been shown that fasting may artefactually increase the serum creatinine concentration when measured by the Jaffe method through production of non-creatinine chromogens such as acetoacetate. 22 However, this explanation does not hold for the results of our study where creatinine was measured by an enzymatic method. Postprandial changes in plasma or serum concentration of urea have not been specifically documented in the cat to the best of our knowledge. In dogs, a marked and sustained increase, similar to the profile observed in the cats of this study, has been repeatedly reported.23–26 In one study describing postprandial variations in plasma creatinine concentration in cats, an increase in relation to the creatinine content of the diet was observed. 27 Similarly, an increase in plasma creatinine concentration after a meal of meat has predominantly been described in dogs.24,28 However, following ingestion of commercial food, increases,29,30 decreases 24 or no change 25 were also observed. 31 In our study, plasma concentration of creatinine remained lower when the cats were fed than when they were kept fasted. This might be due to a postprandial increase in glomerular filtration rate and urinary excretion of creatinine, as observed in dogs and humans after a meal rich in protein.32–35
Diurnal variations in plasma concentrations of sodium, CO2 and phosphate were either non-existent or negligible and postprandial profiles for these analytes were as expected1,7 although not specifically documented in the cat to date (Tables 2–4; Figure 1d–f). Indeed, in humans, sodium and phosphate plasma concentrations might increase after a meal and a postprandial metabolic alkalosis with an increase in venous CO2 (alkaline tide) is classically observed. 36 Similarly, the blood gas profiles obtained 4 and 24 h after eating in dogs were shown to be statistically different. 37 Inorganic phosphate is readily absorbed from the intestines in cats, resulting in marked increases in plasma concentration after consumption. 1 Overall, the observed postprandial variations were unlikely to bias clinical interpretation for sodium but could be of importance for both CO2 and phosphate.
Conclusions
The results of this study support the general recommendation of appropriate patient preparation (ie, fasting) for plasma biochemical analysis in cats. However, when a feline patient is known to have ingested some food in the 12 h preceding blood sampling or when fasting status cannot be ascertained, most plasma biochemistry results might still be considered valid (eg, sodium, chloride, calcium, cholesterol, triglycerides, proteins, albumin, ALT and ALP) whereas others should be examined with caution (eg, creatinine, phosphate) or ignored (eg, urea, CO2). The effects of a meal may yet depend on the diet composition and the amount ingested. Therefore, although a standard diet was intentionally selected here, the trends observed should not be generalised to conditions other than those of this study or used to draw any definitive conclusion on plasma results obtained in non-fasted cats.
Whenever appropriate patient preparation is secured, additional attention should be paid to the time of sampling, especially when serial measurements are performed for the purpose of follow-up, as diurnal variations could be of importance, at least in some individuals, for a limited number of plasma analytes (eg, urea, creatinine). Non-existent or negligible diurnal variations were, however, specifically documented for the first time in cats for most common plasma analytes, including glucose and phosphate.
Overall, this study contributes to a better knowledge of pre-analytical factors of biological variation for common plasma analytes in cats. However, it should be kept in mind that these findings were obtained in clinically healthy cats and cannot be generalised to diseased subjects.
Footnotes
Acknowledgements
The authors wish to thank Prof Alain Bousquet-Melou and all the team of the animal housing facilities, UMR 1331 Toxalim, INRA, Université de Toulouse, France, and Mrs Marianne Legras from the Unité de Recherche Clinique, Université de Toulouse, France, for their help and support during this study, and Mrs Claude Germain from the Central Laboratory, National Veterinary School, Toulouse, France, for performing the assays.
Conflict of interest
The authors do not have any potential conflict of interest to declare.
Funding
This research received no specific grant from any funding agency in the public, commercial, or not-for-profit sectors.