
Abstract
Eosinophilic enteritis (EE) in cats is poorly characterized. The aim of the current study was to retrospectively evaluate the clinical and ultrasonographic findings in cats with histologic evidence of eosinophilic inflammation on gastrointestinal biopsy. Twenty-five cats with tissue eosinophilia on surgical (10) or endoscopic (15) biopsy of the gastrointestinal tract, having an abdominal ultrasound performed within 48 h of biopsy acquisition, were enrolled. History, clinical presentation, clinical pathology and abdominal ultrasound findings were reviewed. Intestinal biopsies were evaluated by a single pathologist and separated into two groups based on the degree of eosinophilic infiltrate: mild (<10 eosinophils/high-power field [HPF], 11/25 cats), or moderate/marked (>10 eosinophils/HPF, 14/25 cats). The former were considered primary lymphoplasmacytic or lymphocytic inflammatory bowel disease (LPE) with subtle eosinophilic infiltrates, and the latter to have EE. Signalment, history and clinical signs were similar in all cats. Only cats with EE (6/14) had palpably thickened intestines. The only distinguishing clinicopathological feature of cats with EE was the presence of peripheral eosinophilia (6/14). On ultrasound, when compared with cats with LPE, cats with EE had a greater mean jejunal wall thickness (3.34 mm ± 0.72 mm vs 4.07 mm ± 0.58 mm, respectively) and an increased incidence of thickening of the muscularis layer (1/11 and 11/14, respectively). In conclusion, ultrasonographic evidence of a prominent intestinal muscularis layer, palpably thickened intestines and peripheral eosinophilia can serve as biomarkers for the presence of EE in cats with chronic intestinal signs.
Introduction
Under physiological conditions, small numbers of eosinophils are found in the gastrointestinal (GI) tract where they play an important role in host immunity and intestinal homeostasis.1–3 Increased accumulation of eosinophils in the GI tract has been documented in cats with infectious disease (eg, helminth endoparasitism, toxoplasmosis), food hypersensitivity, hypereosinophilic syndrome and neoplasia (mast cell neoplasia and T cell lymphoma).4–10 Eosinophilic GI inflammation can also accompany idiopathic inflammatory bowel disease (IBD) in cats.11–14 When eosinophils are the predominant inflammatory cell on histopathology and no other inciting cause for their presence can be identified, this IBD variant is referred to as eosinophilic enteritis (EE).11–14 Alternatively, eosinophils may occur in lower numbers in IBD in conjunction with idiopathic lymphoplasmacytic enteritis (LPE) or lymphocytic infiltrates.14 –18 In the over 200 cases of feline lymphoplasmacytic IBD (LPE) described in the veterinary literature to date, the incidence of concurrent mild eosinophilic inflammation is high.14–18 However, only 19 cases of IBD associated with predominant EE have been reported in cats.4,9,11,15 However, these studies were not specifically designed to describe the clinical syndrome of EE. The purpose of the current study was two-fold. The first goal was to describe the clinical presentation and clinicopathological and ultrasonographic findings in cats with a histological diagnosis of EE; the second was to compare the findings in these cats with EE with those in cats with subtle eosinophilic intestinal inflammation, but a primary diagnosis of lymphoplasmacytic or lymphocytic IBD (LPE).
Materials and methods
The pathology database from the Foster Hospital for Small Animals was searched from 2002 to 2011 for cats with eosinophilia on GI biopsies in the absence of neoplasia that had concurrently undergone abdominal ultrasonography within 48 h of biopsy acquisition. Intestinal biopsies were blindly interpreted by a single board-certified pathologist (JHK) in accordance with published World Small Animal Veterinary Association (WSAVA) guidelines.19,20 The degree of eosinophilic inflammation was graded as mild (5–10 eosinophils per 40× field), moderate (10–20 eosinophils per 40× field) or marked (eosinophils predominate and are not easily enumerated). Cats were divided into two groups based on the degree of eosinophlic infiltration (mild vs moderate/marked).
Pertinent historical and clinicopathological information was recorded from the medical records, including sex; age; breed; diet and medication history; history of prior allergic disease; presenting clinical complaint; duration of clinical signs; complete blood count (CBC) and serum biochemistry findings; fecal analysis; and urinalysis. All hematology and biochemical tests were conducted in the Clinical Chemistry Laboratory at Tufts Cummings School of Veterinary Medicine. Hematology tests were done on a CellDyn 3700 with manual differential counts and microscopic examination of the blood smear performed by certified medical technologists. Biochemistry profiles were done using a Roche Cobas c150. Reference intervals were generated using healthy volunteer cats owned by faculty, staff and students at the school. Finally, ionized calcium measurements were performed using an Abaxis VetScan i-STAT.
A single board-certified radiologist (DGP) retrospectively reviewed ultrasound reports and images. The following sonographic features of the GI tract were evaluated: total wall thickness; relative thickness of the intestinal muscularis layer; and alteration in mucosal layer echogenicity. Total wall thickness was measured by placing calipers on the inner interface of the mucosa and on the outer perimeter of the serosa. The intestinal wall was considered thickened if it measured >2.5 mm.21–24 The relative thickness of the muscular layer was estimated by calculating (in %) the proportion of the thickness of the muscular layer to the total small intestinal wall thickness. The muscular layer was considered thickened if it represented >15% of the total wall thickness. 25 Any presence of abdominal lymphadenopathy was noted. Lymphadenopathy was defined when lymph nodes were >4 mm, hypoechoic and/or with rounded margins.
Statistics
Clinical pathology results and quantitative analysis of the intestinal wall on ultrasound were expressed as median with range or mean with SD for non-parametric and parametric data, respectively. Data were analyzed for normality using skewness and kurtosis. For statistical comparison of clinical pathology parameters and ultrasound measurements between cats with EE or LPE, parametric (Student’s t) or non-parametric (Mann–Whitney) tests were used with significance set at P <0.05. Two × two contingency tables were constructed to analyze categorical data from cats with EE or LPE, and were compared using Fisher’s exact test with a two-tailed P <0.05 considered significant.
Results
Histopathology
Twenty-five cats with histopathological evidence of eosinophil infiltrates met the inclusion criteria. Intestinal biopsies were obtained surgically in 10/25 cats and endoscopically in 15/25 cats. A single board-certified veterinary pathologist (JHK) evaluated the biopsies. All biopsies were considered adequate for diagnostic purposes. Seventeen gastric biopsies, 20 duodenal biopsies, nine jejunal biopsies, two ileal biopsies and one colonic biopsy were evaluated. All jejunal and ileal biopsies were full-thickness surgical biopsies. The single colonic biopsy was obtained endoscopically.
The degree of eosinophilic inflammation was graded as marked (6/25), moderate (8/25) or mild (11/25). In 24/25 cats, the eosinophilic inflammation was confined to the mucosa. Fourteen cats had moderate-to-marked and/or eosinophil predominate inflammation, and were termed EE. In 11/14 of these cats, eosinophils were the primary inflammatory cell infiltrate and in 3/14, there were moderate, but equal, numbers of eosinophils and lymphocytes and/or plasma cells.. The other 11 cats had mild infiltrates of eosinophils, and were designated as cases of LPE. Nine of these cats had a greater degree of lymphoplasmocytic inflammation within the GI tract. The degree of lymphoplasmocytic inflammation was mild in 5/11 and moderate in 4/11 cats. Two of 11 cats with mild eosinophilic infiltrates had approximately equal degrees of eosinophilic and lymphocytic mucosal inflammation. Polymerase chain reactions for antigen receptor rearrangement performed on a biopsy in a cat with concurrent hypercalcemia demonstrated a polyclonal T cell population not supportive of a diagnosis of lymphoma.
Additional histopathological changes on intestinal biopsy included mucosal fibrosis (9/25) and dilated lacteals (2/25). Two cats had enteric masses (duodenal in one cat and ileal in another) with extensive transmural eosinophilic infiltrates accompanied by granulation tissue and atypical collagenous stroma. Both cats had eosinophilic mesenteric lymphadenitis. Special stains with toluidine blue revealed minor infiltrates of mast cells in both. These biopsies were consistent with a diagnosis of eosinophilic sclerosing fibroplasia.26,27 These cats also had moderate/marked eosinophilic mucosal inflammation and muscular hypertrophy in jejunal biopsies.
Seventeen of 25 cats had concurrent gastric biopsies. Eosinophilic inflammation was present in only 2/17 cats. Other abnormalities included surface spirochetes (8/17), prominent lymphoid follicles (6/17), mucosal fibrosis (1/17) and edema (1/17).
Nine cats had hepatic biopsies. Six of these had mild hepatic lipidosis, two were normal and one had a biliary cystadenoma. Five cats had abdominal lymph node biopsies. Two of these were normal and 3/5 had evidence of eosinophilic lymphadenitis. Of these latter three cats, two were diagnosed with eosinophilic sclerosing fibroplasia, and the third had moderate eosinophilic infiltrates in the GI tract.
Signalment
The mean age of the cats in this study was 9.2 ± 4.2 years (range 1.0–17.0 years). The majority of cats were domestic shorthairs (14/25). Other breeds included domestic longhair (3), Persian (2), Siamese (1), Siamese cross (1), Maine Coon (1), Balinese (1), Himalayan (1) and Scottish Fold (1). There was no difference in sex or age between cats with LPE and cats with EE (Table 1).
Comparison of clinical parameters in cats with eosinophilic enteritis (EE) and lymphoplasmacytic/lymphocytic enteritis (LPE)
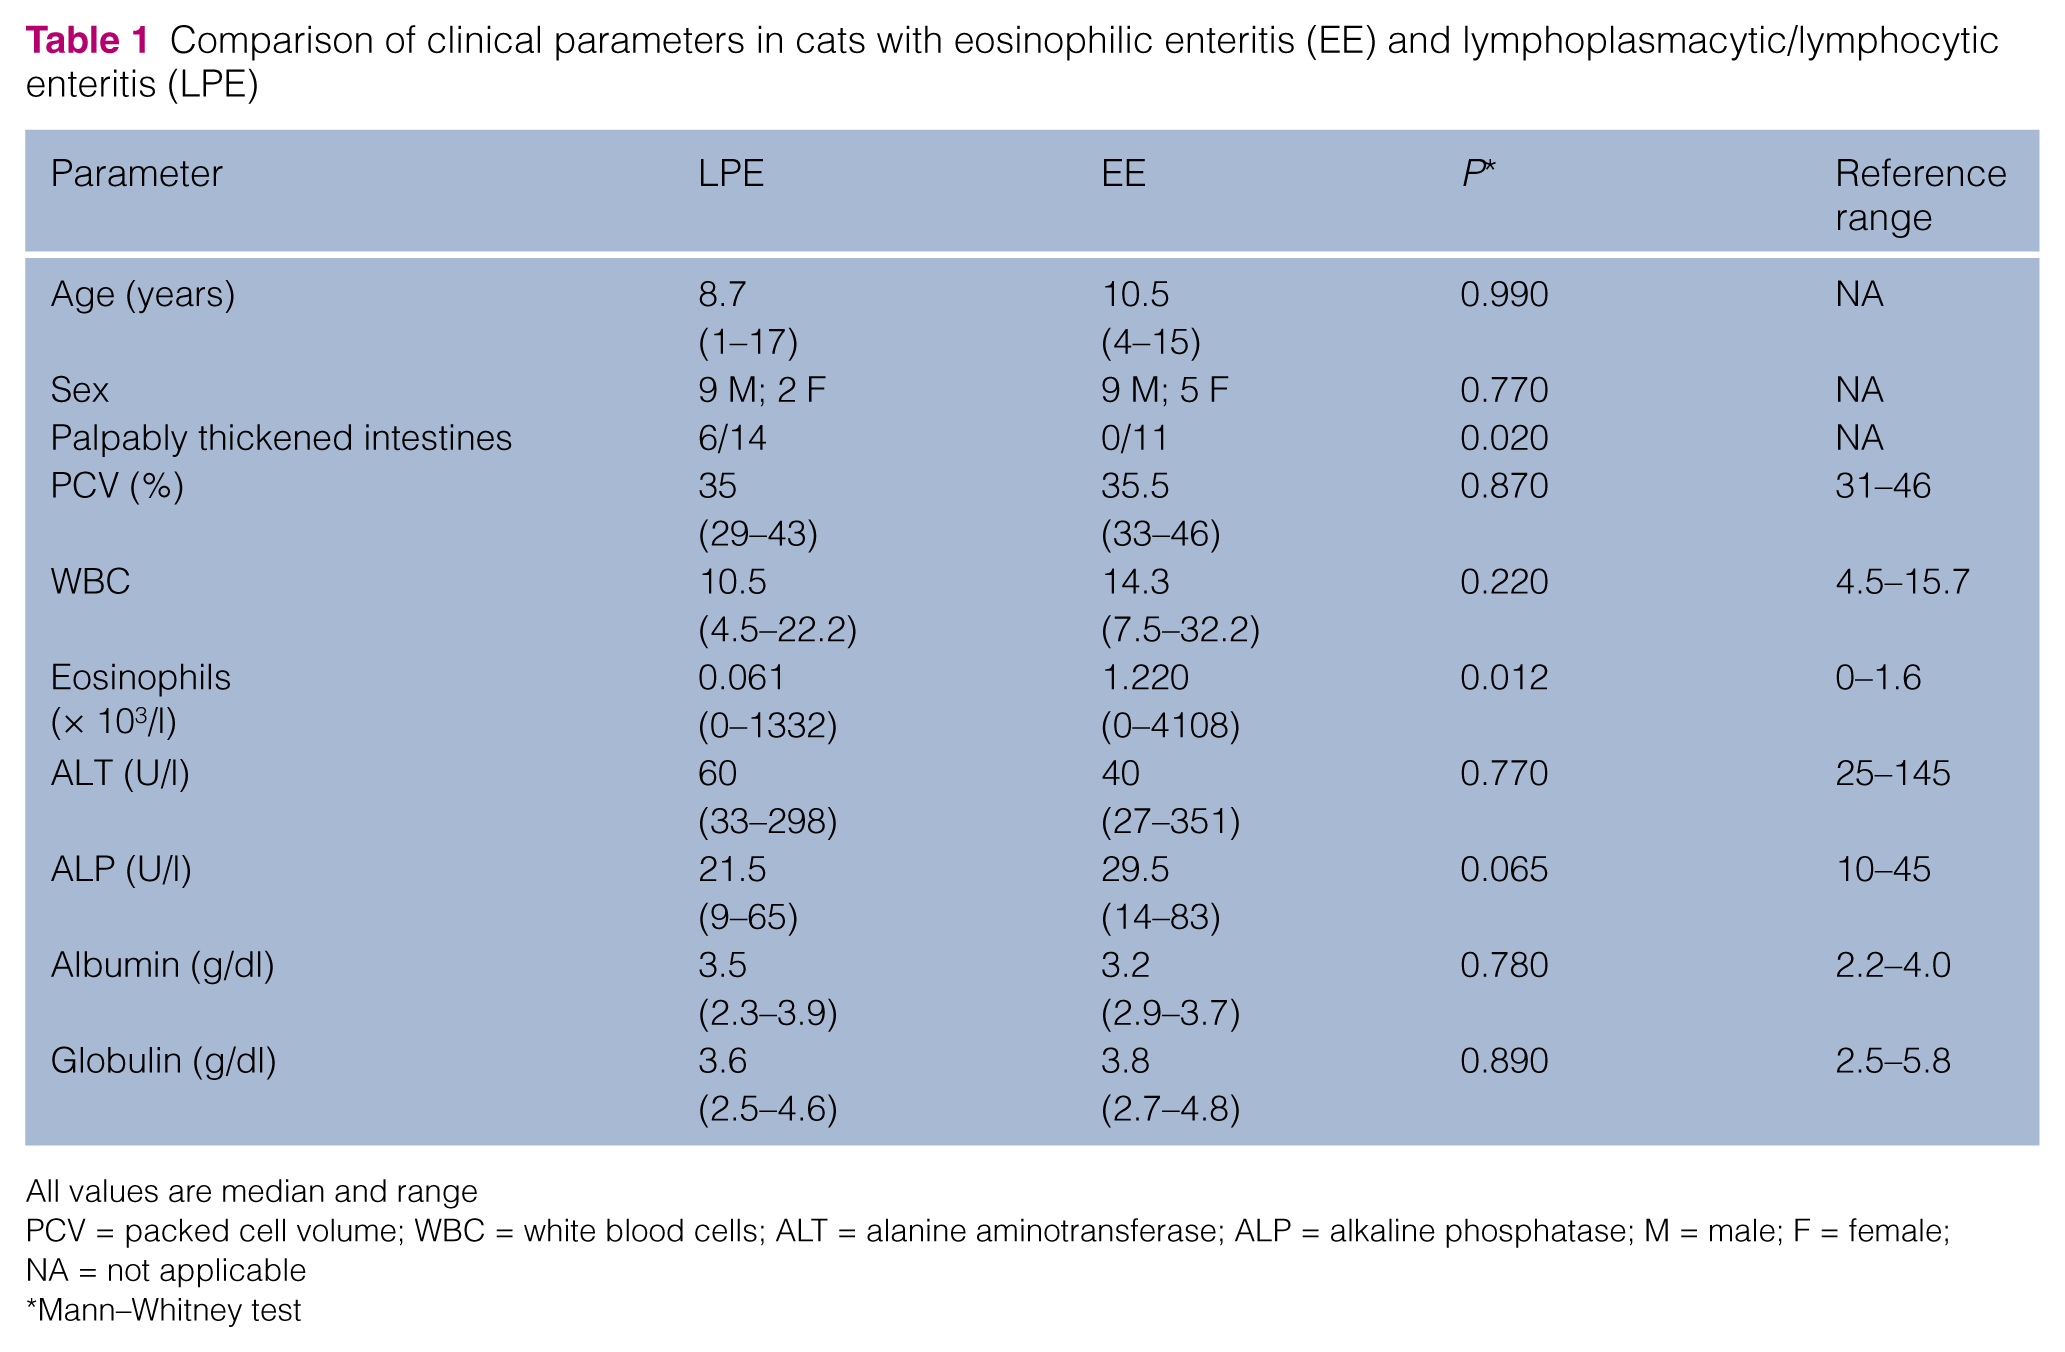
All values are median and range
PCV = packed cell volume; WBC = white blood cells; ALT = alanine aminotransferase; ALP = alkaline phosphatase; M = male; F = female; NA = not applicable
Mann–Whitney test
Clinical signs and physical examination
The most common clinical signs were vomiting (20/25), anorexia/hyporexia (9/25), weight loss (7/25), diarrhea (5/25: small bowel 5/5, large bowel 1/5) and lethargy (4/25). The majority of cats (23/25) had chronic clinical signs (>3 weeks’ duration). There was no difference in clinical signs between cats with EE and LPE. Six of the 25 cats had prominent loops of bowel on abdominal palpation, all of which had EE.
Four cats had a history of allergic disease. Three cats had been previously diagnosed with allergic airway disease, and a fourth had a history of allergic skin disease. Other past pertinent history included two cats with hypertrophic cardiomyopathy, two cats with signs consistent with feline lower urinary tract disease, and one cat each with esophageal stricture, diabetes mellitus, epistaxis, hyperthyroidism and idiopathic hepatic lipidosis.
Six cats were being treated with corticosteroids at the time of intestinal biopsy. Five cats were receiving prednisolone (1–2 mg/kg/day PO) for 1 month to 1 year, three for chronic vomiting, one for feline asthma and one for epistaxis. The sixth cat was treated for chronic GI signs with an unknown dose of dexamethasone subcutaneously 2 weeks before presentation.
Clinical pathology
CBC and routine biochemistry profiles were available for review in 24/25 cases (Table 1). Changes noted on CBC included eosinophilia (>1.6.0 × 103/µl) in 6/24 cats (median: 2.79 × 10³/µl; range 1.62–4.11 × 10³/µl), all of which had EE. Other CBC changes included leukocytosis (6/24; median 17.5 × 10³/µl, range 15.8–32.2 × 10³/µl) and anemia (2/25; range 28–31%). Biochemical abnormalities included increases in blood urea nitrogen (BUN) (7/24; median 41 mg/dl, range 35–61 mg/dl), alanine aminotransferase (ALT) (4/24; median 220 U/l, range 144–351 U/l), alkaline phosphatase (1/25: median 23.2 U/l, range 9–83), bilirubin (1/24; 0.4 mg/dl), creatinine (1/24; 2.2 mg/dl) and ionized calcium (1/24; 1.97 mmol/l). No cats had increases in gamma glutamyl transpeptidase. Based on concurrent urine specific gravity, 3/7 cats with increased BUN had renal azotemia. Serum albumin and globulins were normal in all cats. There was no difference between the biochemical parameters in cats with EE and LPE.
The potential for GI parasitism was evaluated. Nineteen/25 cats had either recently been dewormed (8/25) or had negative fecal flotation testing during their work-up (11/25). The remaining six cats were all older (mean 10.7 years, range 5.0–17.0 years) and lived exclusively indoors with limited opportunity for exposure to parasites. Two of these cats responded to treatment with a hypoallergenic diet and two responded to corticosteroid treatment, suggesting that parasitism was not the underlying cause for the chronic GI signs.
Ultrasonographic assessment
Ultrasonographic images and videotapes were available for review in 22/25 cases. For three cases only the abdominal ultrasound report written by a board-certified radiologist was available for review. Wall thickness was assessed in 23/25 cases (Figure 1). The mean jejunal intestinal wall thickness of these cats was greater (3.76 mm ± 0.69 mm) than the reference value (2.2–2.4 mm).21–24 The mean jejunal wall thickness for cats with EE (4.07 mm ± 0.55 mm) was significantly greater (P = 0.013) than that measured in cats with LPE (3.34 ± 0.72 mm) (Table 2). Subjectively, small intestinal muscularis layer thickening (diffuse 8/12 or multisegmental 4/12) was noted in 12/25 cats. Significantly more cats with EE had a thick muscular layer (11/14) compared with cats with LPE (1/11). In order to obtain a more objective measure of the width of the muscularis layer, a ratio of the muscularis thickness to total wall thickness was calculated in 19/25 cats. 25

Longitudinal sonogram of a thickened (4.6 mm) jejunal segment with altered layering (between arrowheads). The muscular layer is markedly thickened compared with the other layers. Lu = lumen of the segment
Comparison ultrasound findings in cats with eosinophilic enteritis (EE) and lymphoplasmacytic/lymphocytic enteritis (LPE)

Values are mean with standard deviation
NA = not applicable
Fisher’s exact test
The mean ratio for all cats in this study was 37.7% ± 19.4%, with 18/19 cats having ratios considered abnormal (>15%). 25 The mean muscularis to total wall thickness ratio was significantly greater in cats with EE (46.5% ± 12.4%) than in cats with LPE (22.4% ± 9.9%) (Table 2). All of the cats with EE and 6/7 cats with LPE had ratios >15%. Abdominal lymphadenopathy was noted in 5/25 cats (3/5: jejunal l, 1/5 gastric), four cats of which also had a thickened muscularis layer on ultrasound and a diagnosis of EE. Other ultrasonographic findings included mucosal hyperechogenicity (12/25) and a visible hyperechoic band within the mucosal layer of the small intestines consistent with mucosal fibrosis (6/25). 28
Discussion
This report compares the clinical presentation, as well as the clinicopathological and ultrasound findings, between cats with EE and cats with LPE. Although all cats in the study had some degree of tissue eosinophilia on small intestinal biopsy, two populations of cats were defined based on the degree of eosinophilic inflammation within the small intestine. One population of cats had mild infiltrates of eosinophils with predominate lymphocytic or lymphoplasmacytic inflammation. This group of cats had a histological diagnosis of primary lymphocytic or lymphoplasmacytic enteritis (LPE). The second group of cats had moderate/marked inflammation with a predominance of eosinophils. By definition, this latter group of cats with chronic GI signs for which no other known cause for eosinophilic inflammation was found likely represents cats with the syndrome called EE.11–14
In this study, the majority (11/14) of cats with EE, but only 1/11 cats with LPE, had diffuse or multi-segmental increases in overall intestinal wall thickness, predominately associated with an increased width of the muscularis layer. Similar findings have been reported in cats in association with GI small cell lymphoma, intestinal mastocytosis, LPE, and in an idiopathic syndrome.24,29–33 The increased thickness of the muscularis layer could represent infiltrative disease or smooth muscle hypertrophy/hyperplasia. In two cats with eosinophilic sclerosing fibroplasia in this study, there were transmural eosinophilic infiltrates at the site of the mass lesion, but simple smooth muscle hypertrophy was present in jejunal biopsies distant from the mass lesions. In one additional cat with a full-thickness biopsy, muscular thickening was due to smooth muscle hypertrophy. Several studies in cats with muscularis enlargement secondary to LPE or small cell T cell lymphoma have also not demonstrated inflammatory or neoplastic cells infiltrating into the muscularis layer.24,30–33 Eosinophilic GI and respiratory disease (asthma) in humans can be accompanied by smooth muscle hypertrophy/hyperplasia. 34 The pathogenesis of this tissue remodeling is not completely understood, but studies suggest that secretory products of eosinophils, as well as cytokines and chemokines (interleukin (IL)-13, IL-4, IL-5, eotaxin and transforming growth factor-β) produced by activated epithelial cells, and stromal cells act on smooth muscle to cause the changes. 34 Our study suggests that EE should be added to the list of conditions that can be associated with diffuse or multisegmental intestinal muscularis thickening on abdominal ultrasound in cats.
We used objective criteria to determine the relative degree of muscularis hypertrophy in our population of cats. 25 In applying these criteria, cats with EE had, on average, double the width of the muscularis layer, unlike the cats with LPE. However, 6/7 cats with LPE still had some degree of muscularis thickening (Table 2), suggesting, perhaps, that smooth muscle hypertrophy may be a generalized marker for the presence of inflammatory infiltrates in the cat intestine. Further prospective studies will be necessary to verify this association.
Abdominal lymphadenopathy was observed in five cats, four of which also had concurrent diffuse thickening of the muscularis externa and evidence of EE on intestinal biopsy. Previous studies have suggested that the combination of diffuse ultrasonographic muscularis thickening and lymphadenopathy serve as a potential marker for feline GI small cell lymphoma. 30 This study suggests that this constellation of ultrasonographic findings may also occur in EE in cats.
Some distinguishing clinical features were identified in the cats with idiopathic EE. Six of 14 cats had palpably thick intestines on physical examination, and 5/14 had a peripheral eosinophilia. Four cats with EE had muscularis thickening and lymphadenopathy along with an eosinophilia. This constellation of signs should prompt consideration of a diagnosis of idiopathic EE. Of note was the lack of evidence of concurrent inflammatory hepatobiliary disease in the cats with EE as only two cats had elevated ALT and only one had elevated alkaline phosphatase. In addition, none of the five hepatic biopsies in these cats showed evidence of inflammatory disease. Concurrent inflammation in the biliary tree may not be as common in EE as in lymphoplasmacytic IBD where increases in ALT can occur in up to 50% of patients.17,35
It is important to recognize that the histological diagnosis of EE in a cat with chronic GI signs and no evidence of a predisposing cause can serve as a marker for several variants of idiopathic eosinophilic GI disease, including diffuse idiopathic EE, eosinophilic sclerosing fibroplasia or hypereosinophilic syndrome. Two cats in the EE group were diagnosed with eosinophilic sclerosing fibroplasia.26,27 In this recently described syndrome, cats typically present with a mass lesion in the intestine, characterized histopathologically by the presence of dense collagen trabeculae, fibroblasts and eosinophils with occasional mast cells. Both cats in this report also had diffusely thickened intestines, and jejunal biopsies that showed mucosal eosinophilic inflammation and smooth muscle hypertrophy. Whether eosinophilic sclerosing fibroplasia is initiated by the same process responsible for the development of the more common diffuse idiopathic EE is unknown. Both diseases can be responsive to corticosteroids suggesting an underlying immune disorder.
Few cats in this study had evidence of eosinophilic infiltration outside of the intestinal tract. No hepatic (11), pancreatic (3), splenic (3) or bone marrow (1) aspirate/biopsies had eosinophilic infiltrates, and no cats had hepatosplenomegaly. Thus, it appears that no cats in this study had hypereosinophilia syndrome, which is marked by infiltration of eosinophils in tissues outside of the GI tract, particularly the bone marrow, spleen and liver.4,5,6,17
Our study has several limitations. Only a single pathologist examined all the histopathological slides, and variability in the interpretation of endoscopic biopsies has been reported among pathologists. 36 However, scoring was performed according to WSAVA guidelines. Another limitation is that only 10/25 cats had full-thickness surgical biopsies, so our reliance on endoscopic biopsies could have led to false-negative diagnosis of a process that was confined to deeper layers of the intestinal tract. Few cats had multiple sites in the intestinal tract biopsied and as studies suggest that histopathological diagnosis can differ in different areas of the intestinal tract, it is possible that a different histopathological diagnosis may have been present in other parts of the intestinal tract. 24,37,38 Some cats had been on corticosteroids prior to evaluation, and this affected the clinical picture. Finally, parasitic disease was not definitively ruled out in all cases. Six cats did not have fecal evaluation or empiric deworming. The fact that these six cats were older cats confined to the house, and that 4/6 and 1/6 had a complete response to corticosteroids or an elimination diet, respectively, makes a diagnosis of parasitic disease unlikely.
Conclusions
This study identifies and describes a clinical entity of EE in cats with chronic GI signs. When compared with a population of cats with primary lymphoplasmacytic or lymphocytic IBD with subtle eosinophilic infiltrates, cats with EE are more likely to have intestinal wall thickening associated primarily with muscular thickening and peripheral eosinophilia. These findings may serve as potential biomarkers for the presence of EE in cats.
Footnotes
Conflict of interest
The authors do not have any potential conflicts of interest to declare.
Funding
This research received no grant from any funding agency in the public, commercial or not-for-profit sectors.