
Abstract
This retrospective study aimed to identify the most accurate formula for estimating the increase in packed cell volume (PCV) after whole blood transfusion of cats, as several formulae have been reported but not validated. Forty cats, of varying breeds and gender, were included from two referral institutions after database searches over a 13 year period. Five formulae were used to calculate an estimated post-transfusion PCV based on the re-working of formulae for determining the volume of donor blood to be transfused; three formulae were derived from those previously reported in the feline literature and two from human paediatric medicine, where a similar mean blood volume has been described. Cats were subdivided into two groups, the first consisting of 17 cats with non-regenerative anaemia and the second consisting of 23 cats with ongoing losses such as haemolysis and haemorrhage; it was hypothesised that formulae could be more accurate for group 1 cats, whereas formulae applied to group 2 cats could have overestimated the post-transfusion PCV. Bland–Altman analysis was performed for all cats to compare the actual increase in PCV with the calculated increase for the five formulae. Formula 1 (PCV % increase = volume of blood transfused in ml/2 × bodyweight in kg) performed best overall and is easy to calculate; however, no single formula was highly accurate at predicting the PCV increase after whole blood transfusion in cats and, owing to the wide confidence intervals, these formulae should be applied judiciously in the clinical setting.
Introduction
In the UK, feline blood transfusions are not routinely undertaken in practice as feline blood products are not commercially available and blood donor availability can be limited. Anaemia therefore represents a frequent reason for referral to specialist centres for blood transfusions to be performed.
Published transfusion formulae could be used to estimate the required volume of blood to reach a specified post-transfusion packed cell volume (PCV). However, as the volume of blood administered to feline recipients is often dictated by the volume obtained from the donor, these formulae are usually re-worked to estimate the expected post-transfusion PCV. Formulae are frequently based on the transfusion of packed red blood cells (pRBC) or canine whole blood (WB), with a higher PCV than is typical for cats, and might therefore not be appropriate for feline transfusion.1–5 Formulae that include the donor PCV and volume of blood transfused might be expected to be more accurate, as was identified recently in a canine study. 6
An accurate formula to estimate expected post-transfusion PCV could enable ongoing losses from haemolysis or haemorrhage to be more readily identified, as the post-transfusion PCV would be lower than expected. The aim of this retrospective study was to identify the most appropriate formula to use for estimating the post-transfusion PCV, with the hypotheses that current formulae used to predict the increase in PCV after blood transfusion tend to overestimate the expected value and that a formula incorporating the donor’s PCV could be more accurate than one that does not.
Materials and methods
Computerised databases at the University of Edinburgh Hospital for Small Animals (HFSA) and the University of Glasgow Small Animal Hospital (SAH) were searched for cats that had received WB transfusions between 1 January 2000 and 31 January 2013. These transfusions involved the collection and administration of fresh WB and were performed with a similar approach at both sites. Donor cats were acquired from registers of staff and client-owned cats between the age of 1 and 8 years. Donor cats were blood-typed and only type-compatible blood was administered to recipients. Blood was collected into 10 ml syringes containing citrate–phosphate–dextrose–adenine anticoagulant at a ratio of 1:9 with blood. A minimum donation volume of 10 ml/kg was aimed for, although, on occasion, this was not achieved owing to inadequate donor compliance.
Case records of transfusion recipients were retrieved and searched for patient signalment, weight, blood type (A, B or AB), cause of anaemia, pre- and post-transfusion PCV, volume of blood transfused (VT), donor PCV and transfusion duration. The cats were classified into two groups: group 1 comprised cats with non-regenerative anaemia that were unlikely to have acute changes in PCV; group 2 cats had ongoing blood loss from haemolysis or haemorrhage that might lead to a sub-optimal response to transfusion. Regeneration was defined as an appropriate reticulocyte count in the presence of severe anaemia or was determined by the blood smear examination findings of an experienced clinical pathologist. Attributing haemolysis as the cause of regenerative anaemia was based on a combination of findings, including the presence of red-coloured serum, icteric serum when hepatic and post-hepatic causes were excluded, positive in-saline agglutination or Coombs test results, and the lack of haemorrhage. The actual change in PCV (ΔPCV) was calculated by subtracting the pre-transfusion from the post-transfusion PCV.
Cases were excluded if any of the above data were missing, or if a PCV had not been performed within 12 h of the end of the transfusion; this time limit was arbitrarily chosen to ensure that ongoing blood loss would not excessively affect the post-transfusion PCV. Only the first transfusion, of cats receiving multiple transfusions, was included to exclude possible confounding factors such as delayed transfusion reactions.
Five formulae (Table 1) were used to calculate the expected increase in PCV for all cats. The first three formulae were derived from formulae published in the veterinary literature,5,7,8 whereas the fourth and fifth formulae were derived from formulae published in human paediatric literature.9,10
Formulae used to calculate expected packed cell volume (PCV) (%) post-transfusion and their derivations
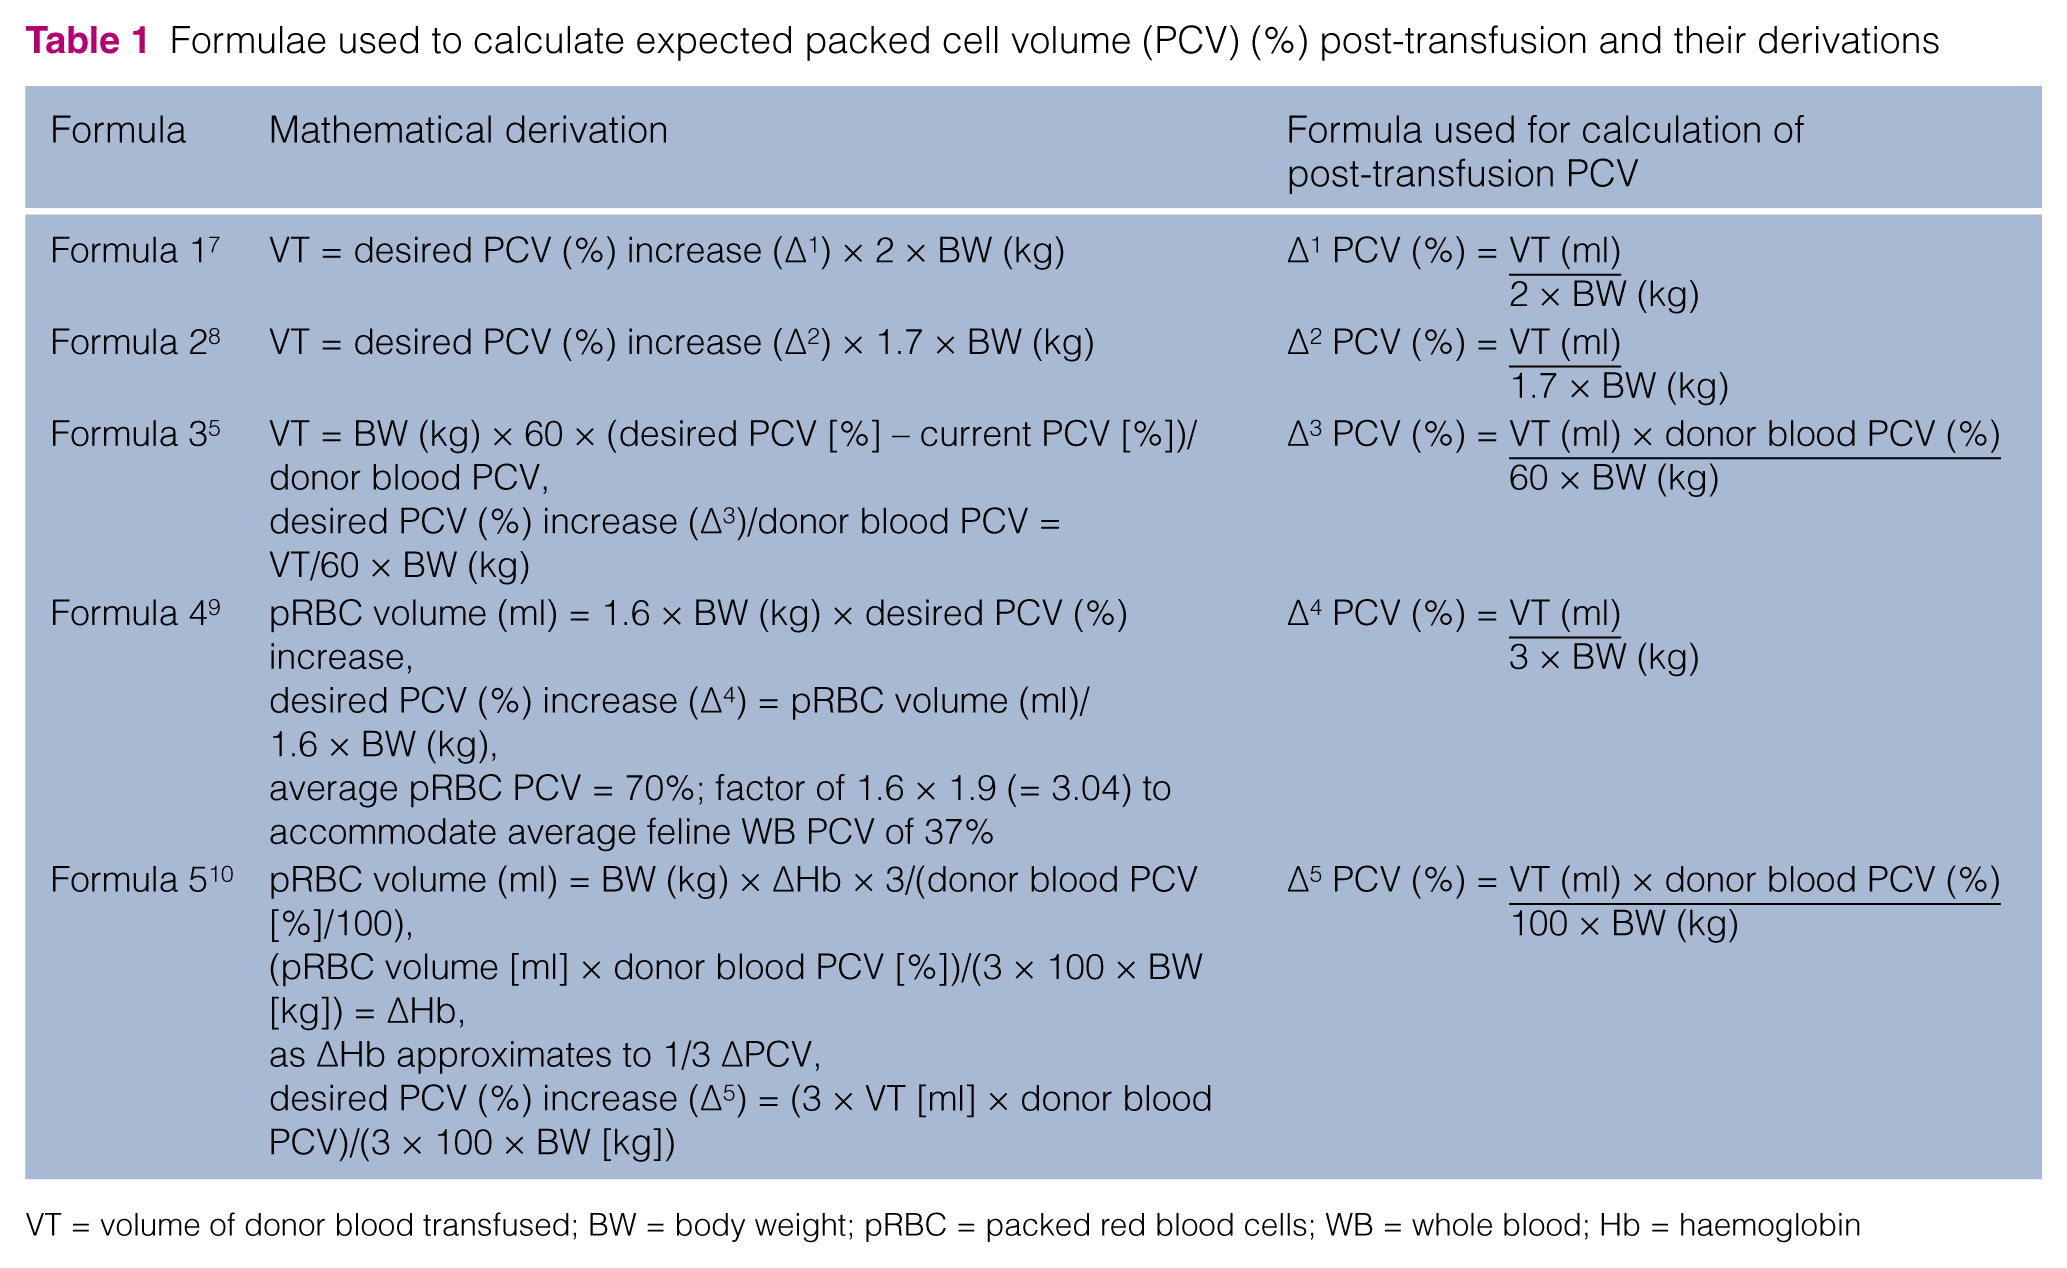
VT = volume of donor blood transfused; BW = body weight; pRBC = packed red blood cells; WB = whole blood; Hb = haemoglobin
Statistical analyses were performed using the commercial statistical package, Minitab 16. Descriptive statistics were performed for the whole population, and numbers were reported for categorical data. Quantitative data were assessed for normality using the Anderson–Darling test and summarised as mean (± SD) or median (range) as appropriate. Parametric data were compared by means of Student’s t-test to assess for differences between groups 1 and 2, whereas the Mann–Whitney U-test was used to compare non-parametric data. P values <0.05 were considered significant. Bland–Altman analysis was performed to compare the five formulae used to calculate the expected increase in PCV for the whole population, and then group 1 and group 2 cats separately. Bias was determined as the mean difference between the calculated increase and the actual increase. Limits of agreements (LOA) were determined by calculating mean ± 1.96 SD and indicated the 95% confidence intervals.
Results
The database search identified 49 feline blood transfusions from HFSA and 20 from SAH. Twenty-nine cases were subsequently excluded, leaving 40 transfusions in the study population. Two cats had received a second transfusion 5 and 7 days after the initial transfusion; only the data from the first transfusions were used. The remaining 27 cases were excluded as donor PCV had not been recorded; however, some cases had more than one reason for exclusion, including failure to measure post-transfusion PCV within 12 h (n = 9), failure to record VT (n = 3) or failure to record bodyweight (n = 2). Descriptive data of the 40 cats included are given in Table 2.
Descriptive data of the study population; results are reported as mean (± SD) or median (range) as appropriate

DSH = domestic shorthair; MC = Maine Coon; DLH = domestic longhair; BSH = British shorthair; MN = male neutered; ME = male entire; FN = female neutered; FE = female entire
Group 1 comprised 17 cats with non-regenerative anaemia due to bone marrow disorders (n = 10), such as myelodysplasia, bone marrow precursor immune-mediated haemolytic anaemia and aplastic anaemia; systemic neoplasia with or without bone marrow involvement (n = 5), such as lymphoma and disseminated histiocytic sarcoma and inflammatory or chronic disease (n = 4); chronic hepatopathy; and feline infectious peritonitis. Group 2 comprised 23 cats with ongoing blood loss due to immune-mediated haemolytic anaemia (n = 15), sepsis/disseminated intravascular coagulopathy (n = 5) or blood loss (n = 3).
PCV was measured within 1 h of transfusion in all cases except for five; these were assessed within 12 h. The method of PCV assessment (micro-haematocrit tube centrifugation or haematocrit) was not recorded in most cases. Transfusion duration was not recorded in nine cases, but these were not excluded as this was not a primary aim of the study. Transfusion data are given in Table 3.
Blood transfusion data for the study population with statistical comparisons between groups 1 and 2; results reported as mean (± SD) or median (range) as appropriate
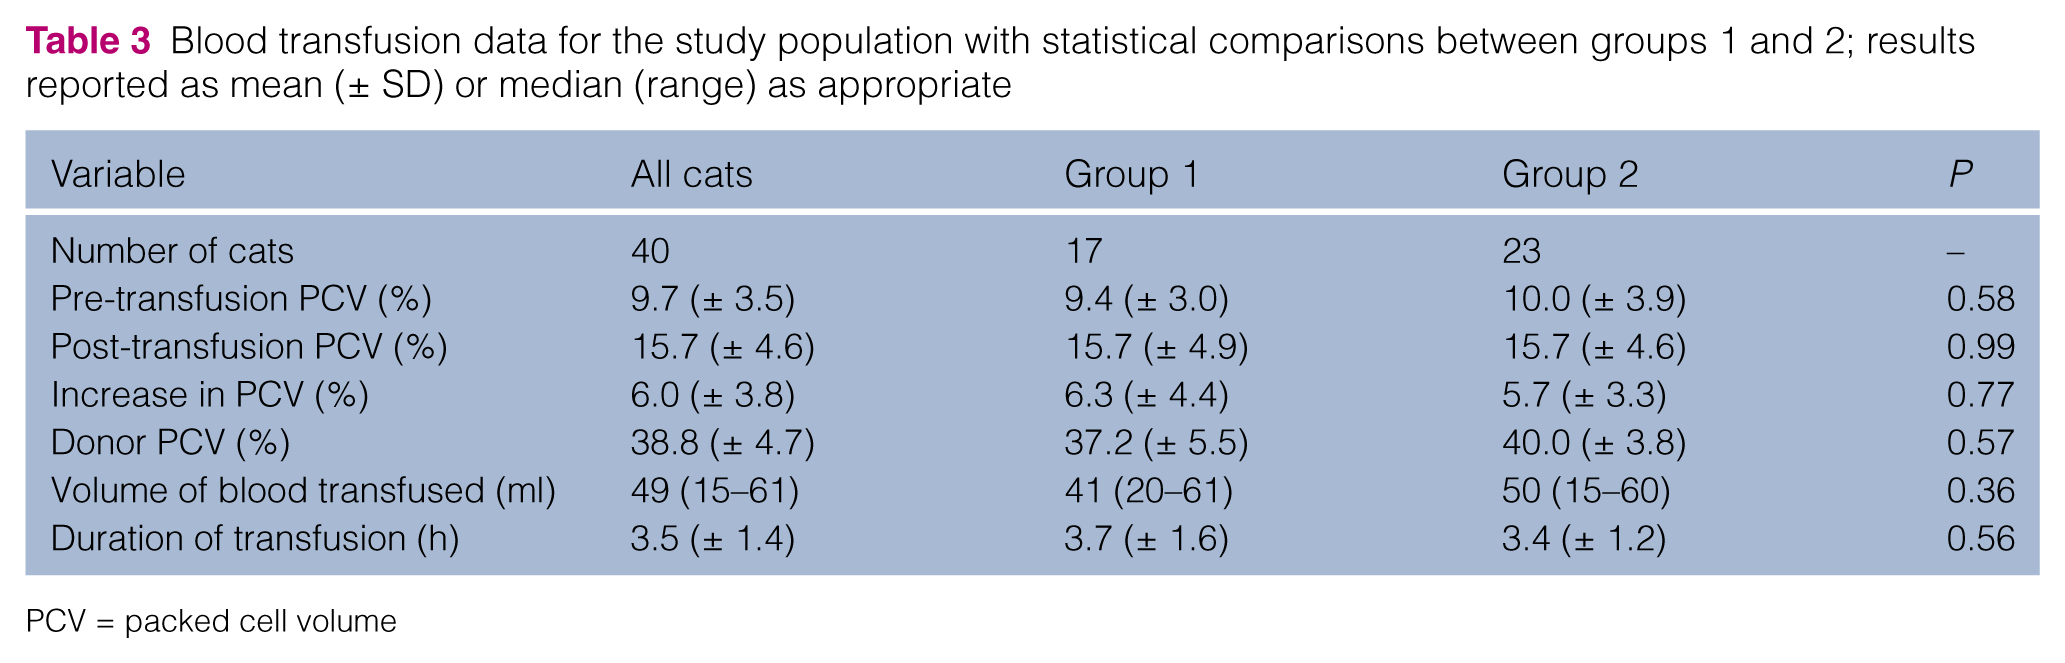
PCV = packed cell volume
There was no statistical difference between groups 1 and 2 for age (P = 0.92), weight (P = 0.40) or other transfusion variables as depicted in Table 3. No significant difference (P = 0.77) in the mean increase in PCV was found between group 1 (6.35%) and group 2 (5.74%) cats.
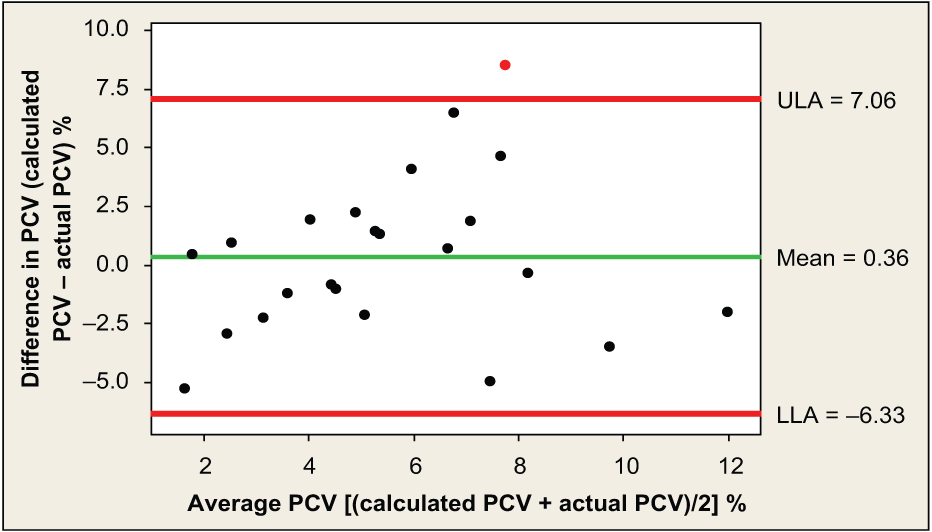
Results for the Bland–Altman analyses for the five formulae (Table 4) show that the formula with the lowest bias value for all 40 cats was formula 1 (Figure 1). Formula 1 also showed a low bias for group 1 cats (Figure 2). Formula 5 resulted in the lowest bias for group 2 cats (Figure 3).
Results of Bland–Altman analysis for formulae 1–5

LOA = limits of agreement

Bland–Altman plot for formula 1 applied to all 40 cats; the central horizontal line, or mean, represents the average agreement of the data or bias, and the other two horizontal lines, upper limit of agreement (ULA) and lower limit of agreement (LLA), represent the 95% confidence intervals. PCV = packed cell volume

Bland–Altman plot for formula 1 applied to group 1 cats; the central horizontal line, or mean, represents the average agreement of the data or bias, and the other two horizontal lines, upper limit of agreement (ULA) and lower limit of agreement (LLA), represent the 95% confidence intervals. PCV = packed cell volume
Bland–Altman plot for formula 5 applied to group 2 cats; the central horizontal line, or mean, represents the average agreement of the data or bias, and the other two horizontal lines, upper limit of agreement (ULA) and lower limit of agreement (LLA), represent the 95% confidence intervals. PCV = packed cell volume
Discussion
There are three formulae to estimate post-transfusion PCV commonly used in feline veterinary practice (formulae 1–3);5,7,8 however, to our knowledge there have been no previous studies to compare their accuracy. In canine transfusion medicine, several formulae also exist, which could reflect a lack of superiority of one formula over another.2–6,11 This is similar to the situation in human paediatric medicine, where several formulae are applied without having been clinically validated. 9
The hypothesis that commonly used veterinary formulae over-estimate the PCV actually attained post-transfusion was not supported. Although the Bland–Altman calculations identified low bias for some formulae, this merely reflected that cases where the PCV was over-estimated were balanced by cases where the PCV was underestimated, and this was consistent for both patients with non-regenerative anaemia and those with ongoing haemorrhage or haemolysis.
Cats were divided into two sub-populations as the formula applied to group 1 cats had the potential to be more accurate than when applied to group 2 cats in which ongoing losses were expected. Although the bias for formula 1 was low, the LOA could be considered quite wide for the clinical situation, with cats achieving 7–8% less or more than the calculated PCV. The bias and limits of agreement were larger for group 2 cats, where ongoing losses could account for lower values than predicted, and a marked regenerative response combined with termination of blood losses could account for higher values than predicted.
Formula 1 has previously been used in a study evaluating outcomes of feline WB transfusions. 12 Although Bland–Altman analysis was not performed in that study, the outcomes reported for use of this formula appear similar, in that the difference between the calculated and actual PCV obtained was −7.8 to 12.4% for cats with ineffective erythropoiesis, and −5.9 to 6.0% in cats with haemolytic anaemia, which is similar to the values obtained in the current study.
A formula that incorporates the PCV of the blood donor might be expected to be more accurate in predicting the post-transfusion PCV than a formula that does not, as was suggested in a recent canine study. 6 This hypothesis was not supported, however, with both a larger bias and wider LOA for formula 3 compared to formula 1, suggesting that an optimal formula is lacking at present. The denominator of 60 used in this formula is derived from the estimated feline blood volume,5,13 with this figure being replaced by 85 or 90 in the canine formula.5,6 This might not reflect the situation in feline transfusion patients that could be volume expanded, either from intravenous fluid therapy received prior to transfusion or from the transfusion itself in normovolaemic anaemic patients.
Veterinary formulae based on volume of pRBC transfused, without taking into account the PCV of the pRBC, were not considered likely to be useful in feline WB transfusions owing to the large difference in PCV of these components. Formulae from the human paediatric literature were therefore explored as these are calculated on a weight basis; the VT in adults is based on units of blood. In addition, neonates have been reported to have a mean blood volume of 70 ml/kg, similar to cats. 9 The human formulae did not, however, prove to be superior to formulae already available for cats.
Ideally, an accurate formula would allow identification of ongoing losses in patients that do not achieve the predicted rise in PCV. It was not possible to do this, and it was unexpected that the mean increase in PCV for group 2 cats was not statistically different from those in group 1. Cats in both groups attained higher and lower PCVs than predicted. Lower-than-predicted PCVs could be the result of unrecognised haemorrhage or haemolysis (eg, from a transfusion reaction), volume expansion through fluid therapy or laboratory error. Higher-than-predicted PCVs could be the result of a marked regenerative response, obesity leading to overestimation of recipient’s lean body weight or laboratory error. Sources of laboratory error could include under- or over-filling of the blood tube, inappropriate centrifugation of the micro-haematocrit tube (speed and duration) and variation in the technique used.
A limitation of this study is that the method used to assess the PCV was rarely recorded. It is possible that some cases had pre- and post-transfusion samples measured by different techniques (centrifugation of a micro-haematocrit tube or calculation of haematocrit from erythrocyte count and mean corpuscular volume), which could have led to errors.
Another limitation of the study is that PCV measurements were not taken at a consistent time after transfusion. One study in children suggested that there is little change in the haemoglobin value 1 and 7 h after transfusion, 10 whereas another study in neonates suggested that an accurate measurement can be obtained 15 mins after the end of the transfusion. 14 It is possible, however, that this might not be directly comparable to veterinary patients, as the potential for volume overload could be greater with WB administered to cats compared with pRBC transfusions administered to humans. As such, the PCV might not have attained its maximal value within the 12 h time-frame chosen for this study owing to ongoing removal of fluid from the vascular space. Patients could also have been volume-expanded as a result of prior fluid therapy, as this was not taken into account.
The small number of cases after exclusion is a further limitation, and that is why it was felt useful to evaluate the population as a whole, in addition to sub-dividing the population. However, it is the first study, to our knowledge, that has examined the accuracy of predicting response to whole blood transfusions in cats. Ideally, a prospective study should be performed in order that methodology and timing of PCV measurement is standardised and fluid therapy taken into account in inclusion criteria, which could allow a more accurate formula to be identified for predicting post-transfusion PCV.
Conclusions
No single formula was identified as being highly accurate at predicting the post-transfusion PCV in anaemic cats. Overall, formula 1 performed best, with low bias across groups, in addition to being easy to use. However, the actual PCV attained post-transfusion could be up to 8% more or less than expected.
Footnotes
Conflict of interest
The authors do not have any potential conflicts of interest to declare.
Funding
This research received no grant from any funding agency in the public, commercial or not-for-profit sectors.