
Abstract
Screening diabetic cats for feline hypersomatotropism (HS) is currently dependent on using a radioimmunoassay (RIA) for measurement of growth hormone or insulin-like growth factor 1 (IGF-1), both of which require radioactivity, are costly and have limited availability. Performance of an enzyme-linked immunosorbent assay (ELISA) using anti-human IGF-1 antibodies was assessed. Total IGF-1 was determined in diabetic cat samples across a wide range of IGF-concentrations using a previously validated RIA (serum: 92 cats; plasma: 31 cats). Repeat IGF-1 measurement was then performed using the ELISA-system. Mean IGF-1 recovery after serial dilution proved satisfactory with a correlation coefficient of 0.96 (serum) and 0.97 (plasma). Appropriate precision was established [intra-assay coefficient of variation (CV) 9.5 ± 2% (serum) and 13.6 ± 7% (plasma); inter-assay CV 11.4 ± 4% (serum) and 7.6 ± 6% (plasma)] and significant effect of hyperlipidaemia, haemoglobinaemia, bilirubinaemia and storage was excluded, with the exception of an increase in serum IGF-1 when left at room temperature for more than 24 h. ELISA concentrations correlated significantly with RIA concentrations (serum Pearson r2: 0.75; plasma: 0.83, P <0.001). Receiver operating characteristics analysis showed an area under the curve of 0.99 (serum) and 0.96 (plasma), and indicated high diagnostic accuracy for categorising a diabetic cat correctly as suspicious for HS at a serum IGF-1 cut-off of 997 ng/ml (sensitivity, 100%; specificity, 88.1%). The current study is the first to validate an easy-to-use and economical IGF-1 ELISA for the screening for HS among diabetic cats, which is important given the suspected significant prevalence of HS-induced diabetes mellitus.
Introduction
Hypersomatotropism (HS), which ultimately leads to the syndrome of acromegaly, is an endocrinopathy that has been suggested to be the underlying cause of diabetes mellitus in as many as 24–32% of diabetic cats.1–5 Current under-diagnosis of feline HS is partially owing to the fact that HS is not often overtly recognisable, as well as the fact that inexpensive diagnostic tools are not readily available to all clinicians dealing with diabetic cats.3,4 A diagnosis of HS is usually made on the basis of documenting an elevated growth hormone (GH) and/or insulin-like growth factor 1 (IGF-1) concentration using a radioimmunoassay system (RIA), followed by confirmation of a pituitary enlargement through intracranial imaging (magnetic resonance imaging or computed tomography).1,6,7 IGF-1 is considered by some a more reliable screening tool than GH (which is secreted in a pulsatile fashion in both the acromegalic and non-acromegalic state) as IGF-1 is not as easily influenced by factors such as food intake, exercise and stress, and it has a non-pulsatile secretion.1,8 IGF-1 reflects GH secretion over the previous 24 h.9,10 It can, nevertheless, be falsely elevated in regular diabetic cats or falsely decreased in diabetic cats with HS that have not been treated with insulin (yet) or that have received insulin only for a short period of time, as hepatic IGF-1 secretion is dependent on the presence of sufficient portal insulin.1,9–11 Nevertheless, considering the restricted availability of feline GH assays, the endocrine test of choice for feline HS is, for many, serum IGF-1.1,6,10
IGF-1 has a highly conserved structure across different species, which suggests that antibodies used in many assays developed for the measurement of IGF-1 in humans could also prove useful for its measurement in cats.9,10 However, in clinical practice measurement of feline IGF-1 currently relies fully on the use of RIA systems, which are suboptimal as screening tools, given the necessity for use of radioactive substances, restricted availability and relatively high associated costs. The objective of this study was therefore to assess the analytical and diagnostic performance of an enzyme-linked immunosorbent assay (ELISA) using anti-human IGF-1 antibodies for its potential as a screening tool for HS among diabetic cats. If proven robust, the ELISA could help reduce the current level of under-diagnosis of HS among diabetic cats and thus improve outcome in diagnosed cases.
Materials and methods
Sample collection, categorisation and employed assays
Residual serum and plasma [ethylenediamine tetra-acetic acid (EDTA)] samples were collected from diabetic cats undergoing glycaemic assessment. Informed consent for use of these residual samples was obtained from all owners in line with requirements from the local ethical approval committee. All samples were obtained after a 6–12 h fast and prior to insulin administration. Serum and plasma were separated through centrifugation at 2400 G for 5 mins and divided into aliquots prior to storage at –70 ºC until time of testing, except for stability studies.
In all samples total IGF-1 concentration was measured using a previously validated commercial RIA (CSLS). A cut-off of 1000 ng/ml has been shown to be suitable to indicate the likely presence of HS when employing this assay with a positive predictive value of 94%, and was therefore used in subsequent receiver operating characteristics (ROC) curve analysis.1–3 In total, serum samples of 92 diabetic cats and plasma samples of 31 of those 92 diabetic cats across a range of IGF-1 concentrations were selected for RIA and ELISA correlation studies, and ROC curve analysis.
Serum and plasma IGF-1 concentrations were then determined (in duplicate) using a quantitative sandwich enzyme assay employing anti-human IGF-1 antibodies (antibodies and all ELISA components obtained from Assay Pro as part of an ELISA-kit; catalogue number: EI 1001-1). In brief, a volume of 20 µl of serum or plasma was added to 60 µl of a pre-treatment buffer and incubated for 10 mins at room temperature (RT). A volume of 16 µl of the resulting 80 µl mix was transferred into 784 µl of a mix diluent solution. The final mix was vortexed and 50 µl was transferred into wells containing immobilised monoclonal anti-human IGF-1 antibody, followed by incubation for 2 h and thorough washing with an ELISA washing buffer solution. Biotinylated polyclonal antibody specific for human IGF-1 was subsequently added and left for 2 h with the aim of capturing any immobilised feline IGF-1, again followed by washing. A streptavidin–peroxidase enzyme substrate was added into each well in order to recognise the bound material and left for 30 mins; unbound enzyme was then washed away, followed by incubation with 50 µl chromogen substrate until maximal blue colour density was achieved. The reaction was then stopped by adding hydrochloric acid (0.5 N). The colour intensity was measured immediately at 450 nm (Bio-Tek EL808 8 channel absorbance reader). All steps were performed at RT. The mean value for each duplicate sample was used as the result and concentrations were determined by multiplying the concentrations obtained from intrapolation of the standard curve data points with the dilution factor. The standard curve was generated using provided human IGF-1 standards.
Assessment of analytical performance
ELISA precision was evaluated by calculating intra- and inter-assay coefficient of variation (CV), through measuring IGF-1 in serum and plasma samples from six different cats with high, medium and low IGF-1 concentrations eight times in the same ELISA run (intra-CV) or in three different consecutive ELISA runs (inter-CV). For the latter purpose sample aliquots were used to exclude an effect of multiple freeze–thaw cycles.
ELISA accuracy was evaluated by assessment of percentage of recovery and linearity on dilution. This was achieved by mixing two serum or plasma samples, one with a high and one with a low feline IGF-1 concentration, as well as through serial dilution of a serum and plasma pool with diluent. High and low IGF-1 samples were mixed in the following ratios: 100% + 0%, 75% + 25%, 50% + 50%, 25% + 75% and 0% + 100%. Recovery was expressed as percentage and was calculated by comparing the mathematically predicted values, derived from the original concentrations of the high and low IGF-1 sample, with the measured concentrations for each mixed sample. The detection limit was calculated as the mean of 20 determinations of the null-standard plus 3 SDs of these null-standard measurements. 12
The effects of delayed storage on IGF-1 concentrations were evaluated by dividing four serum and four plasma samples into three aliquots and leaving the aliquots in an air-conditioned room at RT, unopened and protected from direct sunlight for 24–48 h prior to freezing at –20°C until analysis. An immediately frozen aliquot (0 h) served as a reference sample. The effects of delayed storing and testing were described as individual and mean percentage alterations from the 0 h samples, and displayed in interferograms.
The effect of high lipid concentration was evaluated by adding a commercial fat solution to a feline serum pool (Intralipid 20%; Fresenius Kabi). The lipid solution was serially diluted with sample diluent buffer and added to a feline serum sample pool to create marked lipidaemia (10 and 2.5 g/l), moderate lipidaemia (1.25 and 0.625 g/l) and mild lipidaemia (0.3125 g/l) as described previously. 13 Similarly, the effect of haemolysis was evaluated by adding a freshly haemolysed stock solution with a haemoglobin concentration of 120 g/l to a feline serum sample pool (created through adding distilled water to packed feline red blood cells previously washed with 0.9% saline). The created concentration of haemoglobin in the serum samples corresponded to marked haemolysis (8 and 4 g/l), moderate haemolysis (2 and 1 g/l) and mild haemolysis (0.5 g/l). The haemoglobin concentration was determined using a Veterinary Blood Counter (Idexx Lasercyte; Idexx). Finally, the effect of hyperbilirubinaemia was evaluated by diluting 6 mg of bilirubin (Sigma Aldrich) in 1 ml of provided mix diluent solution. The bilirubin concentration in the analysed feline serum sample pool corresponded to marked bilirubinaemia (0.15 g/l and 0.075 g/l), moderate bilirubinaemia (0.037 g/l and 0.018 g/l) and mild bilirubinaemia (0.009 g/l).
Assessment of diagnostic performance
The diagnostic performance of the ELISA was assessed using ROC analysis to create a table of cut-off point-dependent sensitivity and specificity combinations, as well as through direct correlation with the RIA results.
Statistical methods
Linearity under dilution was assessed by ordinary linear regression analysis comparing measured and expected IGF-1 results. Pearson and Spearman correlation coefficients were calculated to assess the correspondence between ELISA and RIA results. The influence of hyperlipidaemia, bilirubinaemia, haemolysis and storage was assessed by constructing interferograms and by using one-way repeated measures analysis of variance and post hoc analysis using a paired sample t-test for each combination of two circumstances. Calculations were performed using the Statistical Package for the Social Sciences (SPSS, v 16; IBM) and Excel (Microsoft). The significance level used in the current studies was P <0.05.
Results
Assessment of analytical performance
Mean (± SD) recovery of IGF-1 when mixing high and low IGF-1 concentration proved 101 ± 14% (serum) and 94% ± 6% (plasma) (Table 1). Linearity under serial dilution of a serum and plasma pool was demonstrated with a correlation coefficient (r2) of 0.96 (serum) and 0.96 (plasma) (P <0.01) (Figure 1). Intra-assay CV proved 9.5 ± 2% (mean ± SD) (serum) and 13.6 ± 7% (plasma), while mean inter-assay CV proved 11.4 ± 4% (serum) and 7.6 ± 6% (plasma) (Table 2). The detection limit was 71 ng/ml. Hyperlipidaemia, haemoglobinaemia and bilirubinaemia caused minimal alterations in measured serum IGF-1 (8.5 ± 9%, 4.0 ± 9% and 7.1± 9%, respectively), which did not prove to be significant (Figure 2). Delayed analysis and storage at RT revealed no significant change occurring after storage of serum samples at RT for 24 h, although a significant increase in serum IGF-1 was detected after storage for 48 h (P = 0.003) (serum IGF-1 change compared with 0 h at 24 h: 10.1 ± 16%, 48 h: 54.3 ± 18%). No significant change occurred after storage of plasma samples at RT for 24 or 48 h (P = 0.23) (plasma IGF-1 change compared with 0 h at 24 h: 0.11 ± 11%, at 48 h: 9.2 ± 9.8%). The effect of delayed storage is shown in an interferogram (Figure 3).
Recovery expressed as percentage when mixing samples of high and low insulin-like growth factor-1 (IGF-1) concentration in different ratios
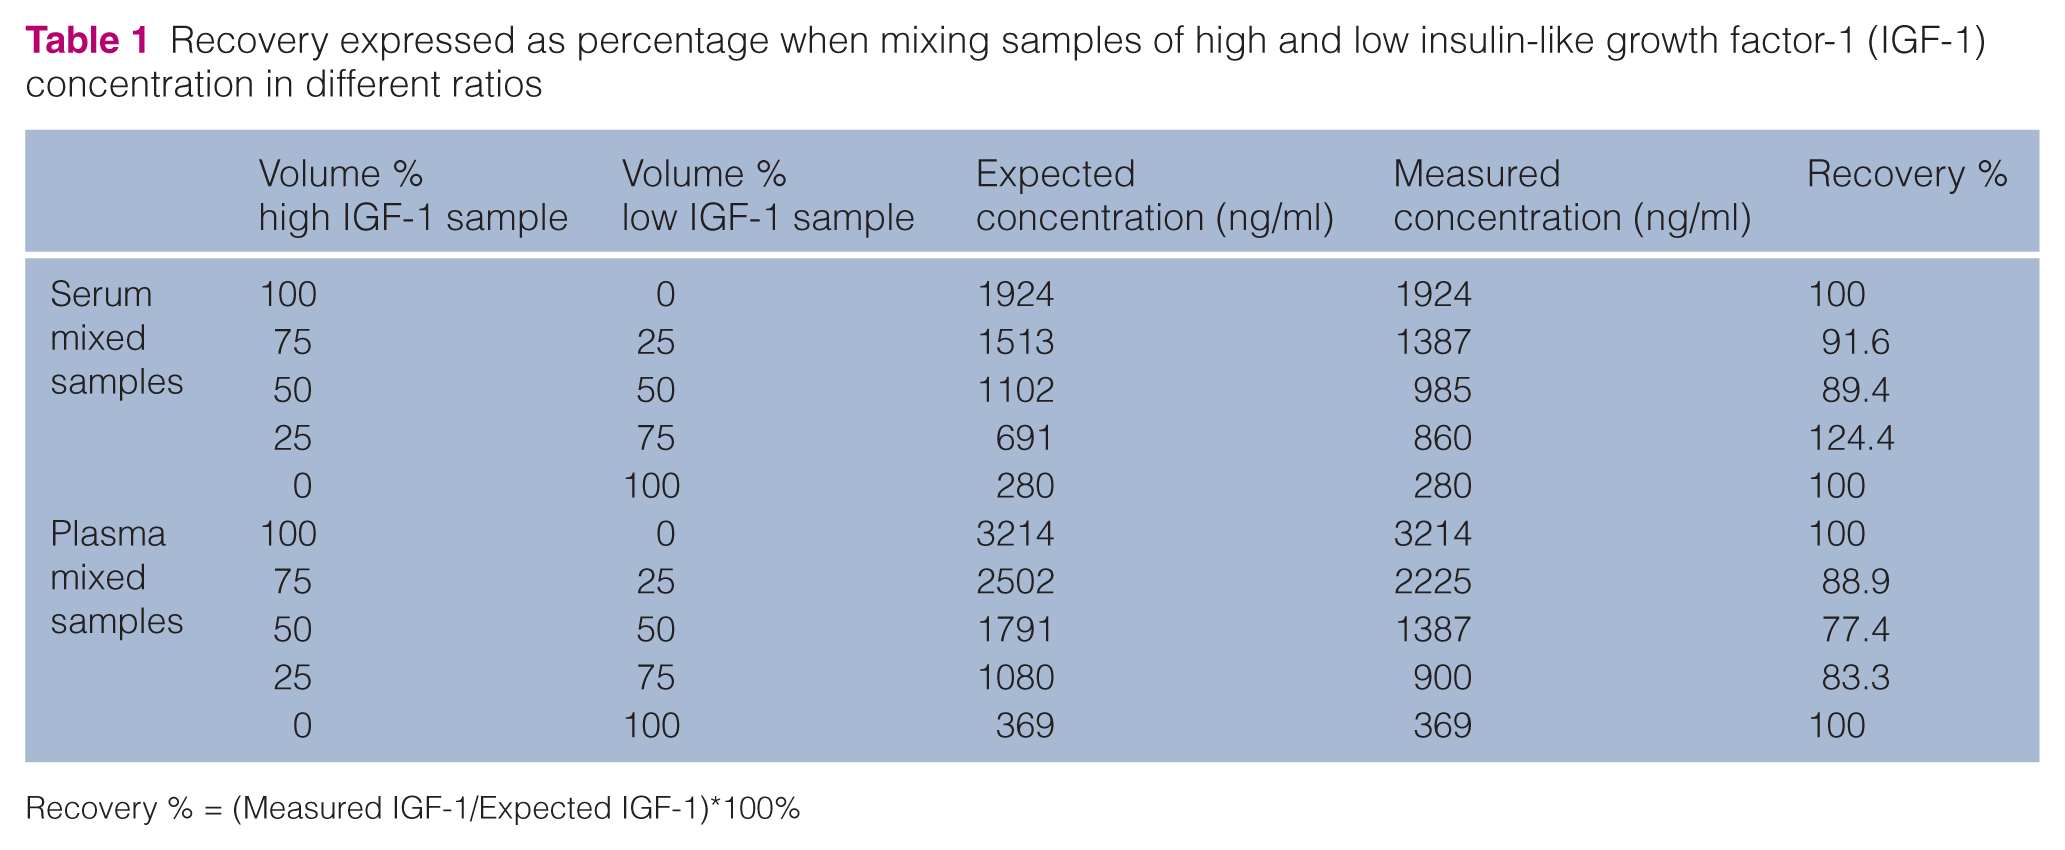
Recovery % = (Measured IGF-1/Expected IGF-1)*100%
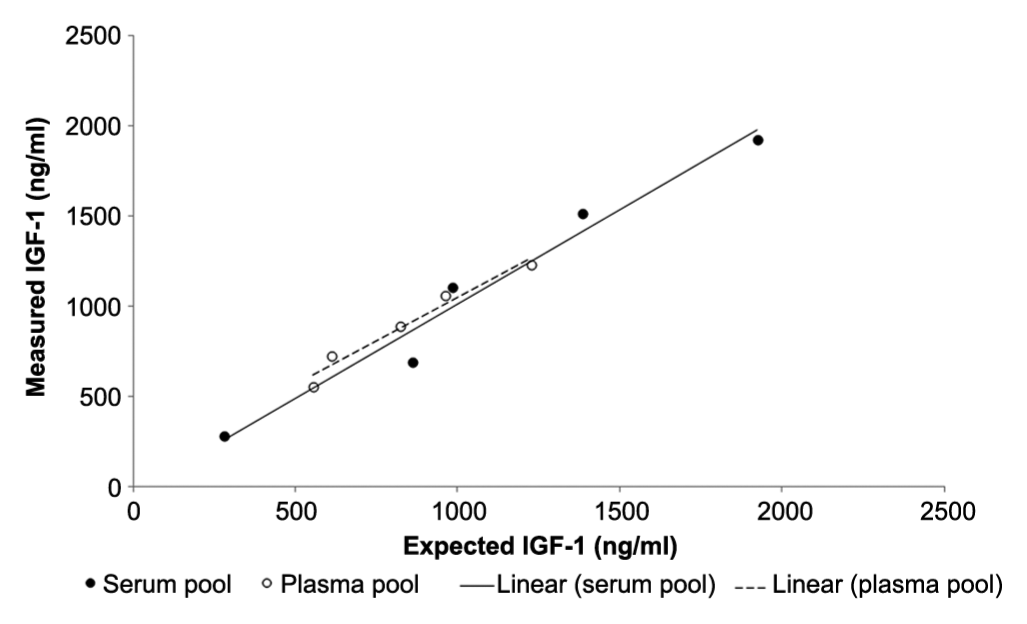
Linearity under dilution of serum and plasma pools of diabetic cats with hypersomatotropism was demonstrated with significant correlation coefficients (serum: 0.96; plasma: 0.97). IGF-1 = insulin-like growth factor 1
Intra- and inter-assay coefficient of variation (CV) of the insulin-like growth factor-1 (IGF-1) enzyme-linked immunosorbent assay established using high, medium and low IGF-1 concentration feline serum pools


Interferograms showing the effect exerted by increasing concentrations of (a) lipids, (b) haemoglobin and (c) bilirubin on the measurement of serum insulin-like growth factor-1 (IGF-1) in feline serum sample pools {y-axis: percentage of change in insulin-like growth factor-1 (IGF-1) [(Vmeasured/Vexpected)*100]}
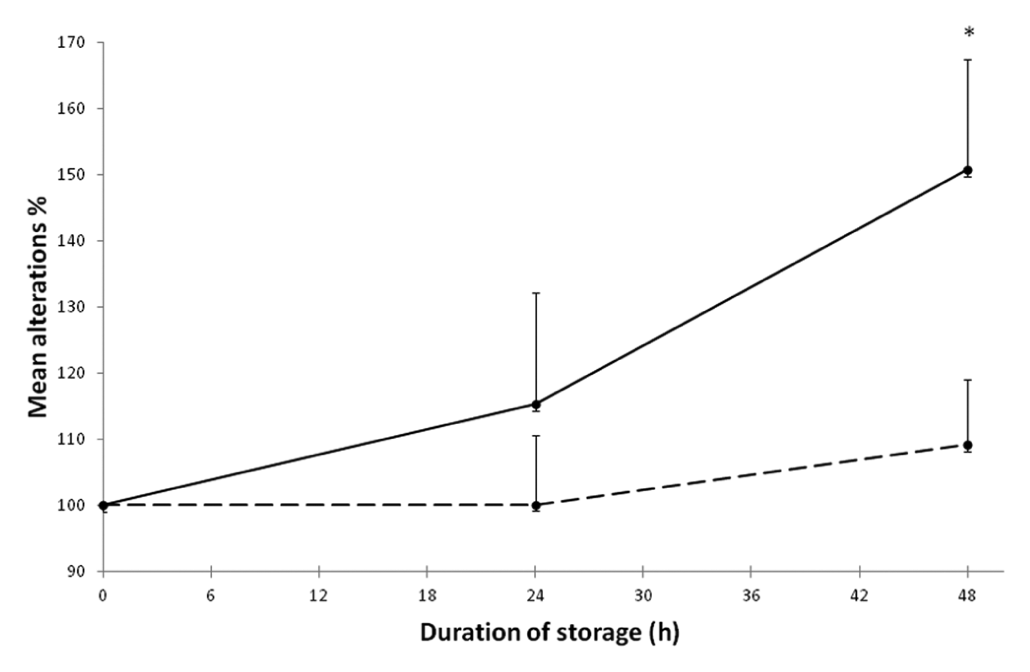
Interferogram depicting the mean effect of storage at room temperature on plasma (dotted line) and serum (continuous line) insulin-like growth factor-1 (IGF-1) concentrations (n = 4, error bars indicate SDs. *Significant difference, one-way repeated measures of analysis of variance and post hoc analysis with paired sample t-test, P <0.05)
Diagnostic performance
ROC analysis showed an area under the curve (AUC) of 0.99 for serum (Figure 4). A high diagnostic accuracy was demonstrated for a serum IGF-1 (ELISA) cut-off of 997 ng/ml when used as a screening test for presence of HS in the diabetic cat (sensitivity, 100%; specificity, 88.1%) (Table 3). The AUC was lower for plasma IGF-1 (0.93), though not significantly different (Figure 4). A reasonable diagnostic accuracy was also found for plasma IGF-1 (ELISA) at a cut-off of 1013 ng/ml (sensitivity, 100%; specificity, 72.2%). The results of a more detailed analysis and a range of possible cut-off points are shown in Table 3 for both serum and plasma IGF-1.

Receiver operating characteristic (ROC) curves for serum (top) and plasma (bottom) insulin-like growth factor-1 determined using the enzyme-linked immunosorbent system. The 45° diagonal line connecting (0,0) to (1,1) is the ROC curve corresponding to random chance. The ROC curve for the gold standard is the line connecting (0,0) to (0,1) and (0,1) to (1,1)
Additionally, concentrations determined via RIA correlated significantly with concentrations determined by ELISA with a Pearson’s and Spearman’s correlation coefficient (r2 or rho) of 0.75 and 0.84 (serum) and 0.83 and 0.87 (plasma), respectively (P <0.05; Figure 5).

In diabetic cats, insulin-like growth factor-1 (IGF-1) radioimmunoassay (RIA) results are shown to significantly correlate with IGF-1 enzyme-linked immunosorbent assay (ELISA) results, both for serum and plasma samples (Pearson’s r2: 0.75 for serum and 0.83 for plasma; Spearman’s rho 0.84 for serum and 0.87 for plasma; all P <0.001). Lines indicate trend lines
Discussion
This study demonstrates that the measurement of serum and plasma IGF-1 via ELISA is accurate, as well as precise, based on serial dilution, mixing of samples with high and low concentration, intra- and inter-assay CV calculation and determination of effect of hyperbilirubinaemia, hyperlipidaemia, haemolysis and delayed processing, as well as the detection limit. The dilution/spike recovery was demonstrated to fall largely between 80% and 120%, previously suggested to be appropriate with a mean of 101% (serum) and 94% (plasma).1,13 The mean intra- and inter-assay CV proved lower than 15%, which is considered to be a reliable level.12,13
The diagnostic performance was equally satisfactory with ROC curve analysis showing a high AUC. The AUC is an overall summary of diagnostic accuracy, with an AUC equaling 0.5 indicating the ROC curve corresponds to random chance and 1.0 indicating perfect accuracy. The current study demonstrated an AUC of 0.99 for serum and 0.93 for plasma, which is regarded as an indication of excellent diagnostic accuracy.14,15 It should, however, be noted that in a small minority of cases, given the lack of 100% agreement between RIA and ELISA results, a discrepancy in clinical interpretation can be encountered. Additionally, ROC curve analysis does depend on the accuracy of the gold standard diagnostic used to define the affected and unaffected group. For the purpose of this study, a serum IGF-1 of 1000 ng/ml measured using the currently recommended RIA was used to define the two groups. Previous experience has demonstrated the possibility of elevated serum IGF-1 (RIA) in a minority of non-acromegalic diabetic cats, as well as serum IGF-1 below 1000 ng/ml in a minority of acromegalic diabetic cats.1–3,9,11 Therefore, the currently employed RIA could yield false-positive and false-negative results when it is used as a sole diagnostic for HS in the diabetic cat. Nevertheless, the presence of HS has been shown to be very likely with an IGF-1 >1000 ng/ml, with a previously established positive predictive value of 94% for the presence of HS in the diabetic cat.1–3 Moreover, it should be emphasised that this study’s focus was on finding an ELISA that could form a safe and inexpensive alternative screening test to the RIA, rather than to further evaluate the concept of using IGF-1 assessment (be it through ELISA, RIA or other system) for diagnosis of HS. When finding an elevation of IGF-1 with either assay, it remains recommended to attempt to confirm the diagnosis of HS by performing pituitary imaging, also in light of the necessity of such imaging when contemplating radiotherapy or hypophysectomy as a treatment modality.
Screening for HS has been recommended on the basis of the suspected relatively high prevalence among diabetic cats, the variable and often subtle phenotype of cats suffering from HS, and the great effect on the choice of treatment and prognosis if HS is found to be underlying the diabetes in a cat. 3 Generally, screening tests are recommended to have a high sensitivity, with high-specificity tests more commonly used to rule diseases out. 16 Analysis of the ROC curves generated for serum and plasma samples therefore suggests the use of a cut-off of 997 ng/ml when using serum IGF-1 (ELISA) as a screening test for presence of HS in the diabetic cat (sensitivity, 100%; specificity, 88.1%) or a cut-off of 1013 ng/ml when using plasma IGF-1 (ELISA) (sensitivity, 100%; specificity, 72.2%). However, alternative cut-off points could be chosen to suit a different diagnostic purpose and the generated ROC data could be used in this process.
When an unfrozen sample can be guaranteed to arrive at the laboratory within 24 h of venepuncture (and when serum is immediately separated), it seems appropriate to choose serum IGF-1 measurement over plasma IGF-1 measurement when employing the assessed ELISA as the specificity is superior for serum IGF-1 than for plasma IGF-1 when a cut-off with a sensitivity of 100% is chosen. Nevertheless, it should be pointed out that fewer plasma samples than serum samples were assessed in the current study. Plasma IGF-1 might, however, be more stable than serum IGF-1 in an unfrozen sample and therefore preferable for use when the time for arrival at the laboratory is expected to exceed 24 h. Alternatively, samples could be transported in a frozen state. The progressive increase of serum IGF-1 might be owing to the fact that growth factors, including IGF-1, can be released during red blood cell and/or protein lysis. EDTA reduces the process of proteolysis and therefore could enhance sample stability. 17 Even in human endocrinology unsolved issues remain with the international standardisation of the different IGF-1 assays, and a consensus on sample collection and storage procedures for measurement of serum IGF-1 is currently lacking. 12 Increases of IGF-1 concentrations in serum samples have been reported previously in humans,17,18 although a different study suggested no major changes to occur in serum sampled from healthy patients when placed at either RT or 4°C for up to 96 h. 19 The data presented in this paper at least start to address some of the issues in feline endocrinology by providing detail on influence of sample and sampling conditions.
Tschuor et al 20 recently evaluated four different assays for measurement of plasma IGF-1 using samples of 39 healthy cats, seven cats with diabetes mellitus and 33 cats with other diseases (acid chromatography followed by RIA, acid–ethanol extraction followed by immunoradiometry assay, acidification followed by immunochemiluminescence assay and IGF-2 excess followed by RIA). Diabetic cats with HS were not assessed. Considerable variation in results of the same samples was found when comparing assays, emphasising caution should be exercised when comparing results generated employing different assays. The investigators did not validate the assays in terms of their suitability as a screening test for HS in diabetic cats, in contrast to the current study. Additionally, the results of the current study suggest that acidification, acid chromatography, acid–ethanol extraction and IGF-2 excess are not pre-requisites for determining blood IGF-1 with reasonable accuracy using the assessed IGF-1 ELISA system.
Conclusions
The current study validates the use of an economical and easy-to-use IGF-1 ELISA test for use as an HS screening test in diabetic cats, which showed good diagnostic accuracy when compared with the current gold standard IGF-1 RIA. This non-radioactive and more widely available assay could also aid investigations in the epidemiology of feline HS, experimental studies and research projects. Specifically, the assay might help further assess possible under-diagnosis of HS among diabetic cats, as well as help reduce it.
Footnotes
Acknowledgements
We would like to thank all the owners, cats and clinicians involved in the study, as well as the team members of the Clinical Investigations Centre and Diabetic and Acromegalic Cat Clinic at the Royal Veterinary College London.
Funding
The current study was, in part, funded by PetPlan Charitable Trust and a POSDRU grant (code CPP107-DMI1/5/S/77222).
Conflict of interest
The authors do not have any potential conflicts of interest to declare.