
Abstract
This case-controlled study evaluated urinalyses from 111 primary cases diagnosed with feline lower urinary tract disease (FLUTD) and 101 healthy control cats. Urine samples were analysed by standardised procedures, and differences between the two groups were compared by multivariable logistic regression analysis, while controlling for age, body weight, gender and reproductive status. Further, the ability of using urine sediment findings to predict bacteriuria was evaluated. In addition, urinalyses from cats with bacterial cystitis, idiopathic cystitis, urolithiasis and urethral plugs were compared. The main findings were that increasing body weight was significantly associated with increased odds of FLUTD, while the influence of age and reproductive status was of less importance. Increasing amounts of red blood cells and epithelial cells were significantly associated with increased odds of FLUTD. The predictive ability of using bacterial sediment findings to predict bacterial growth was dependent on subjective grading of the amount of bacteria in the sediment and was, at best, only moderate. The few significant differences found between the different FLUTD diagnoses were of limited diagnostic value.
Introduction
Feline lower urinary tract disease (FLUTD) is a term used to describe a variety of disorders characterised by clinical signs such as periuria, haematuria, dysuria, pollakiuria, stranguria and/or urinary obstruction.1–3 Thorough diagnostic investigation, including clinical examination, blood and urine analysis and radiological examinations, may result in determination of the aetio-pathogenesis in cases of FLUTD. 4 Commonly reported causes are urolithiasis and urethral plugs. Less frequently reported causes are infections, neoplasia, anatomical defects, behavioural problems or iatrogenic causes, such as cathetherisation.1–3,5 However, for a large proportion of the cases no specific cause is found; these cats are classified as having feline idiopathic cystitis (FIC).1,2,6
While the diagnostic tools available may vary in different veterinary practices, examination of urine samples from cats with signs of lower urinary tract disease (LUTD) by dipstick, refractometer and microscopy of urine sediment is commonly performed as part of the diagnostic investigation of these patients. Urine pH has been reported to play a role in the formation of urine crystals and uroliths, and an association between urine specific gravity (USG) and urinary tract infections (UTIs) has been reported in human, as well as, veterinary medicine.7–11 In addition to its importance in diagnosing crystalluria and in some cases substantiating the probability of uroliths, 11 the microscopic examination of the urine sediment has, to a certain extent, been considered useful for prediction of UTI.10,12–14 Both quantitative and qualitative bacteriology are needed in order to make a definite diagnosis of bacterial cystitis, 4 and these tests may be time consuming and present additional costs for the cat owners. Therefore, it would be valuable if screening by urinalysis and microscopic examination of sediment may aid in determining whether to perform bacteriology or not, and also whether to initiate antimicrobial treatments pending the bacteriological results. 14
Urine samples for urinalysis may be obtained by different sampling methods: voided midstream urine (spontaneously or by gentle manual compression of the urinary bladder), catheterisation or cystocentesis.4,15 The amount and composition of the urine sediment may vary according to the sampling method.4,16,17 Cystocentesis reduces the risk of sample contamination and is thus commonly considered as the method of choice for urine collection.18–20
Reference values for the parameters included in a standard urinalysis are described in the literature.4,17 However, differences in handling and storage of urine samples may influence urinalysis interpretation and be a source of misclassification, such as increased crystalluria due to prolonged storage or increased bacterial growth due to inappropriate storage time or temperature.4,21 In addition, variation in interobserver reliability of urine sediment interpretation has been shown to be relatively high. 22 Inclusion of samples from healthy control cats could, therefore, be useful in validation of urinalyses from LUTD cats, provided the same methodology and personnel are applied.
In the present study, urine samples obtained by cystocentesis from Norwegian cats with LUTD and a group of healthy control cats were investigated by standard urinalysis and bacterial culture. The aims of the study were to compare breed, age, gender, reproductive status, body weight and results from urinalyses among FLUTD cats and healthy control cats in order to identify predictors of FLUTD, and to investigate the diagnostic ability of bacterial sediment findings to predict bacteriuria after bacterial culture of the urine. Additionally, the results from urinalyses of cats with different FLUTD diagnoses (bacterial cystitis, FIC, urolithiasis or urinary plugs) were compared.
Materials and methods
Study population
The study population consisted of client-owned cats from Oslo and surrounding areas, presented to the clinic at the Small Animal Section, Norwegian School of Veterinary Science (NVH) from 2003 to 2009. If the owners’ informed consent was obtained, cats with clinical signs (dysuria, stranguria, haematuria, pollakiuria and/or periuria) and a final diagnosis consistent with FLUTD were eligible for inclusion as cases in the study. Exclusion criteria were treatment that could interfere with the diagnostics (antimicrobial medication, hormones, or medication altering blood pressure, urine production and/or composition) and concurrent diseases likely to be of influence on the urinary findings, such as chronic kidney disease, diabetes mellitus or hyperthyroidism. Only cats aged 7 months or older were included; no gender or breed restrictions were made.
The control cats were recruited in the same period of time among patients brought to the clinics for healthcare reasons, which required sedation or anaesthesia, and would not interfere with the urinalyses (castration, spaying, dental problems or minor surgery). With the exception of clinical signs and a diagnosis consistent with FLUTD, the cats in the healthy control group met the same inclusion and exclusion criteria. They had no known prior or present history of FLUTD or chronic diseases. Cats presented for neutering were classified as intact males or females.
Methods
The study was an analytic case-control study comparing FLUTD cats and healthy control cats. A standardised questionnaire was used to register age, breed, gender, reproductive status, body weight (BW), prior health history, and information concerning housing conditions and feeding regime for each cat. A veterinarian performed a complete and comparable clinical examination of all cats and blood samples for routine haematology, and clinical chemistry were collected. Abdominal radiography or ultrasound was included as part of the diagnostic investigation of all the FLUTD cats. Not all the information from the questionnaire and clinical investigation was used in the present study; an overview of the variables that were included is given in Table 1. Other aspects of the data obtained have been published previously for subsets of the cats included in the present study.15,20,23,24
Definition and description of variables included in a case-control study of urinalyses in cats diagnosed with feline lower urinary tract disease (FLUTD) (n = 111) and healthy control cats (n = 101) in Norway
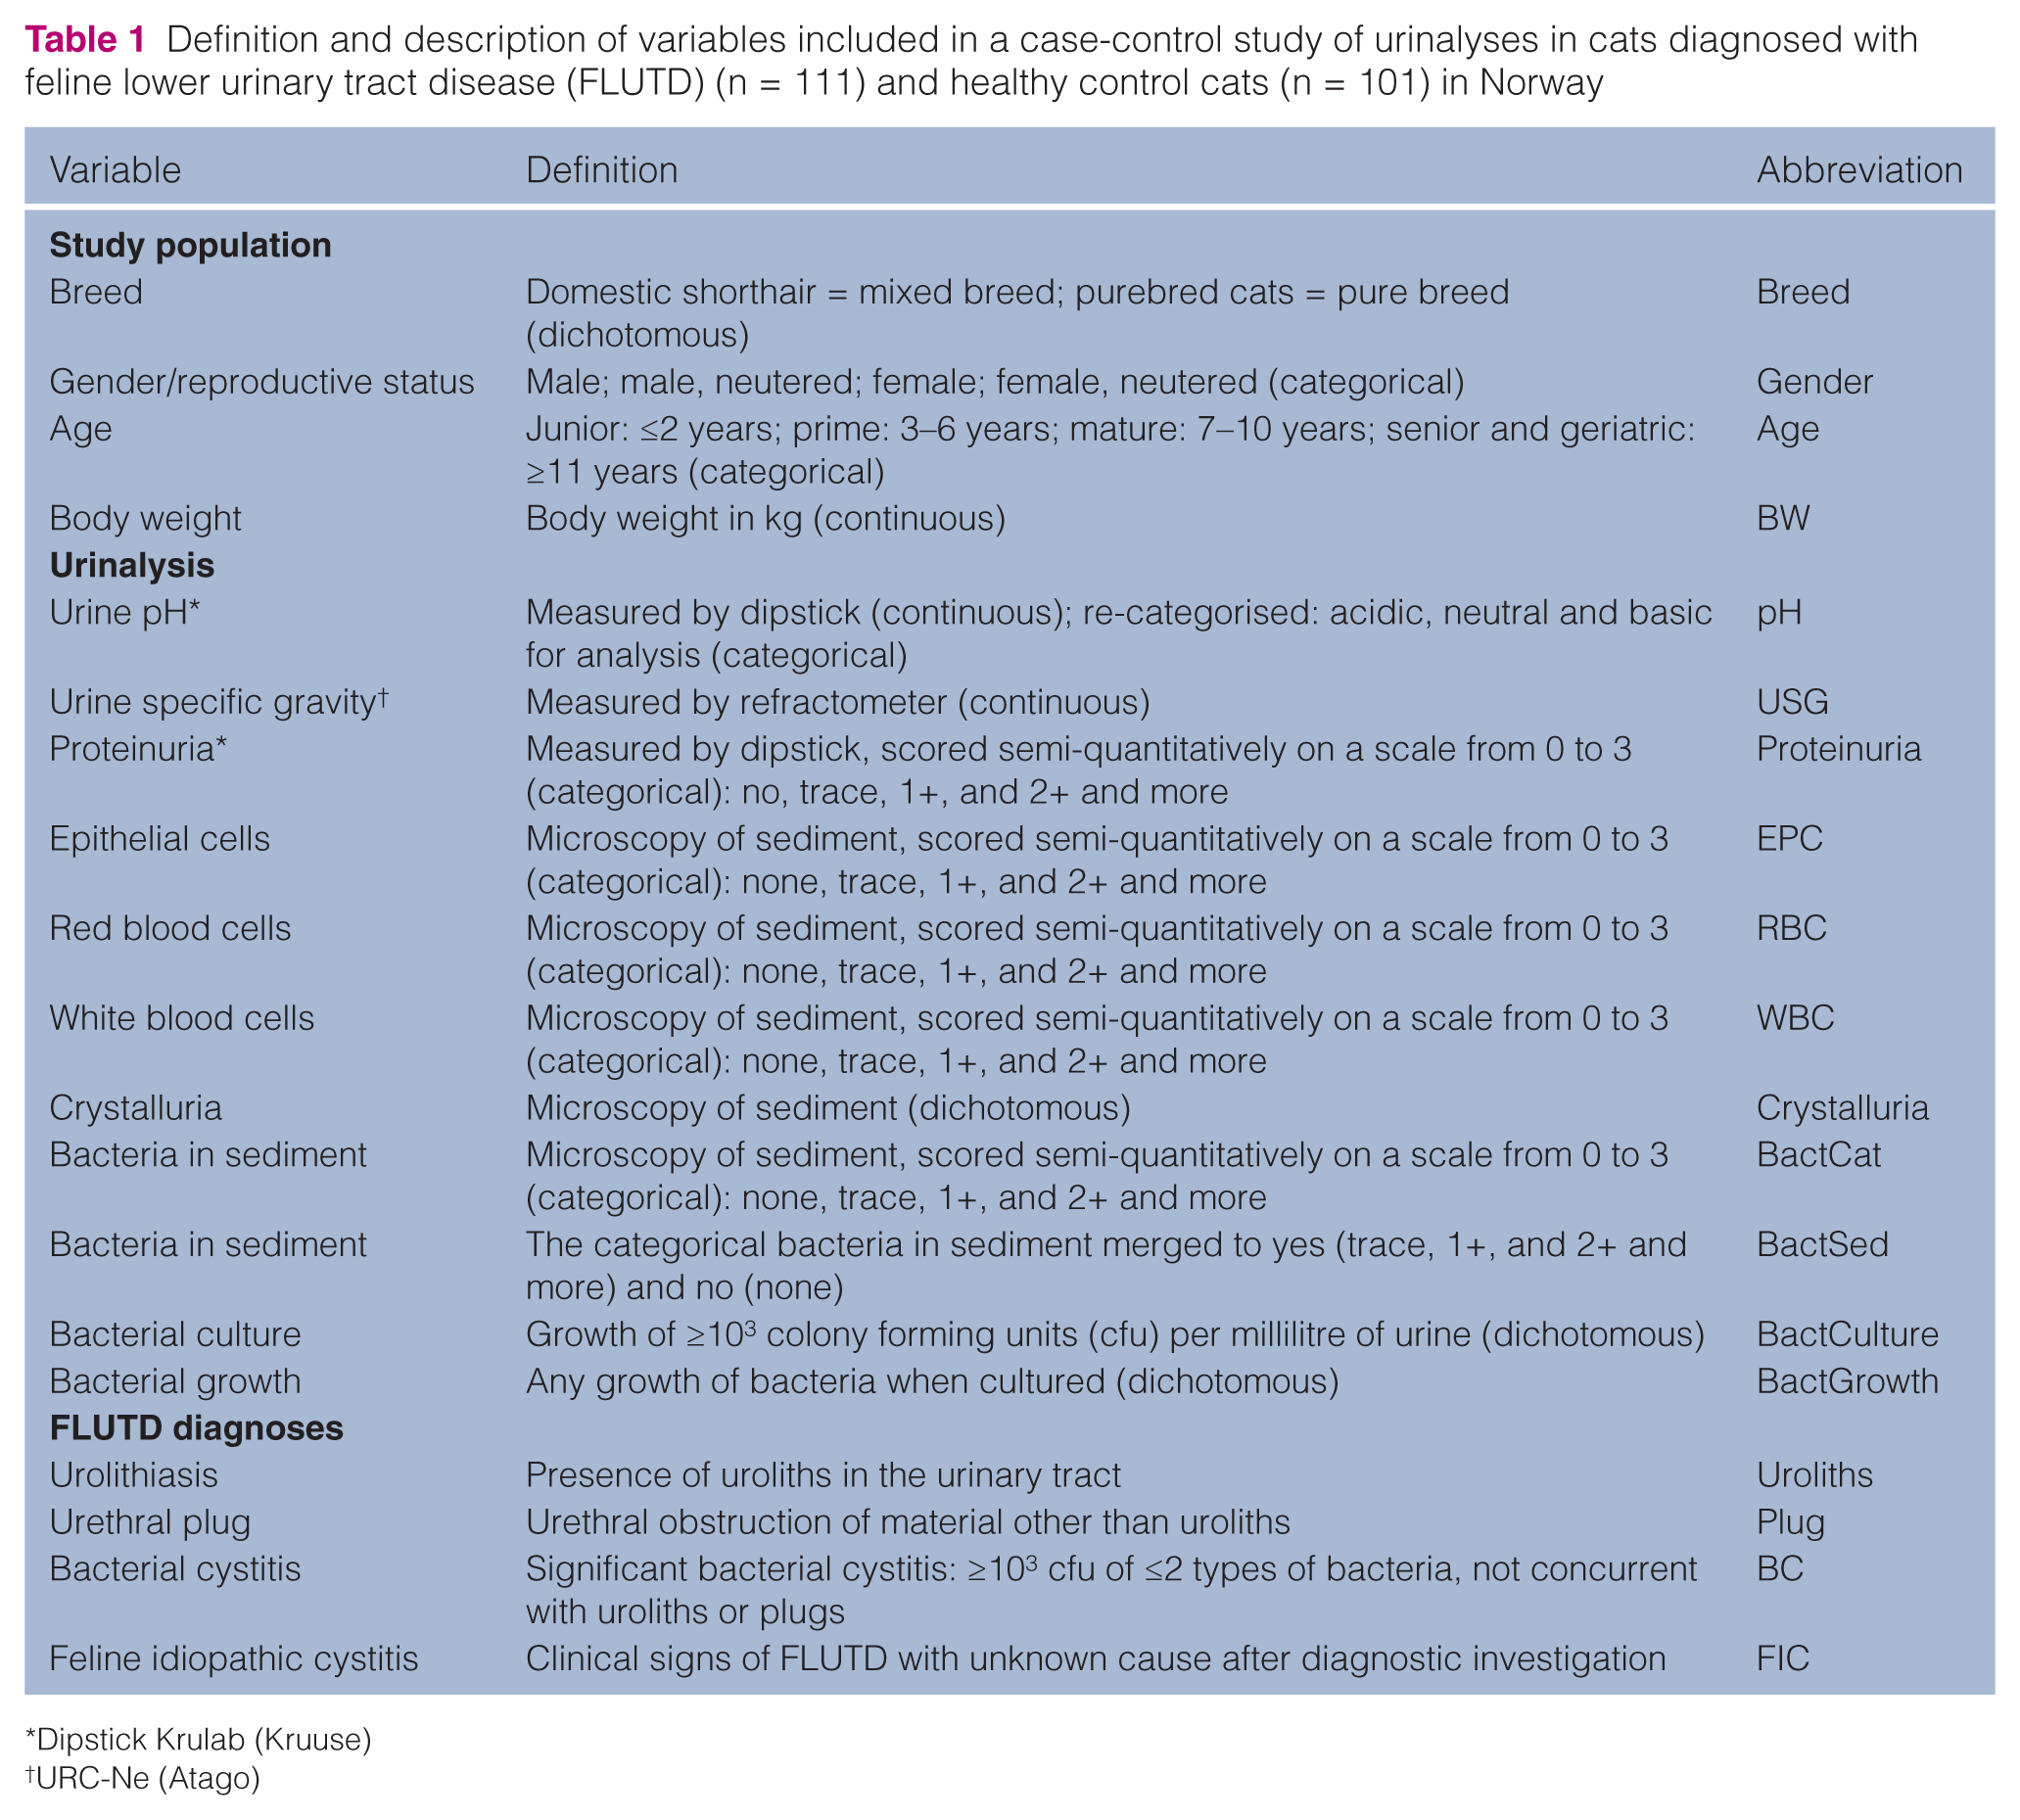
Dipstick Krulab (Kruuse)
URC-Ne (Atago)
All urine samples were obtained by cystocentesis. The cats were placed in dorsal recumbency and the skin clipped and prepared aseptically. A ventral midline approach was used, and cystocentesis was performed blindly or with ultrasound guidance with a 23 G needle attached to a 10 ml syringe. Standard urinalysis was performed, including commercial urine dipstick analysis (Krulab; Kruuse), USG measured with a refractometer (URC-Ne; Atago) and microscopic examination of the urine sediment. All urine samples were examined at the in-house laboratory at the Small Animal Section (NVH) by the same two technicians. The samples were examined at room temperature immediately after collection. After dipstick analysis and measurement of USG, approximately 10 ml of urine was centrifuged for 10 min at 450 × g (1500 rpm), and native wet samples and wet samples stained with Sternheimer-Malbins were examined by microscopy. The microscopy findings in the urine sediment; epithelial cells (EPC), red blood cells (RBC), white blood cells (WBC), crystals and bacteria (BactCat) were graded semi-quantitatively [crystals or cells/high power field (HPF)] by the two laboratory technicians on a scale from 0 to 5, developed at the laboratory. In the present study, grades 3–5 were merged into 3 (owing to few observations in each of these categories), giving a scale of 0 (not present), 1 (1–3/HPF), 2 (4–10/HPF) and 3 (>10/HPF). Bacteria in the sediment were also classified as 0 (not present) or 1 (present) (BactSed). Crystals were classified as 0 (not present) or 1 (present) (Table 1).
All urine samples were cultured on the day of collection. Quantitative bacteriology was performed by streaking 1 µl of urine onto blood agar (Blood Agar Base II; Difco), and qualitative bacteriology by cultivation on blood agar and selective bromo-thymol agar (Difco) from sediments after centrifugation, incubated at 37°C in a 5% carbon dioxide anaerobic atmosphere, and aerobically. While all bacterial growth was noted as bacteriuria (BactGrowth), only detection of ≥103 colony forming units of two types of bacteria or less was defined as bacterial cystitis (BactCulture) (Table 1).3,4,14
According to the results from the clinical examination and diagnostic investigation, cats with FLUTD were given the appropriate FLUTD diagnosis. Of the cats with significant bacterial growth on culture, only those that did not have concurrent urolithiasis or urinary plugs were given a diagnosis of bacterial cystitis (Table 1).
Statistical analyses
The software package Stata 12 was used for all analyses.
Descriptive statistics
All variables were described with count and percentages for categorical variables, and with mean and standard error for continuous variables, for both cases and controls. Histograms were included when considered appropriate.
Tabulation of categorical variables gave a cell frequency of five or less for several categories. Continuous variables were evaluated for normality by histograms. Fisher’s exact test and one-way analysis of variance was applied to evaluate if there were statistical significant differences in the urinary sediment findings different FLUTD diagnoses for categorical and continuous variables respectively.
Multivariable logistic regression analysis for prediction of FLUTD
The outcome variable for prediction of FLUTD by urine sediment findings was the dichotomous variable case-control status (FLUTD yes/no). The data were not matched during sampling, and logistic regression was considered appropriate for the analysis of urine sediment findings for prediction of FLUTD. The variables were first tested unconditionally with univariable logistic regression. Continuous variables were evaluated for linearity by lowess curves, and those showing a non-linear relationship with the outcome variable were categorised. Variables were then screened for co-linearity by pairwise correlations for continuous variables, and by Goodman and Kruskal’s gamma for dichotomous and ordinal variables. Associations of >0.7 or < –0.7 were considered to be evidence of co-linearity. The variables with a univariable P-value ≤0.20 from the likelihood ratio test (LRT) were selected for further multivariable analysis, provided that there was no co-linearity between them. When co-linearity was detected between two variables, the variable with the strongest univariable P-value and fewest missing data was selected.
A multivariable logistic regression model with outcome FLUTD yes/no was constructed by manual forward selection by offering variables selected from the univariable analyses one at a time to the model by ascending P-value. Variables were retained in the model when the P-value of the LRT was <0.05. Potential confounding and intervening variables were evaluated based on both a tentative causal diagram and changes in effects during model building. Changes in coefficients of >20% with the potential confounder present were also used as indication of confounding. A variable was considered to be intervening if adding it removed the effect of another variable and if the intervening variable lay on the causal path between the other variable and the outcome. Intervening variables were excluded from the final model. All possible two-way interactions between statistically significant variables in the model were tested by adding interaction terms to the model. Owing to the large number of interactions tested, a more restrictive P-value was applied, thus interaction terms were retained if the P-value of the LRT was <0.01. The Stata command lincom was used to conduct contrasts among categories of categorical variables.
Overall fit of the model was evaluated by the Hosmer-Lemeshow goodness of fit test. The predictive ability of the model was evaluated by constructing a receiver operating curve (ROC) and estimation of the area under the curve (ROC area). Outlying observations with influence on the model were assessed as described in the literature. 25
Using bacterial sediment findings to predict bacteriuria in FLUTD cases
BactGrowth from urine culture was considered the gold standard for bacteriuria. The ability to predict BactGrowth by detection of bacteria in the urine sediment (BactSed and BactCat) was evaluated. BactCat was tested for predictive ability at different thresholds on the semi-quantitative scale. BactSed was tested as a dichotomous variable. Sensitivity, specificity, ROC area, and positive and negative predictive values, as well as the likelihood ratio for a positive (LR+) and negative (LR–) test were estimated.
Results
Descriptive statistics
A total of 111 first-opinion cases with signs of LUTD were included in the study (FLUTD group). The controls consisted of 101 healthy cats (control group). Distributions of breed, gender, age and BW, as well as the USG and urine pH by case-control status are outlined in Table 2. Histograms presenting proteinuria, EPC, RBC, WBC, crystalluria and BactSed by case-control status are presented in Figure 1. The majority of the cats in both groups were domestic shorthair. Neutered males constituted the predominant gender in the FLUTD group, while the gender distribution was more even among the controls. On average, the FLUTD cats were older and had higher BWs compared with the controls (Table 2). Higher grades of the semi-quantitative measures of proteinuria, EPC, RBC, WBC and BactSed were seen among FLUTD cats, while crystalluria was more evenly distributed between the two groups (Figure 1).
Descriptive statistics for variables evaluated in a case-control study of urinalyses in cats diagnosed with feline lower urinary tract disease (FLUTD) (n = 111) and healthy control cats (n = 101) in Norway

SE = standard error; cfu = colony forming units
Urine samples with more than 103 cfu per millilitre urine
Urine samples with any growth of bacteria, not necessarily more than 103 cfu per millilitre urine

Histograms presenting the distribution of proteinuria, epithelial cells, red blood cells (RBC), white blood cells (WBC), crystalluria and bacteriuria, graded on a semi-quantitative scale, in urine samples from cats with feline lower urinary tract disease (FLUTD) (n = 111) and healthy control cats (n = 101) in Norway
Among the 111 cases of FLUTD, 59 (53%) were diagnosed as having FIC. Twenty-five (22%) cats were diagnosed with urethral plugs, 14 (13%) were diagnosed with bacterial cystitis and 13 (12%) were diagnosed with urolithiasis. Four of the cats with urolithiasis had concurrent bacterial cystitis. An overview of urinalysis results by the different FLUTD diagnoses is presented in Table 3. Significant differences between the different diagnoses were found for WBC and crystalluria.
Description of urine sediment findings in cats with feline idiopathic cystitis (FIC) (n = 59), urethral plugs (n = 25), bacterial cystitis (n = 14) and urolithiasis (n = 13) from a case-control study of urinalyses in cats diagnosed with feline lower urinary tract disease (FLUTD) (n = 111) in Norway

Dipstick Krulab (Kruuse)
Scored semi-quantitatively by microscopy of urine sediment
URC-Ne (Atago)
Prediction of FLUTD
Owing to fluid therapy prior to urine sampling for several of the cats, the urinalysis parameter USG was associated with quite extensive uncertainty and, therefore, omitted in the analyses of prediction of FLUTD by urinalyses findings. The following variables were screened unconditionally with logistic regression analyses: breed, gender, age, BW, pH, proteinuria, EPC, RBC, WBC, crystalluria, BactCat, BactSed and BactCulture. Results with odds ratios (OR), P-values and 95% confidence intervals (CI) from the univariable analyses are outlined in Table 4. After unconditional screening and evaluation of co-linearity, the following variables were evaluated as potential predictors in a multivariable logistic regression model: gender, age, BW, proteinuria, EPC, RBC, WBC, BactSed and BactCulture. The results with ORs, P-values and 95% CI from the final multivariable model for prediction of FLUTD are presented in Table 5. Gender and age were forced in as potential confounders. Although not statistically significant (P-value LRT = 0.12 ), neutered male and neutered female cats had a trend for increased odds of FLUTD compared with intact males. Age was not statistically significant (P-value LRT = 0.23), but compared with cats ≤2 years of age, the older age categories had a trend for a protective effect (Table 5). WBC was excluded as an intervening variable, while BW, EPC, RBC, BactSed and BactCulture were significantly associated with case status FLUTD. A 1 kg increase in BW gave an almost threefold increase in the odds of FLUTD, and the OR for BW increased by 0.10 for an increase in BW across the interquartile range ( 3.3–5.6 kg). Increasing semi-quantitative grade of EPC and RBC in the urine sediment significantly increased the odds of FLUTD (Table 5), and the LRTs for these variables were highly significant, with P-values of 0.009 and <0.001, respectively (Table 5). The presence of bacteria in the urine sediment (BactSed) and positive BactCulture also significantly increased the odds of FLUTD (Table 5). None of the tested interaction terms were statistically significant.
Results from univariable logistic regression analyses of variables evaluated in a case-control study of urinalyses in cats diagnosed with feline lower urinary tract disease (n = 111) and healthy control cats (n = 101) in Norway
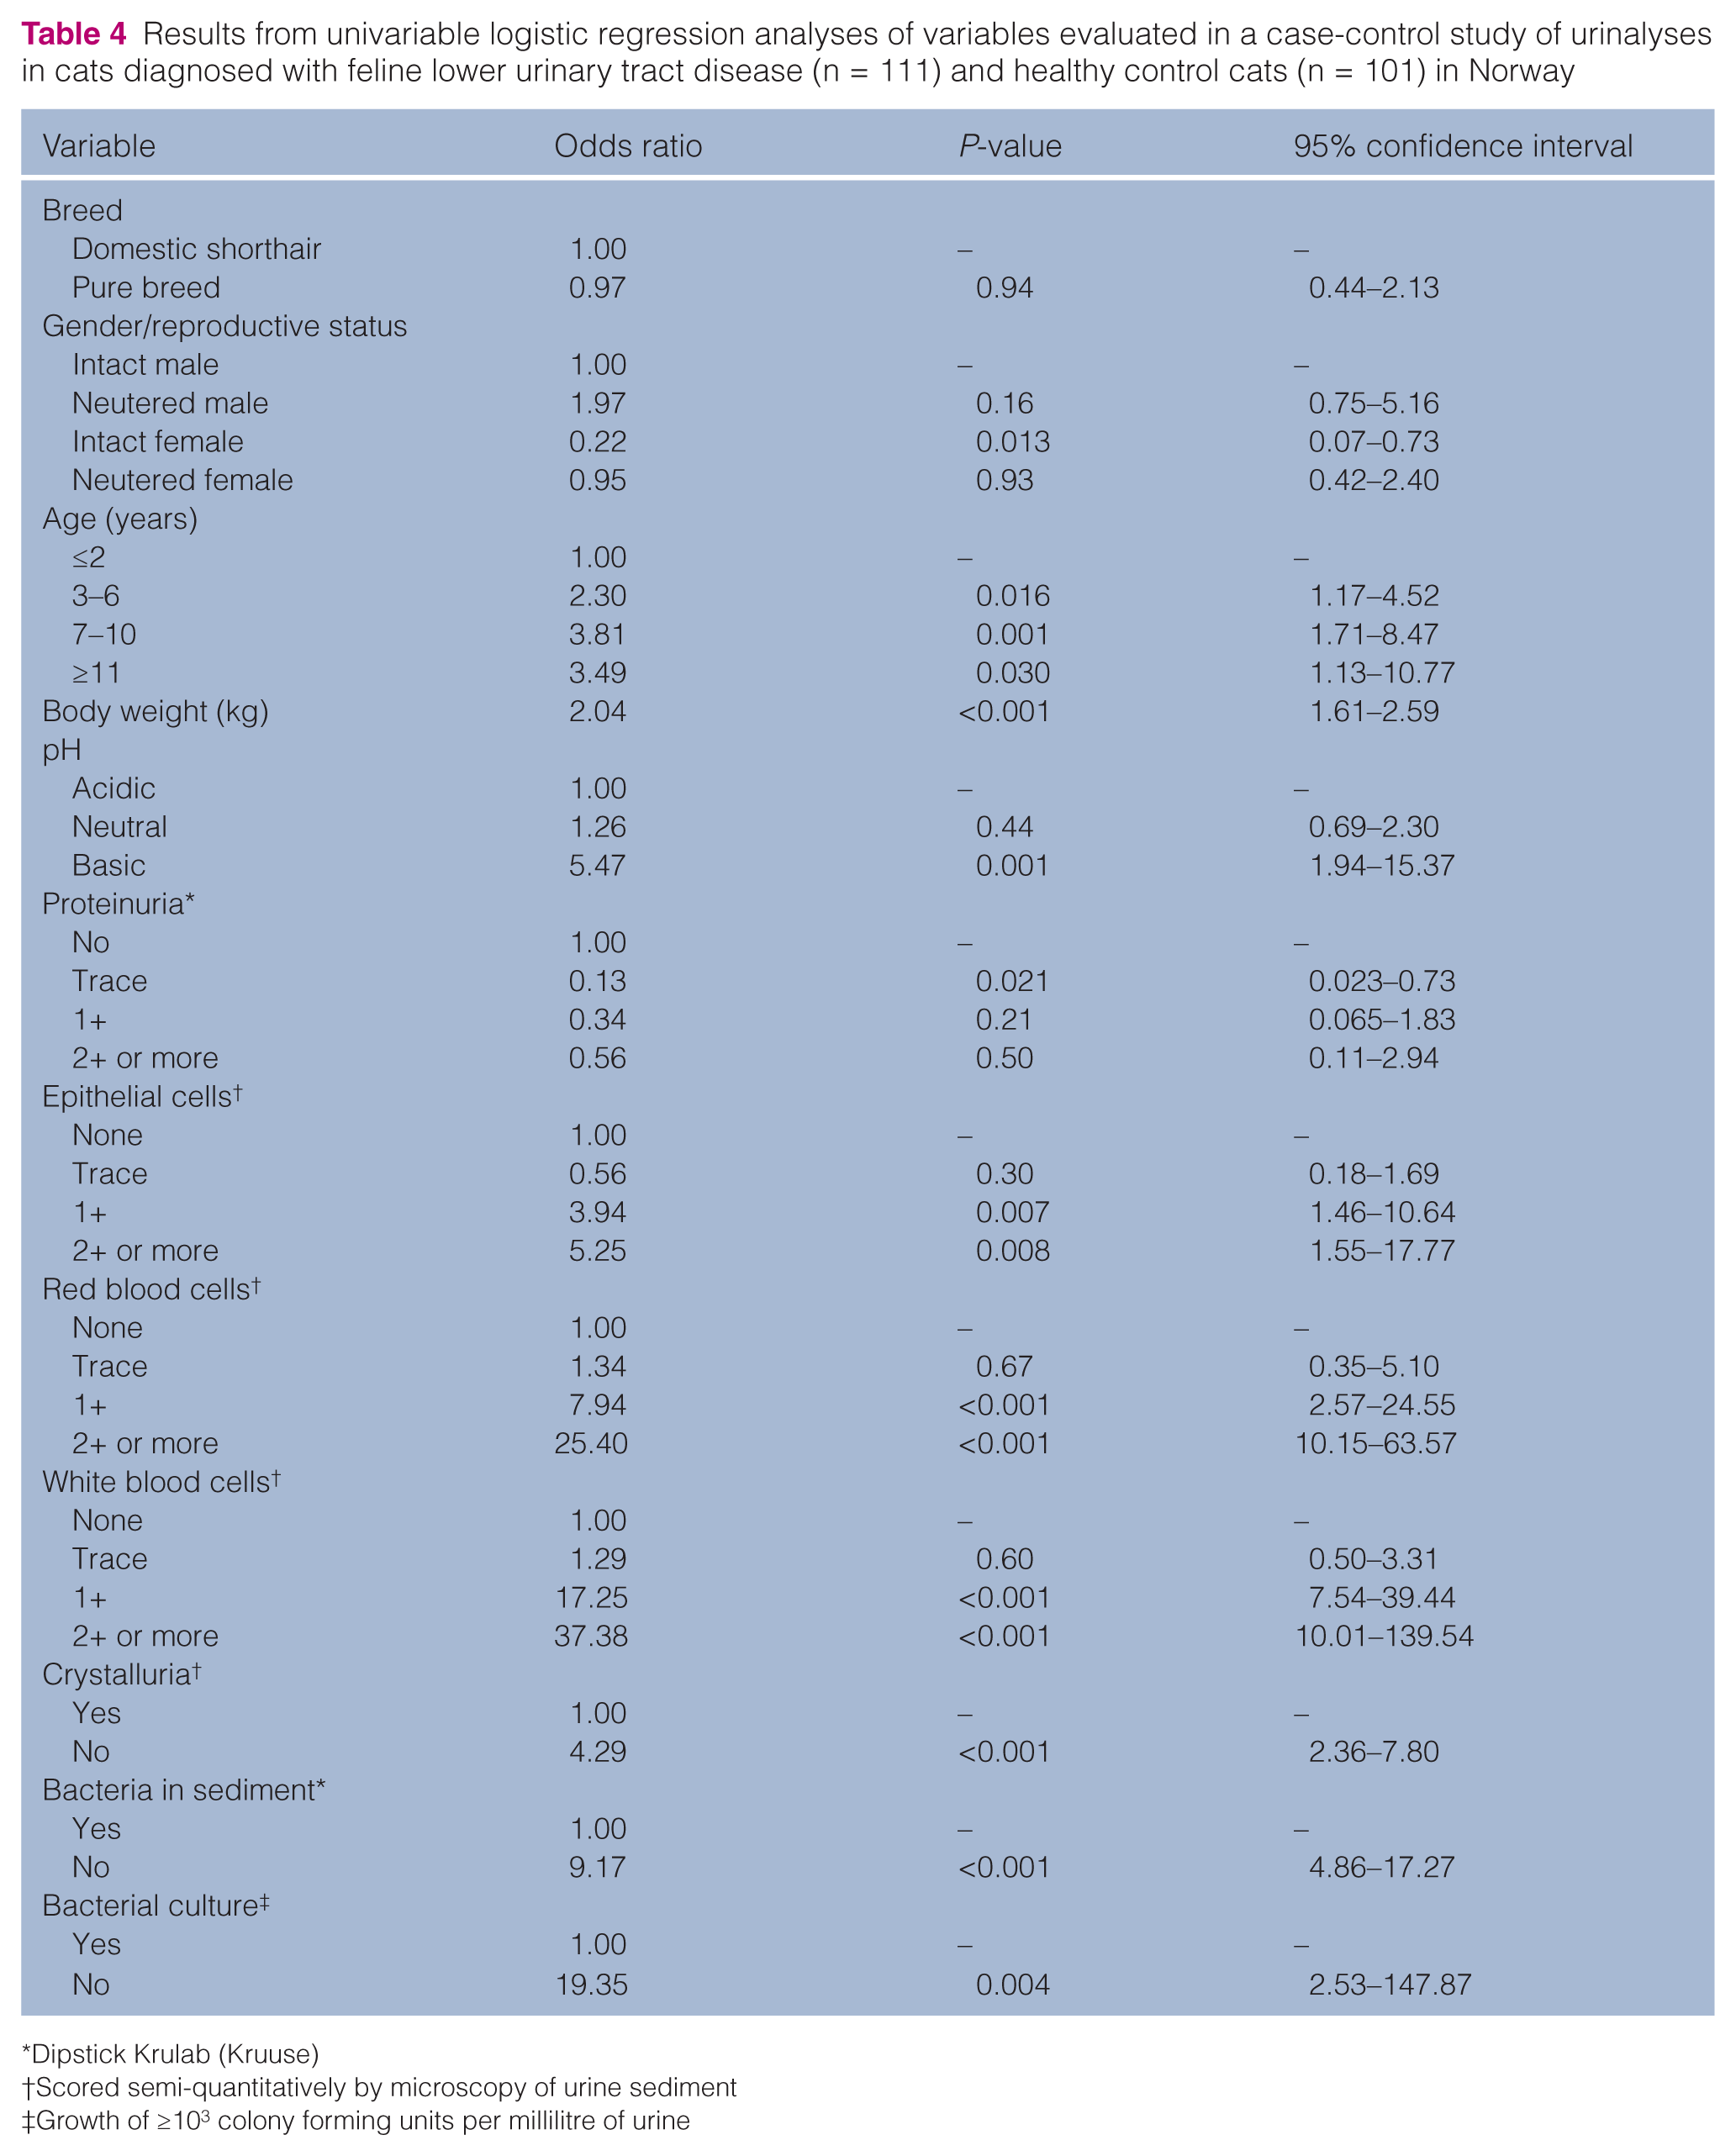
Dipstick Krulab (Kruuse)
Scored semi-quantitatively by microscopy of urine sediment
Growth of ≥103 colony forming units per millilitre of urine
Results from a multivariable logistic regression model of urine sediment variables predicting feline lower urinary tract disease (FLUTD) in a case-control study of urinalyses in cats diagnosed with FLUTD (n = 111) and healthy control cats (n = 101) in Norway

P-value from the likelihood ratio test of the variable
Scored semi-quantitatively by microscopy of urine sediment
Growth of ≥103 colony forming units per millilitre of urine
The Hosmer-Lemeshow goodness of fit test was not significant (P = 0.84), indicating no lack of fit. The ROC area was 0.9514, indicating that the model predicted FLUTD in 95% of cases.
Outlying observations with influence on the model were not found.
Prediction of bacteriuria in FLUTD cases
The ability of using urine sediment findings to predict bacteriuria is summarised in Table 6. Selecting the grade 3 (2+ or more of bacteria in the urine sediment) on the semi-quantitative scale for BactCat as the threshold for a positive finding of bacteria in the urine sediment of cats with FLUTD gave the best prediction of bacterial growth after culturing of urine. This gave a ROC area of 0.72, indicating that the test predicted correctly in 72% of cases. The variable BactSed (bacteria present or not present) predicted correctly in only 56% of cases.
The ability to predict bacterial growth in urine cultures by detection of bacteria in the urine sediment of cats diagnosed with feline lower urinary tract disease (n = 111) in Norway

ROC = receiver operator curve
Scored semi-quantitatively by microscopy of urine sediment
Discussion
Study population
In contrast to most previously published studies, which are commonly based on referred cases,2,26 the FLUTD cats in the present study were all primary accession cases. This provided an opportunity to examine untreated cases and include a variety of cases mirroring the situation in first-opinion veterinary practice.
There were some differences between the FLUTD group and the control group. Neutered male cats dominated the FLUTD group, but there was a more even distribution of gender and reproductive status among the control cats. In addition, the FLUTD cats were older and had higher mean BWs than the control cats. These differences may be explained by the fact that younger cats brought to the clinic for neutering constituted a considerable proportion of the control group. A more even distribution of age in the two groups may have yielded a non-significant result with regard to this parameter. However, age would, nevertheless, have been included in the analysis in order to control for the possible confounding effect.
FIC was the most common diagnosis among the FLUTD cats, which is in accordance with other studies.6,27–29 The proportion of cats with bacterial cystitis was larger compared with most previous studies regarding FLUTD.2,3,27 This may, as previously described by Eggertsdóttir et al,15,20 be explained by the inclusion of untreated primary accession cases. Further, it may indicate that bacterial cystitis is more common in some cat populations than previously assumed.
Risk factors for FLUTD and comparison of the different FLUTD diagnoses
Increasing age has been reported as a risk factor for developing bacterial cystitis in some studies,10,13,30 while other studies have reported that old age seems to reduce the likelihood of developing FLUTD.6,31 From the multivariable model in the present study, it appears that neither age nor gender and reproductive status were statistically significant risk factors for FLUTD, but these variables were included as confounders, influencing both the effects of other variables in the model and the risk of FLUTD. However, in accordance with the literature, a tendency of increased odds of FLUTD was found among neutered and middle-aged cats.
Increasing BW was significantly associated with FLUTD. While increasing BW has been reported in association with FLUTD in general,5,28,32 the opposite has been demonstrated among cats with bacterial cystitis.2,13 A possible explanation for the results in the present study might be that neutered and middle-aged cats are more likely to be overweight than younger, very old or sexually intact cats.
Among the urine sediment variables studied, EPC, RBC and BactSed were highly significant risk factors for FLUTD. The presence of EPC and RBC in urine sediment is associated with local tissue damage or inflammation, 4 and is, therefore, expected to occur in increasing amounts in cases of FLUTD. Further, the urine sampling procedure may induce bleeding or tissue damage. The effect of the sampling procedure is, perhaps, expected to be larger when the tissue of the organ to be sampled is already inflamed. Cystocentesis has been demonstrated to induce transient microscopic haematuria indistinguishable from pathological haematuria.4,33 Higher grades of EPC and RBC were found among all FLUTD cats, but the number of control cats with higher grades of RBC shows that the haematuria induced by the sampling procedure may vary, and the amount of RBC in the sediment is, therefore, not a reliable indicator of the severity of the disease. Further, excessive amounts of RBC in the urine sediment may mask other findings and lead to difficulties in sediment evaluation. 4 No significant differences were found with regard to RBC and EPC between the different FLUTD diagnoses.
Bacteriuria diagnosed through examination of the urine sediment (BactSed) was found to be an important risk factor in the present study. This can be explained by the fact that bacterial cystitis was a common diagnosis, accounting for almost 13% of the cases of FLUTD.
Previous studies have reached different conclusions with regard to WBC or pyuria as indicators of bacterial cystitis. While one study concluded that pyuria could not be considered a reliable indicator of bacteriuria, 14 other studies have found significantly higher amounts of WBC in the urine of cats with UTI and, hence, came to different conclusions.10,13 In the present study, WBC was omitted from the final multivariable model as an intervening variable. Although differences were observed between the different FLUTD diagnoses with regard to the amount of WBC, culturing of the urine based on the presence of higher grades of WBC in the urine alone does not seem warranted.
Deviations from normal USG have been discussed as potential risk factors for FLUTD and low USG has been proposed as a risk factor for bacterial cystitis. However, studies of both cats 10 and dogs 34 concluded that reduced USG alone did not merit urine culturing. High USG due to low water intake or stranguria has been reported in studies of FLUTD cats. 28 In the present study, mean USG was higher in the control group than the FLUTD group and, although not statistically significant, mean USG was higher among the FIC cats compared with the rest of the FLUTD group. USG was, however, omitted from the statistical model, as fluid therapy prior to urine sampling was found unavoidable for many of the FLUTD cats and thus the variable was associated with a substantial proportion of uncertainty.
The evaluation of the multivariable model revealed a good model fit, and a predictive ability of 95%. Thus, the variables included in this model can be considered reliable predictors for FLUTD.
Prediction of bacteriuria
Conclusions concerning the ability to predict bacterial growth in urine cultures based on evaluation of urine sediment vary in previously published studies in human, as well as veterinary, medicine. In studies of human patients, microscopy was considered useful in some studies,35,36 while others concluded that the method was, at best, only moderately helpful or inadequate.37,38 Similarly, veterinary researchers have found varying degrees of discordance when comparing results from urine sediment examination and urine cultures.2,10,14,39 In the present study, the selection of grade 3 (2+ or more) on the semi-quantitative scale as a threshold of positive bacteria findings in the sediment gave the best prediction of bacterial growth after culture; the prediction was correct in 72% of cases. This can, at best, be considered moderate and thus of limited value. Although the use of the BactSed (bacteria present/not present) variable gave an overall poorer prediction, fewer false-negative results were found. From a clinical perspective, neither of the two variables provide sufficient basis for determining whether to perform additional tests of the urine such as culturing, or whether to initiate antimicrobial treatment pending the results.
Among the cats classified with low grades of bacteria in the urine sediment, a substantial proportion (55%) were false-positives based on bacterial culture. This could indicate that the technicians interpreted other types of particles as bacteria when the presence of true bacteria was low or non-existent.
Whether or not positive bacterial culture should be considered as the gold standard for bacteria in the urine of cats can be questioned. In humans, urine with no bacterial growth by conventional culturing has been found to contain bacterial DNA. 40 Similar studies of FLUTD cats have yielded varying results.41,42 Thus, some of the cats classified as false-positive owing to negative results from culturing might be considered as true positives if bacterial DNA could be detected in the urine. However, the presence of bacterial DNA in the urine does not necessarily imply bacterial cystitis, and the findings should be related to clinical signs and the results from urinalyses. Further research is merited to establish the presence of bacterial DNA in the urine from cats with signs of urinary tract diseases, as well as from healthy cats.
Validity
All the cats in the present study were untreated primary cases of FLUTD and may, therefore, be considered a representative sample of FLUTD cats in Norway and other regions with similar cat management.
A potential shortcoming in the study is the use of a semi-quantitative scale for grading the sediment findings. Previous studies have concluded that the use of automated analyses may be more consistent than manual microscopy.12,34,43 A strength in the present study, however, is that only two technicians examined the samples; thus, the interobserver variation was reduced. 21
In a study comparing wet, unstained urine sediment with modified Wright staining of dried sediment, the authors found that the latter improved the predictability of bacterial growth considerably. 14 In the present study, the sediment was evaluated by examining wet samples stained with Sternheimer-Malbins, as well as unstained samples. This staining method has recently been discussed, as it may seem that only dead and not live (pathogenic) bacteria absorb the dye. 14 The influence of this on the present results is not evaluated thoroughly, but could potentially increase the number of false-negative samples.
Conclusions
The main findings in the present study were that increasing body weight was significantly associated with FLUTD, while the influence of age and reproductive status was of less importance. Increasing amounts of RBC and EPC in urine were significantly associated with increased odds of FLUTD. The few significant differences between the urinalyses from different FLUTD diagnoses were of limited diagnostic value, and the predictive ability of using bacterial sediment findings to predict bacterial growth was dependent on subjective grading of amount of bacteria in the sediment and, at best, only moderate.
Footnotes
Acknowledgements
We would like to thank the veterinarians and veterinary nurses at the Department of Companion Animal Clinical Sciences for their help and assistance in collecting the material.
Funding
This work was supported by two not-for-profit foundations: Astri and Birger Torsted’s Foundation and Veterinary Smidt’s Foundation.
Conflict of interest
The authors do not have any potential conflicts of interest to declare.