
Abstract
Measurement of feline coronavirus (FCoV) antibody titres is utilised mainly for diagnosing feline infectious peritonitis (FIP) and for quarantine purposes. However, occasional samples show a falsely low or negative FCoV antibody test. We tested the hypothesis that such results are due to virus in the sample binding antibody and rendering it unavailable to antigen in the test. Thirteen effusions, one plasma and three undefined samples from cats with FIP, which gave unexpectedly low FCoV antibody titres, were examined by real-time reverse transcriptase polymerase chain reaction (RT-PCR). Increasing amounts of virus correlated with lower signals in indirect immunoflourescent, enzyme-linked immunosorbent asssay and rapid immunomigration antibody tests. However, five samples were negative by RT-PCR, so the presence of virus alone may not explain all cases of false-negative FCoV antibody tests, although it is a possible explanation in 71% of discordant samples. We conclude that falsely low or negative FCoV antibody tests can occur in samples rich in virus.
Introduction
Feline coronavirus (FCoV) is a positive-stranded RNA virus with tropism for the epithelial cells of the gut and monocytes/macrophages.1,2 Most FCoV-infected cats remain asymptomatic, but up to 10% develop a perivascular pyogranulomatosis known as feline infectious peritonitis (FIP).1,2 Diagnosis of FIP is complex. Use of FCoV serology in FIP diagnosis is controversial: one of the objections sometimes raised is that occasionally there are samples from cats with FIP which appear to give low, or even negative, results in antibody tests. As FIP is an immune-mediated disease in which antibodies are believed to be essential in the aetiology, seronegativity appears to be incongruous. Previously, we hypothesised that such samples actually contained much antibody, but it was bound to virus, or viral antigens, and therefore unavailable to bind to antigen in FCoV serological tests (Figure 1). In a previous study, we precipitated the immune complexes with 6% polyethylene glycol, ultracentrifuged the pellet through a 40% sucrose pad, ran the pellet on polacrylamide gel electrorphoresis, made an immunoblot and showed the presence of FCoV using a polyclonal antibody, 3 a lengthy and complex process. The development of quantitative reverse-transcriptase polymerase chain reaction (RT-qPCR) tests to determine the amount of FCoV RNA present 4 enabled the testing of this hypothesis by comparing the amounts of virus in these curious samples. We demonstrated a trend in that the greater the amount of virus in these samples, the lesser the signal on FCoV antibody tests.
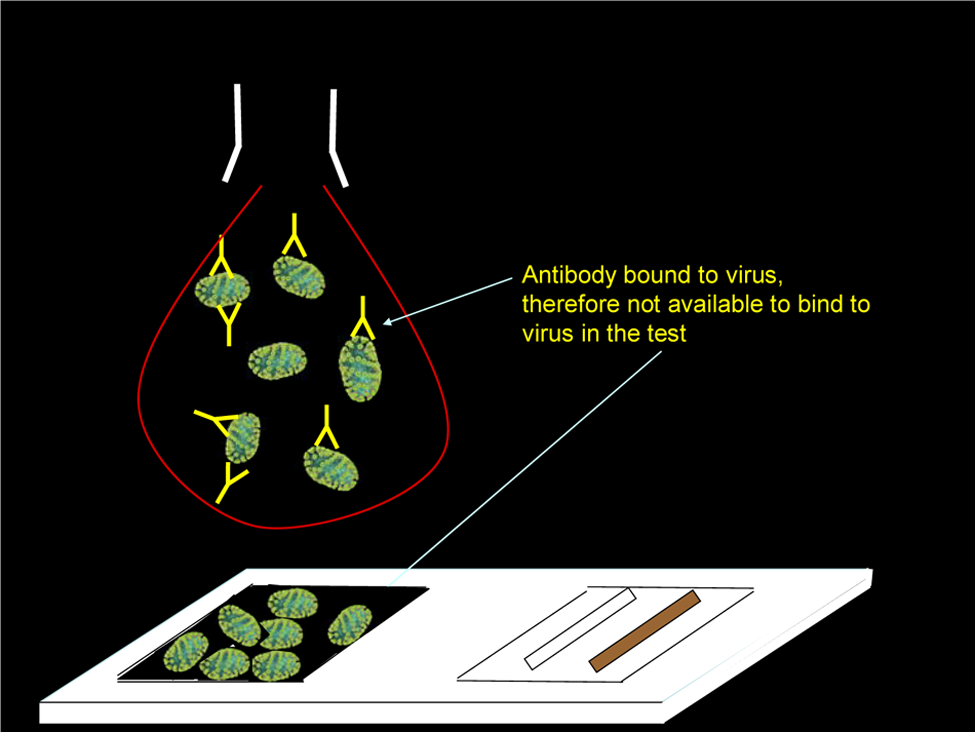
Graphic illustrating how the presence of virus in samples might inhibit binding to antigen in FCoV antibody tests
Materials and methods
Effusion and blood samples
Seventeen samples were selected from a bank of FCoV antibody-positive samples on the grounds that they gave discordant, ie, false-negative or inexplicably low, results on one or more FCoV antibody tests. The sources of the samples are given in Table 1. Thirteen samples were effusions (10 ascites and three effusions from unknown anatomical site); one was plasma and three were unknown as to whether they were effusion or blood. All of the samples were from naturally-occurring cases suspected of having FIP (five histopathologically confirmed). The cases that were not histopathologically confirmed fulfilled all, or most, of the criteria for FIP diagnosis given in the European Advisory Board of Cat Disease recommendations. 5 Samples were stored at -80°C and -20°C.
Seventeen FCoV antibody-positive samples with discordant results

Samples from 17 cats in which FIP was suspected (in five cases histopathologically confirmed). These 17 samples were selected on the basis of their discordant FCoV antibody results over a panel of FCoV antibody tests and are arranged from top to bottom in increasing quantity of virus, as demonstrated by decreasing threshold cycle number (CT) value by real time RT-PCR. A CT of >45 is negative. The samples were tested for antibodies using indirect immunofluorescence (IFA) with a type II FCoV, an enzyme-linked immunosorbent assay (ELISA) test (FCoV Immunocomb, Biogal Galed Labs) and three rapid immunomigration (RIM) tests: RIM 1 (Speed F-Corona; BVT, Virbac), RIM 2 (FASTest FIP; Mega Cor) and RIM 3 (Anigen Rapid FCoV Ab Test Kit; Bionote). For the purpose of clarity on the graph shown in Figure 2, FCoV IFA titres were presented on a scale from 0 to 5: [<10 (0); 10–20 (1); 40–80 (2); 160–320 (3); 640–1280 (4); >1280 (5)] and this table shows the IFA score allocated for each FCoV antibody titre. The trend towards lower FCoV antibody test signals the more virus there is, which can be seen in this table and graphically in Figure 2. Asc = ascites; Effusion = unknown whether abdominal, pleural or other effusion; FIP = feline infectious peritonitis; FIP confirmed = confirmed by histopathology; ND = not done; no PM = no post mortem. Blank cells indicate data unknown. Bold values indicate unexpectedly low or negative results
FCoV antibody tests
The samples were tested for antibodies using indirect immunofluorescence (IFA) with a type II FCoV, 6 an enzyme-linked immunosorbent assay (ELISA) test (FCoV Immunocomb; Biogal Galed Labs) and three rapid immunomigration (RIM) tests: RIM 1 (Speed F-Corona; BVT, Virbac), RIM 2 (FASTest FIP; Mega Cor) and RIM 3 (Anigen Rapid FCoV Ab Test Kit; Bionote). The manufacturers of the latter two RIM tests do not indicate in their instruction sheets that the tests are suitable for use in effusions.
For purposes of clarity on a graph, FCoV IFA titres were presented on a scale from 0 to 5: [<10 (0); 10–20 (1); 40–80 (2); 160–320 (3); 640–1280 (4); >1280 (5)] (Figure 2). Some samples titrated out to dilutions greater than 1:10,240 so it was decided that any samples that titrated beyond 1:1280 were considered very high and allocated number 5.

Results of FCoV antibody tests plotted against threshold cycle number (CT) of quantitative FCoV RT-PCR, showing a trend to lower antibody results in the presence of greater amounts of virus. (a) FCoV immunofluorescent and ELISA antibody results against RT-PCR CT. (b) FCoV RIM antibody results against RT-PCR CT. In (a) and (b), 12 individual samples were plotted on the x-axes according to the CT value obtained by quantitative FCoV RT-PCR. Towards the right of the graph, as CT decreases, the amount of virus in the sample increases. R2 closest to 1 indicates best fit of trendline to data, whereas closest to 0 indicates least fit. Therefore, the RIM 1 test appears to be least affected by increasing virus load, while RIM 3 was most affected. ELISA = enzyme-linked immunosorbent assay; IFA = indirect immunofluorescence; RIM = rapid immunomigration
The ELISA [FCoV (FIP) Immunocomb; Biogal] gives grey spots, which can be read in an ordinary photograph scanner with software provided by the manufacturer. 7 Results are given on a scale of 1–6, depending on the intensity of greyness of the spots, which, in a previous study, correlated well with FCoV IFA titres. 8 The absence of a spot gives a result of zero, which correlates with a FCoV IFA titre of <1:10, deemed to be negative. In a previous study by Addie et al, 8 the spots were read by eye; in the present study, they were read using a scanner (Epson 4000), which increased specificity to 100%. 9
Subjective assessments of the intensity of the RIM, which were as follows: 0 for a complete absence of a band in the test zone; 1 for a distinct, but not strong, positive result; 2 for a strong signal; 3 for an intense signal; and 4 for a band greater than the control band. Very faint, or ghost, lines were subjectively allocated values of less than 1 but greater than 0.
FCoV real-time RT-PCR
Total nucleic acids (TNA) were isolated from a 100 μl sample after addition of 100 µl of MgCl2- and CaCl2-free phosphate buffered saline (Invitrogen) using the MagNA Pure LCTNA isolation kit external lysis protocol (Roche Diagnostics) according to manufacturer’s instructions, with an elution volume of 100 µl. Quantitative RT-qPCR testing for the detection of FCoV RNA was based on the test developed by Gut et al.4 Threshold cycle number (CT) was used as the measure of viral load. The lower the CT, the more virus present in the sample.
Results
The results are shown in Table 1 and Figure 2; five samples were negative by FCoV RT-qPCR and 12 samples were positive.
Linear regression trend lines in IFA, ELISA and RIM FCoV antibody tests all tended downwards as the amount of virus in the sample increased, as shown by a lower CT. The goodness of fit of the trend lines (coefficient of determination, R2) results were as shown in Table 2.
Coefficient of determination (R2) results for indirect immunofluorescence (IFA), enzyme-linked immunosorbent assay (ELISA) and rapid immunomigration (RIM) FCoV antibody tests
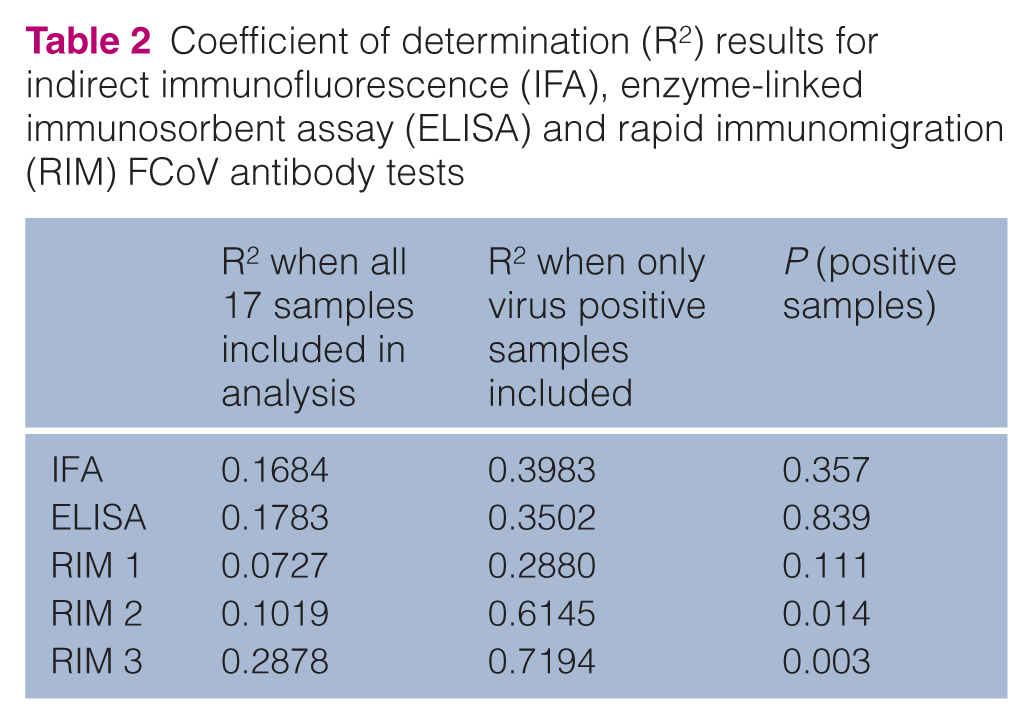
The closer R2 is to value 1, the more close the fit to the trend line, ie, the more the two values are correlated, thus, the trend was more significant in the 12 samples in which virus was actually present than if the five negative samples were included. Therefore, only the 12 positive samples were analysed in Figure 2. It appeared as though the decreasing RIM 3 signal results correlated most significantly with increasing amounts of virus (P = 0.003); RIM 1 was least affected (P >0.5). The sensitivity of the antibody tests also has to be taken into consideration in interpreting the data, ie, if the test is falsely negative with a little virus, it will still be falsely negative with a lot of virus present.
Discussion
FCoV antibody testing is useful in the diagnosis of FIP. Although cats with conditions other than FIP can be seropositive, a negative antibody test has been suggested by some authors to rule out a diagnosis of FIP.1,2 However, to be useful in ruling out FIP, tests need to be adequately sensitive. Hartmann et al 10 reported a sensitivity of FCoV antibody testing of 85% using blood from non-effusive cases and 86% using effusions from cats with effusive FIP. The occurrence of what appear to be false-negative results in some antibody tests is worrying, especially as FCoV antibody testing is the method of choice for quarantining catteries or, indeed, countries. 9 Therefore, we tested the hypothesis that false-negative samples contained so much virus that antibody was bound to it and so unavailable to bind to antigen in the test. We found that there was, indeed, a correlation of lower signals in antibody tests in samples containing higher amounts of virus, supporting the hypothesis. Most of the samples in which we found false-negative antibody results tended to be effusions. This is understandable, as effusive FIP is the more acute form of the disease, with more blood vessels affected and, presumably, higher viral loads. Non-effusive FIP is the chronic form of the disease, fewer blood vessels are affected and the immune response is partially successful in containing the infection. However, our sample base was skewed towards effusions as in non-effusive cases it is not usually possible to obtain a large blood sample, precluding extensive testing. We had only one sample from a non-effusive FIP case and that sample was negative for virus.
Assessing the sensitivity of a FCoV antibody test requires the ability to accurately determine when a false-negative result has occurred: it is essential to be able to differentiate false-positive tests from false-negative ones when antibody tests performed on the same sample give conflicting results. We have demonstrated that FCoV RT-PCR is one method by which this can be done, detecting virus in 71% of discordant samples. However, there remained five samples which were negative by RT-PCR in which some antibody tests were falsely negative or gave an inappropriately weak signal. It is possible that there was no virus in those samples, that the samples contained some substance inhibitory to PCR or that in some, or all, of these five samples RNA, which is notoriously fragile, had been destroyed. We did not consider time in storage to be an issue here because some of the largest amounts of virus were found in some of our oldest samples, some of which had been stored for almost 20 years. Therefore, in some cases, RT-PCR alone may not be used to determine the true status of an effusion or blood sample from a cat with FIP. The presence of virus in an effusion is not accepted universally as being diagnostic of FIP — the theory being that FCoV might coincidentally be present in a cat suffering from some non-FIP related effusion, but when there are very large quantities of FCoV present the diagnosis of FIP is extremely likely.
An explanation for false-negative results in RIM devices is that it is possible that micro-clots can clog up the membrane and that in those cases the false-negative is not due to high amounts of virus at all. We found that a very small amount of sample (5 µl) would give a signal on RIM 1 (data not shown) for some of the samples used in this study, but we were warned by the manufacturers that such practice could give false-positive results and was, therefore, not recommended by them.
Finally, the possibility that the IFA and ELISA tests were both providing false-positive results has to be considered — fluorescence due to anti-nuclear antibody can be confused for fluorescence caused by FCoV antibodies by an inexperienced technician. 9 However, in a panel of FCoV antibody-negative samples, the IFA and ELISA tests used here did not give false-positive results, 9 suggesting specificity of 100%.
In our study, IFA and ELISA, although affected by high amounts of virus (as shown by the lower readings as virus quantity increased; Table 1, Figure 2), seemed to be less affected than RIM tests (although the effect was still statistically significant). Other methods which have been used to determine the true FCoV antibody status of questionable samples include immunoblotting and plate ELISA testing. 11 To be fair to the RIM tests, it has to be said that the manufacturer’s instruction sheet for RIM 3, which appeared to perform quite badly in this study, states that it should only be used for blood — it does not state that the test devices can be used on effusions. However, the manufacturer’s instruction sheet for RIM 2 also states that it is meant only for blood, but we have found that it works well on most effusions (data not shown).
The phenomenon described here is fairly uncommon – the samples used in this study have been collected over a period of 20 years. It is unlikely that falsely negative FCoV antibody results due to high virus load would occur in usages of FCoV antibody tests other than for the diagnosis of FIP, as healthy seropositive cats tend not to have circulating virus. For an in depth discussion of the 11 uses of FCoV antibody tests, visit www.dr-addie.com/FCoVantibody.htm#uses.
Conclusions
There was an inverse correlation between virus load and signal in some FCoV antibody tests. The consequence is that FCoV antibody tests, particularly point-of-care tests, could give false-negative results in a diagnostic algorithm. (The suggested reason is that antibody is bound by virus and is therefore not available as a ligand in a serological test.) The practical advice is that a FCoV serological test suspected of being falsely negative should be checked by indirect immunofluorescence and/or RT-PCR.
Footnotes
Acknowledgements
We are most grateful to the guardians of the cats for donating samples for research. We are grateful to the cats themselves and to their veterinary surgeons for taking and sending the samples. We thank BVT for donating the majority of ELISA and RIM tests used in this study. We are also grateful to Biogal, Galed Laboratories, MegaCor and Bionote for donating tests. RT-PCRs were performed using the logistics of the Center for Clinical Studies, Vetsuisse faculty, University of Zürich, and at the Universities of Glasgow and Bari. We thank Dr François Bagaïni for use of the coronavirus cartoon used in Figure 1. We are grateful to the many donors to the Angelica Memorial Trust (![]() ) for funding this study.
) for funding this study.