
Abstract
Using multi-level modelling, this article analyses data from 16 police agencies in England and Wales where one officer, carrying TASER, used force on one member of the public (N = 11,176). When compared to incidents involving handcuffing only, resistance, gender and mental health status of the member of the public and the need to protect officers or others were associated with increased odds of TASER drawing and firing. Incidents involving lone officers increased odds of firing compared to incidents where they were accompanied by an officer not using force. Compared to the White reference category, incidents involving Black/Black British members of the public, or a male officer, were associated with increased odds of drawing compared to handcuffing. Incidents involving Asian/Asian British members of the public, or children, were associated with decreased odds. As the proportion of incidents where TASER was carried increased, odds of use decreased.
Introduction
The ability to use force, when required, is a defining feature of the police role – as well as a highly controversial one. One of the most controversial force options are Conducted Energy Devices (CEDs), the most well-known of which is the TASER brand. 1 While previous work in this area has deepened our understanding of factors associated with TASER use, it tends to focus on the United States of America and to use data from a single agency (Bishopp et al., 2014; Brandl and Stroshine 2017; Crow and Adrion 2011; Gau et al., 2010; Lin and Jones 2010).
Hence, despite findings from institutional and organisational theory that speak to the importance of agency characteristics in understanding use of force (e.g. Willits and Nowacki 2014), without data from multiple agencies, few studies have been able to examine such variables. Nor is this an issue confined to TASER; Cojean et al. (2020) found that, of over fifty studies examining predictors of police use of force, only four studied organisational factors. Moreover, much of this previous work also focuses on TASER firing, with less attention paid to the predictors of TASER drawing.
This study aims to help fill these gaps by conducting a multi-agency analysis of factors associated with TASER drawing and firing. Thanks to a national approach to use of force recording introduced in 2017 in England and Wales, we utilise data from 16 police agencies. This is understood to be the first academic analysis conducted using this data, building on a previous study by the authors (Quinton et al., 2020). It allows us not only to explore factors operating at the level of individual incidents, but also to employ multi-level modelling—a statistical technique capable of examining data with a hierarchical or nested structure—to explore organisational level factors, differences between agencies and how these may impact police use of TASER. We proceed as follows. After reviewing the prior literature around TASER drawing and firing, we set out the theoretical grounding for variable selection and our focus on organisational factors, before detailing methods, findings and discussion.
Prior Literature on the Use of TASER
Although several studies have recognised the importance of organisational factors (see, e.g., Boivin and Lagacé 2016; Klahm et al., 2011; Lawton, 2007; Smith et al., 2010; Terrill and Reisig 2003) only a handful of studies in the use of force literature have been able to do so, and they tend to focus either on injury rates (Hickman 2020; MacDonald et al., 2009; Smith et al., 2010) or use of force more broadly (Klahm et al., 2011; McCluskey and Terrill 2005; Sun et al., 2008; Terrill and Reisig 2003). With some limited exceptions (e.g. the National Institute of Justice, 2009; Terrill et al., 2017) almost all the work on TASER focuses on a single police force. Nevertheless, this literature has aided our understanding of factors associated with TASER firing and drawing, and we look at these each in turn.
TASER Firing
A number of multivariate studies have looked at the factors associated with TASER firing, mainly using data from American agencies. Most of these studies agree on the relative unimportance of officer-level variables (for an exception, see Sun 2008), but there is mixed evidence as to the importance of incident characteristics. Most studies find resistance by the member of the public to be statistically significant, but the direction of this association differs between American and English studies (for e.g. see Crow and Adrion 2011 c. f. Quinton et al., 2020). While fewer studies have looked at the relationship between TASER and the deployment of unaccompanied police officers (often referred to as single-crewing), those that have again point in different directions (Dymond, 2018 c. f. Brandl and Stroshine 2017, see also Elliot-Davies, 2022).
Studies also differ as to whether the characteristics of the member of the public are significantly associated with the use of force. While most find the gender of the member of the public to be significantly associated with TASER firing, some studies (e.g. Bailey et al., 2016; Brandl and Stroshine 2017; Dymond, 2018) find a significant association between use of force and mental health, while others do not (Johnson, 2011). Similarly, many studies find a significant association between ethnicity and TASER firing (Crow and Adrion 2011; Gau et al., 2010), while others do not (Brandl and Stroshine 2017, Lin and Jones 2010, see also Boivin and Lagacé 2016, Terrill and Resig 2003 who look at the use of force more broadly).
TASER Drawing
Due, in part, to data limitations, few multivariate studies have been able to analyse incidents where TASER is drawn but not fired. This is an important knowledge gap given that this mode of use is understood to account for the vast majority of instances involving TASER (Home Office, 2021) and given calls for more research on this topic (see, for e.g. Lin & Jones, 2010; Sierra-Arévalo, 2019; Sytsma et al., 2022; Worrall et al., 2021). There are a few exceptions, however. Sytsma et al. (2022) studied predictors of TASER severity using a dataset from one Canadian agency, which included incidents where the weapon was drawn but not fired. However, as they focus only on incidents where TASER is used, they are not able to compare TASER use to other forms of force. Worrall et al. (2021) and Riddell and Worrall (2021), both working with single agencies in the USA, find consumption of drugs and/or alcohol of the member of the public, and whether they are armed, or displaying a weapon, to be significantly associated with TASER drawing. However, ethnicity, gender and mental health impairment of the member of the public are significant in some models, but not all.
A few themes emerge from this literature review. First, the literature is mainly focused on TASER firing; there is much less on TASER drawing. Second, although there are some differences around the precise variables included, the work that has been done tends to include variables at the level of the officer, member of the public and the incident. This mirrors the literature on use of force more broadly, with systematic reviews underscoring that the ‘most frequently explored variables’ included in use of force studies are those associated with the member of the public, officer characteristics and situational characteristics (Dryer-Beers et al., 2020, see also Cojean et al., 2020). Yet the significance of these variables, and their direction, can differ from study to study, producing a mixed picture.
Third, previous work is overwhelmingly based in the United States of America, often focusing on a single agency. One consequence of this is that studies are based on relatively small data sets. A recent systematic review (Cojean et al., 2020) identified 52 studies examining factors associated with police use of force, of which over 70% were based on less than 1,000 records - and the literature on TASER is no exception to this broader trend. Given this limited data, and important differences between policing in the USA and England and Wales, a study in another jurisdiction may complement the existing literature. In particular, in countries like the USA, where firearms are readily available to officers and where public gun ownership is higher, TASER may be used differently than in jurisdictions where officers and members of the public alike have lower levels of access to firearms.
Finally, few studies on TASER have been able to examine organisational factors in any depth. Yet we know from previous work that organisational characteristics are associated with police use of deadly force (Willits and Nowacki 2014), complaints about use of force (Hickman and Piquero 2009) and overall rates of use of force (Alpert and Macdonald 2001). It is hence possible that organisational characteristics may also impact the use of Taser. There is thus an important empirical rationale for work comparing across agencies; and there is also an important theoretical rationale, too, to which we now turn.
Theoretical Underpinnings
The so-called ‘discovery’ of police discretion in the 1960s opened up an intriguing possibility; that the decisions and actions of police officers, including the force that they use, may not be determined exclusively by the law but may be influenced by other factors. As we have seen, much literature has thus been concerned with measuring influences at the immediate use of force encounter—specifically officer, civilian and incident level variables—that may be associated with police officers’ use of force.
Yet another important move is to go beyond such immediate considerations and consider broader factors that may impact use of force decisions. Indeed, as Klinger’s important critique noted, research has ‘focused on immediate circumstances of police-citizen encounters (without) linking police activity to the ecological contexts in which it occurs’ (1997: 278). Indeed, a range of approaches—from ‘high’ theory (Giddens, 1976) to perhaps more ‘mid-range’ theories alike (Klinger, 1997; Maguire, 2003; Phillips, 2011)—have underscored the extent to which the behaviour and decisions of individuals are influenced not just by immediately proximate factors, but also by broader ecological and organisational contexts. They have further underscored the extent to which ‘structure’ and ‘agency’, organisations and individual actions, are inherently intertwined.
For example, social ecology approaches posit not only that crime and delinquency may be affected by structural characteristics of communities and neighbourhood effects, but further that officer performance is likely to be impacted by the organisational and ecological contexts in which they work and the interactions between them (see also Kane, 2002; Sobol, 2010). For example, Klinger’s work on negotiated order posits an inverse relationship between the levels of crime and deviance in a particular area and the ‘vigor’ with which it is policed. Organisational theorists such as Burruss et al. (2017, p. 3) remind us that, ‘officers act as independent agents, yet they do so within the structure, policies, training, culture, tradition, and context of their employing organizations… scholars need to continue to examine organizations, individuals, and their interplay in understanding the behaviour and decision-making of each’. For many, then, it is theoretically problematic to look at individual, or micro-level issues, without looking at organisational and institutional issues.
More specifically, classic work by Maguire (2003)—and more recent applications of his work to a number of dimensions of policing, including the use of lethal force (Willits and Nowacki 2014)—has suggested three important dimensions of police organisations; context, complexity and control. While differences between the UK and the USA mean that we are not able to operationalise all three dimensions in the same way that they have been employed in the American literature, we are nevertheless able to consider them to some degree and examine these in turn.
The first dimension, organisational context, comprises considerations such as the size of the department as well it’s ethnic composition and the characteristics and crime rates of the area it polices; what contingency theorists might refer to as the police organisation’s ‘task environment’ (see also Maguire and Uchida 2015). Empirical work also speaks to the importance of such dimensions. Indeed, a systematic review of use of force studies by the UK’s College of Policing (Dryer-Beers et al., 2020) found that, where studies were able to look beyond the micro-level, they most commonly sought to include measures for violent crime, deprivation and ethnic composition of the areas policed. As such, in keeping with the theoretical and empirical literature, we include measures for organisational context and size, including measures of violent crime, deprivation, ethnic composition of the agency and the area policed (details of how these variables have been operationalised are discussed further in the next section).
It is perhaps more complex to include the second and third dimensions—organisational complexity (e.g. differences in hierarchy, rank structure, vertical and horizontal organisation between police forces) and organisational control (the extent to which police forces are subject to external oversight and complaints mechanisms, and their policies around use of force)—in our study due to the degree of variation amongst agencies. Unlike American agencies, the English and Welsh forces in our study share a rank structure, an oversight body—the Independent Office for Police Conduct (IOPC), which oversees the police complaints system in England and Wales—and national guidance on TASER.
This does not mean, however, that there are no salient differences worth exploring under these dimensions, perhaps especially with regards to the third dimension of organisational control. For despite national level guidance, there is considerable variation around TASER policies and practices locally. Indeed, the IOPC (2021) and it’s predecessor, the Independent Police Complaints Commission (IPCC 2014), found large variations in the rates of TASER use and in local policies around the proportion of trained officers (IOPC 2021) and, hence, the availability of the weapon.
This may be important because differences in policies and practices around the availability of TASER have been theorised to impact officer decision making in various ways. Arming a large proportion of officers with the weapon and making it readily available at use of force incidents could exacerbate trends towards the ‘trigger-happy’ use of TASER (e.g. Adams and Jennison 2007, p. 456, see also Sierra-Arévalo 2019, p. 246). Yet non-TASER trained officers can also put pressure on their TASER trained counterparts to use the weapon at use of force incidents (Dymond, 2021, p. 118); greater availability of TASER trained officers at use of force incidents could counteract this tendency and thus hedge against its use. Hence, changes in the availability of TASER across agencies could work to normalise and/or to exceptionalise its use – either way potentially impacting officer decisions around the weapon.
Drawing on this body of theory, as well as the existing literature to date, we posit, then, that the exploration of TASER use should include variables at the incident level—including officer, civilian and incident characteristics—but should also go beyond this to explore variables pertaining to the organisation and the context in which it operates, as detailed above. In this next section, we detail the methods used and how we have operationalised these variables.
Methods
Data Set and Exclusion Criteria
The dataset used in this analysis consisted of 11,176 use of force incidents involving one officer and one member of the public that occurred between April 2017 – March 2018, in 16 participating police agencies in England and Wales, where officers had indicated they were carrying TASER. These data were initially collected under a new use of force reporting standard in England and Wales whereby, following a review of recording practices (Shaw, 2015), the National Police Chief’s Council agreed to introduce a national approach to the recording of use-of-force incidents. Under this new system, a form is to be completed whenever officers (or a member of police staff) use force on any person, with force defined relatively broadly so as to include, for example, handcuffing, unarmed force, and the drawing of baton, irritant spray, attenuating energy projectiles, TASER and firearms, even if these options are not subsequently fired or used.
In 2018, Deputy Assistant Commissioner Matt Twist, the Lead for Restraint and Self-Defence for the National Police Chief’s Council, wrote to the 43 regional police agencies in England and Wales and the British Transport Police, requesting they share their anonymised 2017/18 use-of-force data with the research team. This resulted in datasets from 32 agencies. However, not all of these datasets were suitable for use, due to missing information. Specifically, under the new use of force reporting system, each individual record is intended to provide an account of an individual officer’s use of force against one person. When multiple officers used force on the same person during the same incident, multiple records should have been completed. So if an incident involved two police officers each using force, on two members of the public, there should be four use-of-force records.
However, as unique incident numbers were not used consistently across incidents or forces, and as the identity of officers and members of the public was anonymised, it was not possible to identify which incidents involved multiple records, and which records submitted by two or more officers were associated with the same member of the public and use of force incident. This causes some analytical difficulties (see also Ferdik et al., 2014; Riddell and Worrall 2021 for a discussion of similar issues). In particular, being unable to readily connect incidents in which multiple officers used force on the same member of the public risks under-estimating the amount, and types, of force used in a given incident. It also risks treating records as separate, and different from each other, when in fact they pertain to the same event or, to put another way, are nested in an overarching use of force incident. The structure of the data also causes issues with categorisation. If we have two records for the same individual where one police officer fired TASER at a member of the public, while another one drew, but didn’t fire Taser, we would not be categorising this individual into mutually exclusive outcome categories which is required to properly isolate the impact of independent variables, if we were to include both of these records in our analysis. Therefore, although restricting our focus to cases involving one officer and one member of the public is a key limitation of the study, this approach is intended to minimise such complications.
In order to do this, without a clear way of recognising linked records, 2 it was necessary to restrict analysis to those agencies (16 in total) that provided the date, time and location of the use of force incident, as well as other variables essential for the multivariate analysis. Records were aggregated if incidents occurred in the same agency and the same location, and on the same date, within an hour of each other. Cases involving multiple records were then excluded from the analysis. 3
Additional exclusion criteria were also applied. Individual records that did not occur between 1 April 2017 to 31 March 2018 were excluded, as were records where force had not been used, the force used had not been specified, or where force was used to gain entry to a building and was not used against a person. List-wise deletion of cases with missing data on variables used in the analysis was also performed. After applying these criteria, the dataset included 45,661 use-of-force records from 16 police agencies. Finally, we restricted our analysis to those incidents (11, 176 out of a total of 45, 661) where officers indicated they were carrying a TASER. We did this because they are not standard issue to all officers in England and Wales and may, therefore, not always be present at an incident. Excluding cases where TASER was not present allows us to focus our analysis on cases where there was the potential for the weapon to be used - in other words, to focus on incidents where officers had a TASER available to them and thus were able to make a choice about whether or not to use it.
Measures
TASER Use
The dependent variable, TASER use, comprised cases where TASER was carried but not used; cases where TASER was ‘drawn’ (i.e. was either aimed, drawn, arced and/or red-dotted) but was not fired; and cases where TASER was fired, either in probe-firing, drive-stun and/or angled-drive stun mode.
Incident Variables at Level 1
According to systematic reviews (e.g. Dryer-Beers et al., 2020), the ‘most frequently explored variables’ included in use of force studies are; officer characteristics (specifically length of service and gender); situational characteristics (level of resistance, intoxication, and officer presence) and those associated with the member of the public (specifically; gender, age, ethnicity and mental health). We have been able to include all these variables here in order to aide comparability with the existing literature and with TASER use in other jurisdictions.
Specifically, officer length of service was coded as five years or less; 6 – 10 years; 11 – 15 years; and more than 15 years, with the former being the reference category. Officer gender was divided into male; female or any other gender, with the latter being the reference category.
Officer-reported characteristics of members of the public included in the model comprised age (over or under 18 years of age, with the former being the reference category), gender (male; female or any other gender, with the latter being the reference category), and ethnicity (White, Asian or Asian British, Black or Black British, or Other, 4 with White being the reference category). A measure was also included for whether the member of the public was reported as being mentally ‘disabled’; this is the term used on the form, and is to be changed to a more appropriate term in future. 5
Situational and interactional characteristics included the level of resistance shown by the member of the public, with officers asked to record their primary type of behaviour. This was recoded into two categories, ‘compliant, verbal or passive resistance’ or ‘active, aggressive resistance, serious or aggravated resistance’, with the former being the reference category. The model also included a measure of whether the officer was single crewed. However, as the dataset excluded cases where multiple officers used force in the same incident, single crewing was compared to incidents where officers were deployed with colleagues who did not use force, with this forming the reference category. The forms also captured a range of ‘impact factors’, which are defined by the NPCC (2017) as factors believed by officers to apply to the member of the public and which they thought affected their decision to use force. They include variables commonly found in previous studies. Impact factors included in the model were the consumption of alcohol and drugs, the mental health of the person on whom force was used, as well as whether the officer had prior knowledge of the member of the public. These variables were included separately in the model, with the absence of these characteristics being the reference category. These variables do not capture all incidents where these characteristics were present, but only those where those characteristics affected the officer’s use of force.
We were also able to include similar, but not identical, measures for two other commonly used measures identified by systematic reviews. Specifically, while there was no data on the presence of bystanders per se, we were able to include a measure of whether a crowd was in attendance (this was an ‘impact factor’ as discussed above), and whether the incident occurred in public, or in a private dwelling or place of detention (these were entered into the model as dummy variables as they were not mutually exclusive). 6 We were also able to include a measure of whether force was used to protect self and others, which is similar to a frequently included variable indicating whether force was used in an incident involving conflict. This also allowed us to capture the level of violence that the individual may present to themselves or to other members of the public, as separate from the level of resistance posed to the officer. Officers were able to select from a number of reasons for using force 7 which were recoded into a binary variable (force used to protect self or others; force used for other reasons) with the latter being the reference category.
Finally, we include a variable less commonly included in previous studies, specifically the main duty at the time of the incident (patrol, armed response vehicle or ARV, and other 8 with patrol being the reference category). Capturing whether officers were deployed with firearms (i.e. were in an armed response vehicle or ARV) seemed relevant due to the differences between the UK and USA with regards to whether officers are routinely deployed with firearms, and differences between armed and unarmed officers.
Police Agency Variables at Level 2
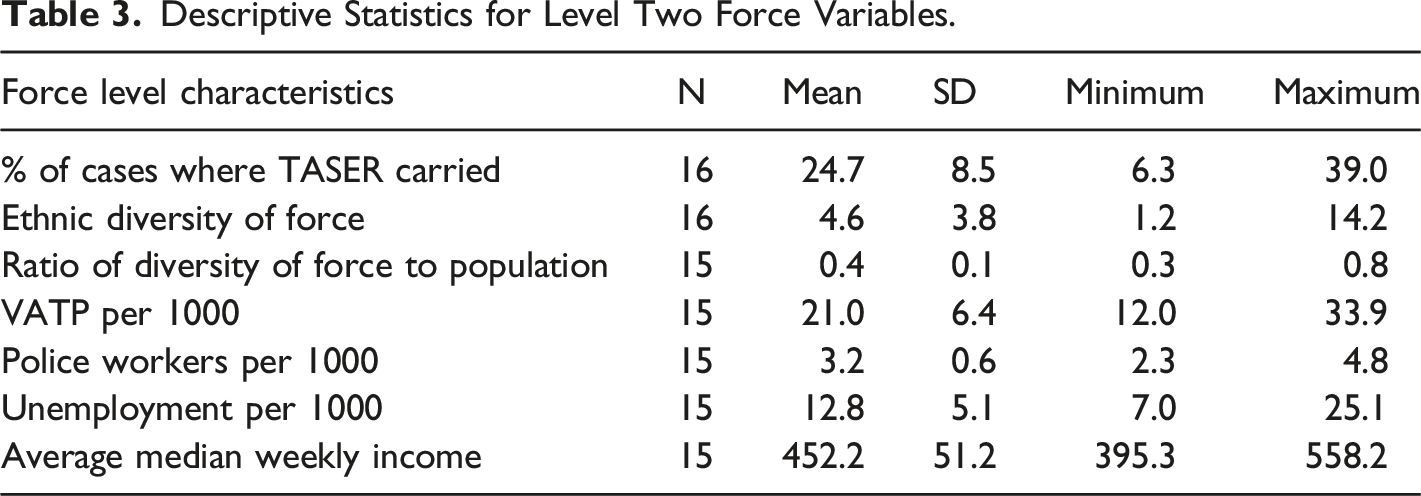
At the organisational, police agency level, the final model included a measure for the percentage of use of force cases involving officers carrying TASER, centred around the grand mean. As discussed above, this was intended to provide a practical measure of how often TASER was actually available at use of force incidents. This figure was obtained from the larger dataset (N = 45,661) described above, which included cases where force was used but where officers were not carrying TASER. We also ran models with the percentage of ethnic diversity of the force; the ethnic diversity of the force area; the ratio of ethnic diversity in force to the area; Violence Against the Person, the number of police workers, and the unemployment per 1000 population; and the average median weekly income in the force area.
Analytic Strategy
Multinomial logistic regression was used given the categorical nature of the data. Given the nested structure of the data, multi-level modelling techniques were also required to include an additional error term for clustered data. While previous multilevel studies have treated individual incidents as nested either in individual officers (Bishopp et al., 2014; Klahm et al., 2011; Sun 2008) or in neighbourhoods (Lawton, 2007; Lee, 2016) it was not possible to do that here due to data limitations. Instead, we treated incidents as nested in the police agencies in which they occurred. As such we included measures at the level of the individual incident (Level 1) and the police agency (Level 2). The first model (Model 1) included all Level 1 variables. In the second model (Model 2), we introduced the Level 2 variable. Continuous variables were grand mean centred, which reduces multi-collinearity concerns between Level 1 and Level 2 predictors
9
. The equation for Model 2 is:


β
0j(1)
is the intercept while X
1ij
through X
Qij
are the level 1 variables with their corresponding slopes β
1j(1)
through β
Qj(1)
. γ
00(1)
is the gamma for the level 2 variable, Y
j
, while u
0j(1)
is the level 2 error term. The intraclass correlation (ICC) was calculated using Snijders and Bosker’s (1999) formula,
A series of robustness checks were carried out and models were run with, and without, data from the Metropolitan Police Service (MPS) given the large percentage of cases from this agency (43%). There are some variables whose significance change with and without data from the MPS 10 but there are no meaningful differences when looking at effect sizes. Therefore the results reported here include data from the MPS. While the main form of analysis, presented in detail below, compares incidents where TASER is carried but not used (the reference category) to incidents where TASER is drawn or fired, following a helpful suggestion by reviewers, we also provide an additional analysis, re-ordering the reference category so that it comprises incidents where TASER is drawn.
Results
Incident Characteristics
Characteristics of Incidents where TASER was Carried. N = 11,176.
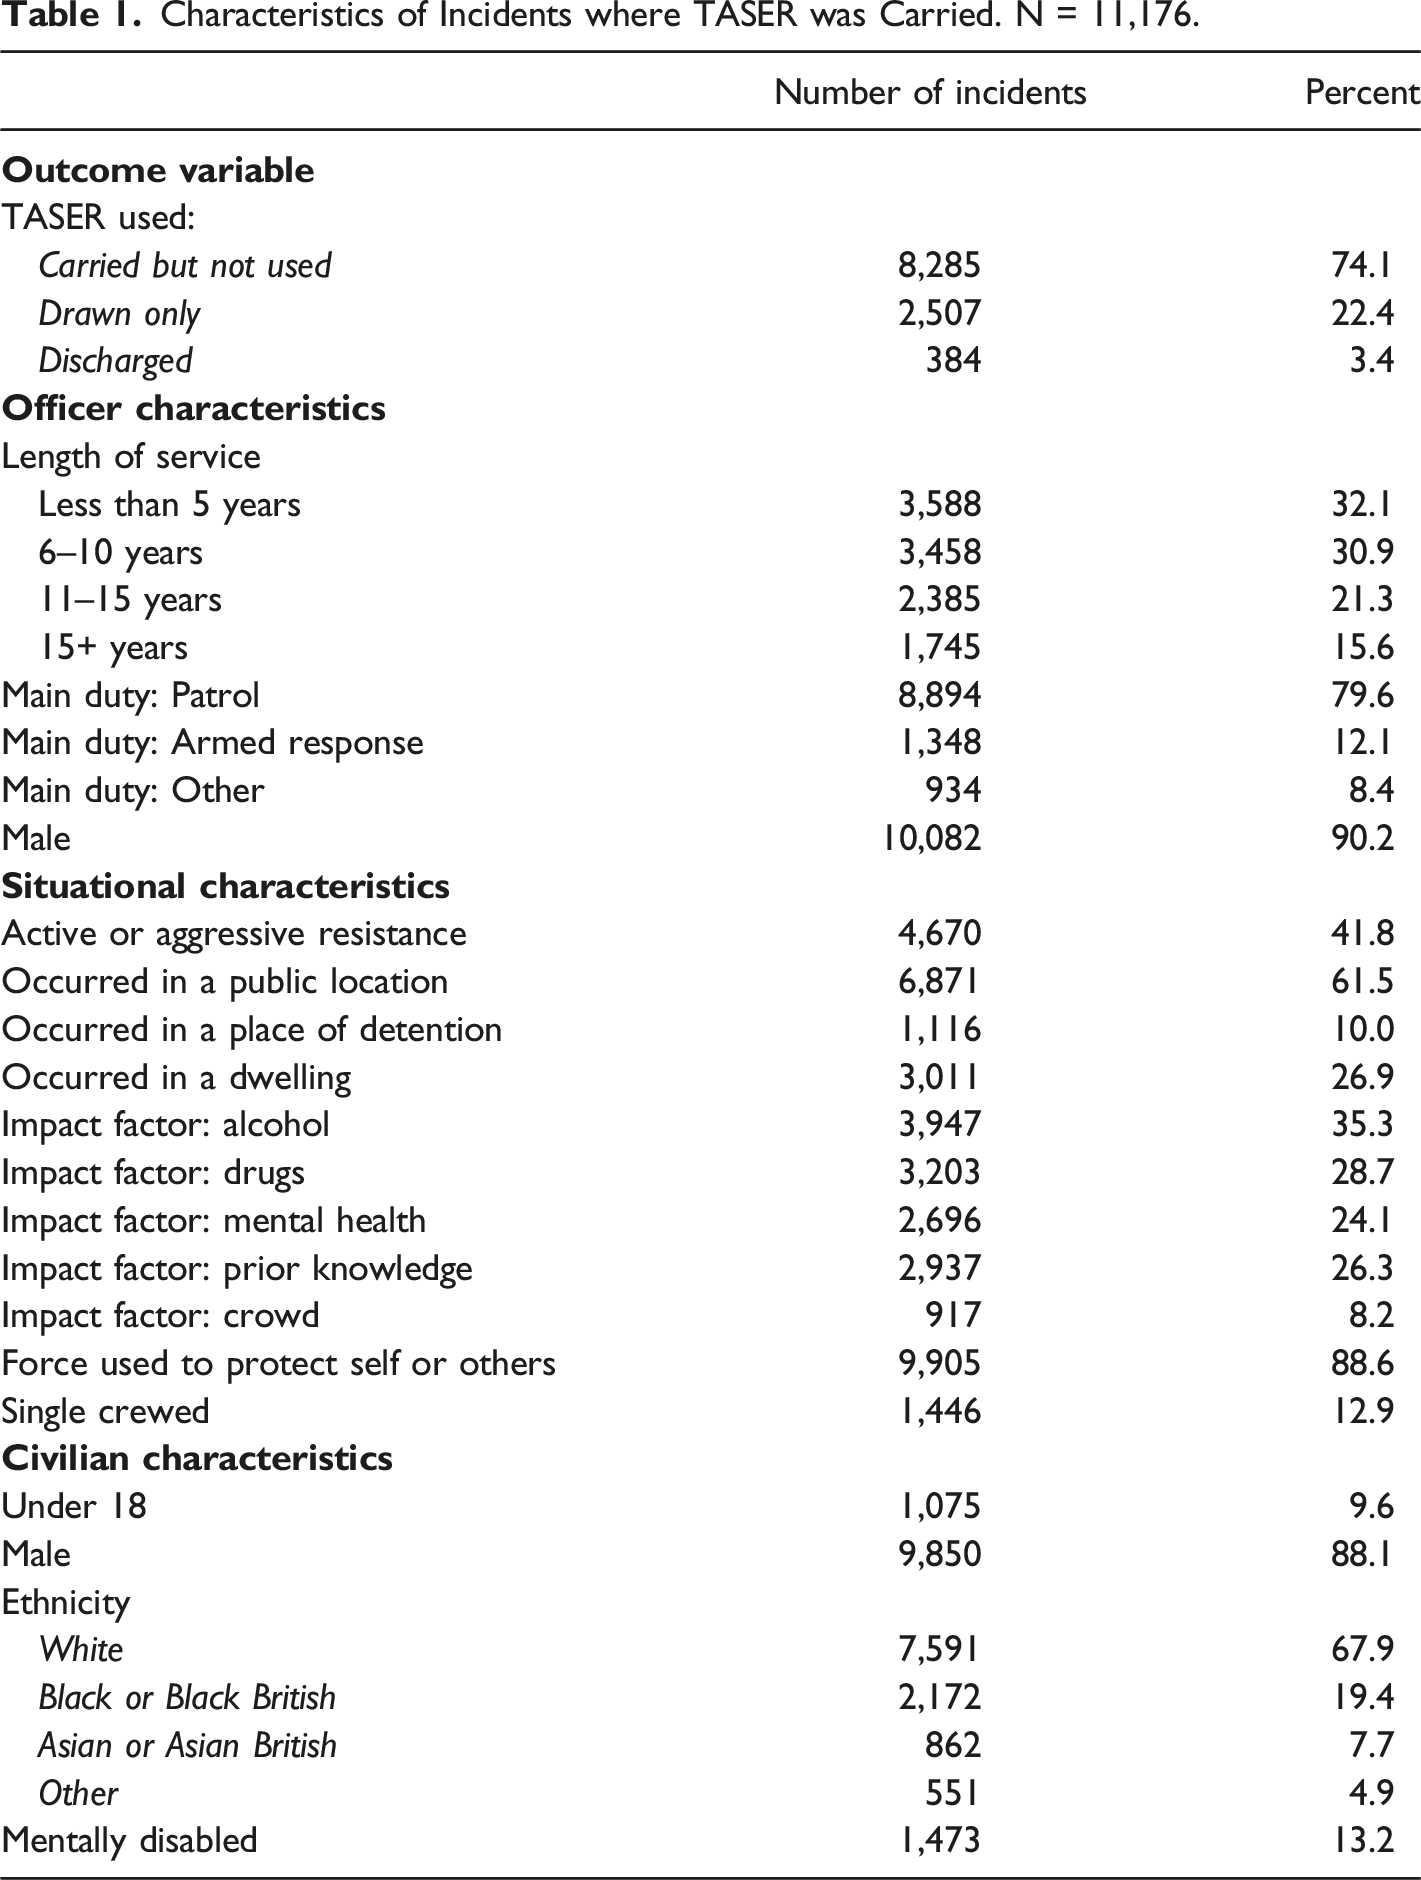
10% of incidents involved children (i.e. those under 18), 88% involved men, and 13% involved people described as mentally ‘disabled’. The people involved in the use of force incidents in question were described as white in 68% of incidents, as Black or Black British in 19% of incidents, as Asian or Asian British in 8% of incidents and as of other ethnicity in 5% of incidents.
Agency Level Characteristics
Use of Force (UoF) Incidents, and Incidents Involving Taser Use, Broken Down by Force/Agency.
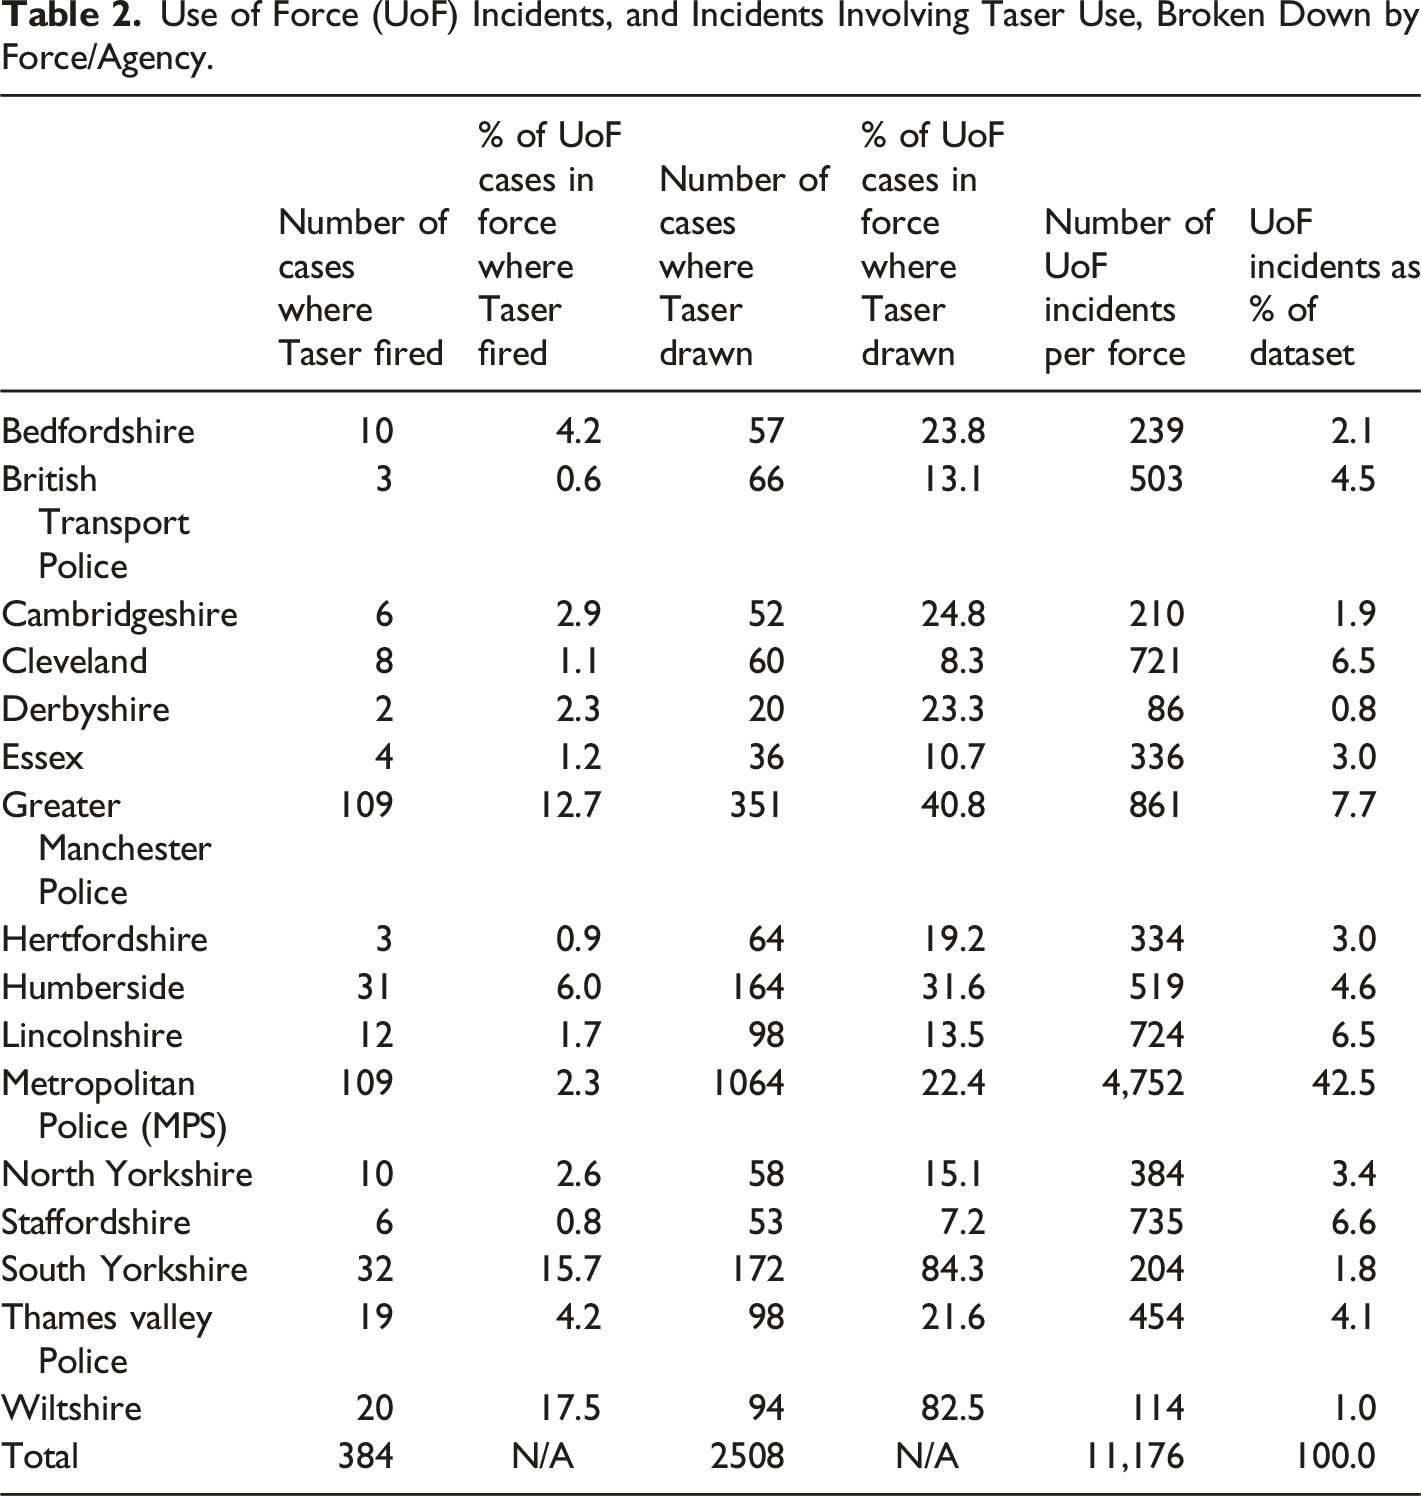
Across the agencies, rates of TASER firing in the dataset varied from <1% to 18% of incidents. Rates of drawing varied from 84% of incidents to 7% of incidents. Rates of carrying, but not firing, were over 90% in two agencies, while two agencies had no cases listed where TASER was carried but not used.
Descriptive Statistics for Level Two Force Variables.
Model Results
We ran a number of models with Level 2 variables that are not statistically significant, so are not included in this paper but are available upon request. Given the small sample size, only one variable at Level 2 was included in the model at any one time. Specifically, we ran the TASER outcome model with a Level 2 variable for the percentage of ethnic diversity of the force. While this was not significant, the results showed robust findings with Level 1 variables showing the same effect sizes and significance. The model was also run with 15 forces with other Level 2 variables that were missing a value for one of the 16 forces in the final model presented. While these Level 2 variables were not statistically significant, the results show consistent outcomes across Level 1 variables, again supporting the robust values found in the reported model. While we had hoped to be more granular in our consideration of neighbourhood effects, and, where relevant, to be able to include these variables for smaller geographical units, data limitations meant that we had to aggregate these variables to the level of the geographical region covered by the agency in question. The results reported below include the percentage of use of force cases in the force area where the officer reports they are carrying a TASER, as this was found to be statistically significant.
TASER Firing: Reference TASER Carried
TASER Discharged and Drawn. Odds Ratios Are Reported.
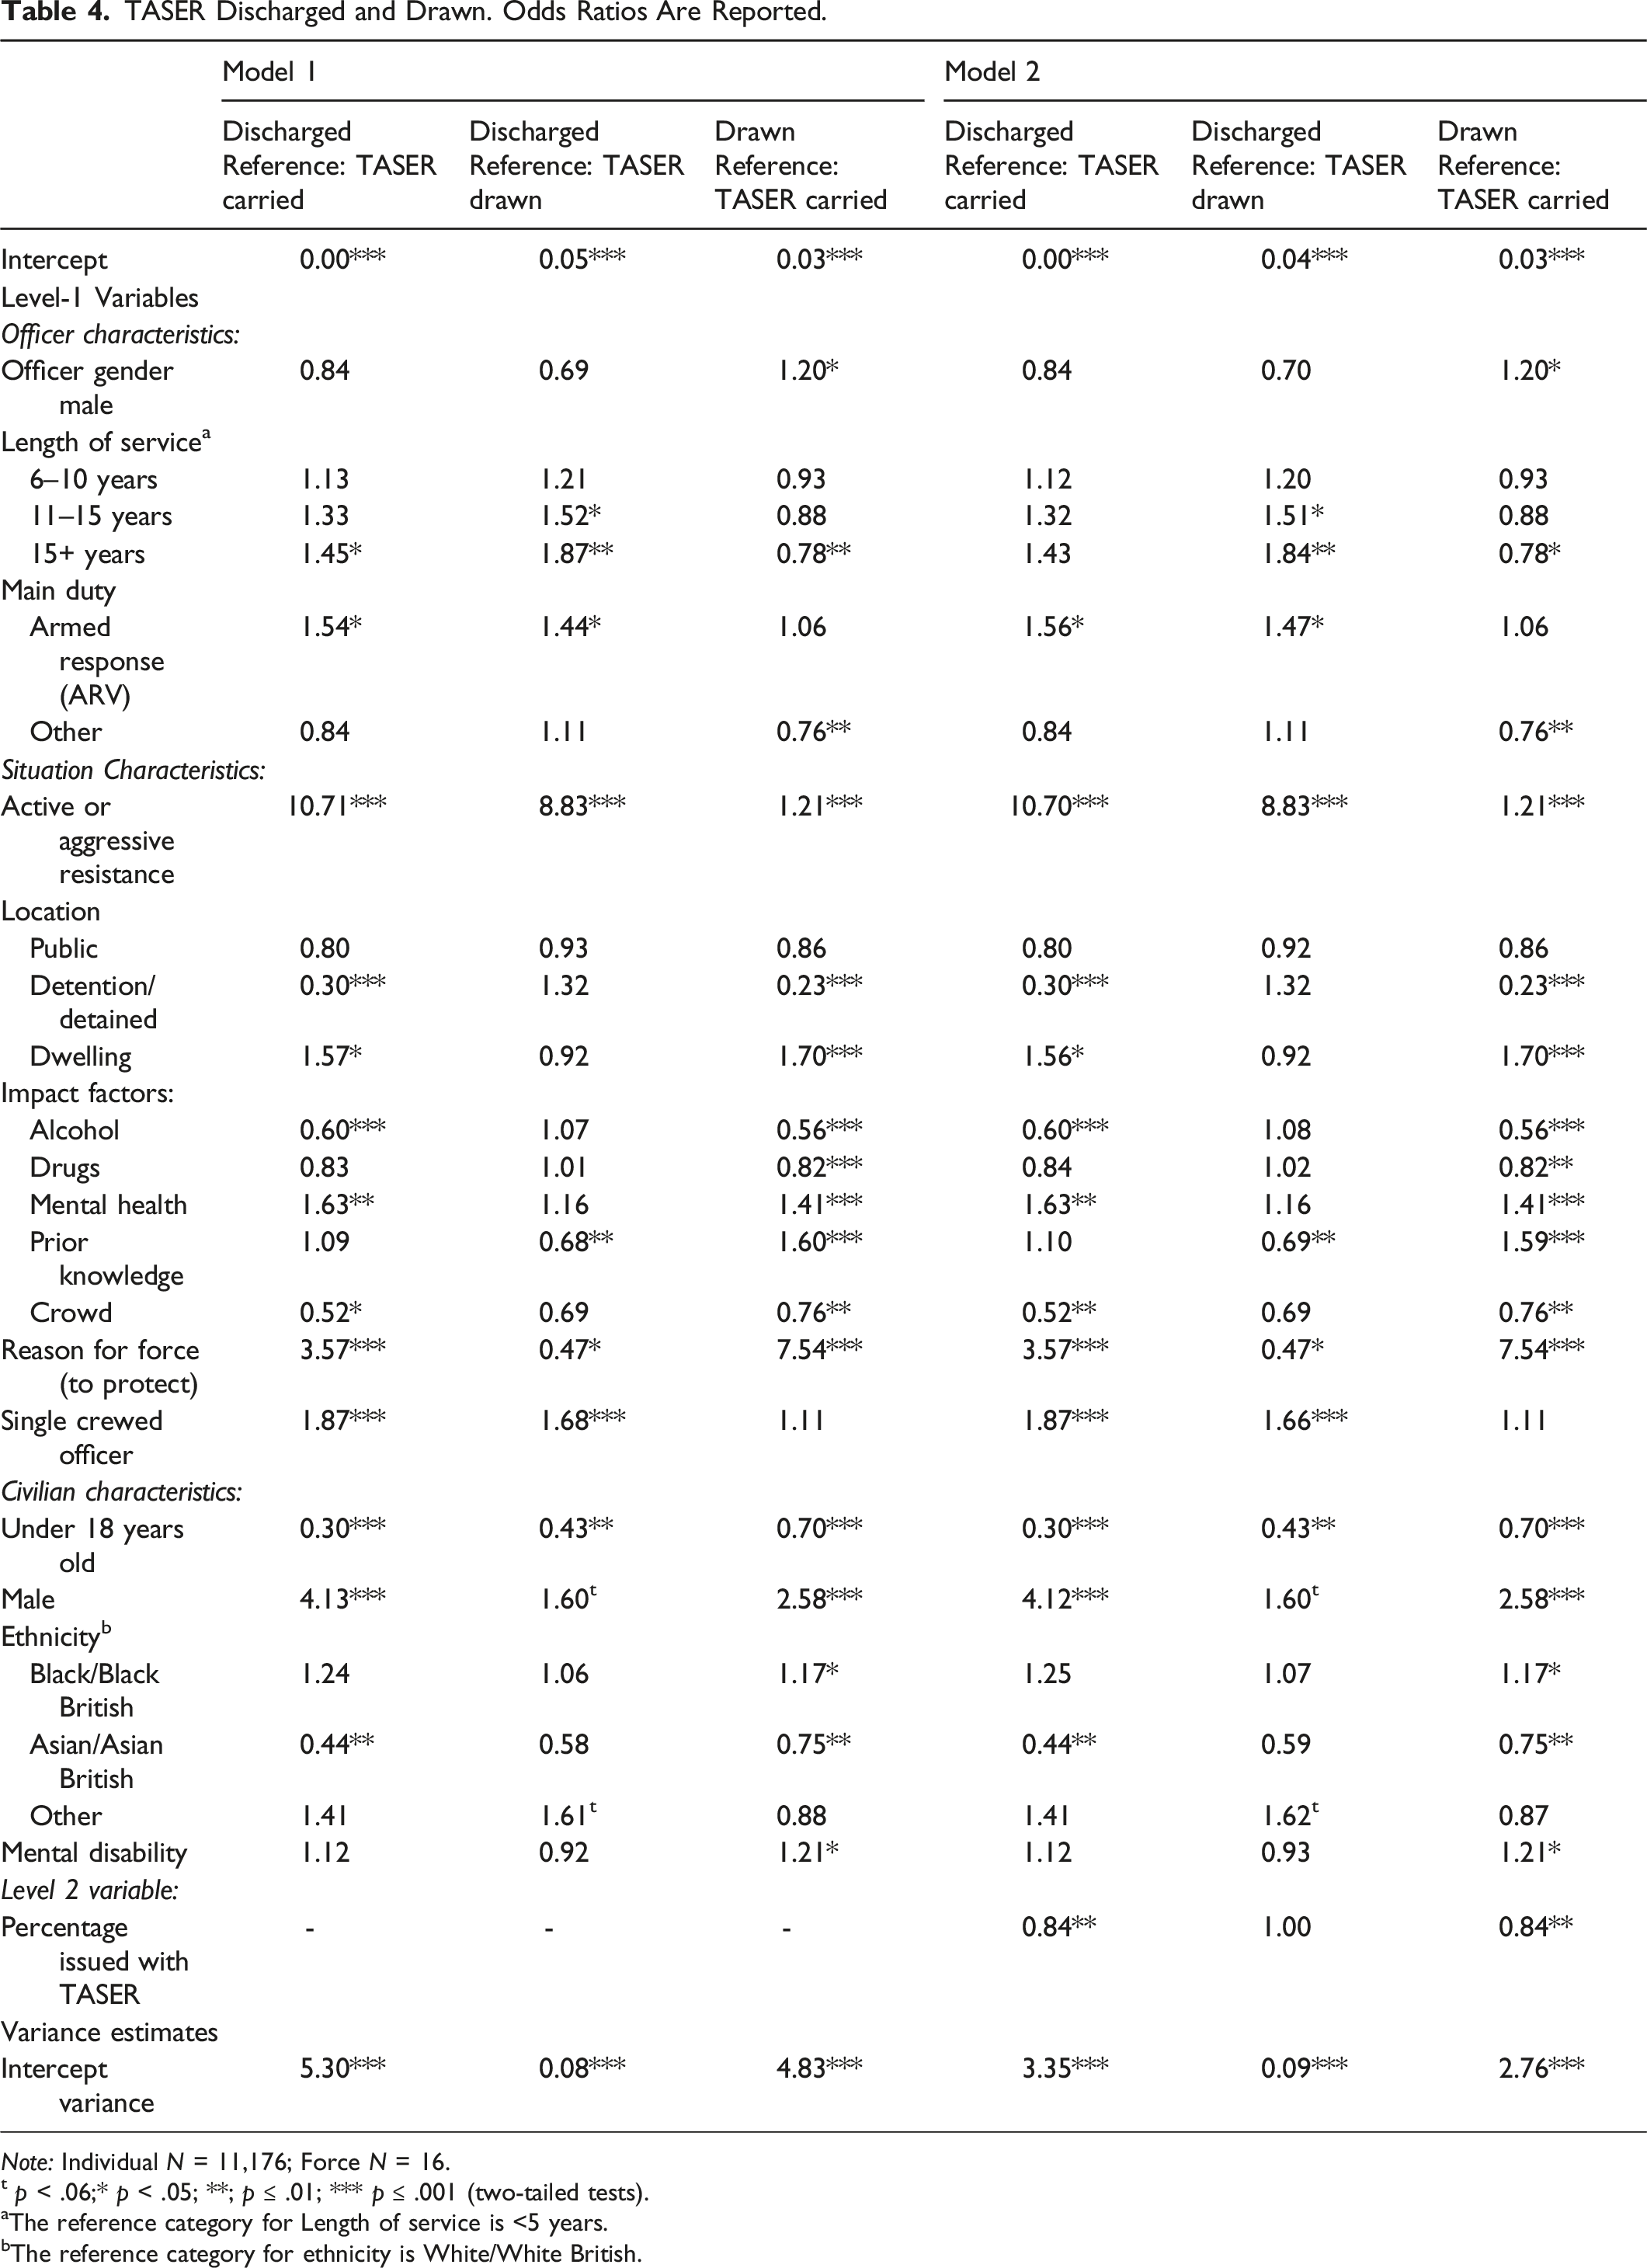
Note: Individual N = 11,176; Force N = 16.
t p < .06;* p < .05; **; p ≤ .01; *** p ≤ .001 (two-tailed tests).
aThe reference category for Length of service is <5 years.
bThe reference category for ethnicity is White/White British.
Turning to situational characteristics, multiple factors increased the odds of TASER being fired in reference to TASER being carried. These included active or aggressive resistance (odds ratio = 10.70, p ≤ .001), using force to protect self or others (odds ratio = 3.57, p ≤ .001) and the incident occurring in a dwelling (odds ratio = 1.56, p < .05). The presence of mental health as an impact factor also increased the odds of TASER being fired (odds ratio = 1.63, p ≤ .01). Incidents where the officer was single crewed (compared to circumstances where another officer was present but not using force) were also associated with increased odds of TASER discharge (odds ratio = 1.87, p ≤ .001). Some incident characteristics were associated with decreased odds of TASER firing. These included alcohol being listed as an impact factor (odds ratio = .60, p ≤ .001), crowd being listed as an impact factor (odds ratio = .52, p ≤ .01) and the incident occurring in a detention setting (odds ratio = .30, p ≤ .001).
At Level 2, increases in the percentage of officers carrying TASER in incidents where force was used was associated with a decrease in the odds of TASER being fired compared to TASER not being used in the use of force incident (odds ratio = .84, p ≤ .01). The variance component for this model (3.35, χ2 (14) = 531.37, p < .001) shows that there is significant variance that remains to be explained at Level 2. However, the variance in Model 2 decreased from the null model (with no predictors) indicating that about 43% of the explainable variation in TASER firing (compared to not being used at all) can be explained by the Level 2 variable included in the model.
TASER Drawing: Reference TASER Carried
Turning to the drawing of TASER, compared to use of force incidents where TASER was available but not used, again incidents involving those under 18, and Asian or Asian British members of the public, were associated with lower odds of TASER being drawn (but not fired) (odds ratio = .70, p ≤ .001 and odds ratio = .75, p ≤ .01 respectively). The odds of TASER being drawn were increased in incidents involving members of the public who were reported to be male (odds ratio = 2.58. p ≤ .001), Black or Black British (odds ratio = 1.17, p < .05) or experiencing a mental health disability (odds ratio 1.21, p < .05). In terms of officer characteristics, incidents involving male officers were associated with increased odds of TASER drawing (odds ratio = 1.20, p < .05). Incidents where the officer had over 15 years’ experience were less likely to result in TASER drawing (odds ratio = .78, p < .05) as were incidents where the officer was engaged in ‘other’ duties; that is, they were not on patrol or armed response (odds ratio = .76, p ≤ .01).
Active or aggressive resistance offered by the member of the public increased the odds of TASER being drawn (odds ratio = 1.21, p ≤ .001), as did officers reporting that they needed to use force to protect themselves or others (odds ratio = 7.54, p ≤ .001). TASER incidents that occurred in dwellings were associated with increased odds of TASER drawing (odds ratio = 1.70, p ≤ .001), as were prior knowledge of the person (odds ratio = 1.59, p ≤ .001), and mental health being listed as impact factors (odds ratio = 1.41, 4 p ≤ .001). The odds of TASER being drawn (but not fired) were decreased in incidents where alcohol, drugs or crowds were listed as impact factors (odds ratio = .56, p ≤ .001; odds ratio = .82, p ≤ .01 and odds ratio .76, p ≤ .01), or where the incident took place in a detention setting (odds ratio = .23, p ≤ .001).
At Level 2, the increase in the percentage of officers carrying TASER in use of force incidents was associated with decreased odds of TASER being drawn (odds ratio = .84, p ≤ .01). The variance component for TASER drawing is 2.76 (χ2 (14) = 1654.48, p < .001), meaning that there remains significant unexplained variance between the police agencies. This model shows that 44% of the explainable variation in TASER drawing, compared to not using TASER, can be explained by the percentage of police in the agency carrying TASER in use of force cases.
TASER Firing: Reference TASER Drawn
Re-ordering the reference category so that it comprises incidents where TASER is drawn, compared to incidents where TASER is fired and incidents where TASER is not used, allows us to present and conceptualise the findings in a slightly different way. When compared to instances where TASER was drawn but not fired, the odds of TASER firing increased in incidents which involved officers with service of 11 years or more (odds ratios = 1.51 – 1.84, p ≤ .05), officers on ARV duties (odds ratio = 1.47, p ≤ .05), an officer who was single crewed (odds ratio 1.66, p ≤ .001), or a member of the public posing active or aggressive resistance (odds ratio 8.83, p ≤ .001). When compared to drawing, TASER was less likely to be fired where prior knowledge was listed as an impact factor (odds ratio = .69, p ≤ .01), where the officer indicated force was used to protect self or others (odds ratio = .47, p ≤ .05), or where the person was under 18 (odds ratio = .43, p ≤ .01). The previous analysis indicated that when the percentage of officers carrying TASER increases, the odds of drawing and firing decreases. The results from this analysis indicate that when incidents involving TASER drawing and firing are compared directly, the odds of TASER firing (as compared to TASER drawing) are not significantly affected by the percentage of officers carrying the weapon, while the odds of other forms of force being used increases (odds ratio 1.20, p ≤ .01).
Discussion
This study examined TASER use in use of force incidents involving one officer and one member of the public, from 16 agencies in England and Wales between 2017–2018. Some results are in keeping with much, if not all, previous work. For example, the finding of a statistically significant relationship between both types of TASER use and mental health and ethnicity builds on previous work about the importance of these topics (e.g. Angiolini, 2017; Brandl and Stroshine 2017). The findings—that members of the public perceived to be Black or Black British have increased odds of TASER being drawn on them, but not of it being fired, and that members of the public perceived to be Asian or Asian British have decreased odds of both types of TASER use—broadly resonate with the prior multivariate literature (see Brandl and Stroshine 2017; Crow and Adrion 2011; Dymond, 2018; Gau et al., 2010). However, they do provide a contrast to findings from Worrall et al., 2021, which found that ethnicity was not significantly associated with TASER drawing (see also Riddell and Worrall 2021), and Johnson, who found no significant relationship between mental health and use of force.
They also broadly chime with analyses by the Home Office (2021) and the IOPC (2021). The Home Office (2021) calculated rates of TASER use for different ethnic groups by taking the number of times it was used on each ethnic group, and dividing by the number of people within each ethnic group for a given population, with rates shown relative to the White ethnic group. This analysis found that TASER use involved someone perceived as being from a Black ethnic group nearly 7 (6.9) times more often than someone perceived as being from a White ethnic group. When compared to the latter, the rate was 1.1 times more often for someone perceived as being Asian/Asian British, with a higher rate of drawing (1.21) but a lower rate of firing (of .91). The IOPC’s analysis of their independent investigations found that ‘Black people were, as a proportion, less likely to have been subjected to a TASER discharge… but were more likely to be involved in cases where the TASER was aimed or red dotted’ (IOPC 2021, p. 11), while Asian people were under-represented in their cases. It also found that ‘mental health was a common feature…(and) where mental health was a factor, people were more likely to be subjected to multiple and prolonged discharges’ and noted that ‘the intersectionality of race and mental health can increase the risk of higher levels of use of force’ (IOPC 2021, p. 10 – 11).
As well as underscoring the need to differentiate between minoritized ethnic groups, and between different types of TASER use, these results also remind us that a non-significant finding needs to be interpreted with care. After all many studies, including this one, compare incidents where TASER was fired to incidents where a different type of force was used – not to incidents where no force was used. If use of force as a whole is deployed disproportionately against certain population groups, such as ethnic minorities, and those with mental ill-health, and the firing of TASER is in keeping with this general pattern, then factors such as ethnicity would be relevant but would not be statistically significant. Hence a non-significant finding means that TASER use was no more or less disproportionate than other uses of forces rather than TASER not being disproportionate per se. This is particularly important in the context of a review of handcuffing by the Metropolitan Police which found that ‘the community, and in particular young black men, felt handcuffs were used disproportionately against them’ (Metropolitan Police, 2021). This important caveat needs to be born in mind not just when interpreting non-significant results – but also in discussing significant results and what these might mean.
While some of the Level 2 variables—especially those around organisational context and neighbourhood effects—were statistically insignificant, our results nevertheless indicate that organisational factors matter in multiple ways. Firstly, our finding that, as the proportion of use of force incidents where TASER was carried increased, the odds of it being drawn or fired decreased, had hitherto not been tested due to data limitations. This speaks to the importance of institutional policies around the deployment of the weapon and could indicate that, where officers are more frequently deployed with TASER, they and their colleagues come to see it as just another unremarkable ‘bit of kit’, have a better understanding of its limitations and are therefore less likely to use it (or to feel pressured to use it). Conversely, in forces that have fewer cases where officers are carrying the weapon, it may be seen as more unusual, as an exceptional bit of equipment. It may therefore be more likely to be seen as something that can ‘save the day’ and TASER trained officers who are accompanied by non-TASER trained colleagues may feel under pressure to use it (Dymond, 2021). However, for a fuller understanding of these results, it would be important to explore how often TASER is being carried when force is not used, as well as how many TASER officers had used the weapon previously.
Second, another finding of interest was the result that incidents where officers were single-crewed (as opposed to being accompanied by another officer who did not use force) had increased odds of TASER being fired by more than 80%. As few previous multivariate studies on TASER have looked at this variable in detail, explanations for this are limited - particularly because previous studies have tended to find evidence to the contrary (e.g. Brandl and Stroshine 2017). It is clear that further research is needed into the relationship between single crewing and TASER usage. This is particularly important as our analysis was limited to incidents where only one officer used force, and as some evidence suggests that TASER officers are more likely to be single crewed than officers without the weapon (Dymond, 2020). Nevertheless, this again points to the importance of agency-level policies (in this case, decisions around crewing) and their potential to impact use of force outcomes.
More broadly, in keeping with prior work on organisational factors, these results speak to the importance of capturing agency and organisational effects, where possible, as these have the potential to account for a large amount of variation of TASER use (with ICC calculations ranging from .60 to .64). This indicates that, when discussing police use of force and associated issues, it may not be sufficient just to look at individual officers and incidents; it is important also to look at the organisational differences in terms of systematic or structural issues. This, in turn, necessitates accessing data from a large number of police agencies. Indeed, despite accessing data from 16 forces in this study, we are conscious of the possibility that some of the Level 2 variables we included could be important, but were not identified as significant because of the small sample size. Overall, studies that are reliant on data from a single agency, and those with a limited number of agencies, may be less well placed to capture such variations than larger studies - in turn suggesting an avenue for future work.
Conclusion
This study has advanced our understanding of factors associated not just with the firing of TASER, but also the drawing of the weapon. It has also highlighted the importance of multi-level modelling and the need to capture agency and organisational level effects in use of force research; something that has traditionally been difficult given issues in accessing police data.
Considering both organisational and individual levels in any models seeking to understand police use of force is likely to be important theoretically, methodologically and practically. Particularly at a time when additional attention has been drawn to questions of police reform and reimagination, the situated or nested nature of police action raises important policy questions, most pertinently about where interventions and reforms should be targeted. While there can be a temptation to focus on officer level interventions (e.g. training, misconduct), if there are important sources of variation in the use of force at the agency level, then that could point to towards the need to focus attention on more structural and systemic issues
Nevertheless, several limitations should be noted, pertaining both to the general difficulties and issues associated with analysing use of force data—for example, reliance on officer reported data, which has inherent limitations (Rojek et al., 2012) and the likely under-reporting of some use of force incidents —as well as issues pertaining to the specific data used here.
As this was the first year the reporting framework was introduced, the data gathered was designated as ‘experimental’. It is likely some initial data collection issues were experienced as agencies, and officers, became used to the new requirement (see also Home Office, 2022; Quinton et al., 2020). Moreover, despite the introduction of a national system, there was some variation in how TASER use was captured between agencies which meant it was not possible to split the category of ‘fired’ down further. It should also be noted that some agencies had a high rate of TASER use whenever officers reportedly carried TASERs. This might suggest officers did not report carrying TASERs if they did not use them, and might help to explain the large amount of explainable variation at Level 2. Furthermore, while we appreciate that use of force incidents are ‘nested’ in officers, we were not able to use this approach, due to difficulties in accessing data. These issues point to some initial implementation issues and opportunities for further standardisation in future.
Further, as noted above, the focus here has been solely on issues involving one officer and one member of the public. This is an important limitation in its own right, but is especially noteworthy here due to research which indicates that disproportionate policing may be more pronounced in group settings, with Cooley et al. (2020: 761) finding that
This issue also highlights the need for changes to data collection to support more comprehensive analysis. Firstly, it would be useful for individual use of force records to specify how many officers used force on the member of the public; to specify how many members of the public were subject to force; and to be linked when they related to the same incident. Secondly, it would be helpful to have further information on the order in which force is used, 12 and to clarify whether assaults, injury and resistance occurred before, after or while a particular tactic was used. Third, requiring greater specificity about the location in which the use of force took place would allow for a more nuanced and detailed consideration of neighbourhood effects. Finally, it would be helpful to be able to look at situations that had the potential for force to be used, but were resolved without it. This was not possible in the current data set as it was concerned only with situations where force was used – a commonly noted limitation in studies of this type – but would be an interesting area for future work.
Overall, despite these points for improvement, this study helps to demonstrate the benefits and insights that can come from collecting and analysing use of force data. We would urge other jurisdictions, where use of force reporting may not be as widespread, to follow the lead of England and Wales in this regard. Systematically collecting and publishing such data, including where weapons are drawn but not fired - and acting on the results of the analysis where necessary - is critically important to police-public relations perhaps now more than ever.
Footnotes
Acknowledgements
The authors would like to thank Rebecca Teers for her invaluable contribution, while at the College of Policing, to the data preparation, planning and analysis which informs this article. We would also like to thank the members of the NPCC use-of-force recording programme board for supporting the research, especially Deputy Assistant Commissioner Matt Twist and Inspector Nicholas Sutcliffe, and all participating forces for preparing and sharing their data. Further thanks to Emma Mallet and Pete Carlyon (interns at the College of Policing) and Kay Powell, Xena Kaur Stewardson and Catharine Galley (students at the University of Exeter) for their help cleaning and recoding the data, as well as Dr. Louise Porter (Associate Professor at Griffith University) and Professor Ben Bradford (University College London) for helpful comments on planned analysis and early drafts. This work was supported by the Economic and Social Research Council (grant number ES/N016564/1). Responsibility for any errors is the authors’ own. For the purpose of open access, the author has applied a ‘Creative Commons Attribution (CC BY) licence to any Author Accepted Manuscript version arising’.
Declaration of Conflicting Interests
The author(s) declared the following potential conflicts of interest with respect to the research, authorship, and/or publication of this article: The first author received travel costs from Taser International (now AXON) between the 2nd and 8th November 2014 to present their research to the Senior Management Team at the company headquarters in Scottsdale, Arizona, and to attend the Annual Conference of the Institute for the Prevention of In Custody Deaths. At the time of submission she is a researcher on the ‘TASERD’ project (full title: Taser And Social, Ethnic and Racial Disparities (TASERD) research programme, bid name: An independent research programme on the causes of ethnic/racial disparities in the police use of Taser) commissioned by the College of Policing, and funded by the NPCC and MOPAC. For the avoidance of doubt, the research for this paper was undertaken prior to the latter project and is distinct from it.
Funding
The author(s) disclosed receipt of the following financial support for the research, authorship, and/or publication of this article: This work was supported by the Economic and Social Research Council (grant number ES/N016564/1). For the purpose of open access, the author has applied a ‘Creative Commons Attribution (CC BY) licence to any Author Accepted Manuscript version arising’.
Disclaimer
The views expressed in this paper do not necessarily represent those of the College of Policing.
Data Access Statement
Further information on the dataset used and findings of this study may be available on request from the corresponding author, A.D. The data are not publicly available due to their containing information that could compromise the privacy of research participants.