
Abstract
Most victims’ cases are not progressed through the criminal justice system, which is a phenomenon linked to low satisfaction with police performance. Little is known about how police can fairly and effectively “let victims down.” One mechanism is a call-back, which is prevalent in other professions but less so in policing and could be applied specifically for victims who experience case attrition at early stages. By proactively contacting victims following their initial report, the call-back may offer reassurance and lead to improved levels of satisfaction. We tested this approach with 1326 victims of vehicle and bicycle crimes in a block randomized controlled trial in London, UK. Based on follow-up telephone surveys, the findings suggest that a reassurance call-back policy increases the satisfaction of bicycle theft victims by 5%–15%, but not for victims of vehicle theft, who are largely unaffected by the call-back. The findings are likely driven by the victims’ expectations: vehicle theft victims expect their reported cases to progress through the justice system, whereas bicycle theft victims do not; thus, the former remain as disappointed as the participants who did not receive a call-back. These findings are promising, as they offer a new tool for policing that can provide more care to victims of crime.
Keywords
Introduction
The overwhelming majority of police reports do not make it to court, and most service calls are given the status of “no further action” (Office of National Statistics, 2021). This is a shared reality across the globe, as evidentiary obstacles, public interest considerations, and policy guidelines all lead to “many victims get[ing] little or no further communication from the police or any other CJS [criminal justice system] agency after they report their crime” (Victim Support, 2011; see also Neyroud & Disley, 2007).
However, we know very little about these victims and what can be done to enhance their perceptions of the police. National survey data on victims who were given some level of police service suggest that in 27%–43% of incidents, they are dissatisfied with the police (Crime Survey for England and Wales, 2021: Table S14). Yet the perceptions of victims who are left unattended are presently unknown, even though they form the majority of police-public contacts. We can assume that victims who received little or no service beyond the initial report would be less satisfied by both the process as a whole and the outcome of the attrition than victims who received some level of care (see Strang et al., 2013).
Victim satisfaction is vitally important to future crime reportage and police legitimacy. Regardless of the outcome, when victims are satisfied with their interaction with law enforcement, they may be more likely to report future crimes given their prior positive experience (Bradford, 2010; Jackson et al., 2012; Lee et al., 2019). Victim dissatisfaction may result in an unwillingness or perception of futility when reporting crimes in the future. As such, it is in the interest of law enforcement to improve victim satisfaction as this might yield better rates of crime reportage in the future. Thus, police legitimacy is at least partially contingent on how victims perceived their experience with law enforcement (Jackson & Sunshine, 2007; Skogan, 2006): Victims that are satisfied with their treatment and the overall reportage process and feedback are more likely to view law enforcement as more legitimate.
One possible mechanism that could increase the satisfaction of victims who encounter the police is a “call-back” policy, which involves actively engaging with people after their initial contact, regardless of their case status. In other professions, a call-back policy is part of standard care. For instance, patients are routinely re-contacted, not only to inquire whether anything else can be done with their medical issues, but also to collect information that can be subsequently used to enhance the level of service. Multiple surveys suggest that using a call-back policy leads to higher satisfaction and a greater willingness to engage with the service-provider (D’Amore et al., 2011; Guss et al., 2013; Jones et al., 1988; Krishnan et al., 2015).
Presently, however, call-backs are not routinely conducted in policing. We hypothesize that if police officers call victims back, it will increase satisfaction rates because it gives victims a sense of reassurance (Bahn, 1974). A reassurance call-back signals to victims that even though they will not “see justice” in court, they have not been deserted by the police. Substantively speaking, this is of course true: every contact with victims leaves data points that can be analyzed to improve our understanding of crime patterns, even when a suspect was not apprehended (Ariel et al., 2019). Importantly, from a victim’s point of view, a call-back signals that they matter and that their reporting was not done in vain because their incident can lead to the prevention of future crime (see for example, Black & Lumsden, 2019; Lum et al., 2021, p. 22).
We tested this hypothesis under controlled conditions. We asked whether a reassurance call from a police officer improves the overall satisfaction of victims in cases where investigations into a report had been closed following its initial disclosure to the police. We used two of the most common crime reports that normally do not progress beyond a “desk investigation”: vehicle crime and cycle theft. A total of 762 vehicle theft victims and 564 cycle theft victims were then randomly assigned to treatment and control groups. While all participants received the standard service given to victims of crime, those in the treatment group also received the call-back. All participants took part in a double-blind survey to assess their satisfaction with the handling of their crime report.
Literature Review
Victim Satisfaction With Police Performance
Confidence, trust and satisfaction are terms that are often used together as a concept within the policing world, but each have different nuances and interpretations. Whilst being clearly interlinked with each other, it is nevertheless important for police leaders to understand that there are differences between them. The majority of the public generally have little contact with the police and so confidence and trust are often driven by factors outside the direct control of police agencies. As such, confidence and trust are broad, global concepts (Luhmann, 1988). In contrast, satisfaction is derived from the direct experience of the individuals themselves (Jackson & Sunshine, 2007; Skogan, 2006). Satisfaction is, therefore, an area where the police as an organization, through the actions of individual officers or staff can directly affect the experience of those they engage with and therefore affect their levels of satisfaction with those actions (Avery et al., 2020; Bradford et al., 2009).
In terms of citizen-initiated contact, the majority of these engagements take the form of reporting crime as a victim to the police (Jackson et al., 2012). It follows, therefore, that victims who report a crime are likely to have their satisfaction with police shaped by the experience that they have in this crime reporting and immediate subsequent investigation process. In turn, this may provide an experiential foundation for their wider perceptions of satisfaction with policing.
There is, however, an unfortunate and demonstrated link between victim initiated contact and subsequent negative views of satisfaction with the police (Bradford, 2010; Jackson et al., 2012; Lee et al., 2019). The magnitude of this negative effect appears to be dependent on how the victim rate the service offered by police forces (Bradford et al., 2009; Laxminarayan et al., 2013). This is a concerning fact, and one that police forces can address by taking effective steps to improve the quality of service they provide, and by ensuring fair treatment of victims as part of a wider victim support strategy. If police agencies can accomplish this, and notwithstanding the benefits this may bring to individual victims, they may well be able to positively influence wider views of police performance among victims of crime (Bradford, 2010). When victims expereince higher levels of satisfaction with police, they, in turn, are more likely to report improved wider confidence from that contact (Bradford et al., 2008). Conversely, the opposite is true: victims left dissatisfied about their reporting experiences are likely to spread the negative perceptions within their social networks, potentially damaging confidence and trust in the police more broadly (Goudriaan, 2006).
These mechanisms are at play even though the law requires that police forces maintain “acceptable standards” of victim care (Ministry of Justice, 2015); however, these requirements are largely limited to crimes that warrant further investigation or that involve risk factors such as hate crimes or domestic abuse (Crown Prosecution Services, 2021). The majority of crime victims do not fall into these categories and will not engage with law enforcement personnel beyond the initial reporting procedure. UK police forces received 26.6 million calls to 999 and 101 call centers in 2018/19 (Policing Insight, 2020), but the number of recorded crime offenses was 5,965,216 for the same period (Office of National Statistics, 2021). Victims of crime generally have a brief and, at best, transactional conversation with a police employee when giving their report (Jackson et al., 2012). The number of crime victims in London who reported being satisfied with how the police handled their investigation has fallen from 77% to 67% between 2017 and 2020, which is based on data collected from victims whose cases progressed in the judicial system. The overall satisfaction of volume crime victims who reported the crime online or by phone was 42% (MOPAC, 2020b), and most of these crimes did not receive any level of care beyond the first report.
To emphasize, members of the public generally have little contact with law enforcement, so public confidence and trust are driven by factors that are outside the direct control of police agencies, like the media, vicarious experiences, or cultural values (Luhmann, 1988; Donner & Olson, 2020; Fielding & Innes, 2006; Hinds & Murphy, 2007; Murphy & Barkworth, 2014). In contrast, satisfaction rates are based on a person’s direct experiences with law enforcement (Jackson & Sunshine, 2007; Skogan, 2006), so public satisfaction is an area that is directly affected by the actions of a police organization and its personnel (Avery et al., 2020; Bradford et al., 2009). Importantly, the majority of citizen-initiated contact with law enforcement occurs when a crime is reported (Jackson et al., 2012). It then follows that the satisfaction of victims who report crime is shaped by the reporting and subsequent investigation process; however, there is a demonstrated link between victim-initiated contact and dissatisfaction with law enforcement (Bradford, 2010; Jackson et al., 2012; Lee et al., 2019). The magnitude of this dissatisfaction is dependent on the services that officers provide (Jackson et al., 2012) and the manner in which they treat citizens (Bradford, 2010; Bradford et al., 2009; Langley et al., 2021; Laxminarayan et al., 2013; Tankebe, 2009).
When reflecting on their attitudes toward police, victims of crime voice a desire to be treated fairly (Bottoms & Tankebe, 2012; Bradford, 2010; Hinds & Murphy, 2007). This sense of fairness is intimately tied to victim satisfaction. Tankebe (2014) has highlighted four factors that aid in creating and sustaining police legitimacy: lawfulness, effectiveness, procedural justice, and distributive justice. With respect to procedural justice, victims have consistently reported that “solving the case” is not the most important factor in determining their level of satisfaction (see also Hinds & Murphy, 2007; Mazerolle et al., 2013). Moreover, given Britain’s 7.8% solvability rate, the detection and conviction of offenders simply does not usually occur (BBC, 2019; Coupe et al., 2019). The way that police spoke to and engaged with victims was often a more important factor when it came to whether or not a victim experienced a sense of fairness (Bradford et al., 2008; Elliott et al., 2012; see more broadly in Jonathan-Zamir et al., 2015). In fact, a study of Ombudsman outcomes in Germany demonstrated that participants expressed positive views of the process even when decisions were not made in their favor (Bradford & Creutzfeld, 2018).
Victim Satisfaction and Volume Crime
The sheer number of recorded crimes makes focusing on individual victims and improving their overall satisfaction a challenging task. While many police organizations have increasingly prioritized the focus on high-harm offenses (Dudfield et al., 2017), this approach has diminished their performance with respect to low-level volume offenses (Jansson, 2005). This is typified in London given the extent of high-volume crime in the city and the corresponding reduction in victim satisfaction (MOPAC, 2020a; MPS, 2020c). While reviewing the literature on the management of volume crime, Jansson (2005) suggested that improvements to initial responses to volume crime calls were a potential means of improving overall performance outcomes.
Though this is a desirable goal, a tightening of public funds has meant that many forces begrudgingly curtailed these types of activities in order to focus on threat, harm, and risk (HMIC, 2014). The London Metropolitan Police Service (MPS) has increasingly relied on online crime reporting. This transition involved the adoption of a standard “Crime Assessment Policy” that explains what crimes will be closed following an initial investigation procedure in an attempt to minimize personal contact with victims (MPS, 2017). In the 3 years since the initial adoption of this policy, there has been a 10% drop in victim satisfaction (MOPAC, 2020b).
Telephone Call-Backs to Improve End-User Satisfaction
A number of studies have demonstrated that focused follow-up contact with victims can reduce some adverse effects of victimization (Chenerey et al., 1997; Forrester et al., 1988; Shapland & Hall, 2007). This practice also improves victim satisfaction; however, previous studies on follow-ups with victims took the form of personal visits, which is too resource intensive for many organizations.
Curiously, few criminologists have examined how effective telephone follow-ups are at improving victim satisfaction. Older studies have examined victim re-contacts (Turner, 1981) and call-backs for reassurance (Skogan & Wycoff, 1987), and a study of fraud victimization found that those who received telephone support after reporting a crime felt greater satisfaction and a reduced propensity for repeat victimization (Cross et al., 2016; see also Green et al., 2020; van de Weijer et al., 2020); however, we are not aware of any controlled experiments that rigorously tested telephone follow-ups in relation to volume crimes, and specifically the majority of reports whose investigation was never initiated or discontinued after the initial report.
This lack of research is unparalleled in other disciplines. A study of post-operative day-surgery patients found that patient satisfaction and, consequently, health outcomes were improved through follow-up telephone contact (Daniels et al., 2016). Nurse-led call-backs to sleep apnea patients resulted in higher levels of patient satisfaction coupled with increased resource efficiency (Walijee et al., 2020). Patient telephone follow-ups were found not only to be as effective as personal follow-ups in securing patient satisfaction but were easier to handle from both a managerial and logistical perspective (Mathew et al., 2017; D’Amore et al., 2011; Guss et al., 2013; Jones et al., 1988; Krishnan et al., 2015). The healthcare sector has demonstrated that follow-up telephone contact can be beneficial and yield improved satisfaction for minimal additional resources. Whether the same is true in policing is presently unclear.
Methods
Design
Posttest-only controlled group design (Ariel et al., 2022; see also Campbell & Stanley, 1963: 25) 1 was used to estimate the impact that a reassurance call-back policy has on victim satisfaction. This involved a two-block model with a pre-screened sample of 1326 vehicle crime and cycle theft victims. Participants were randomly allocated into treatment and control groups in both blocks. Block A consisted of victims of motor vehicle crime, while Block B consisted of victims of pedal cycle theft. By placing victims into distinct blocks based on crime type, the inter-block variability was assumed to be lower than the intra-block variability, therefore increasing the precision of the test – and crime types are often used as blocking criteria (Ariel & Farrington, 2010).
Participants
Participants were victims who had notified the police of a crime over a 10-week period between August 8, 2020, and October 17, 2020, with reports that had not been “screened in” for further criminal investigation. This trial focused specifically on two types of crime that are often closed without further investigation beyond an initial assessment: motor vehicle crime and pedal cycle thefts. Motor vehicle crime includes theft from a motor vehicle, theft of a motor vehicle, criminal damage to a motor vehicle, and criminal attempts connected to the previous three offences. Pedal cycle thefts include theft of cycles and criminal attempts connected to cycle theft.
We note that the COVID-19 pandemic had an impact on crime levels in the months preceding the trial, with recorded crime levels falling by up to 32% between March and May 2020 during the first national lockdown (Stripe, 2020; see also Nivette et al., 2021); however, by the time the trial began, the effects of the lockdown had largely dissipated as crime rates returned to levels comparable to the previous year (MPS, 2020a; see also Buil-Gil et al., 2021).
All reported crimes took place in the London boroughs of Camden and Islington. This constitutes the Met’s Central North Basic Command Unit (CN BCU). Camden and Islington have significantly higher crime rates when compared to other areas of London and almost double the rate per thousand than the average in England and Wales (ONS, 2018). CN BCU has significantly higher levels of cycle thefts than the London average as well, and while Islington’s levels of vehicle crime are in line with the rates seen in most other London boroughs, levels of vehicle crime are slightly higher in Camden than they are in other areas of the city (MPS, 2020a).
All crimes were reported by victims in person, online, or via telephone. While this study does not examine the method of reportage, it does query victims on their satisfaction with the reporting process. It is important to note that the method of reportage might affect the expectation of service on the part of the victim. This is a clear limitation that we were not able to adequately address as data on the method of reportage was not readily available for analysis. Once the crime was recorded, it was allocated a unique ID and a decision was made as to whether the crime would be screened for further investigation. This was based on a set of solvability factors established by the Met’s Crime Assessment Policy (MPS, 2017). Crimes that were screened “in” for further investigation were passed to an investigating officer, who was charged with making contact with the victim and progressing the matter further, but these cases were not part of the present trial.
Interventions
Once a crime had been reported, seven to 10 days were allowed to pass in order to allow a screening decision to be made. For all crimes screened “out” from further investigation, the police generate a standard letter to all victims that confirms the crime has been reported and informs them that no further investigation will be conducted due to either a lack of evidence, lack of public interest, or the Met’s Crime Assessment Policy (MPS, 2017). Once this letter is dispatched, the case is closed unless new information emerges that warrants re-opening the crime report. Thus, all the participants in the treatment and control groups received the standard service offered by the Metropolitan Police Service.
At this point, treatment participants received a reassurance telephone call from locally-based officers. During the call, the officer offered to provide an update on the investigation, reassured the victim that the police were aware of the case, thanked the victim, and, where appropriate, gave crime prevention advice. The officers were trained to tailor their conversations to the victims and exhibit empathy. Because of this, these phone calls were not based on a formal script. Officers were instructed to make at least three attempts to contact victims between 8:00 a.m. and 9:00 p.m. and were instructed not to tell them about the trial or survey process in order to avoid affecting the treatment.
Outcomes
To gauge the effect of the intervention, victims from both the treatment and control groups were surveyed using a double-blind protocol (i.e., the surveyors had no knowledge who received which treatment or standard of care, and the victims did not know they were participating in an experiment). During these telephone surveys, participants were asked a series of questions about their level of satisfaction with respect to the service that they received from the police. Items were drawn from existing MOPAC (Mayor’s Office for Policing and Crime) victim satisfaction surveys (MPS, 2020c) and consisted of a mixture of nine 3- and 7-point Likert Scale questions (instrument in Supplementary Materials A). These items drive public performance data for the MPS in terms of victim satisfaction and confidence measures (MOPAC, 2020b), and this set of questions was selected because it allowed for a comparison with the existing MOPAC data and allowed for later replications.
Sample Size and Randomization
All eligible cases were included in the study. Block A (vehicle crime) consisted of 762 victims, with 371 in the treatment group and 371 in the control. Block B (pedal cycle theft) included 564 victims, with 284 in the treatment group and 280 in the control group. Within Block A, 126 (32.2%) victims in the treatment group and 147 (39.6%) in the control group completed the survey, and in Block B, 126 (44.4%) victims in the treatment group and 102 (36.4%) in the control group completed the survey, respectively. The CONSORT flowchart for each block is shown in Figure 1(a) and Figure 2(b). (a) CONSORT Flow Chart - Block A (vehicle theft). (b) CONSORT Flow Chart - Block B (cycle theft). (a) Standardized relative changes: Control (left) versus Treatment (right) Conditions - Block A (vehicle theft). (b) Standardized relative changes: Control (left) versus Treatment (right) Conditions - Block B (Cycle theft).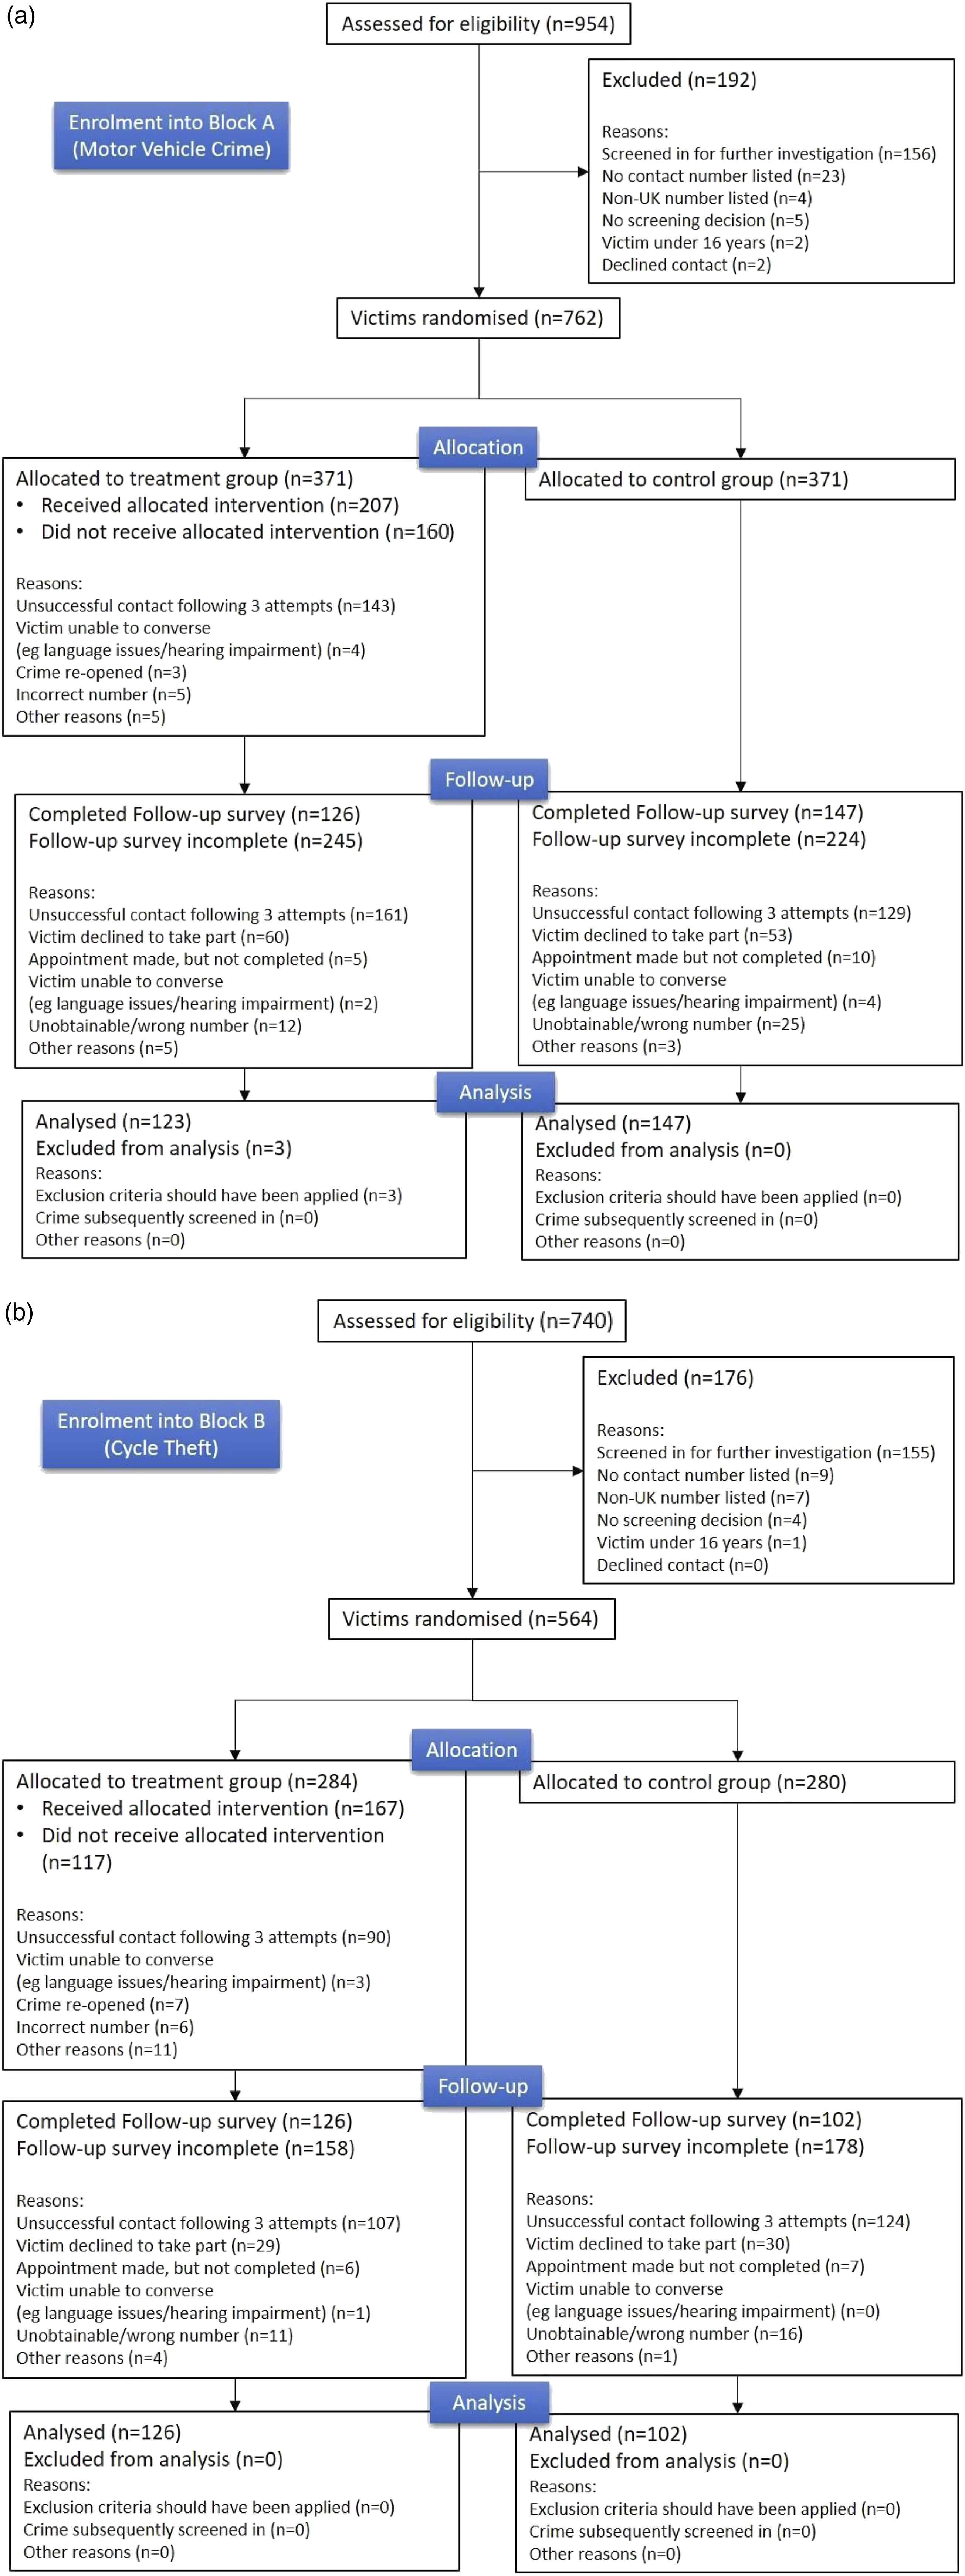
Statistical Methods
Descriptive analysis consisted of calculations of the mean and standard deviation as well as a summary of the participants’ demographic characteristics. Independent sample t-tests were conducted to measure the differences between the treatment and control groups within blocks A and B, as this test is the most optimal for our overall design (Campbell & Stanley, 1963, p. 26). For an estimation of the magnitude of the difference, we calculated the standardized relative changes using the mean scores and their associated 95% confidence intervals (CI), such as that

It is important to note one important limitation in our methods. As there is some variability between the treatment and control groups when controlling for age and first victimization, these comparisons are not perfectly even. As such, potential differences between these groups might be attributed to differences in differential factors.
Results
Participants
Sample Characteristics.
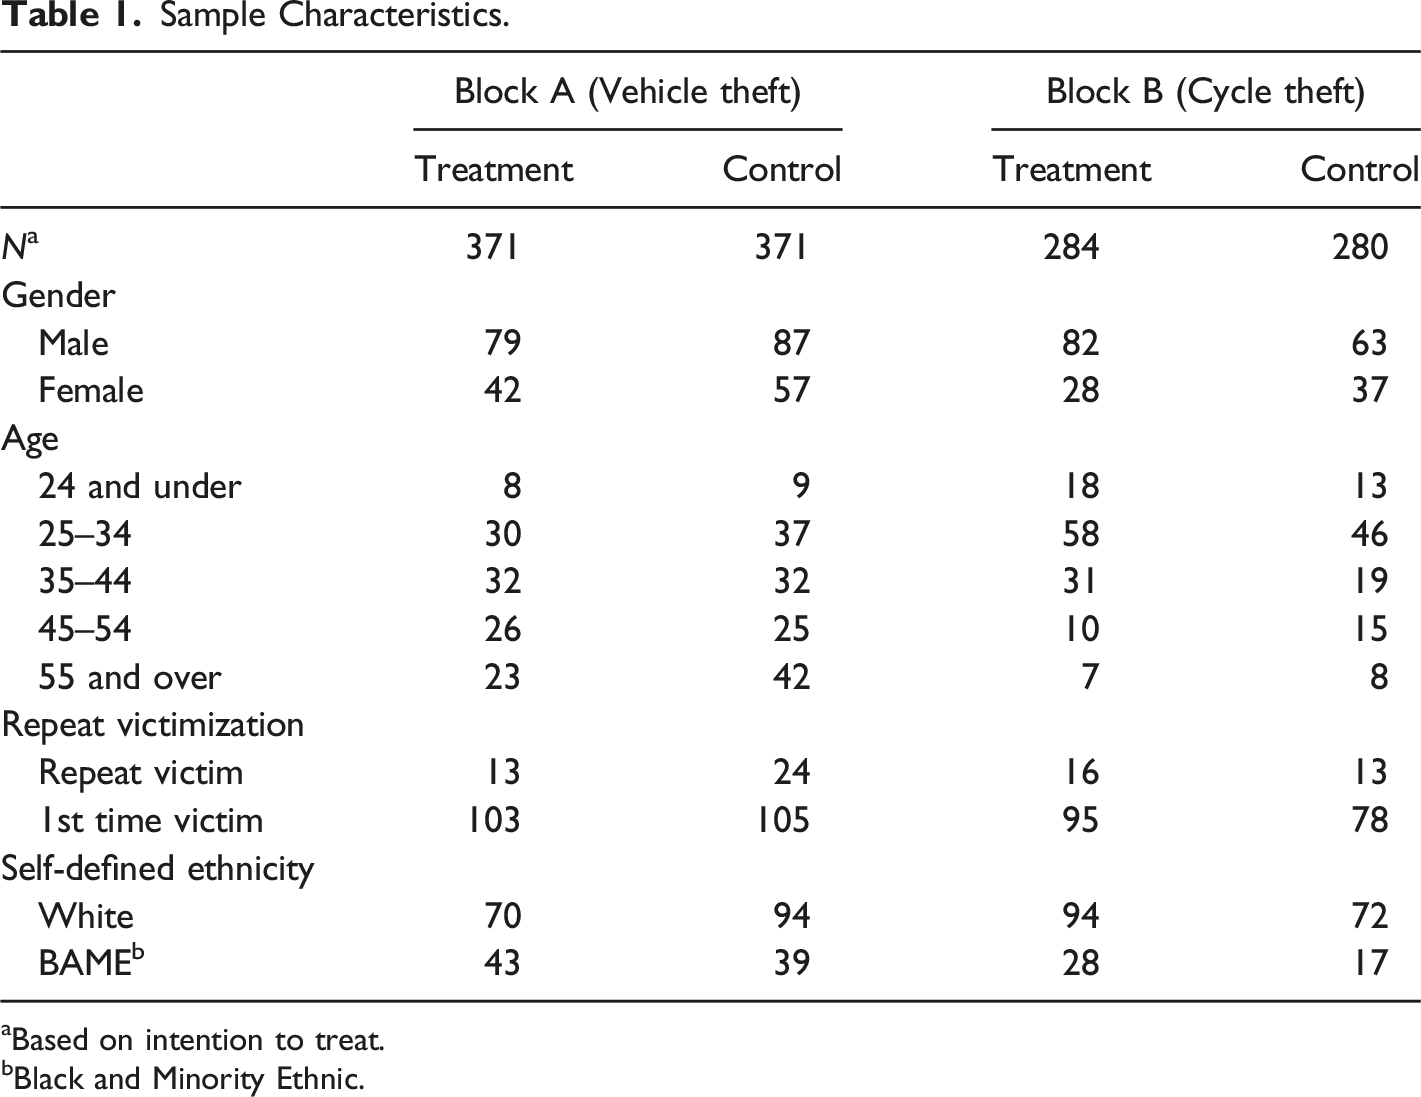
aBased on intention to treat.
bBlack and Minority Ethnic.
Gender
Male victims were disproportionately represented in the sample, which is reflective of the increased likelihood of victimization for males across most crime types (ONS, 2018). Block A consisted of 169 (62.6%) males and 99 (36.6%) females, with 2 (0.7%) participants declining to share their gender. The Block A control group had 88 (60%) males, 57 (39%) females, and 2 (1%) participants whose gender was unknown. The treatment group included 81 (66%) males and 42 (39%) females.
Block B consisted of 145 (63.6%) males and 79 (34.6%) females, with the gender of 4 (1.8%) participants being unknown. Whereas the Block B control group had 63 (62%) males, 37 (36%) females, and 2 (2%) participants whose gender was unknown, the Block B treatment group included 82 (65%) males, 42 (33%) females, and 2 (2%) participants whose gender was unknown.
Age
Overall, the victims who participated in the trial were M = 39 years old (SD = 14.47); however, the average age was 44 (SD = 14.73) in Block A and 35 (SD = 11.08) in Block B. Given the nature of the crime types, this difference in age distribution between the blocks is unsurprising.
Repeat Victimization
The sample was comprised of 37 (13.7%) and 29 (12.7%) of victims in Blocks A and B who were victimized in the 12 months prior to their present crime report, respectively. With an overall crime rate in the participating boroughs of approximately 121 crimes per 1000 people, these levels of repeat victimization would appear to be broadly proportional to those that would be expected. Within Block A, 24 (16%) of the participants in the control group and 12 (12%) of the participants in the treatment group were repeat victims. In Block B, 13 (12.7%) and 16 (12.7%) of the participants in the control and treatment groups reported being victimized in the past 12 months, respectively. The randomization process generated treatment and control groups that were relatively balanced when compared with the repeat victimization levels for the overall trial population.
Ethnicity
Analysis of white versus Black and Minority Ethnic (BAME) victims reveal disproportional rates of victimization. In Block A, white and BAME victims constituted 164 (61%) and 82 (30%) of victims, respectively. 24 (9%) participants declined to define their ethnicity. This difference was more pronounced in Block B, where 167 (73%) and 45 (20%) of victims defined themselves as white and BAME, respectively. Only 16 (7%) declined to define their ethnicity. This breakdown is similar in the treatment and control groups. In the Block A control group, white, BAME, and participants of unknown ethnicity accounted for 94 (64%), 39 (27%), and 14 (10%) victims, respectively. In the Block A treatment group, there were 70 (57%) white, 43 (35%) BAME, and 9 (8%) participants of unknown ethnicity that were victims. In the Block B control group, white, BAME, and participants of unknown ethnicity accounted for 95 (75%), 17 (17%), and 13 (13%) victims, respectively. In the Block A treatment group, 95 (75%) white, 28 (22%) BAME, and 3 (2%) participants of unknown ethnicity were victims.
Outcomes
Reassurance Call-Back Policy Versus Standard Victim Care (Survey Items’ Means, Standard Deviations, t-Test Scores, and p-Values).
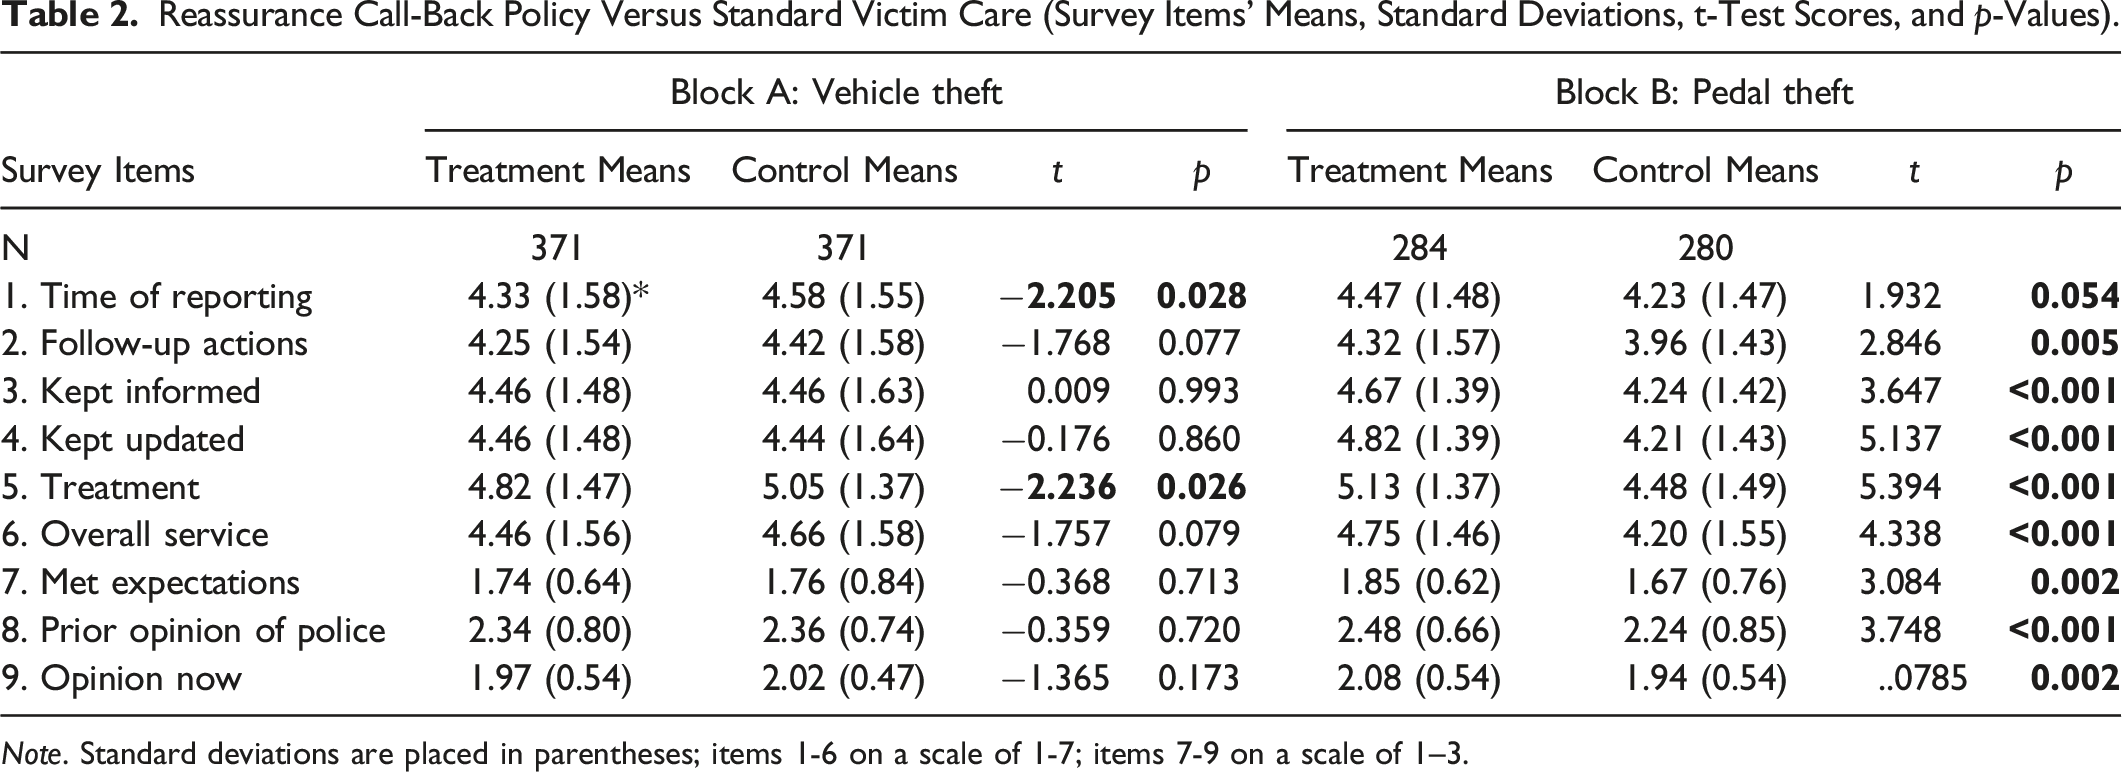
Note. Standard deviations are placed in parentheses; items 1-6 on a scale of 1-7; items 7-9 on a scale of 1–3.
In terms of vehicle theft, victim satisfaction did not differ between the treatment and control conditions, except with respect to time of reporting (t = −2.205, p < .05), which appears to go against the hypothesis, and the police treatment item (t = 2.236, p < .05), which provide evidence in support of the experiment hypothesis. Overall, however, the treatment did not increase victim satisfaction in relation to vehicle theft in commonly accepted statistical significance thresholds, and the evidence demonstrates a propensity for negative, or at the very least negligible, treatment efficiency.
The opposite, however, is the case for cycle theft (Block B). The intervention yielded statistically significant differences between the treatment and control groups, with victim satisfaction being higher in the treatment group across all comparisons, although item 1 (time of reporting) was marginally significant (t = 1.932 p = .054) in the hypothesized direction. Overall, the treatment condition led to an improved perception of satisfaction insofar as the victims of cycle theft are concerned.
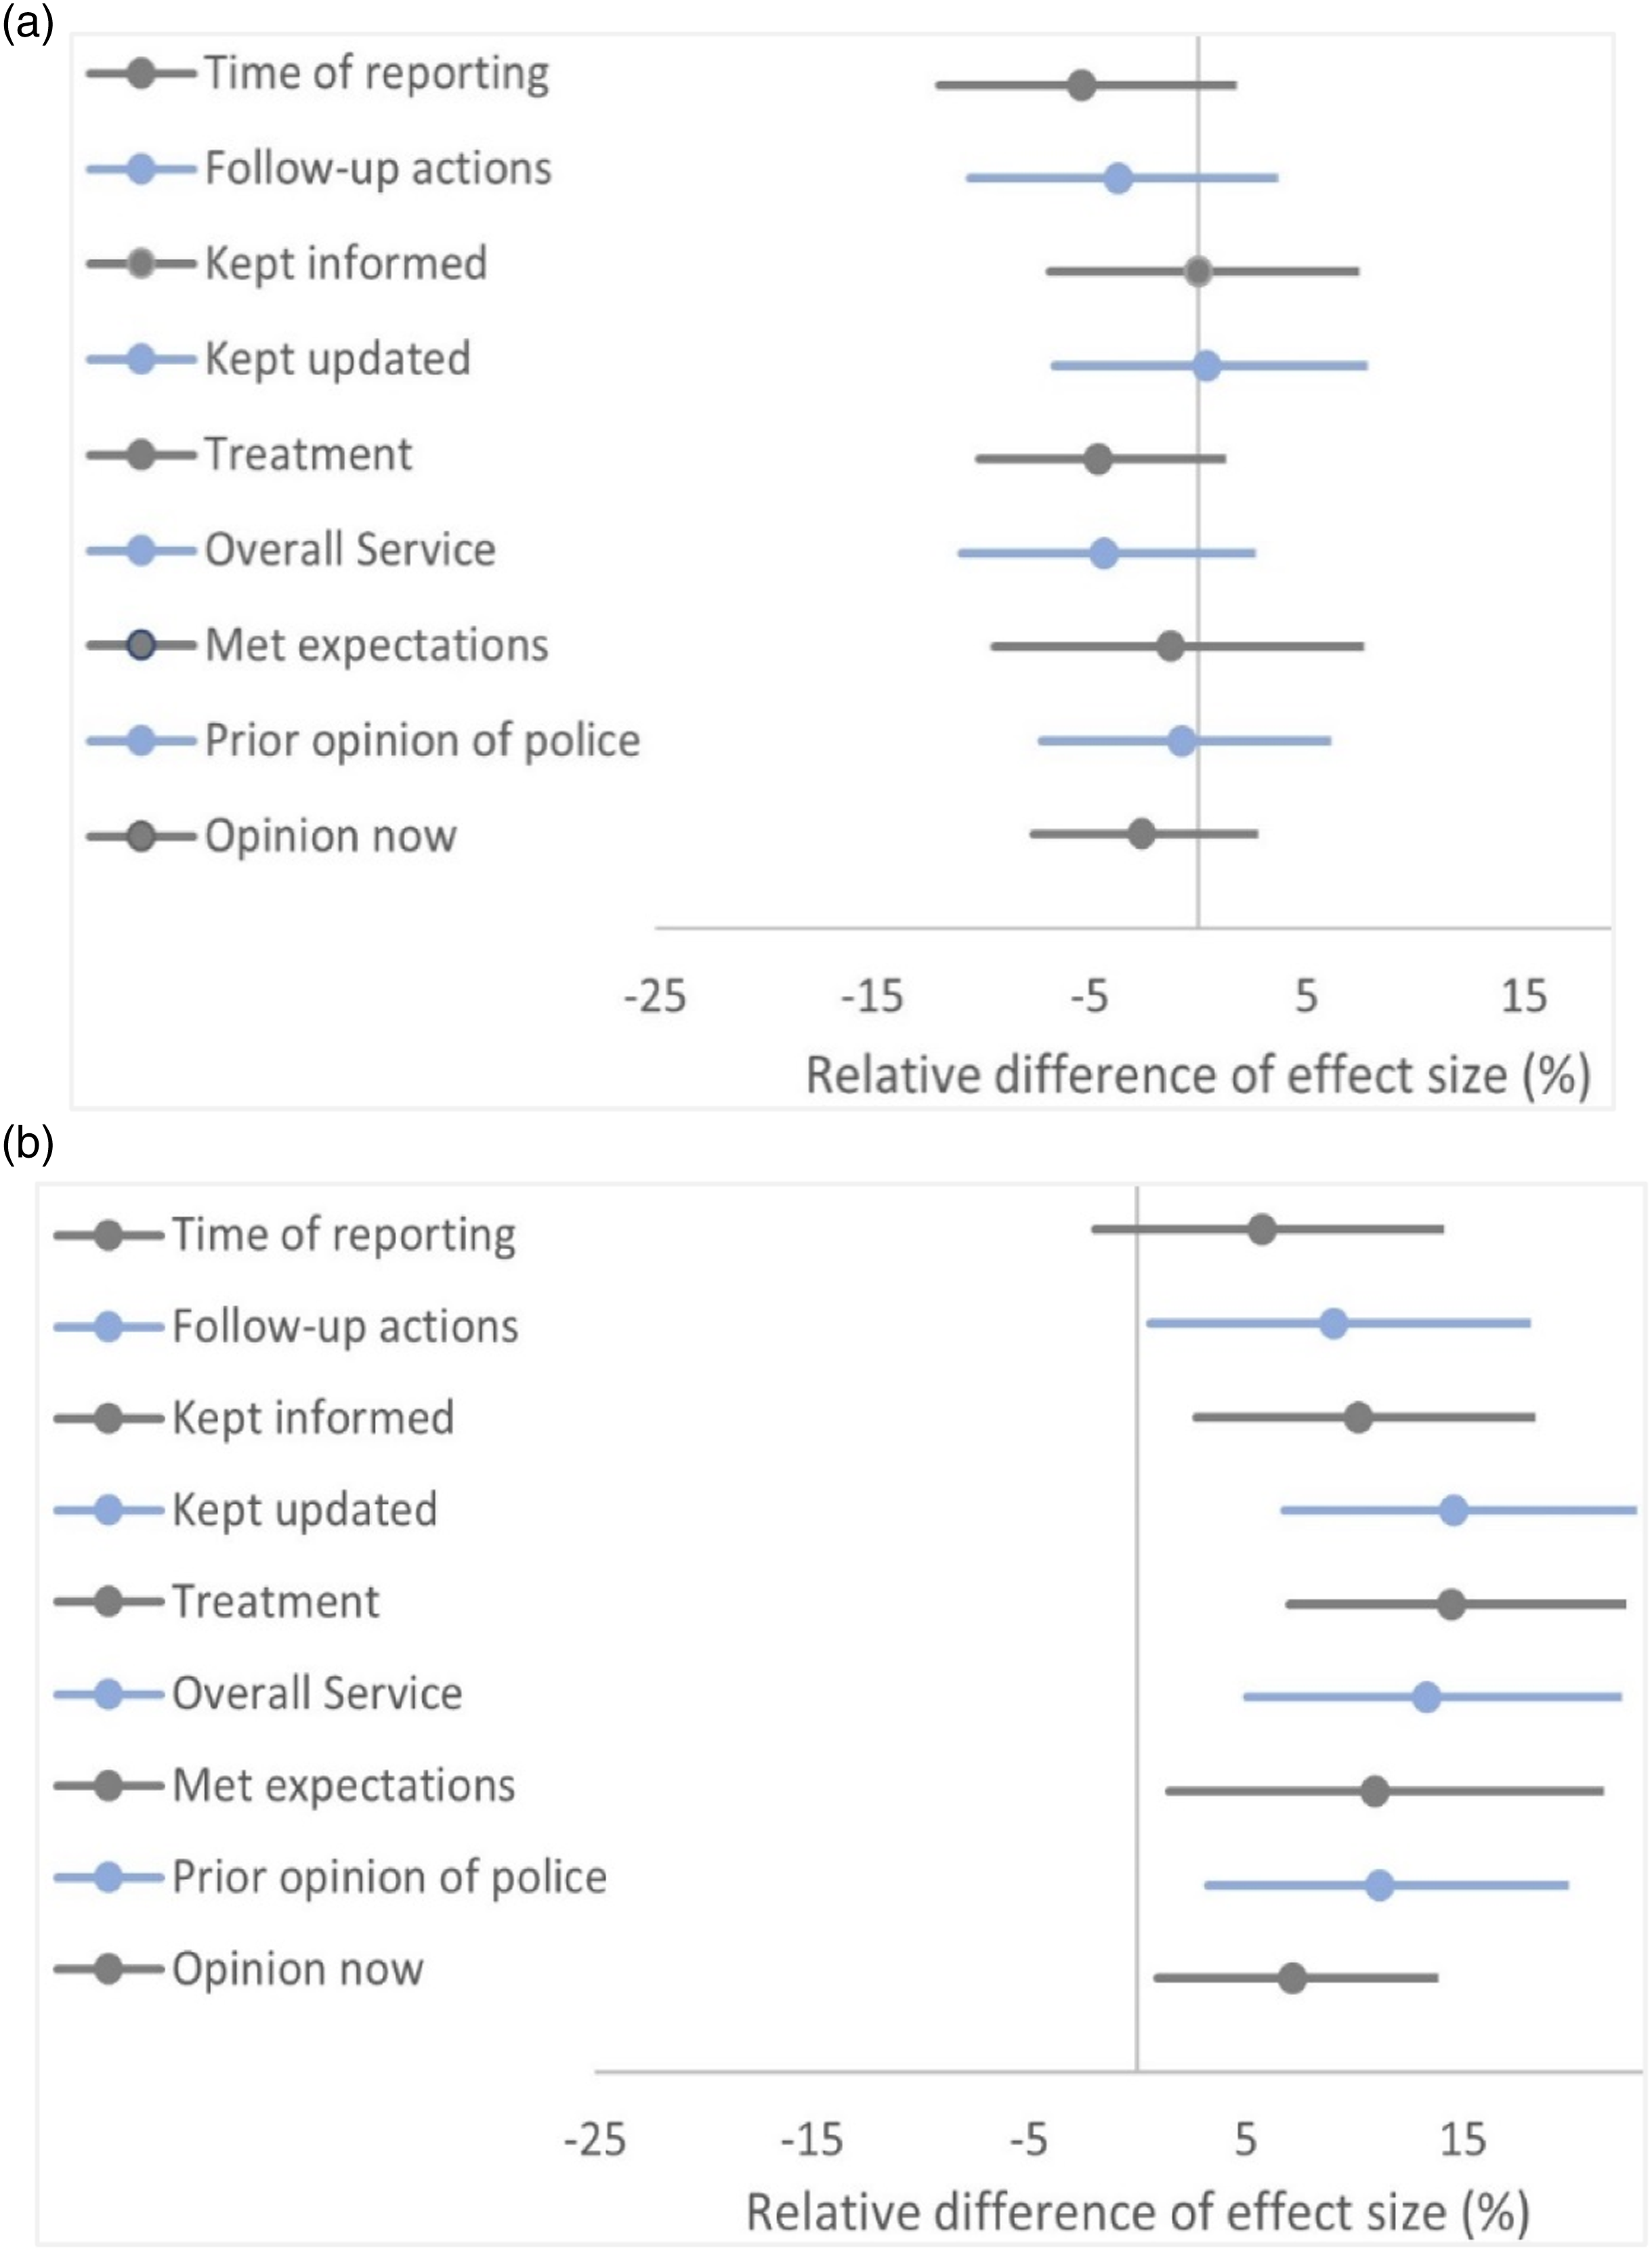
Figures 2(a) and 2(b) plot the percentage changes between the treatment and control groups where 0% represents no change in the effect size between the groups and negative effect sizes suggest enhanced satisfaction in no-treatment conditions. The confidence intervals are also presented. As shown, the reassurance call-backs improved the satisfaction of cycle theft victims (Block B) by 5%–15% but marginally reduced the satisfaction of vehicle theft by up to 5%.
Discussion
Based on the findings of this study, reassurance call-backs to victims of volume crime can influence victim satisfaction; however, it is also clear that the nature and magnitude of the effect differs depending on crime type. This supports Kumar’s (2018) argument that the type of reported crime may have a direct influence on the levels of satisfaction experienced by victims. To an extent, victims of cycle theft felt greater satisfaction when they received a follow-up call. In some cases, the effect size equated to as much as a 15% improvement in responses relative to the control group; however, the same could not be said for victims of vehicle crime, where effects appeared negligible at best and at times went against the hypothesized outcome.
Linking Victim Satisfaction to Victim Expectations
A potential explanation for this appreciable difference between these crime types lies in differences in expectations among victims of crimes. When considering the impact of victim expectations, Chandek and Porter (1998, p. 38) concluded that “expectations play a vital role in determining crime victim satisfaction with the police.” It is likely that victims of vehicle crime may have had relatively higher expectations that the police would move the investigation forward. This is due to the higher monetary value of vehicles and the fact that police have, in previous years, treated car crime as a priority target (Davenport, 2012). One study noted that follow-up contact by police needed to be perceived by victims as having some relevance to them for the intervention to have any impact on their satisfaction levels (Brandl & Horvath, 1991). In the case of this experiment, if victims of vehicle crime expected their case to be progressed by police, a follow-up call reaffirming that the investigation would not continue would be of little consequence to them. This might explain the nil and often backfiring effect observed in some instances.
This explanation is applicable to the expectations and experiences of cycle owners as well. Indeed, 39% of cyclists believe that their cycle was likely to be stolen regardless of their efforts to secure it (Bryan-Brown & Savill, 1997). When combined with public acknowledgements from some police organizations of the low investigative priority ascribed to cycle theft (Hellon, 2021), it is reasonable to assume that any subsequent contact from police has the potential to exceed the initially low expectations of cycle theft victims. Previous evidence of volume crime victims suggests that the more victim expectations are met, the more likely victims are to express satisfaction with the police (Aihio, 2017). This appears to be a plausible explanation for the positive effect of the treatment on victims of cycle theft; however, without evidence, these interpretations remain speculative, and future research should aim to address this explanatory gap.
Lastly, when considering responses to the final survey item (“As a result of this incident, has your opinion of the police gotten better, gotten worse, or not changed?”), there was a positive effect for victims of cycle theft. Curiously, while victims of vehicle crime reported a slightly negative effect, this was less pronounced than it was in connection with other items. These results seemingly contradict the theory that a single encounter or experience with the police would not influence a victim’s wider opinions of policing (Reisig & Chandek, 2001). Broadly speaking, then, the results demonstrates that these types of interventions may have a wider benefit on policing. As a theoretical matter, these results suggest Reisig and Chandek’s (2001) findings are incomplete as expectations do, in this case, influence victim satisfaction. Demonstrating a clear willingness to assist the victim on the part of officers would exceed their expectations, resulting in greater victim satisfaction.
Wider Police Legitimacy Implications
The literature reviewed earlier suggests that a strong coupling between satisfaction from the police, procedural justice and legitimacy more broadly. Changing global perceptions of police legitimacy is challenging for the police, as they are affected by a large range of antecedents, many outside the police control. Satisfaction from police-public interactions, however, is directly driven by how the victim perceive the police to behave towards them and, importantly, is not driven primarily by the outcome of the investigation (Hinds and Murphy, 2007; Mazerolle et al., 2013).
As such, fairness is not a utilitarian outcome, per se, however it does have direct tangible consequences: how the police treat people now will affect future relationships: one who views their engagement with the police as disrespectful, biased or meaningless, is less likely to engage again. Therefore, the literature draws out a substantial link between fairness and future cooperation with the police (Bradford et al., 2008; Elliott et al., 2012). Thus, whilst procedural justice seems like the “right thing to do” (Nagin & Telep, 2017), inconsequential of the immediate benefits it may give the police, there are nevertheless gains for crime policy in the long run. As this study shows, police call backs as opposed to the standard care would be an improved level of service, which would potentially increase future cooperation. At the same time, we did not follow up on our treatment victims to understand whether they do engage with the police again more than control participants – a common limitation in experiments of this nature (see Langley et al., 2021).
Costs and Benefits of Call-Back Policy
From a practical perspective it remains unclear what is the cost to benefit ratio of employing a ‘reassurance calls’ policy across the organization. We are not exposed to data on all no-further-action cases London-wide, nor on other crime categories, so these much-needed economical computations are not feasible. Should any police agency decide to implement the findings of our study, additional analyses are required – with an emphasis on both the tangible as well as intangible (but monetarized) costs and gains, in terms of police legitimacy, cooperation with the police, and community relations.
It is however important to note that a primary reason why a police agency would not call back all victims via telephone is resourcing. The results of this study indicate that a small amount of time spent over the phone with victim can yield a substantial improvement in victim satisfaction, but incrementally these “small costs” add up. As such, a department-wide implementation of callbacks might serve to improve victim satisfaction and police legitimacy by orders of magnitude, but the cost to benefit ratios need further scrutiny.
Additional Limitations and Future Research
Our trial maintains sufficient statistical power to detect statistically significant treatment main effects (Cohen, 2013) but offers no breakdown of the effects within subgroups of victims, crime subtypes (beyond the blocking criterion which was an inherent feature of our experimental architecture), or crime reporting channels. If expectations expound the different outcomes we found in the two crime categories, then understanding under what specific conditions police satisfaction is enhanced is needed. However, the effective sample size in each block is limited and subgroup analyses – exploratory or confirmatory (Ariel & Farrington, 2010) – prove unstable, unreliable, or both. Important covariates such as ethnicity, age, gender, or previous contact with the police (see Table 1) were found in subgroup of 30 or fewer participants, which is normally considered a minimal threshold for inferential statistics such as independent sample t-tests (see Boneau, 1960, p. 63). We call for more research in this area with larger samples, as understanding the patterns of reassurance calls’ efficacy as well as effectiveness within more specific settings is important.
Second, it is logical to assume that many victims of high-volume crime, such as theft, possess a predisposition regarding the expected outcome of reporting the incident to police. This implies that the views presented by the participants may reflect a specific type of satisfaction for the specific crime type they have reported. If this is the case, then our instrument gauges a perceived level of satisfaction given a specific appreciation of police resources, rather than a global view of police performance. For example, a victim may hold the police in very low regards for a myriad of reasons (perceived increase in crime, police misconduct, institutional bias, etc.), but at the same time hold a pragmatic view about theft and therefore do not expect the police to locate their stolen bicycle. However, our instrument was not sensitive enough to address these variations, and a more valid instrument should ask victims how they expected their specific crime reported to be handled, with the expected outcome, as opposed to a global question about their opinion of police.
Our instrument is also insufficiently detailed about differences between crime clearance expectations and other expectations from the criminal justice system. Whereas clearance is associated with the outcome of the investigation (or lack thereof), other actors within the criminal justice may also affect victims’ satisfaction from the outcome of their reporting. We can assume that the police may have done their job “to the best of their ability,” but other parts of the criminal justice system could let down the victim, including the prosecutors’ office who declines to take up the case, policies, legal guidelines and public interest considerations. How might this reality of the criminal justice system process reflect on the current study is difficult to estimate, as our survey instrument did not go into such details and this line of inquiry should be the focus of future research.
Another limitation arises in terms of the internal validity of our measurement instrument to gauge victim satisfaction. We cannot conclusively determine if victims reported their global satisfaction with police, or satisfaction with how their specific victimization experience had changed. We do however wish to defend our view that the results are non-trivial, and that the ‘level’ at which the changes were made – specific or global – is a problem but not one which debunks the utility of the findings. Whenever possible, scholar should try to separate the two levels and provide a more robust differentiation of the treatment effect. This limitation is substantive, but we note that every additional question in a survey creates a risk to the response rate and the willingness of participants to take part in the study. Still, we encourage scholars to pay a closer attention to this theoretical limitation in future replications.
Supplemental Material
Supplemental Material - “How Should the Police Let Victims Down?” The Impact of Reassurance Call-Backs by Local Police Officers to Victims of Vehicle and Cycle Crimes: A Block Randomized Controlled Trial
Supplemental Material for“How Should the Police Let Victims Down?” The Impact of Reassurance Call-Backs by Local Police Officers to Victims of Vehicle and Cycle Crimes: A Block Randomized Controlled Trial by Ben Clark, Barak Ariel and Vincent Harinam in Police Quarterly
Conclusion
A reassurance call back can increase victim satisfaction amongst victims that feel “let down” by the police as their cases do not progress further in the criminal justice system. More research is required to better understand how reassurance call-backs can improve policing in diverse populations and crime types.
Footnotes
Declaration of Conflicting Interests
The author(s) declared no potential conflicts of interest with respect to the research, authorship, and/or publication of this article.
Funding
The author(s) received no financial support for the research, authorship, and/or publication of this article.
Supplemental Material
Supplemental material for this article is available online.
Note
Author Biographies
References
Supplementary Material
Please find the following supplemental material available below.
For Open Access articles published under a Creative Commons License, all supplemental material carries the same license as the article it is associated with.
For non-Open Access articles published, all supplemental material carries a non-exclusive license, and permission requests for re-use of supplemental material or any part of supplemental material shall be sent directly to the copyright owner as specified in the copyright notice associated with the article.