
Abstract
We assessed whether an adaptation of value-added analysis (VAA) can provide evidence on the relative effectiveness of interventions implemented in a large school district. We analyzed two datasets, one documenting interventions received by underperforming students, and one documenting interventions received by students in schools benefiting from discretionary funds to invest in specific programs. Results from the former dataset identified several interventions that appear to be more or less effective than the average intervention. Results from the second dataset were counterintuitive. We conclude that, under specific conditions, program VAA can provide evidence to help guide district decision-makers to identify outlier interventions and inform decisions about scaling up or disinvesting in such interventions, with the caveat that if those conditions are not met, the results could be misleading.
Introduction
Over the past few decades, federal education policy has increasingly emphasized the need for the scientific evaluation of educational programs (ESSA, 2015; NCLB, 2001). This push is at least partially motivated by the fact that costs of educating students have risen dramatically over the past 50 years while educational gains have not risen proportionally (Deming & Figlio, 2016). The Every Student Succeeds Act (ESSA) explicitly defines what counts as evidence of effectiveness for educational programs, emphasizing both methodological rigor and also relevance to the local context. However, given the countless interventions in which American students participate each day, it is impractical to expect each one can be evaluated using the most rigorous research designs such as randomized controlled trials (RCTs) or quasi-experiments. These methods are resource-intensive, difficult to implement, and yet may still be uninformative (Lortie-Forgues & Inglis, 2019). Further, they represent a somewhat narrow definition of rigor that is well suited to answering a specific set of questions, but have other limitations and may not provide the types of evidence educational decision-makers need to inform their everyday decisions (Donaldson, Christie, & Mark, 2014). Additionally, such studies can only count among the top two tiers of ESSA evidence if the study population and context match sufficiently with those of the local decision-maker (USED, 2016). This requirement also presumes that education decision-makers are equipped to make such assessments although past research has demonstrated that evaluating research evidence requires capacity and infrastructure beyond that available in many education agencies (Honig & Coburn, 2008). But school and district leaders often seek data on program delivery and on student outcomes to help guide annual budgeting and planning (Levenson, Baehr, Smith, & Sullivan, 2014). The challenge is to provide information that is timely, practitioner-friendly, and still adequately rigorous.
In this paper, we test the hypothesis that an adapted and simplified form of value-added analysis (VAA), henceforth “program VAA,” can be usefully applied to provide acceptably rigorous estimates with readily available data that are more feasible to produce than full-scale experimental or quasi-experimental program evaluations. Since the idea of measuring teacher performance based on student learning gains was introduced by Hanushek (1971), value-added methods have been widely applied in teacher evaluation and, to a lesser extent, school and program evaluation. They have been used in a number of settings for high-stakes accountability measures, lower-stakes formative assessment, and for research purposes. The essence of VAA is an attempt to statistically isolate the effect of a teacher, school, or program on student learning by controlling for other factors that affect achievement outcomes, especially prior achievement results (Corcoran, 2010).
Rigor versus Feasibility Trade-off
Recent methods such as “rapid cycle evaluation” (e.g., Mathematica Policy Research, 2016) have been developed to produce local evidence more swiftly than traditional evaluation methods, but these still require significant analytic capacity and data collection, while also representing trade-offs relative to a full-scale evaluation. Furthermore, with school-based education decision-makers asserting limited confidence in their own ability to critically evaluate research evidence (May et al., 2020), there is a need for more feasible and locally relevant ways to evaluate educational programs. Such methods are likely to trade some degree of causal rigor for relevance (Hollands & Escueta, 2019), but may still meet the third tier of ESSA evidence. Locally relevant research evidence is more likely to influence decision-makers: Penuel and Farrell (2017) assert that local evaluations of programs may produce findings that are more “… timely, credible and central to district leaders’ needs…” and therefore more likely to be acted upon.
A further limitation in current educational research is that, although 80% of school district funds are spent on personnel (McFarland et al., 2017), few research studies attempt to estimate the impact of people per se on student achievement, with the exception of general estimates of teacher effects. Even when they do (e.g., Dobbie, 2011; Jackson, Rockoff, & Staiger, 2014; Rockoff, Jacob, Kane, & Staiger, 2011), there is little specification of the pedagogical skills and practices needed to produce observed improvements in student outcomes. Respected repositories of research evidence in education such as the What Works Clearinghouse (WWC) and Evidence for ESSA (E4E) primarily feature studies of prepackaged interventions such as curricula, professional development, or educational technologies. Studies of the impact of assistant principals, instructional coaches, or counselors are not featured, and would be hard to execute because of the inability to randomly assign adults to jobs. This leaves large gaps in the evidence base needed to inform school and district decision-making about how to allocate budgets amongst programs and types of personnel.
As a result of this evidence gap, schools and districts must often produce their own evidence on the instructional programs they operate. This task typically requires striking a balance between evidence that is methodologically rigorous enough to guide and justify programmatic decisions while also being feasible to produce. For example, consider a cost-effectiveness analysis (CEA) employing both the ingredients method for cost estimation (Levin & McEwan, 2001) and a randomized experimental design to capture program effects. It is unlikely that many local education agencies (LEAs, e.g., school districts and equivalent entities that go by various names in different states) have the expertise and resources to conduct such a CEA but, even where possible, problems arise. First, LEAs are frequently either unable or unwilling to conduct RCTs; instead, they rely on various forms of quasi-experimental designs (QEDs) such as matched samples (e.g., Drits-Esser, Bass, and Stark, 2014). It can be difficult to establish a counterfactual condition because students are purposefully selected for interventions, and promising interventions must be provided to all students equitably. Second, the time-intensive nature of CEAs places practical limits on the number that can be executed. Third, CEA requires an estimation of the economic value of all resources required to implement a program, many of which are not easily observed because they represent resources shared across multiple activities.
Even when such research is conducted on a district's existing programs, the value for decision-making may be limited. LEAs are rarely prepared to shut down entrenched programs and are more likely to seek information about how to improve programs or how to tinker with the overall package of services provided to students (Yan & Hollands, 2018). An important feasibility consideration is the timeliness of results. In particular, the misalignment between end-of-year outcome data availability and fiscal year budget cycles may require reliance on interim or proxy outcome variables. In addition to potentially reduced statistical power (i.e., sample size may be reduced if interim measures are not mandated for all students) and/or reliability of measures, such choices may negatively bias effectiveness results when sufficient implementation time is not given (e.g., Roschelle et al., 2014). Thus, the challenge is providing education leaders with useful and timely evidence that is suitably credible to support programmatic and personnel decisions.
Literature Review and Conceptual Framework
Adapting Value-Added Analysis to Program Evaluation
Researchers have noted significant advantages of value-added models over the prior focus on absolute performance that did not account for differences in learners’ starting positions, or in out-of-school factors that facilitate or impede learning (Jackson et al., 2014). While high-stakes accountability applications have been controversial, one promising use of the method is to identify outlier teachers, schools, programs, policies, or practices. Investigating those that are performing particularly well or poorly can lead to valuable lessons from high-performing teachers or programs and additional support for low performers (Braun, 2005).
In addition to both high-stakes teacher evaluation and lower-stakes uses for formative assessment of teaching, researchers have examined other potential applications of teacher and school value-added metrics to policy and practice. Much of this research has been synthesized by Jackson et al. (2014), including cross-validation of value-added measures based on their association with other measures of teacher effectiveness. Value-added measures have been used as outcomes to assess the impact of teacher characteristics on effectiveness and to evaluate programs, policies, and interventions aimed at increasing teacher effectiveness (Dobbie, 2011; Rockoff et al., 2011). VAA has been applied in a variety of contexts, including Australia, Chile, the Netherlands, and Portugal, to measure the effectiveness of schools, variability in effectiveness of schools, and the effects of particular policies and practices within schools (Coates, 2009; Ferrão & Couto, 2014; Hofman, Hofman, Gray, & Wendy Pan, 2015; Milla, Martín, & Van Bellegem, 2016; Page, Martin, Orellana, & González, 2017; Thomas, 2001).
There has been significantly less research on potential uses of VAA for program evaluation despite suggestions for such applications (e.g., Meyer, 1997; National Research Council, 2010). Most commonly, in a natural extension given its extensive application in teacher evaluation, VAA has been used to evaluate teacher preparation, professional development, and coaching programs (e.g., Darling-Hammond, Newton, & Wei, 2010; Harris & Sass, 2011). These studies have found some ability of VAA to detect meaningful differences in policies and programs but suggest that VAA alone is insufficient to guide decisions. Another study analyzed literacy reform interventions in the context of broader school reform in San Diego, simultaneously comparing several programs using deviations from expected growth trajectories (Betts, Zau, & King, 2005).
The value-added approach is akin to the difference-in-differences estimator that has been widely applied in the evaluation of single programs and policy changes in that it estimates deviations from expected changes over time conditioning on initial values (see Abadie and Matias, 2018 for a discussion of recent innovations in this and related econometric methods and applications to program evaluation). A limitation of the difference-in-differences approach is that extemporaneous changes occurring alongside the programmatic or policy interventions under study can be confounding factors (Yu, 2013). In a real policy and decision-making context when experimental or quasi-experimental methods are impractical or not relevant to the decision at hand, a value-added approach for program evaluation, which is, in essence, comparative and simultaneous difference-in-differences for many programs at once, helps to address this concern by controlling for alternative programs in which students could be participating. It also involves controlling for prior test scores and student characteristics. Whether and under what conditions program VAA produces credible results are the primary subjects of this paper, using case study results from a large, urban school district in Kentucky.
Methodological Issues with VAA
Given their prominence, particularly in high-stakes teacher evaluation, value-added methods have been subject to extensive methodological research and debate. Koedel, Mihaly, and Rockoff (2015) offer an extensive synthesis of the main issues. Here, we highlight key findings from the methodological literature on teacher VAA to assess the suitability of applying a similar analysis for program evaluation purposes and to determine the best model specification for mitigating concerns about VAA methods. The objective of VAA is not to formally model the cumulative achievement function, but rather to use prior achievement and other covariates as proxies for omitted variables that could explain both assignments to treatment (teachers in most prior literature, and interventions in the present case) and outcomes. In other words, the critical questions are whether prior achievement and other covariates adequately serve as proxies for underlying academic ability and pre-treatment inputs into the learning process. This would control for any unobserved selection mechanism to obtain unbiased estimates of the unique contribution of one part of the educational process—teachers, schools, or interventions—in a manner that is suitably precise and reliable to inform policy decisions.
Both experimental and nonexperimental studies have found limited evidence of bias in well-specified VAA models. One experimental study tested how well nonexperimental VAA predicts student learning when students are randomly assigned to teachers (Kane, McCaffrey, Miller, & Staiger, 2013). Although bias was substantively small and statistically insignificant, the experiment had a small sample size and bias was measured with significant noise. A larger, quasi-experimental study assessed how actual changes in student learning compare with expected changes in value-added due to shifts in grade level taught by teachers (Chetty, Friedman, & Rockoff, 2014b). While the authors found little bias on average, they could not rule out errors for individual teachers. More recent quasi-experimental evidence in Ecuador, relying upon an alternating alphabetical assignment mechanism that is as good as random, found statistically and substantively significant differences in student performance by teacher, associated with teacher behaviors and parental perceptions of teacher quality (Araujo, Carneiro, Cruz-Aguayo, & Schady, 2016). Other research has suggested that bias is still a concern, finding evidence of “effects” on earlier test scores of subsequent teachers as evidence of systematic sorting, arguing that random assignment findings are too imprecise, are based on small samples, and are not generalizable. Critics also pose evidence that the grade switching used in the quasi-experimental approach is associated with student characteristics (Rothstein, 2010, 2017).
Finally, recent research has found that certain specifications of value-added models can find spurious “effects” of teachers on outcomes they could not possibly influence, such as student height (Bitler, Corcoran, Domina, & Penner, 2021). However, this seems to be driven by noise in the model, not bias, and can be alleviated with appropriate specification and the use of multiple pre-treatment years of data to increase precision. While there is some evidence to support the validity of teacher value-added measures, it is less clear how issues of bias and sorting apply to program evaluation when the assignment mechanism is even more likely to be purposeful rather than random; we examine these questions in this paper.
In addition to bias, there are also questions about the precision and reliability of value-added estimates. For instance, Minaya and Agasisti (2019) found that value-added measures of primary schools in Italy are robust to model specification but are not stable over time or across different outcome measures. Furthermore, they are noisy in the middle of the school performance distribution but more precise at the top and bottom, suggesting the model is better suited for identifying outlier performance and learning from it in a formative fashion than in strict ranking or other higher-stakes applications. This point—that the statistical properties of a value-added measure should be assessed relative to the stakes of a decision being made and compared with alternative sources of evidence in the absence of value-added—is at the heart of a discussion between the American Statistical Association (ASA) and several researchers. There is a general consensus that researchers and decision-makers should exercise some caution in using value-added measures, with an emphasis on improving schools, in conjunction with other measures, and being explicit about precision, noise, and assumptions while testing for sensitivity to these assumptions whenever possible (Chetty, Friedman, & Rockoff, 2014a; Morganstein & Wasserstein, 2014). There is disagreement in the degree of caution warranted: the ASA recommends avoiding high-stakes accountability applications of VAA due to the risk of bias and their correlational nature, while Chetty et al., note that ample experimental and quasi-experimental evidence suggests minimal bias and that a causal interpretation is warranted from a well-specified value-added model.
Methodological literature also provides guidance on the appropriate specification of a program value-added model to minimize these issues, though in many cases teacher VAA results are robust to a number of these decisions (Koedel et al., 2015). Key decisions include whether to perform a one-stage model including the desired effects (schools, teachers, or, in our case, interventions) as fixed or random effects or a two-stage model regressing the residuals from a growth model on a set of school, teacher, or intervention indicators; whether to specify the value-added estimates themselves as fixed or random effects estimates; and whether to estimate value-added as the difference between two outcomes or if the pre-treatment outcome should be included as a covariate with the posttreatment outcome as the dependent variable. The preferred model is a one-stage model with a posttest on pretest rather than gain score approach, with little practical difference in whether the value-added effects themselves are specified as fixed or random (Koedel et al., 2015; Tekwe et al., 2004). Other important issues are how indicators are coded, selection of appropriate covariates to include in the model such as school and student fixed effects and multiple years of pre-treatment outcome data, Bayesian shrinkage, and procedures for addressing measurement error in the testing instrument (Aaronson, Barrow, & Sander, 2007; Ehlert, Koedel, Parson, & Podgursky, 2014; Herrmann, Walsh, & Isenberg, 2016; Kane et al., 2013).
Research Questions
In an attempt to assess whether and how program VAA can be used to conduct program evaluations that provide sufficiently rigorous, locally relevant, feasible, and timely evidence to inform school district decision-making, we set out to answer the following research questions:
How can an adapted form of VAA be applied to analyze the comparative effect of specific programs, policies, and interventions on students’ academic progress and other related outcomes? How well are the results of program VAA corroborated by extant sources of evidence? What conditions, in terms of student and program characteristics, selection or assignment mechanisms, measures, and availability of data, lend themselves to program VAA?
Setting and Context: Jefferson County Public Schools, KY (JCPS)
JCPS is a large, urban district located in Louisville, KY. With 94,466 students and 6,188 teachers in 168 schools, JCPS is the largest district in the state and one of the largest public school districts in the United States. In 2018–2019, JCPS's budget exceeded $1.7 billion. The district's school-based decision-making (SBDM) model grants broad authority to each school's SBDM council with regard to hiring, budgeting, and policy-making (JCPS, 2018). SBDM councils typically consist of a school administrator and a small number of elected teachers and parents.
Over half of JCPS students come from minority populations (36% Black, 12% Hispanic/Latinx, and 9% Other). In the 2018–2019 school year, 60% of JCPS's schools received Title I funding, while more than 65% of students were eligible for free or reduced lunch and 5% were homeless. Nearly 10% of students were classified as English Learners and 13% required individualized education plans. Teachers were predominantly white (84%) and female (74%), with approximately 85% of all teachers holding a master's degree or higher and nearly 7% holding national board certifications. JCPS received 2 out of 5 stars in the Kentucky Department of Education's (KDE) accountability ratings (KDE, 2019). Based on state testing, reading proficiency at the elementary, middle, and high school levels was 45%, 50%, and 37%, respectively, while math proficiency was 40%, 35%, and 30.5% at those same levels. The average high school graduation rate was 83% and the dropout rate was 3%.
Data and Methods
We test the hypothesis that program VAA can be used to simultaneously evaluate a wide range of educational interventions using two independent sets of JCPS student-level data with information about students’ assignment to various interventions: Intervention Tab data and Investment Tracking System End-of-Cycle data, each described below. The two datasets feature different subgroups of students, types of interventions, and assignment mechanisms to interventions, and thus serve as two separate case studies for determining the conditions under which the method can be suitably applied to program evaluation.
For each case study, we apply a form of teacher VAA adapted to program evaluation purposes. We follow suggestions for model specification guided by the VAA literature and test for robustness whenever possible. In some cases, either the preferred specification in current research literature or a robustness check is not possible due to limitations in available data. Our method also shares similarities with a simultaneous difference-in-differences analysis of multiple treatments. However, we cannot test for parallel trends in pre-treatment outcomes because JCPS only began implementing the relevant outcome assessment at the start of the intervention year. As discussed in more detail below, we address concerns about potential selection effects in three ways: (1) by clarifying that the intent of this adapted method is to provide preliminary evidence on programs to suggest priority areas for further analysis; that is, it improves upon the status quo of limited information but should not be the sole influence on a program decision; (2) by taking advantage of features of a policy context and selection into treatment mechanism that minimizes this concern; and (3) by cross-validating our findings with prior research.
Data: Intervention Tab 2017–2018
One source of data on student-level participation in reading, math and behavior interventions at JCPS is a specialized dataset we refer to as the “Intervention Tab” which includes more than 70,000 student records per year. Starting in the 2014–2015 school year, KDE mandated that schools track all academic or behavioral interventions supported by KDE-specified funding mechanisms in the Intervention Tab of its Infinite Campus statewide student information system (KDE, 2020). In Academic Year 2017–2018, intervention services for each of the following four groups of students were mandated by the State of Kentucky to be recorded at the individual student level: K–3 students identified as requiring intervention services, students served by Extended School Services, students served with Mathematics Achievement Fund or Read to Achieve grants, and, for schools that have been classified as “Focus” schools for three or more years, all students who scored “Novice” (the lowest level) in state assessments.
In general, students receiving such interventions are more disadvantaged and have lower pre-treatment test scores than the district as a whole; the characteristics of students represented in the Intervention Tab data are described below. Schools are required to update student records at least four times per year. Separate student records are entered for regular year and summer school interventions with one entry for each combination of funding source, content area (e.g., reading, math, behavior), and tier (e.g., individual, small group). As a result, many students have multiple records. In addition, each record contains information on intervention duration, total hours, resolution, delivery method, and instructor type.
There are 32,207 students in the 2017–2018 Intervention Tab dataset with a large number of students receiving teacher-created interventions or interventions meant to address areas other than reading and math. For the purposes of this analysis, we focus on students who were involved in named, vendor-created interventions for reading or math, although we include teacher-created reading and math interventions as possible confounders. We do not include behavioral interventions as there are relatively few such records in the dataset and the data entry requirements set by the state only applied to a small set of behavioral interventions, increasing the risk of confounding effects with unobserved alternative treatments. We do not report results for teacher-created interventions as we do not have detailed information on what those interventions entail and thus any effects of these interventions would not be distinguishable from the effectiveness of the teachers who created and implemented them and would not yield meaningful results for policy decisions about JCPS programs.
There were 8,886 unique students participating in vendor-created reading interventions and 5,677 unique students participating in vendor-created math interventions. The range of students participating in individual vendor-provided reading interventions was 4–2,757, with an average of 291 students. The range of students participating in vendor-provided math interventions was 1–1,225, with an average of 229 students. On average, a student in our restricted sample of vendor-created reading and math interventions was enrolled in 1.12 reading interventions and 1.06 math interventions. Table 1 summarizes descriptive statistics for students in the sample from the Intervention Tab dataset. On average, the sample includes somewhat more Black students and students with disabilities than the district at large. As anticipated, students in the Intervention Tab dataset had lower average, and more uniform, pre-treatment test scores than students in the district at large (see Appendix Figure A1 for detailed distributions).
Descriptive Statistics for Intervention Tab Analytical Dataset.
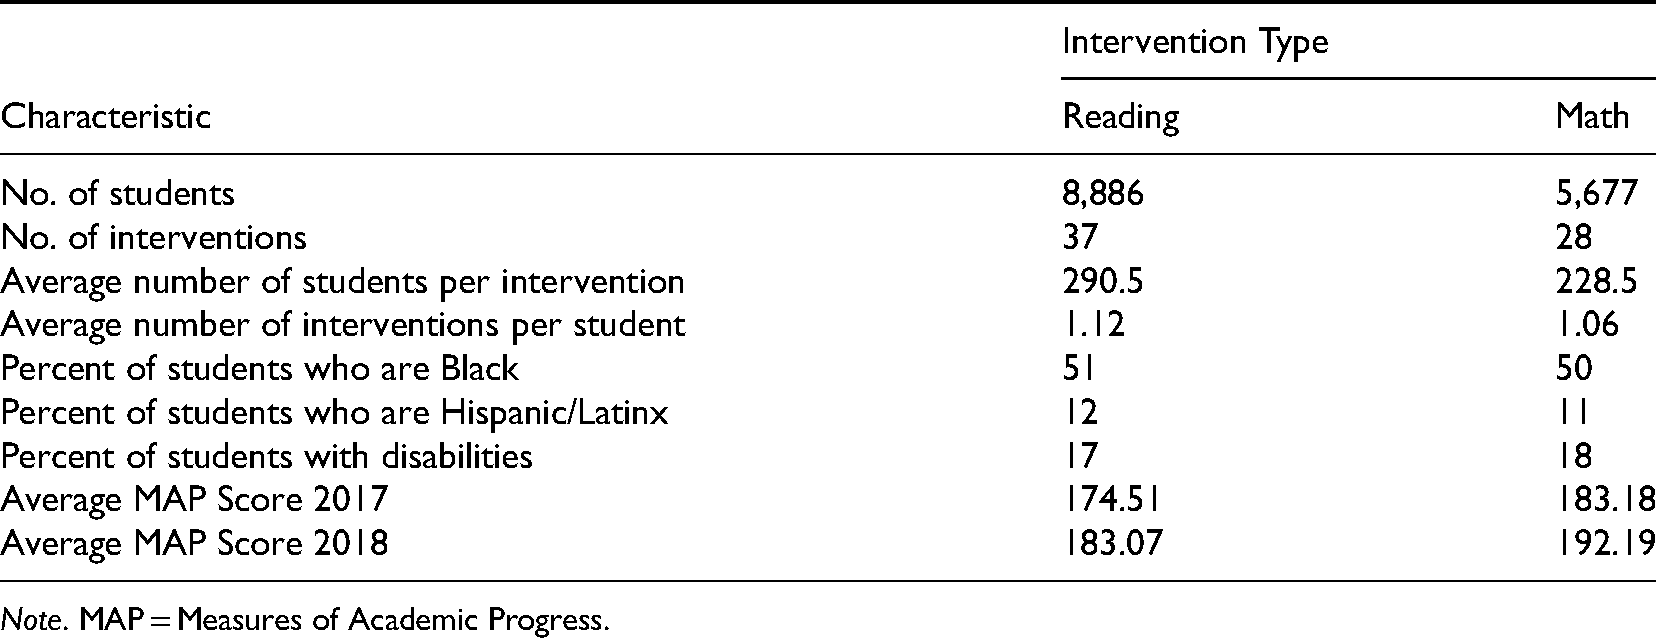
Note. MAP = Measures of Academic Progress.
Data: Investment Tracking System End-of-Cycle Items
We also tested whether program VAA methods can be useful to evaluate program and policy interventions supported by discretionary funds under the district's Cycle-Based Budgeting System (Yan, 2017). School and district office leaders can submit budget requests for discretionary funds to supplement site-based budget allocations and those mandated by contract or under state and federal laws. These “investments,” most often to support personnel positions such as Success Coaches or Interventionists, are awarded on 1–5-year investment cycles and are tracked in JCPS's Investment Tracking System. This system holds data on 20,928 students in 29 schools that received discretionary funds to support 47 investments that came up for budgetary review in 2018–2019. The student sample comprised elementary (49%), middle (10%), and high school (41%) grades, and was 46% female, 43% white, 35% Black, 12% Hispanic/Latinx, and 10% other race/ethnicity. The average number of students served by each investment item was 661 and the average number of investments per student was 1.48. Interventions targeted all students in a school; specific subgroups within a school, such as students with disabilities or students in a particular grade level and/or subject; or a specific target group of students based on identified need. In cases in which it was not clear which students were targeted by an intervention, we contacted school personnel for clarification and requested rosters to determine participation. Because results could be confounded by ongoing investments in comparison schools that were not up for budget review, and by similar interventions in other schools that were funded by alternative sources and thus not appearing in the Investment Tracking System, we restricted our analysis in this dataset to schools that had active investments under the Cycle-Based Budgeting system and we included all current investment items as potential controls or confounders, though our analysis is focused on those investments up for end-of-cycle budget review.
Other Data: Administrative Data and Outcome Measures
We supplemented the student-level data on participation in interventions with administrative data on student characteristics—gender, race, grade level, disability status, and median income by Census tract—and three outcomes: fall 2017 and fall 2018 NWEA Measures of Academic Progress (MAP) scores, attendance rates, and days of suspension. We standardized MAP scores within grade levels for ease of interpretation and to minimize mechanical effects of the scaling of the exam.
Model Specification
We ran a series of models to test robustness to specification, but, in general, we followed guidance from Koedel et al. (2015) in using intervention fixed effects in a one-stage framework. In our preferred model, we regressed the 2018 outcome on the 2017 outcome, student characteristics, and a series of indicator variables for each intervention, with separate models for math and reading, as shown in Equation 1, where i indexes students in school s at time t, X represents the vector of student covariates, I is a vector of intervention indicator variables, and 
We ran a series of robustness checks with alternative specifications: pooled across all students versus by grade band, with and without student characteristics as covariates, with and without school fixed effects, and with growth as a dependent variable. Because we are testing several hypotheses about programs at once, we considered the possibility of skewed results due to multiple inferences. We report conventional SE and hypothesis tests in our main results, as the objective of this analysis is to determine potential outliers for further study. Thus, substantively meaningful effects that are measured less precisely and have higher probabilities of a Type I error are still of potential interest. However, to test the robustness of our results to a more stringent criterion we also applied a Benjamini–Hochberg correction, reported in Online Appendix Table A1 (Benjamini & Hochberg, 1995). We also report robustness checks using an alternative, two-stage model specification in Online Appendix C.
Application to Intervention Tab Data
For the Intervention Tab dataset, we minimized selection bias by restricting our sample to the students who received a vendor-created reading or math intervention. Students in the Intervention Tab dataset are more similar to other students in the dataset than those outside the dataset, implying that selection into any intervention is a more serious issue than which particular intervention a student received and thus the method of restricting the analysis to students receiving any intervention does at least partially mitigate selection bias. Additionally, due to mechanical reasons (e.g., time constraints), if students are receiving an officially logged intervention, they are less likely to be receiving other unobserved interventions that would potentially bias effects of observed interventions downward. We effect coded interventions so their effects could be interpreted relative to the overall average effect of all interventions in the dataset (Mihaly, McCaffrey, Lockwood, & Sass, 2010), which is marginally lower than but almost equivalent to nationally normed growth on the MAP assessment (NWEA, 2020). Effect coding has a sum-to-zero constraint which means that students can only be in one “intervention.” We, therefore, estimated effects for all individual interventions and unique combinations of interventions in which any given student participated.
Application to Investment Tracking System Data
Due to the different nature of the dataset and the types of interventions, students, and schools included, our approach to the analysis of Investment Tracking System End-of-Cycle items was somewhat different. We did restrict the sample to schools that had any investments in the Investment Tracking System to avoid comparisons with schools that may have had similar investments but from alternative funding sources which would not have been captured in the Investment Tracking System. We included all students in all schools which had at least one active investment item in the Investment Tracking System, regardless of whether the students were the intended beneficiaries of the investment(s). This provided a suitable comparison group of students who are not identified as targets of any particular investments. We used dummy coding so that all coefficients are interpreted as relative to students receiving no intervention. From a policymaking perspective, the question of whether an investment strategy works across multiple sites is of greater interest than, for instance, whether funding an assistant principal at one particular school improves student achievement, so we combined similar or identical investments across schools as a single investment and included school fixed effects in our preferred models to capture school-level heterogeneity.
Cross-Validation of Results
As a means of assessing the validity of the Intervention Tab results, we searched for existing studies on the math and reading items for which significant positive or negative results were obtained. We initially searched for studies in the WWC and E4E databases of educational interventions. We considered these the most reliable sources of corroborating evidence as they establish high standards of methodological rigor for accepting studies as evidence on the effectiveness of educational interventions (e.g., WWC, 2020). If we found studies in E4E or WWC, we report these results and do not report results of any additional studies. If we did not find an intervention listed in either of these two databases, we searched other sources including Education Endowment Fund, ERIC, a university library, and Google Scholar. Results from these alternative sources of evidence are presented in Online Appendix Table E1. If we found only one study that we deemed reliable (based on an RCT, QED, or correlational study conducted by an independent evaluator), we report information from this one study. If multiple studies with credible designs were found, we provide a summary of the findings. For interventions with no high-quality evaluations, we looked for studies on the vendor's website and conducted an open Internet search which could surface other reports or evaluations, and summarize the available evidence.
Findings
Intervention Tab
Our findings indicate that relatively few interventions have statistically significant value-added that differ substantially from average growth. However, we do find notable outliers worthy of further investigation. Due to the sheer number of interventions and combinations of interventions, for parsimony, we only report here results for 15 math and 8 reading interventions that are statistically significant in at least one of our models. Full results including those that were not statistically significant, as well as the results with the Benjamini–Hochberg correction, are available in Online Appendix Table A1. Table 2 summarizes the results of our models by subject area and grade band, with coefficients representing standardized deviations from average growth among all students receiving vendor-provided reading and math interventions on respective MAP scores. Our preferred model regressed post-intervention MAP scores on pre-intervention scores and student covariates, and Models 2, 3, and 4 excluded student covariates and used growth as a dependent variable with and without student covariates, respectively.
Summary of Intervention Tab Interventions with Statistically Significant Results in Program Value-Added (VAA) Model.
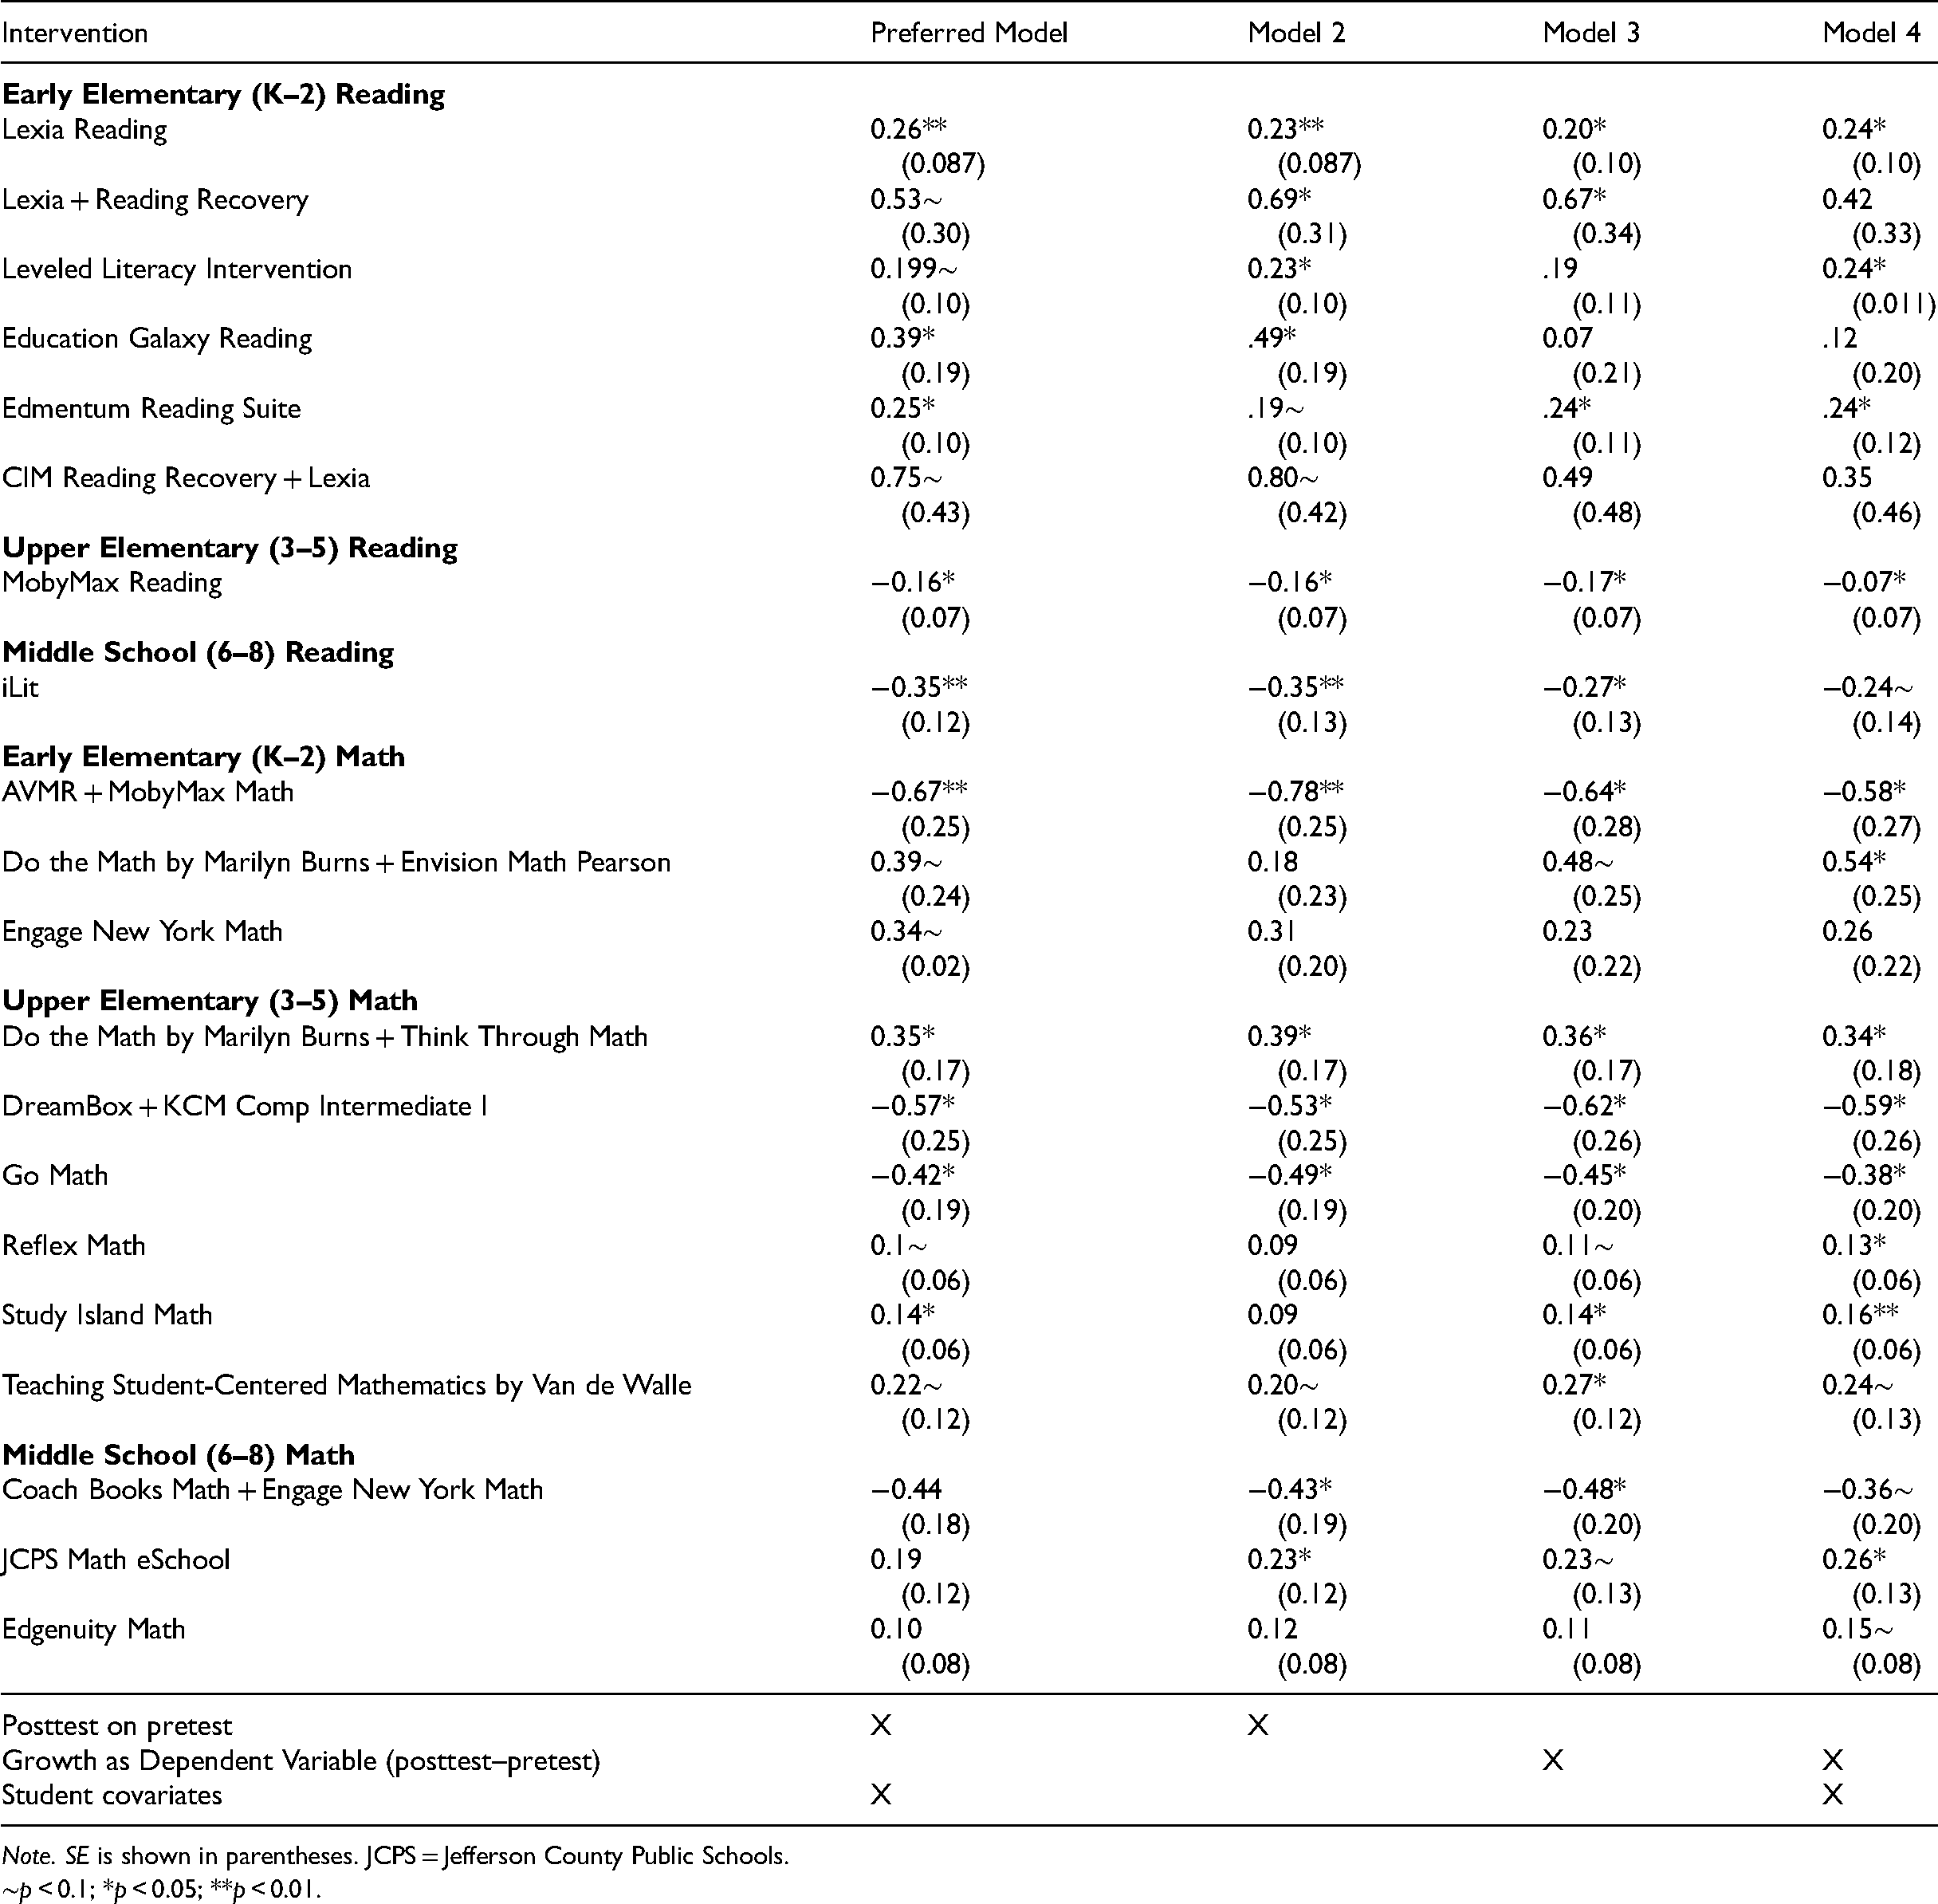
Note. SE is shown in parentheses. JCPS = Jefferson County Public Schools.
∼p < 0.1; *p < 0.05; **p < 0.01.
Among K–2 elementary reading programs, we see positive and significant effects in our preferred model at the 0.05 level or below of Lexia Reading, Education Galaxy Reading, and the Edmentum Reading Suite, and marginally significant effects at the 0.1 level of the combination of Lexia and Reading Recovery, Leveled Literacy Intervention, and the combination of comprehensive intervention model (CIM) Reading Recovery and Lexia Reading. Results are of very similar magnitudes and patterns of statistical significance across model specifications. There are fewer statistically significant interventions in reading in upper elementary and middle school grades in our preferred model, with iLit and MobyMax Reading both having statistically significant below-average effects relative to all other interventions. For elementary school math, we find above-average and significant effects of the combination of Do the Math by Marilyn Burns with Think Through Math and Study Island Math; positive and marginally significant effects of the combination of Do the Math by Marilyn Burns with Envision Math Pearson; Engage New York Math, Reflex Math, and Teaching Student-Centered Mathematics by Van de Walle; and statistically significant below-average effects of Add+VantageMathRecovery (AVMR) with MobyMax Math; DreamBox with KCM Comp Intermediate I, and Go Math. We do not observe any statistically significant differences from average MAP performance among middle school math programs in our preferred model, but in alternative models with similar point estimates to our preferred model we see significant positive effects of JCPS Math eSchool, marginally significant positive effects of Edgenuity Math, and significant negative effects of Coach Books Math combined with Engage New York Math. The number of statistically significant estimates is well in excess of the 5% we would expect by chance alone, although only seven interventions remain significant with the Benjamini–Hochberg correction as reported in Online Appendix Table A1.
End-of-Cycle Investments
For the Investment Tracking System End-of-Cycle investments, effects are interpreted relative to growth for students who are in schools that had investments in the system but who were not themselves targeted by any investments. We observe statistically significant negative effects on reading scores for school nurses, career readiness programs, shuttle drivers, summer literacy programs, assistant principals, interventionists, and mental health counselors, and statistically significant positive effects for school resource officers. We find very similar patterns of effects for math scores and for suspensions (with a positive sign indicating a higher number of occurrences or days of suspensions and thus being interpreted as a negative effect). For reasons discussed in more detail below, and suggested by the strongly counterintuitive nature of these findings, we believe these results are subject to a number of biases and thus serve as a useful guide to circumstances under which this method will not yield useful results for policy. We present the full results in Online Appendix Table B1 but do not include them here to caution against overinterpreting these findings.
Robustness Checks: Alternative Outcomes and Multiple Years of Pre-Treatment Data
In an effort to test the robustness of our preferred models, we reran Intervention Tab models using data from multiple years on two alternative student-level outcomes: attendance and out-of-school suspension occurrences (as previously noted, we were unable to use multiple years of MAP data as this test was only introduced at JCPS in 2017–2018). Although the interventions included in our study were primarily focused on improving students’ math or reading skills, there is some evidence that such interventions may lead to increased student engagement (e.g., Kim et al., 2020), which is, in turn, associated with improved behavioral outcomes (e.g., Quin, Heerde, and Toumbourou, 2018). Substituting attendance and suspensions as alternative outcomes permitted us to compare results for each outcome using a single year of pretest values versus including data from multiple prior years. Specifically, we computed a 3-year weighted moving average (WMA) for each outcome using weights of .20, .30, and .50 for Years 1, 2, and 3, respectively. Because we did not expect early elementary or mobile students to have 3 years’ worth of prior data, in an effort to maximize the sample size, weights of (.30, .70) and (1.00) were used to calculate WMA for students with 2 years and 1 year, respectively, of prior outcome data.
Table 3 provides a summary of the model results for each combination of alternative outcome and pretest approach. With two exceptions, the regression coefficients on the WMA pretest values were larger in magnitude than those of the single-year pretest models (
Summary of Alternative Outcome Reanalysis of Preferred Models (1-Year vs. WMA Pretest).
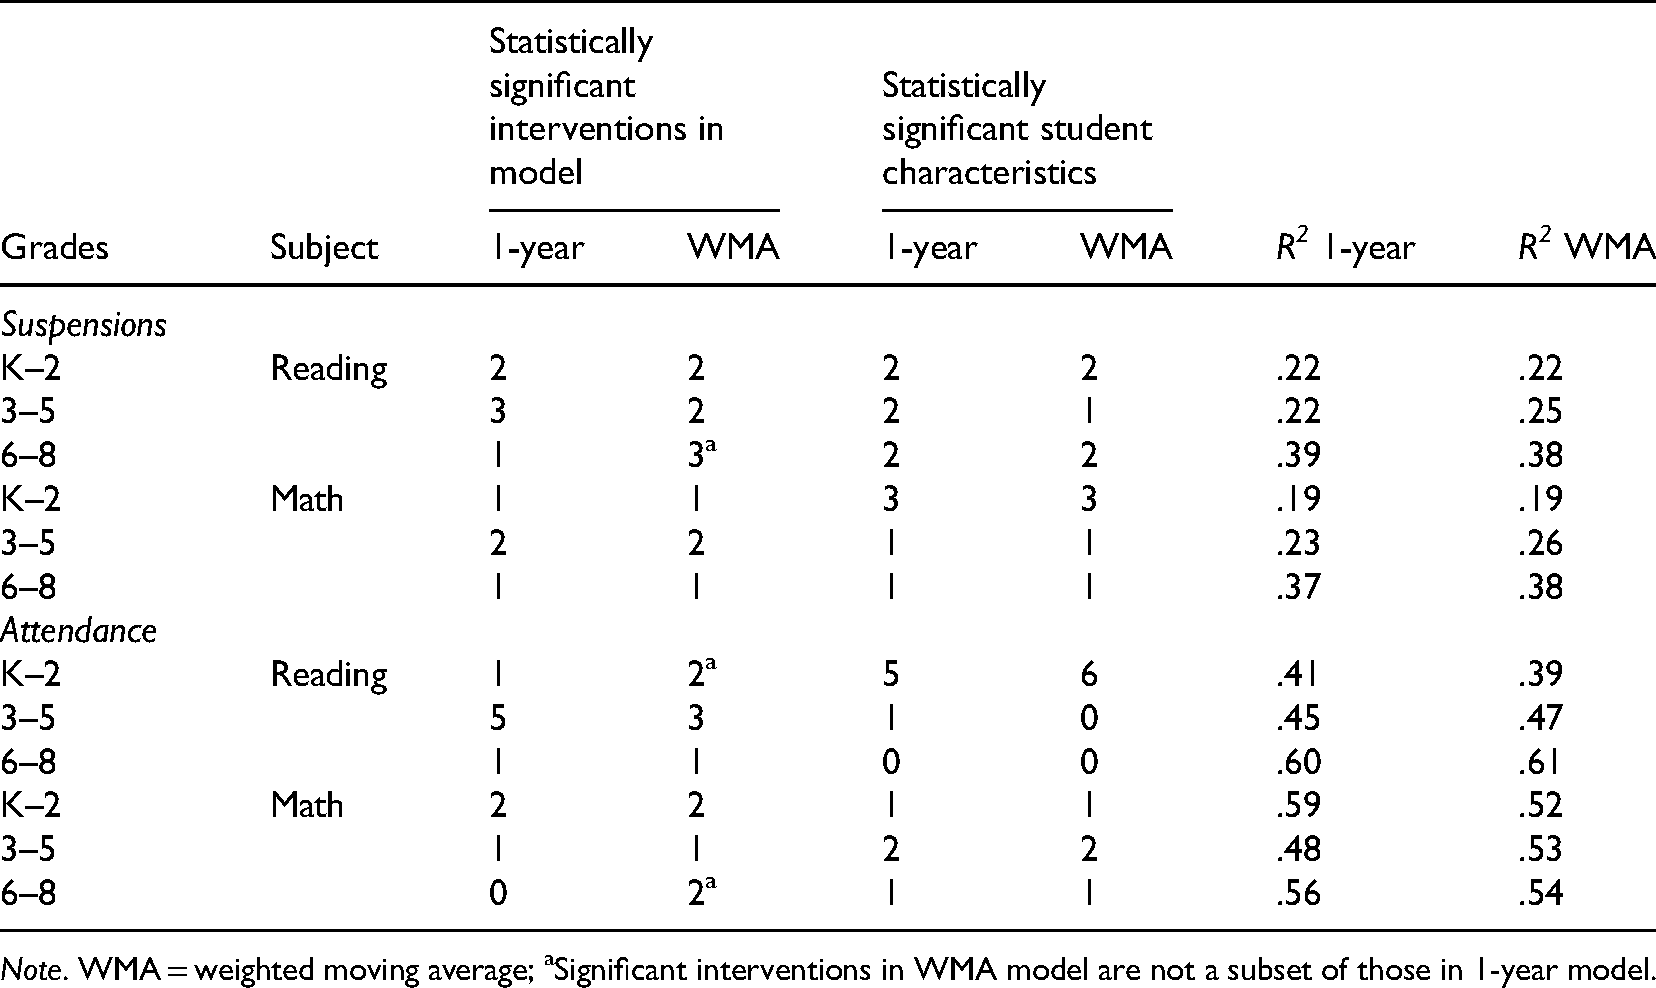
Note. WMA = weighted moving average; aSignificant interventions in WMA model are not a subset of those in 1-year model.
Comparison of Findings on Intervention Tab Items to Extant Research
Table 4 and Online Appendix Table E1 summarize the results of our search for alternative research findings with which to corroborate our own findings. Table 4 only shows results from WWC and E4E while the Online Appendix includes additional sources of evidence. For a few of the reading interventions—Lexia Reading, Reading Recovery, and Leveled Literacy Intervention—existing studies that qualified for WWC or E4E corroborated our positive findings quite well both in direction and magnitude. For Education Galaxy Reading and Edmentum Reading Suite, other sources of evidence supported our positive findings. Existing evidence on MobyMax Reading was mixed while our analysis found a small negative effect. For iLit, we also found a negative effect while the vendor refers to several studies that show positive effects. We could not locate these studies. Overall, we found no rigorous, third-party studies that contradicted our findings for reading interventions.
Summary of Alternative Evidence from WWC and E4E.
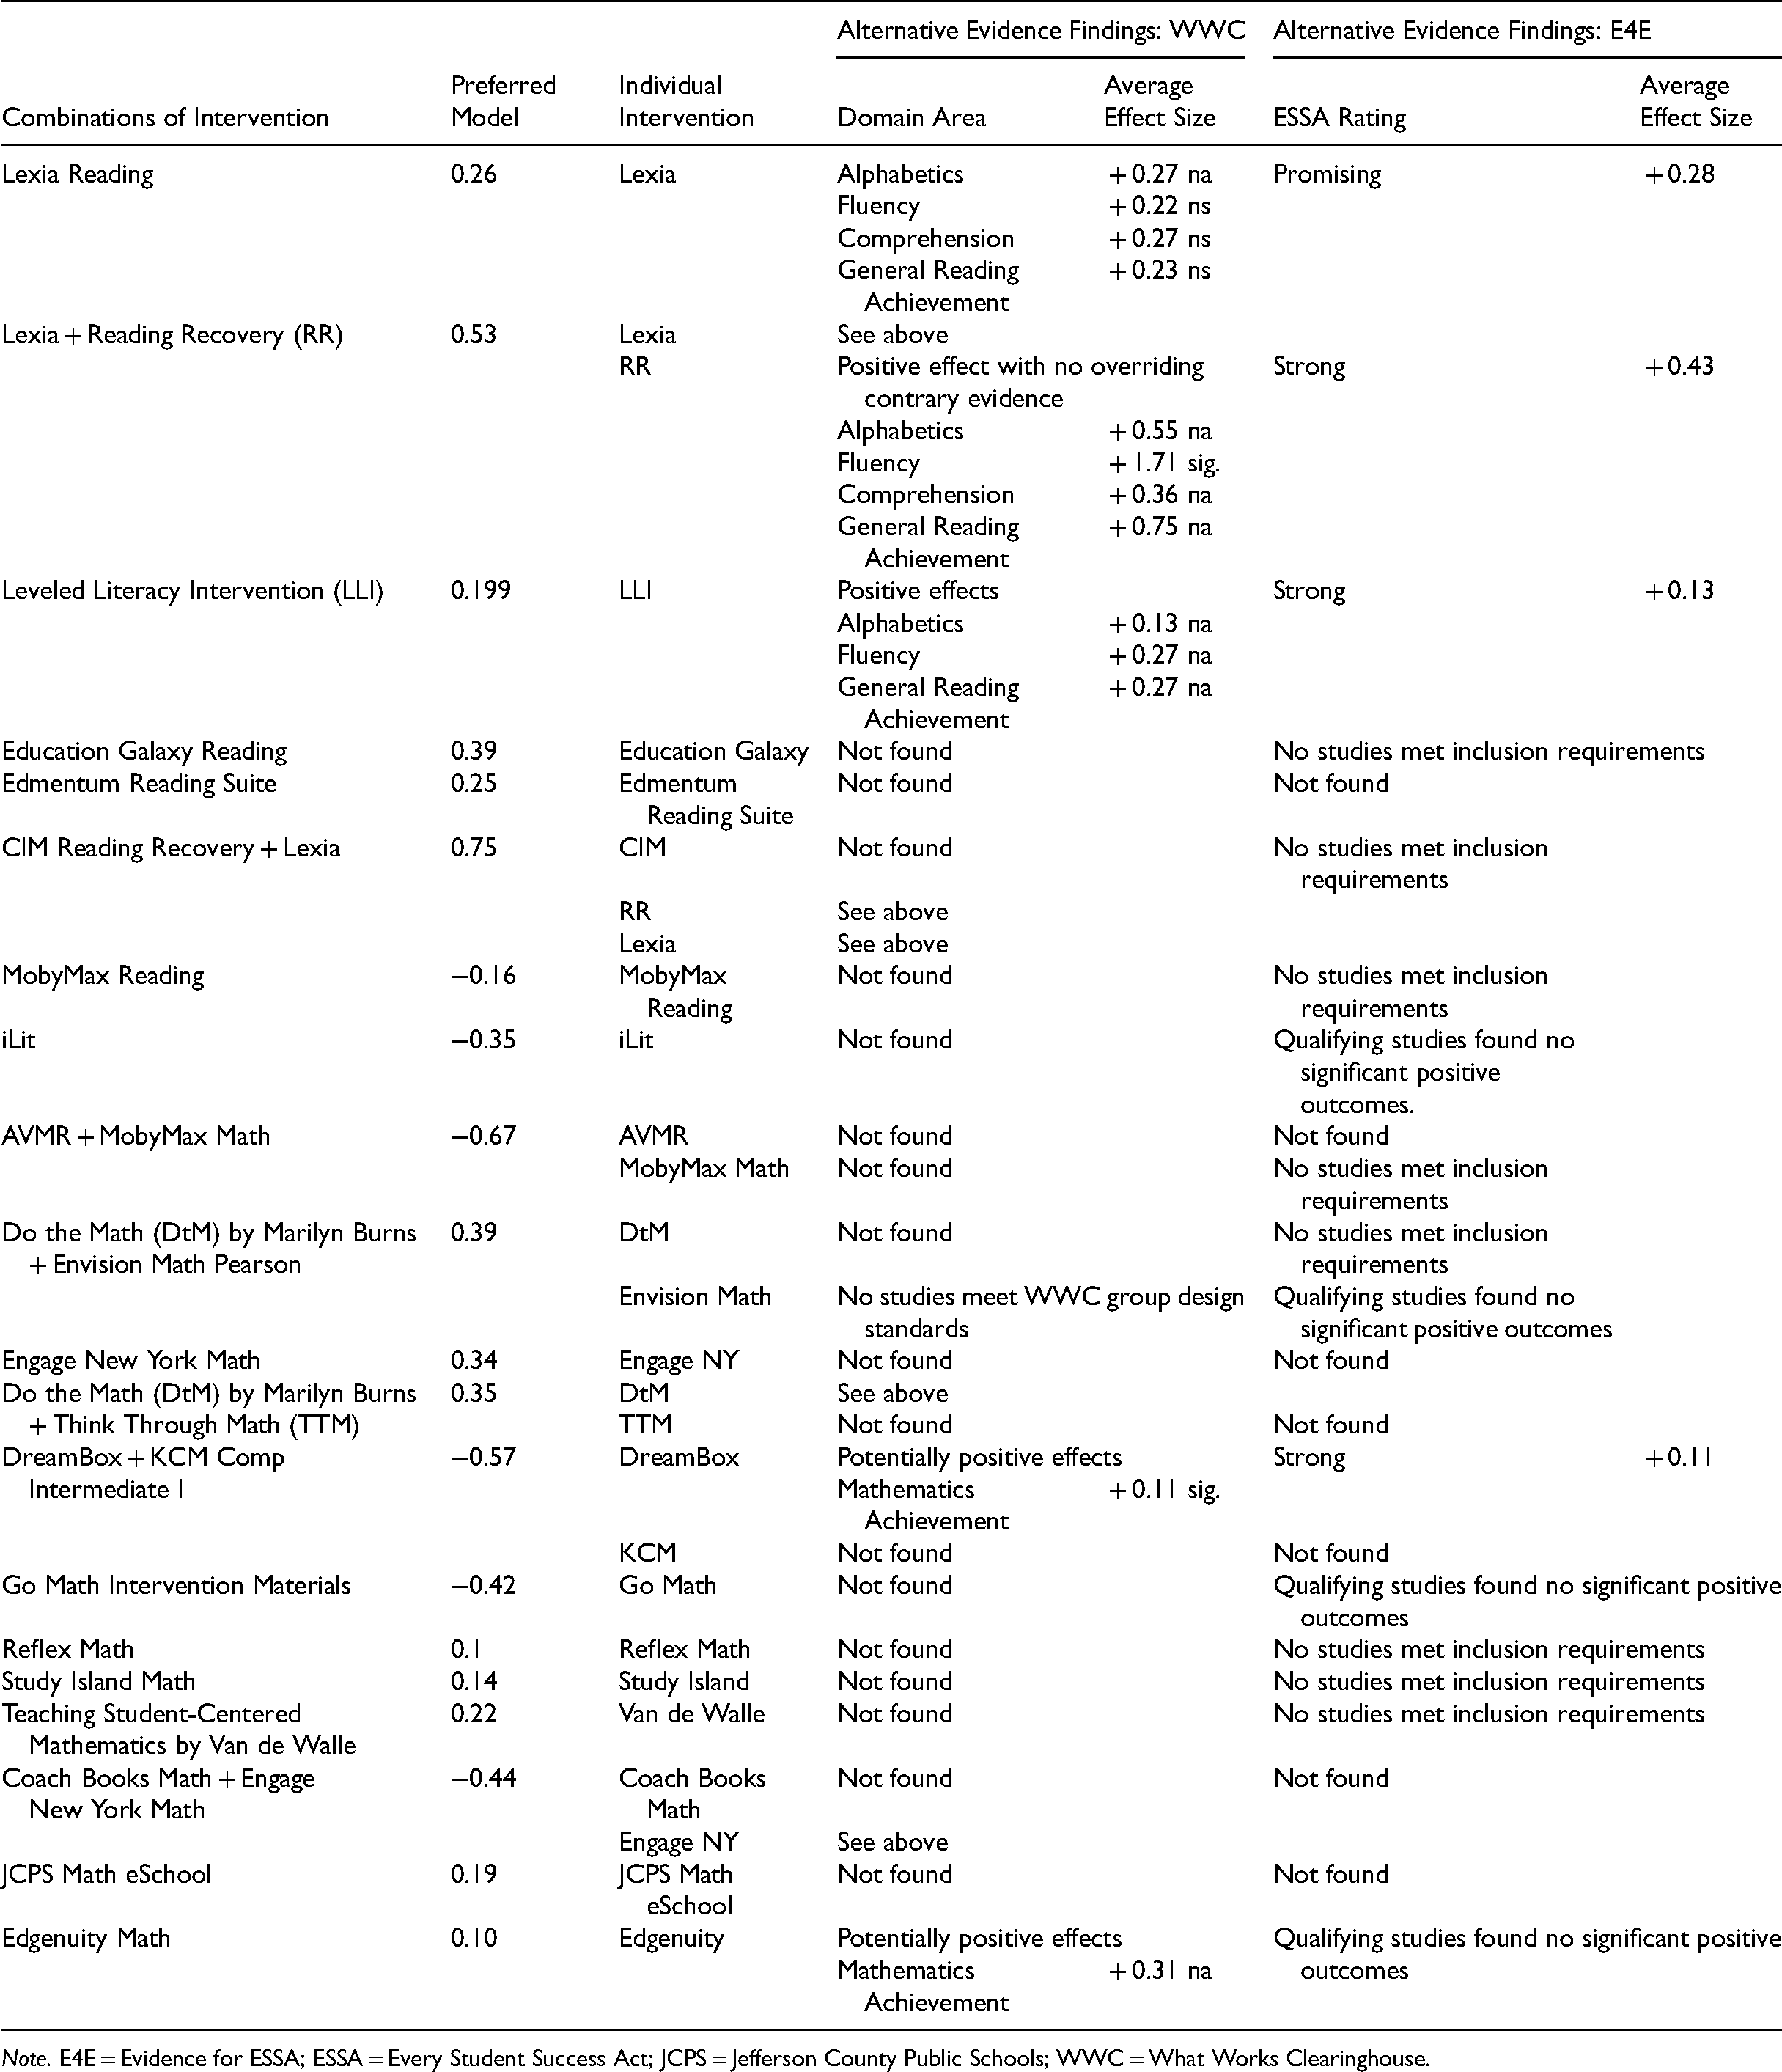
Note. E4E = Evidence for ESSA; ESSA = Every Student Success Act; JCPS = Jefferson County Public Schools; WWC = What Works Clearinghouse.
Corroborating our findings on the math interventions with existing evidence was harder, partly because so few of the interventions were listed in WWC or E4E and several had no evidence of any kind on their effectiveness, and partly because several were delivered in combination with another math intervention. While only two of the eight reading interventions we report on were combinations of two interventions, five of the 12 math interventions were combinations. In these instances, we could not determine which individual intervention might be contributing to the effect and how much. We could only find high-quality evidence in WWC or E4E for one of the interventions in one of the math combinations (DreamBox), and for one of several programs that constitute another math intervention, Edgenuity Math. In the latter case, the WWC study corroborated our finding in direction (positive) but the WWC effect was higher in magnitude. In the case of the combination, the WWC/E4E effects were positive for one of the interventions and our effect for the combination was negative.
For all other math interventions, we needed to look beyond WWC and E4E for alternative sources of evidence. For MobyMax Math, a dissertation and a vendor study found positive effects while we found a negative effect for the combination of MobyMax Math and AVMR. We found no alternative evidence on AVMR. Our positive effects for the combinations of Do the Math by Marilyn Burns with Envision Math Pearson or with Think Through Math were corroborated by alternative sources. For Go Math Intervention Materials we found a moderate negative effect but no studies on the intervention materials per se to corroborate this. Studies on Go Math! as a whole found negligible effects. Our small positive finding for Reflex Math was generally supported by a variety of dissertations and vendor studies. Alternative sources on Study Island showed mixed results compared with our small positive finding. We found no alternative evidence at all on Engage New York Math, Teaching Student-Centered Mathematics by Van de Walle, or JCPS Math eSchool to corroborate our positive findings. We found no alternative source of evidence on Coach Books Math to corroborate our negative finding for its combination with Engage New York Math, or of KCM Comp Intermediate I to corroborate our negative finding for its combination with DreamBox.
Discussion
Summary of Results
We conclude that, in some situations, program value-added can be a useful complement to other sources of evidence to inform decisions about whether to continue, scale, or replicate programs. In particular, there is a promise for identifying outlier interventions and investments that merit further investigation. The method suffers from some limitations that imply that it should not be the sole input for high-stakes decisions and that policymakers should assess whether it is worthwhile to gather the necessary data. Because it is not possible to observe the counterfactual of all possible “interventions” in which students might participate and because students are not randomly sorted into interventions, there is likely selection bias, most frequently in the downward direction. Further, as with teacher value-added estimates, even with many observations, there are power and reliability concerns due to measurement error, collinearity due to similar patterns of interventions, small numbers of students participating in individual interventions, and a large number of parameters estimated relative to the sample size.
Overall, the alternative, existing sources of evidence supported our Intervention Tab results for reading interventions but did not serve particularly well to either support or challenge our analysis of math interventions. Perhaps the bigger concern is that so little evidence can be found on so many of the math interventions being used in a large school district.
Differences in Intervention Tab and End-of-Cycle Results
Our findings suggest that our adaptation of value-added methods to program evaluation may be more promising under some conditions than others. Our Intervention Tab analysis of reading interventions was generally corroborated by extant evidence, but the end-of-cycle analysis yielded findings that were highly counterintuitive and contrary to expectations based on theory and prior research. We contend that these differences in findings suggest more general conditions for context, program assignment, and data under which adapting VAA to program evaluation is more valid and useful. Analysts and decision-makers should exercise caution in presenting and interpreting findings if these conditions are not met, as results could be misleading due to selection bias or measurement error.
First, our analysis of Intervention Tab programs was restricted to a well-defined set of students all of whom were receiving state-mandated interventions; therefore, the comparison group for students receiving any one intervention (or combination) was students receiving other interventions in the dataset. This is still an imperfect solution to providing a counterfactual because, even within this restricted sample, there are a wide range of students with different academic strengths and challenges, and interventions targeting different skills and subskills. Furthermore, this analysis can only provide relative effects rather than absolute measures of program effectiveness. However, it helps to mitigate selection bias by comparing only students who were receiving interventions. Further, students whose interventions were tracked in the system were less likely to participate in other interventions we could not observe, which would bias results downward due to unobserved treatments received by comparison group students.
On the other hand, interventions that we assessed from the Investment Tracking System were likely more subject to selection bias in that the students served by an intervention were lower-performing than students in the comparison group, and perhaps less likely to show improvements in the measured outcomes. Many interventions in the Investment Tracking System were school-wide but, for others, it was not clear exactly which students were targeted. As a result, effects of schoolwide programs could be confounded with the effects of the schools themselves or the types of schools seeking out such investments. Additionally, it was not always clear if investments were truly new programs or simply represented a shift in how those programs were paid for, for example, from the site-based budget to discretionary funding. Other schools may very well have had similar investments such as nurses or assistant principals but paid for them out of other sources rather than submitting budget requests via the Investment Tracking System. This suggests that particular features of the setting, intervention targeting, and assignment mechanism, along with features of the data, are amenable to this type of analysis. Interventions that target specific subgroups of students so that students being compared either between treatments or between a treatment and comparison group are more similar to one another at the outset and datasets with relatively exhaustive lists of interventions and students would be the most likely candidate for this analysis to yield credible and useful estimates, at least of relative program effectiveness. These estimates could then be used to target further examination of what outlier positive programs are doing well and whether negative outlier programs should be tweaked or eliminated.
Conditions for Usefulness of Evidence From Value-Added Analysis
The findings in the current study illustrate that the value-added modeling approach can provide credible evidence on the effectiveness of programs when a LEA (1) implements a large set of interventions and programs while tracking student-level participation in each, (2) administers a district-wide common assessment, such as MAP, and (3) uses program evaluations to inform decisions about how to invest budgets. Under these conditions, the value-added approach can, in a single analysis, provide evidence on the relative effectiveness of a large number of programs and interventions and focus attention on outlier programs that merit further investigation. These results may support larger-scale implementation of relatively effective programs, or consideration of alternative programs to replace relatively less effective programs.
Limitations and Further Research
Although this study provides promising preliminary evidence for conditions under which adapting VAA may be appropriate and useful for program evaluation purposes, further study is needed on model specification, how the model performs with multiple years of prior data, and ways to mitigate the effects of unobserved counterfactual programs, given that limitations in available data in this context did not allow for full exploration of each of these areas. While we have developed hypotheses for the usefulness of this approach and the conditions under which it is most applicable and feasible, these rely upon two case studies in one school district. Future work will more formally test the hypothesized optimal conditions for this method using simulated data and consider whether the considerable data collection and analysis work are worthwhile for a district. It will also be important to investigate qualitatively how such evidence enters into the decision-making process and whether shifting resources into programs that have scored higher value-added metrics results in better student performance.
Conclusion
In sum, since the ratification of ESSA, there is a renewed focus on ensuring that schools are investing in evidence-based programs and interventions. VAA provides an approach in which education agencies can examine multiple programs and interventions simultaneously, taking into account prior outcome measures and student characteristics to mitigate concerns about selection bias. Our analysis of two comprehensive datasets which document student-level participation in interventions provides early evidence for conditions under which this method is more and less promising. Such evidence arguably constitutes Tier III evidence for ESSA, being based on correlational methods and undeniably relevant to the local context. While it should not be the sole approach in program evaluation, it can provide evidence to identify outlier programs and interventions which should be further investigated.
Supplemental Material
sj-pdf-1-aje-10.1177_10982140211071017 - Supplemental material for Program Value-Added: A Feasible Method for Providing Evidence on the Effectiveness of Multiple Programs Implemented Simultaneously in Schools
Supplemental material, sj-pdf-1-aje-10.1177_10982140211071017 for Program Value-Added: A Feasible Method for Providing Evidence on the Effectiveness of Multiple Programs Implemented Simultaneously in Schools by Robert Shand, Stephen M. Leach, Fiona M. Hollands, Florence Chang, Yilin Pan, Bo Yan, Dena Dossett, Samreen Nayyer-Qureshi, Yixin Wang and Laura Head in American Journal of Evaluation
Supplemental Material
sj-pdf-2-aje-10.1177_10982140211071017 - Supplemental material for Program Value-Added: A Feasible Method for Providing Evidence on the Effectiveness of Multiple Programs Implemented Simultaneously in Schools
Supplemental material, sj-pdf-2-aje-10.1177_10982140211071017 for Program Value-Added: A Feasible Method for Providing Evidence on the Effectiveness of Multiple Programs Implemented Simultaneously in Schools by Robert Shand, Stephen M. Leach, Fiona M. Hollands, Florence Chang, Yilin Pan, Bo Yan, Dena Dossett, Samreen Nayyer-Qureshi, Yixin Wang and Laura Head in American Journal of Evaluation
Supplemental Material
sj-pdf-3-aje-10.1177_10982140211071017 - Supplemental material for Program Value-Added: A Feasible Method for Providing Evidence on the Effectiveness of Multiple Programs Implemented Simultaneously in Schools
Supplemental material, sj-pdf-3-aje-10.1177_10982140211071017 for Program Value-Added: A Feasible Method for Providing Evidence on the Effectiveness of Multiple Programs Implemented Simultaneously in Schools by Robert Shand, Stephen M. Leach, Fiona M. Hollands, Florence Chang, Yilin Pan, Bo Yan, Dena Dossett, Samreen Nayyer-Qureshi, Yixin Wang and Laura Head in American Journal of Evaluation
Supplemental Material
sj-pdf-4-aje-10.1177_10982140211071017 - Supplemental material for Program Value-Added: A Feasible Method for Providing Evidence on the Effectiveness of Multiple Programs Implemented Simultaneously in Schools
Supplemental material, sj-pdf-4-aje-10.1177_10982140211071017 for Program Value-Added: A Feasible Method for Providing Evidence on the Effectiveness of Multiple Programs Implemented Simultaneously in Schools by Robert Shand, Stephen M. Leach, Fiona M. Hollands, Florence Chang, Yilin Pan, Bo Yan, Dena Dossett, Samreen Nayyer-Qureshi, Yixin Wang and Laura Head in American Journal of Evaluation
Supplemental Material
sj-pdf-5-aje-10.1177_10982140211071017 - Supplemental material for Program Value-Added: A Feasible Method for Providing Evidence on the Effectiveness of Multiple Programs Implemented Simultaneously in Schools
Supplemental material, sj-pdf-5-aje-10.1177_10982140211071017 for Program Value-Added: A Feasible Method for Providing Evidence on the Effectiveness of Multiple Programs Implemented Simultaneously in Schools by Robert Shand, Stephen M. Leach, Fiona M. Hollands, Florence Chang, Yilin Pan, Bo Yan, Dena Dossett, Samreen Nayyer-Qureshi, Yixin Wang and Laura Head in American Journal of Evaluation
Supplemental Material
sj-pdf-6-aje-10.1177_10982140211071017 - Supplemental material for Program Value-Added: A Feasible Method for Providing Evidence on the Effectiveness of Multiple Programs Implemented Simultaneously in Schools
Supplemental material, sj-pdf-6-aje-10.1177_10982140211071017 for Program Value-Added: A Feasible Method for Providing Evidence on the Effectiveness of Multiple Programs Implemented Simultaneously in Schools by Robert Shand, Stephen M. Leach, Fiona M. Hollands, Florence Chang, Yilin Pan, Bo Yan, Dena Dossett, Samreen Nayyer-Qureshi, Yixin Wang and Laura Head in American Journal of Evaluation
Supplemental Material
sj-docx-7-aje-10.1177_10982140211071017 - Supplemental material for Program Value-Added: A Feasible Method for Providing Evidence on the Effectiveness of Multiple Programs Implemented Simultaneously in Schools
Supplemental material, sj-docx-7-aje-10.1177_10982140211071017 for Program Value-Added: A Feasible Method for Providing Evidence on the Effectiveness of Multiple Programs Implemented Simultaneously in Schools by Robert Shand, Stephen M. Leach, Fiona M. Hollands, Florence Chang, Yilin Pan, Bo Yan, Dena Dossett, Samreen Nayyer-Qureshi, Yixin Wang and Laura Head in American Journal of Evaluation
Footnotes
Acknowledgments
We are grateful to Joseph Prather, retired from Jefferson County Public Schools, for invaluable assistance in assembling the data, and to Minetre Martin of American University for help with assembling the final manuscript. We also appreciate comments from Tommaso Agasisti, Mara Soncin, and participants in the 2020 Institute for Education Sciences Principal Investigators’ conference and the Spring 2020 Association for Education Finance and Policy conference, where earlier versions of this work were presented.
Funding
The research reported here was supported by the Institute of Education Sciences, U.S. Department of Education, through grant R305H180003 to Teachers College, Columbia University. The opinions expressed are those of the authors and do not represent views of the Institute or the U.S. Department of Education.
Declaration of Conflicting Interests
The author(s) declared no potential conflicts of interest with respect to the research, authorship, and/or publication of this article.
Supplemental Material
Supplemental material for this article is available online.
References
Supplementary Material
Please find the following supplemental material available below.
For Open Access articles published under a Creative Commons License, all supplemental material carries the same license as the article it is associated with.
For non-Open Access articles published, all supplemental material carries a non-exclusive license, and permission requests for re-use of supplemental material or any part of supplemental material shall be sent directly to the copyright owner as specified in the copyright notice associated with the article.