
Abstract
Schools are a critical setting for improving child nutrition and food security and preventing obesity in the United States. The U.S. Department of Agriculture mandates that the Supplemental Nutrition Assistance Program–Education, known as CalFresh Healthy Living (CFHL) in California, implements obesity prevention efforts that utilize multicomponent policy, systems, and environmental change interventions supplemented with direct and indirect education. However, evaluation of these complex interventions has proven challenging due to a lack of established evaluation methods, particularly for comprehensively measuring the dose of multicomponent interventions. This article proposes and demonstrates a method to score the dose of multicomponent California Department of Public Health–funded CFHL school interventions received by children attending public schools, using administrative data collected by CFHL in California.
Introduction
In order to effect behavior change to prevent chronic disease and risk factors such as obesity, authoritative bodies such as the National Academy of Medicine (National Academy of Medicine [NAM], 2012), the American Heart Association (Kumanyika et al., 2008), and the Centers for Disease Control and Prevention have recommended moving beyond educational interventions alone. They advise a focus on changing policies, systems, and environments (PSEs), recognizing the critical role of physical and social environments in shaping individual behaviors (Lyn et al., 2013). This has contributed to a rising interest in developing methods suitable for evaluating nonstandardized, multicomponent community interventions that tend to vary in scope and implementation in accordance with local community considerations.
In recent years, few investigations have been undertaken to characterize these interventions in terms of their reach, type, scope, and intensity in order to enable examination of their association with targeted outcomes (Cheadle et al., 2018; Frongillo et al., 2017; Ritchie et al., 2018; Strauss et al., 2018; Webb et al., 2018). The lack of adequate evaluation methods for studies of multicomponent, complex interventions with a focus on changing environments may stem in part from challenges in measuring and monitoring these efforts and documenting exposure of target populations. As Hawe (2015) reminds us, as intervention complexity increases, so too does the unpredictability of its effects, leading to increased importance of understanding intervention details. These details, which include the nature of the intervention, implementation fidelity, as well as the intervention’s intensity, duration, and reach, underpin the understanding and interpretation of outcomes (Armstrong et al., 2008).
Thus, several investigators have turned their attention to developing methods to quantify the degree of exposure to complex obesity prevention interventions (Cheadle, Rauzon, et al., 2012; Cheadle, Schwartz, et al., 2012; Fawcett et al., 2015; Kuo et al., 2018; Molitor et al., 2015). Exposure scores for complex multicomponent community interventions are not consistently defined or measured in the literature. However, they commonly include a component for estimating or measuring the reach of the intervention (i.e., the proportion of the target population that was exposed to the intervention) along with a measure of certain aspect(s) of the interventions such as anticipated effect size, frequency of exposure, intervention intensity, completeness of exposure, and/or breadth of targeted outcomes or strategies employed (Fawcett et al., 2015; Harner et al., 2018). The intervention characteristics included in reported scores vary according to the availability of data and the research question under consideration.
The intervention score described in this article was initially developed for evaluating California Department of Public Health’s CalFresh Healthy Living program (CDPH-CFHL), known nationally as the Supplemental Nutrition Assistance Program–Education (SNAP-Ed). The U.S. Department of Agriculture (USDA, 2018) provides SNAP-Ed funding to all states and territories to implement interventions that aim to promote and support healthy eating and active living and to prevent obesity among low-income populations, with an emphasis on PSEs supported by direct and indirect education. USDA (2017) defines direct education as nutrition or physical activity education activities or lessons, where (1) participants are actively engaged in the learning process with an educator and (2) participants’ demographic characteristics are collected. Indirect education is defined as the distribution of information and/or resources to participants when they are not actively engaged in the learning process with an educator, including passive or brief learning activities such as health fairs, displays or posters, and the distribution of flyers (USDA, 2017). Classes for the public that do not provide an opportunity to collect participants’ demographic characteristics are also classified by USDA (2017) as indirect education. PSE interventions are defined as those that involve making changes to nutrition- or physical activity–related policies, systems, and/or environments such as systematically changing the foods offered in school cafeterias or stores, changing contracts with food suppliers for more healthful or local foods, modifying physical activity opportunities at school, or other similar interventions (USDA, 2017).
Despite the national reach and significance of SNAP-Ed, published evaluation studies of SNAP-Ed interventions are limited. Further, although PSE interventions are becoming more common (Gleason et al., 2018), and tips and tools for assessing PSE changes are accumulating (USDA, 2016), to date, most SNAP-Ed evaluation studies have reported only on impacts of direct and indirect education (Long et al., 2013; Molitor et al., 2016; USDA, 2012).
CDPH-CFHL distributes over $50 million in funding annually to local health departments (LHDs), thereby providing the largest single source of ongoing funding for nutrition and physical activity education, promotion, and environmental supports in California. The LHDs participating in CDPH-CFHL adapt or develop local interventions in accordance with guidance provided at the state and federal levels. These multicomponent interventions therefore vary from county to county and site to site in both design and implementation, making it challenging to assess program effectiveness. Thus, we aimed to develop a method for creating a quantifiable intervention score that would allow us to statistically assess the effectiveness of CDPH-CFHL programs as delivered across the state. One commonality of CDPH-CFHL interventions is that they are based on the same CFHL theory of change, which posits that comprehensive integration of direct education, indirect education, and PSE changes is the most likely approach to lead to sustainable improvements in targeted behavior and health outcomes. Therefore, in accordance with this CFHL theory of change, we aimed to develop a score, within the limits of the available data, to measure site-level intervention dose in terms of reach in combination with the amount of direct and indirect education and the comprehensiveness of PSE strategies. Although CDPH-CFHL interventions occur in a variety of settings, as a first step, we chose to develop a score for interventions implemented in public schools as schools are a priority setting for CDPH-CFHL, are the most common setting where CDPH-CFHL interventions occur, and because available data would make it possible to link individual students’ outcome data to the schools they attend.
This score will enable us to use multivariate regression analyses to test the association of the CDPH-CFHL school intervention dose with available outcomes of interest such as body mass index (BMI) z-scores, fitness measures, and dietary behaviors of students. The same procedure could be used for other settings, or encompass all settings, if the required data were available.
Method
We created the algorithm to score CDPH-CFHL school interventions based on the two federal fiscal years (FFY) for which data were available (FFY16 and FFY17) in order to increase the likelihood that the algorithm would be feasible and valid across multiple years, even when the distribution of intervention components change over time. Because the CDPH-CFHL program is an ongoing program, our aim is to generate these scores annually and use them in analyses to inform interventions on an ongoing basis.
Data Collection for Intervention Details
Data were collected to capture the three categories of CDPH-CFHL interventions: direct education, indirect education, and PSEs. Information about the type, reach, and quantity of direct and indirect education activities implemented at schools was collected via the Activity Tracking Form (ATF). The ATF was a Structured Query Language server-based online data collection system developed in partnership between the Public Health Institute and CDPH, based on code from an ATF originally developed for, and used by, Pennsylvania SNAP-Ed. Each direct education activity was defined as one curriculum offered to the same group of individuals. For each direct education activity, information including the name of the implemented curriculum and the number of hours and dates of education delivered was input into the ATF. For school-based direct education, the number and demographic characteristics of students reached by these interventions were recorded once at the beginning of each session and subsequently entered into the ATF. If students left school midway during the session, they were still counted as participating.
For each indirect education activity, information including the nature of/medium used for the activity and the number of contacts made (i.e., number of material recipients, class participants, or event attendees) was entered into the ATF.
PSE efforts at each school and district site were collected via an online module in the Program Evaluation and Reporting System (PEARS), developed by the Office of Education Innovation and Evaluation at Kansas State University in partnership with the Nutrition Policy Institute at the University of California, Division of Agriculture and Natural Resources. For each site, LHDs reported (1) the PSE changes that were made that year, selected from a predetermined list, and (2) the combined, unduplicated reach of all the PSE changes at that site. No additional data were available regarding the frequency, intensity, or completeness of the PSE interventions.
LHDs and their contractors were able to enter information about direct education and indirect education activities into the ATF throughout the year and were able to enter information about PSE interventions into PEARS 1–2 months near the close of the fiscal year (i.e., activities completed from October 1, 2015, to September 30, 2016, were entered in September and October of 2016).
Data Quality Assurance and Quality Control
For direct and indirect education intervention tracking, a variety of methods were used to limit data entry errors and ensure accurate reporting. County-level subcontractors entered intervention information into the ATF. The ATF included many data validation features such as requiring entry of key information, limitations on the type of data that could be entered into certain fields such that text or numerical data were only entered where appropriate, and skip logic ensuring only relevant questions were displayed. The entered data then went through a four-stage review process conducted sequentially by LHD staff, state project officers, state implementing agency reviewers, and, finally, state data analysts.
For PSE intervention tracking, PEARS users were provided with webinar training, a reporting worksheet, and help documentation ahead of the reporting period to ensure adequate preparation and high-quality, standardized data entry. Online help documentation included instructions on how to select the appropriate setting and how to calculate reach (“PSE Site Activities,” 2020). Reach was defined as the unduplicated number of people who come in direct contact with one or more PSE changes at a site over the course of a year. A number of additional examples were provided for calculating reach in schools, such as: If a school starts a school garden, improves school meals, and increases PE time, the reach of these 3 PSEs is not added together. In this case, some of the strategies reach the entire student population, so reach equals total enrollment or average daily attendance for a given reporting year. If a K-5 school integrates gardening into the 4th grade nutrition class, improves opportunities to be physically active during recess for grades 3-5, and starts a K-2 walking school bus program, the total reached would be the number of students in grades 3-5 plus the number of K-2 students who participate in the walking school bus program during a given reporting year. (PSE Site Activities, 2020)
Calculating Dose of CDPH-CFHL Interventions
Similar to calculations for intervention scores by others (Cheadle, Schwartz, et al., 2012; Fawcett et al., 2015), the CDPH-CFHL intervention score includes a factor for reach multiplied by a factor characterizing specific characteristic(s) of the intervention, in our case calculated as follows: (reach of the intervention) × (intensity of the intervention). Based on the CFHL theory of change, availability of data, and hypotheses to be tested using this score, we defined intensity in terms of the amount of direct and indirect education and the comprehensiveness of the PSE changes.
To arrive at an overall intervention dose score, every CDPH-CFHL intervention activity occurring at school sites was classified into one of the three categories (PSE, direct education, or indirect education). Reach and intensity were then quantified for each of the three intervention categories based on the available data. Scores for each category were calculated and scaled, as described below. To arrive at a single intervention dose score for each school, the three scaled scores were weighted and summed (as described below and shown in Figure 1).
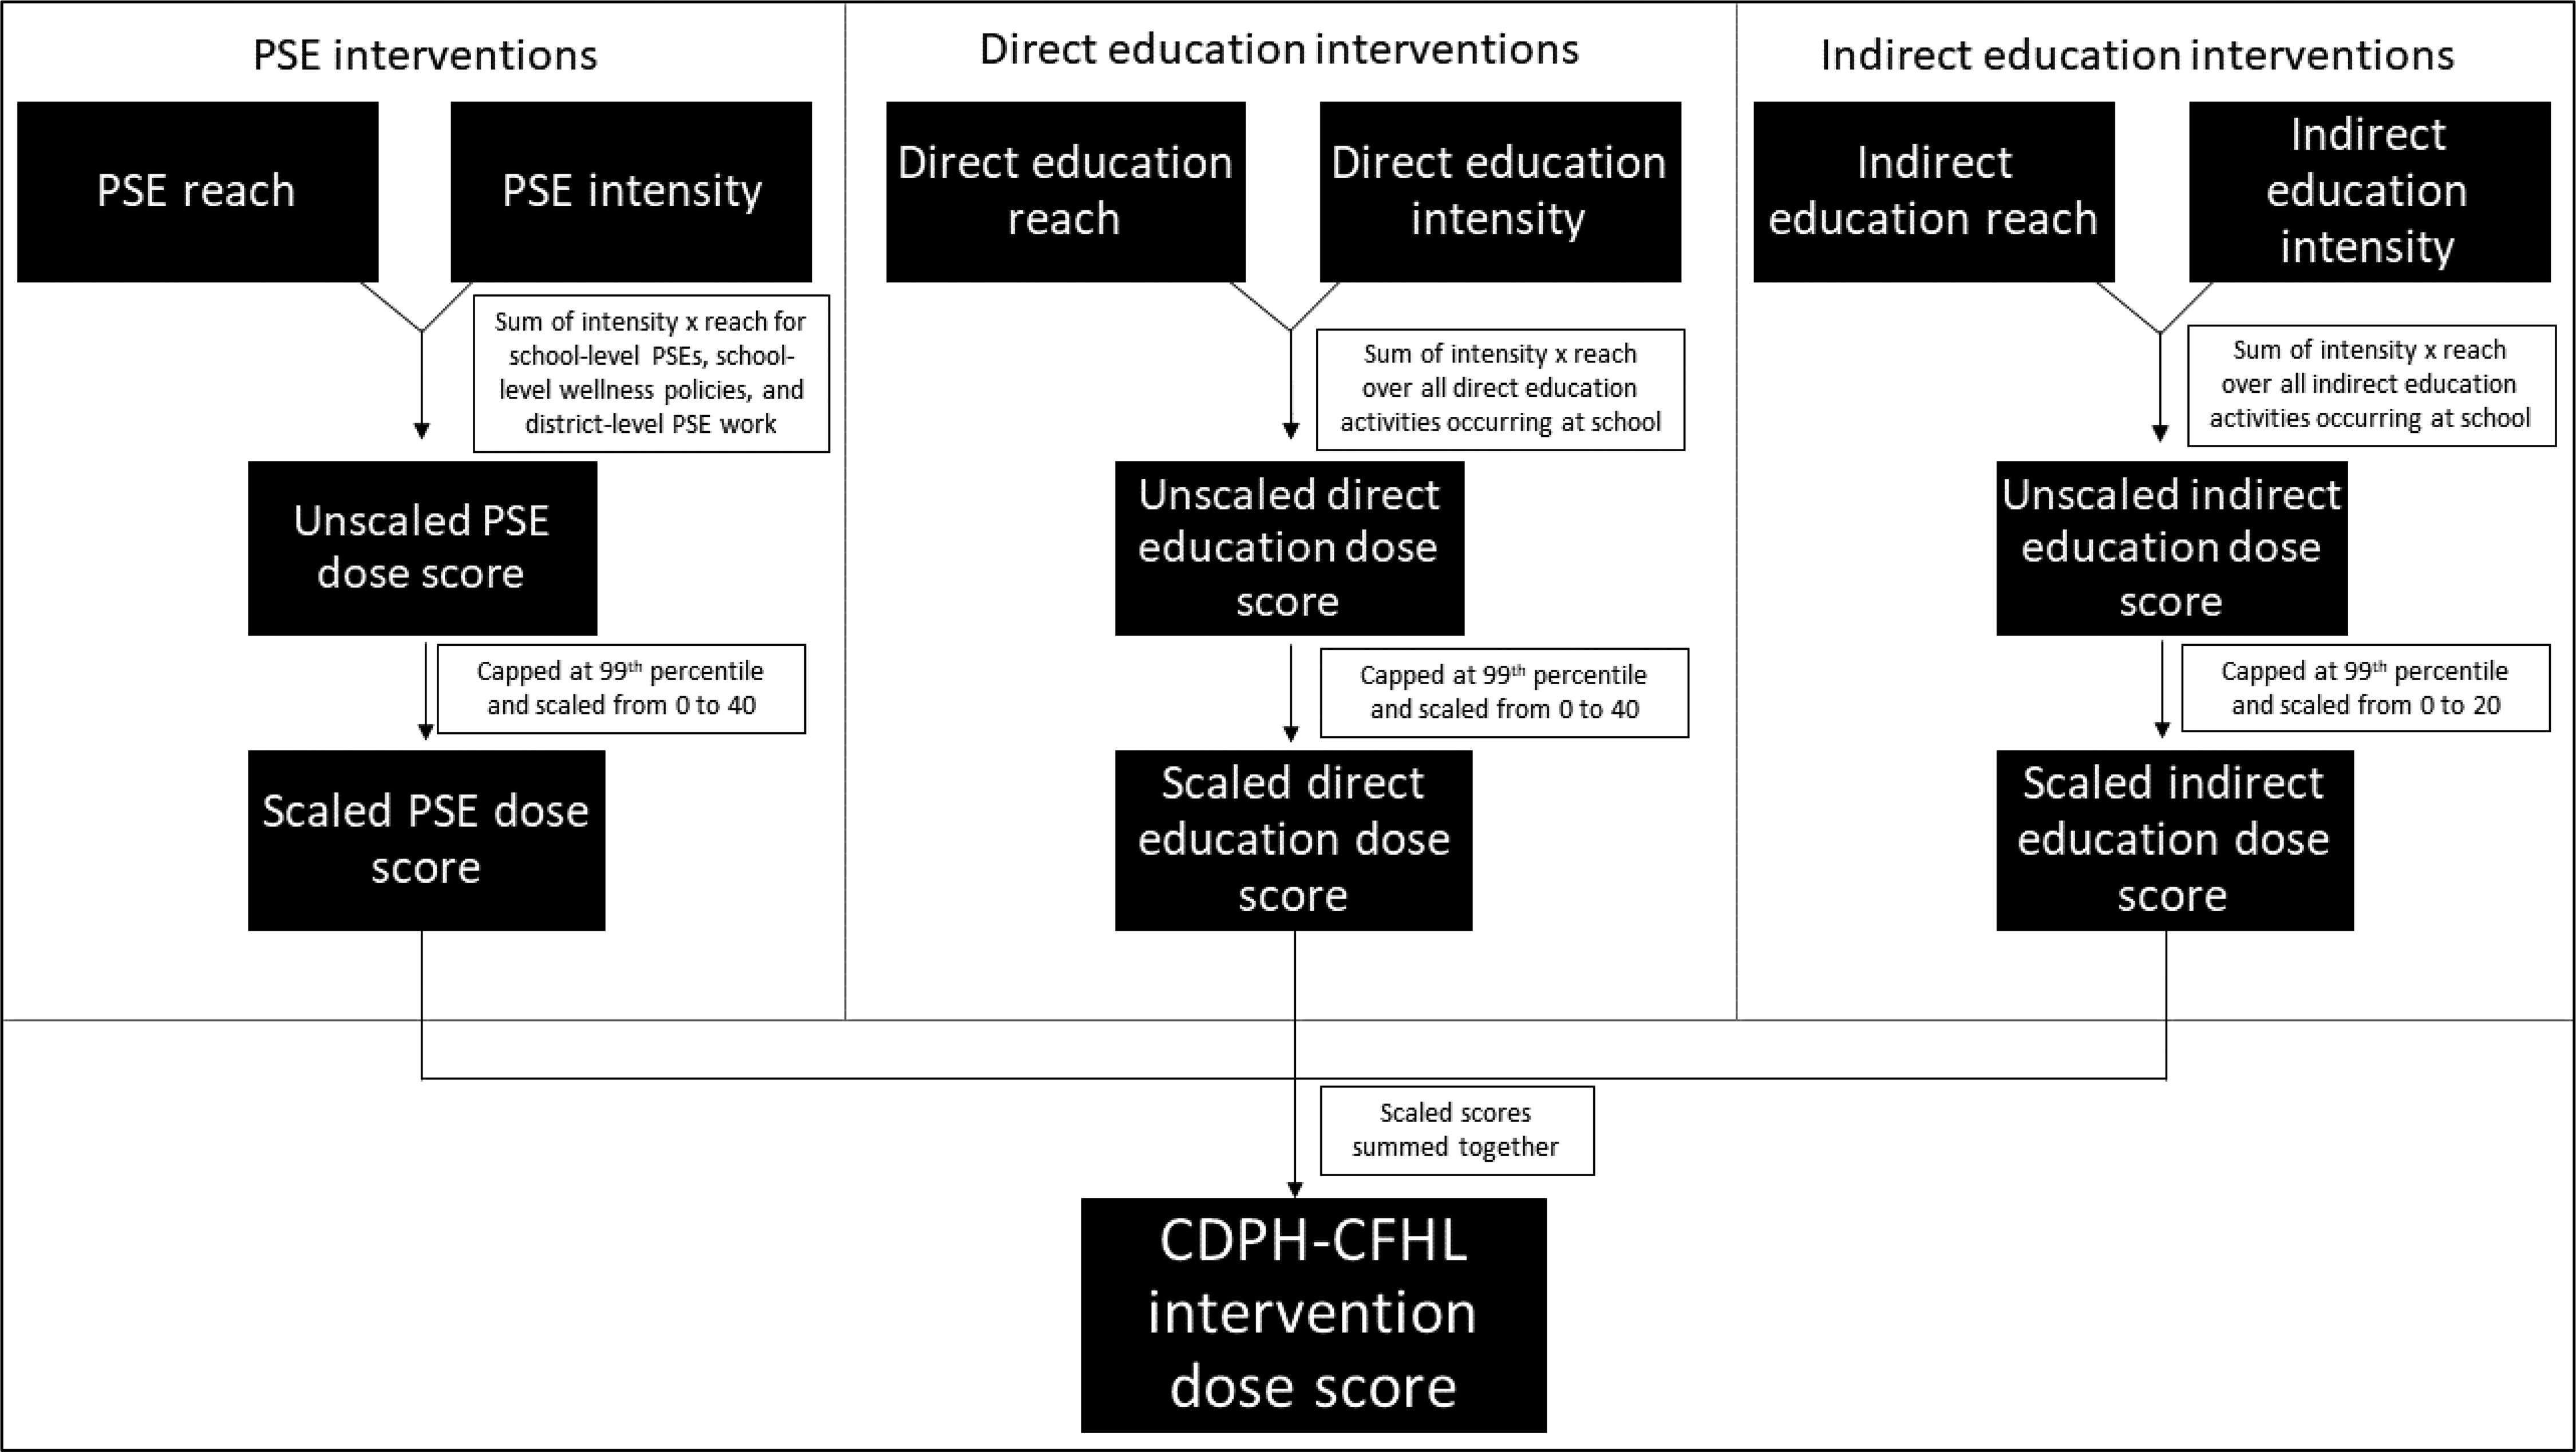
Flowchart of the California Department of Public Health (CDPH) CalFresh Healthy Living (CFHL) dose scoring protocol.
PSE dose score
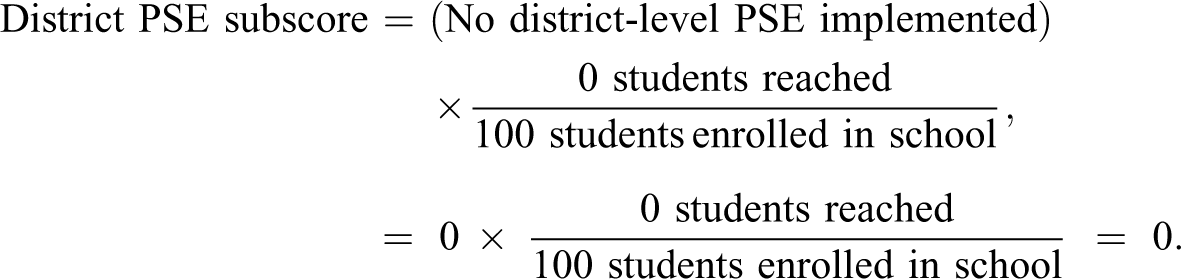
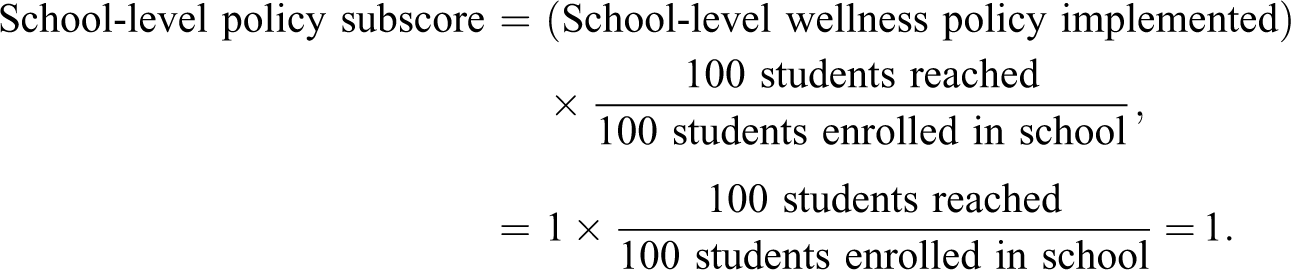
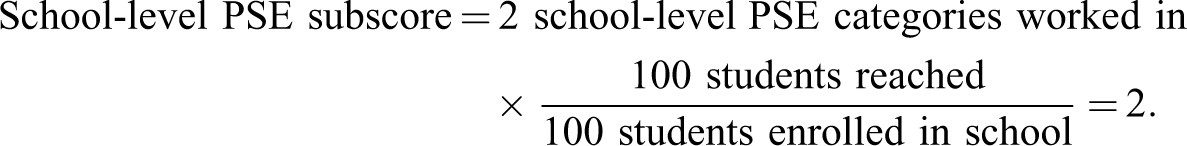
The intensity of PSE interventions was scored based on responses to a checklist of 45 types of PSE changes reported in PEARS. With the aim of creating a measure of the comprehensiveness of the PSE strategies employed, we first grouped each of the 45 changes into one of the 17 PSE categories listed in Table 1, which represent the various times of the day, occasions, and ways students could be exposed to PSE interventions at the school. We also included an additional category indicating whether the school was in a district where PSE efforts occurred at the district level (most commonly district wellness policies). LHDs reported both district- and school-level PSE changes. Any district-level changes that led to PSE change at the school-level were reported in both the district-level and school-level reports; therefore, changes reported solely at the district level suggest that there were no corresponding changes at the school level. The PSE score for each individual school includes three subscores: a district PSE subscore, a school-level policy subscore, and a school-level PSE subscore. In the district PSE subscore, intensity was assigned a value of 1 if any district-level PSE change was reported for the district to which the school belongs; intensity was then multiplied by reach, defined as the proportion of enrolled students reached by the district-level PSE change. In the school-level policy subscore, intensity was assigned a value of 1 if any change was reported in the school-level wellness policy category; intensity was then multiplied by a default reach of 100%. In the school-level PSE subscore, intensity, calculated as the sum of the other 16 school-level PSE categories, was multiplied by reach, calculated as the number of students who came into direct contact with one or more of these PSE changes at the school over the year divided by the total number of students enrolled in the school.
Number and Percent of the California Department of Public Health (CDPH) CalFresh Healthy Living (CFHL) Intervention Schools With Policy, Systems, and Environmental (PSE) Changes Adopted, by PSE Category, in Federal Fiscal Years (FFY) 2016 and 2017.
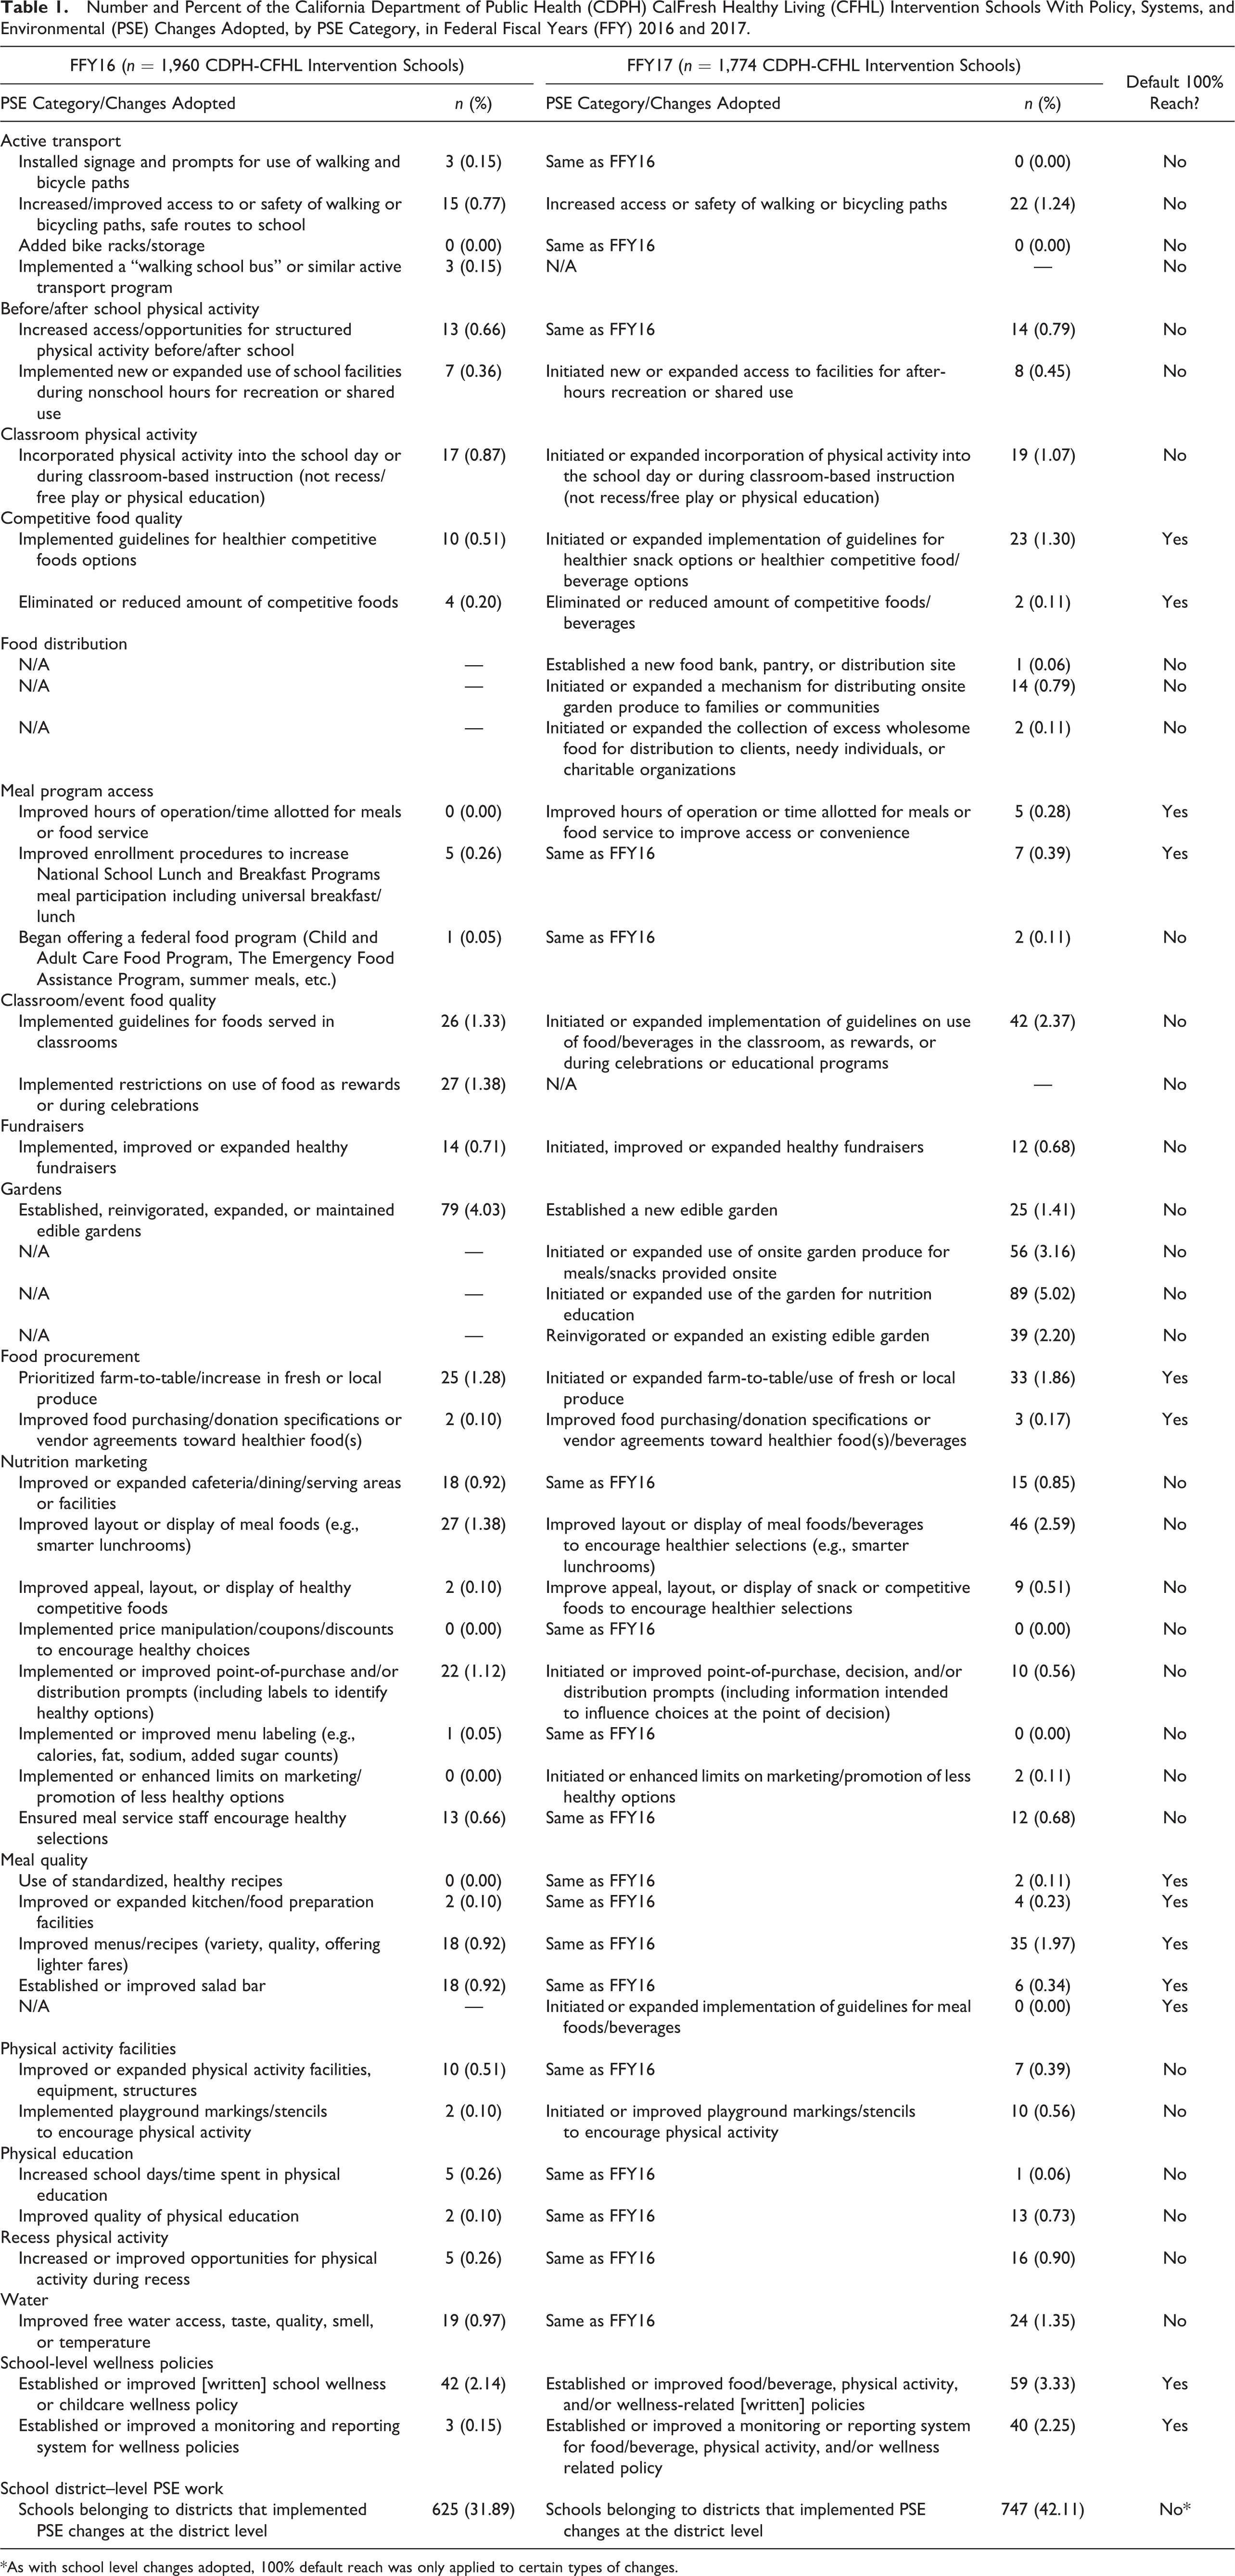
*As with school level changes adopted, 100% default reach was only applied to certain types of changes.
For example, if a school with 100 students enrolled did the following interventions: established a school-level wellness policy, installed signage and prompts for use of walking and bicycle paths (a change in the active transport PSE category), and increased access/opportunities for structured physical activity before/after school (a change in the before/after school physical activity PSE category), and these interventions reached all of the students enrolled in the school, then the PSE score would be calculated as follows:
The district PSE subscore would be calculated as:
The school-level policy subscore would be calculated as:
And, the school-level PSE subscore would be calculated as:
The PSE score would then be calculated as the sum of the three PSE subscores, as follows:

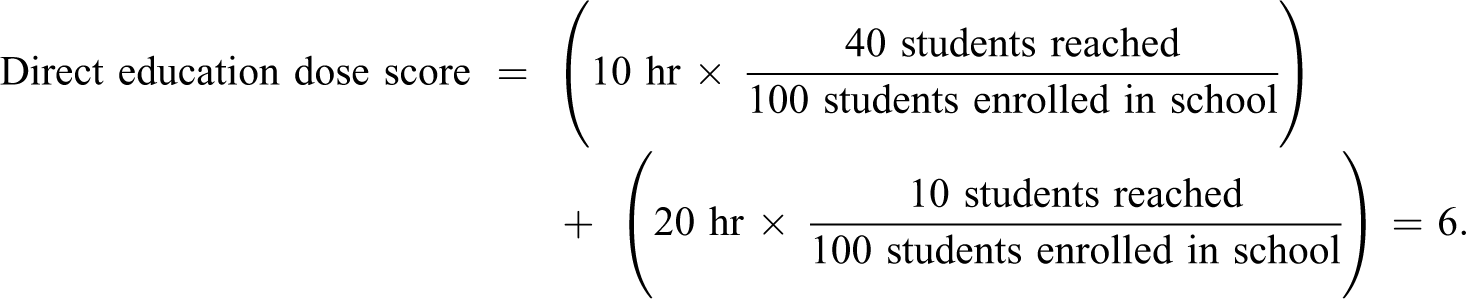
Direct education dose score
The score for direct education interventions was defined as the sum of the product of the hours of each direct education activity delivered (its intensity) and the proportion of total students reached by that activity (its reach). For example, if there were two direct education activities at a school with 100 students enrolled, one that was 10 hr with 40 students reached and another that was 20 hr with 10 students reached, the direct education dose score would be calculated as follows:
Indirect education dose score
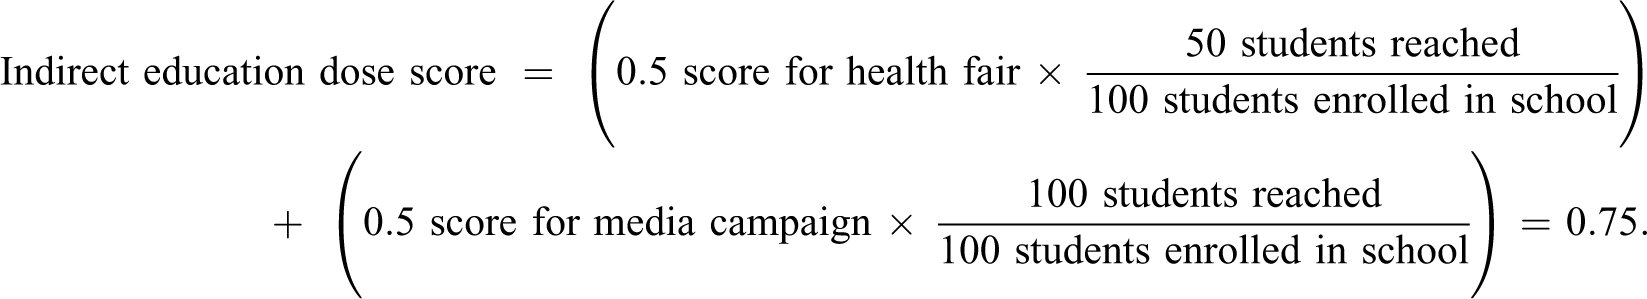
To determine the intensity of indirect education activities, we first classified activities into one of three categories: classes (defined as indirect education by USDA when demographic data were not collected for participating individuals), in-person events such as demonstrations or fairs, or materials/media distribution. We assigned an intensity score of 1.0 for each class and an intensity score of 0.5 for each in-person event and each distinct material distributed or media delivered. Classes were given a higher score because it is assumed the “intensity” of this type of intervention is greater than that of the other two indirect education categories. The indirect education dose score was then calculated as the sum of the products of the intensity and proportion of the total student population reached for each activity. For example, if there were two indirect education activities at a school with 100 students enrolled, one health fair that reached 50 students, and a media campaign that reached all students, the indirect education dose score would be calculated as follows:
Overall Dose of CDPH-CFHL Interventions
To create a single, overall CDPH-CFHL intervention dose score for each school, we combined the dose scores for PSE, direct education, and indirect education. Since the units for the intensity portion of each score were different, it was necessary to standardize the scores to make the magnitude of values on each score comparable. To do this, the values of each score were first capped at the 99th percentile (6.0, 13.9, and 14.7 for overall PSE, direct education, and indirect education, respectively) to reduce the impact of extreme outliers. Then, similar to the approach used in the Healthy Communities Study, where nonrecurring events and passive educational materials were ranked lower in intensity (Fawcett et al., 2015), we scaled the scores for each intervention category such that indirect education activities were weighted less than PSE and direct education activities. Specifically, the dose scores for PSE and direct education were each scaled from 0 to 40, with 0 indicating a school without any PSE or direct education interventions and 40 indicating a school with the most intense and far-reaching PSE or direct education activities in this sample. The indirect education dose score was scaled from 0 to 20, with 0 indicating a school without any indirect education activities and 20 indicating a school with the most intense and wide-reaching indirect education efforts in this sample. The overall score for school-level CDPH-CFHL intervention dose was then calculated by summing together the scaled PSE, direct education, and indirect education scores, yielding a possible range of 0–100.
Applying this scoring algorithm to the data collected in PEARS and the ATF in FFY16-17 yielded an overall CDPH-CFHL dose score with a skewed, trimodal distribution. We therefore examined this distribution and, using naturally occurring cut points, categorized the dose score into five categories of dose to ensure sufficient power for analyses to test the association between student-level outcomes and levels of CDPH-CFHL intervention: none, low, medium-low, medium-high, and high.
In addition to the overall CDPH-CFHL intervention score, we used the same scoring algorithm to generate separate scores specific to (1) nutrition-related interventions only and (2) physical activity–related interventions only. Wellness policy efforts were considered both nutrition related and physical activity related.
Results
Prevalence of Interventions
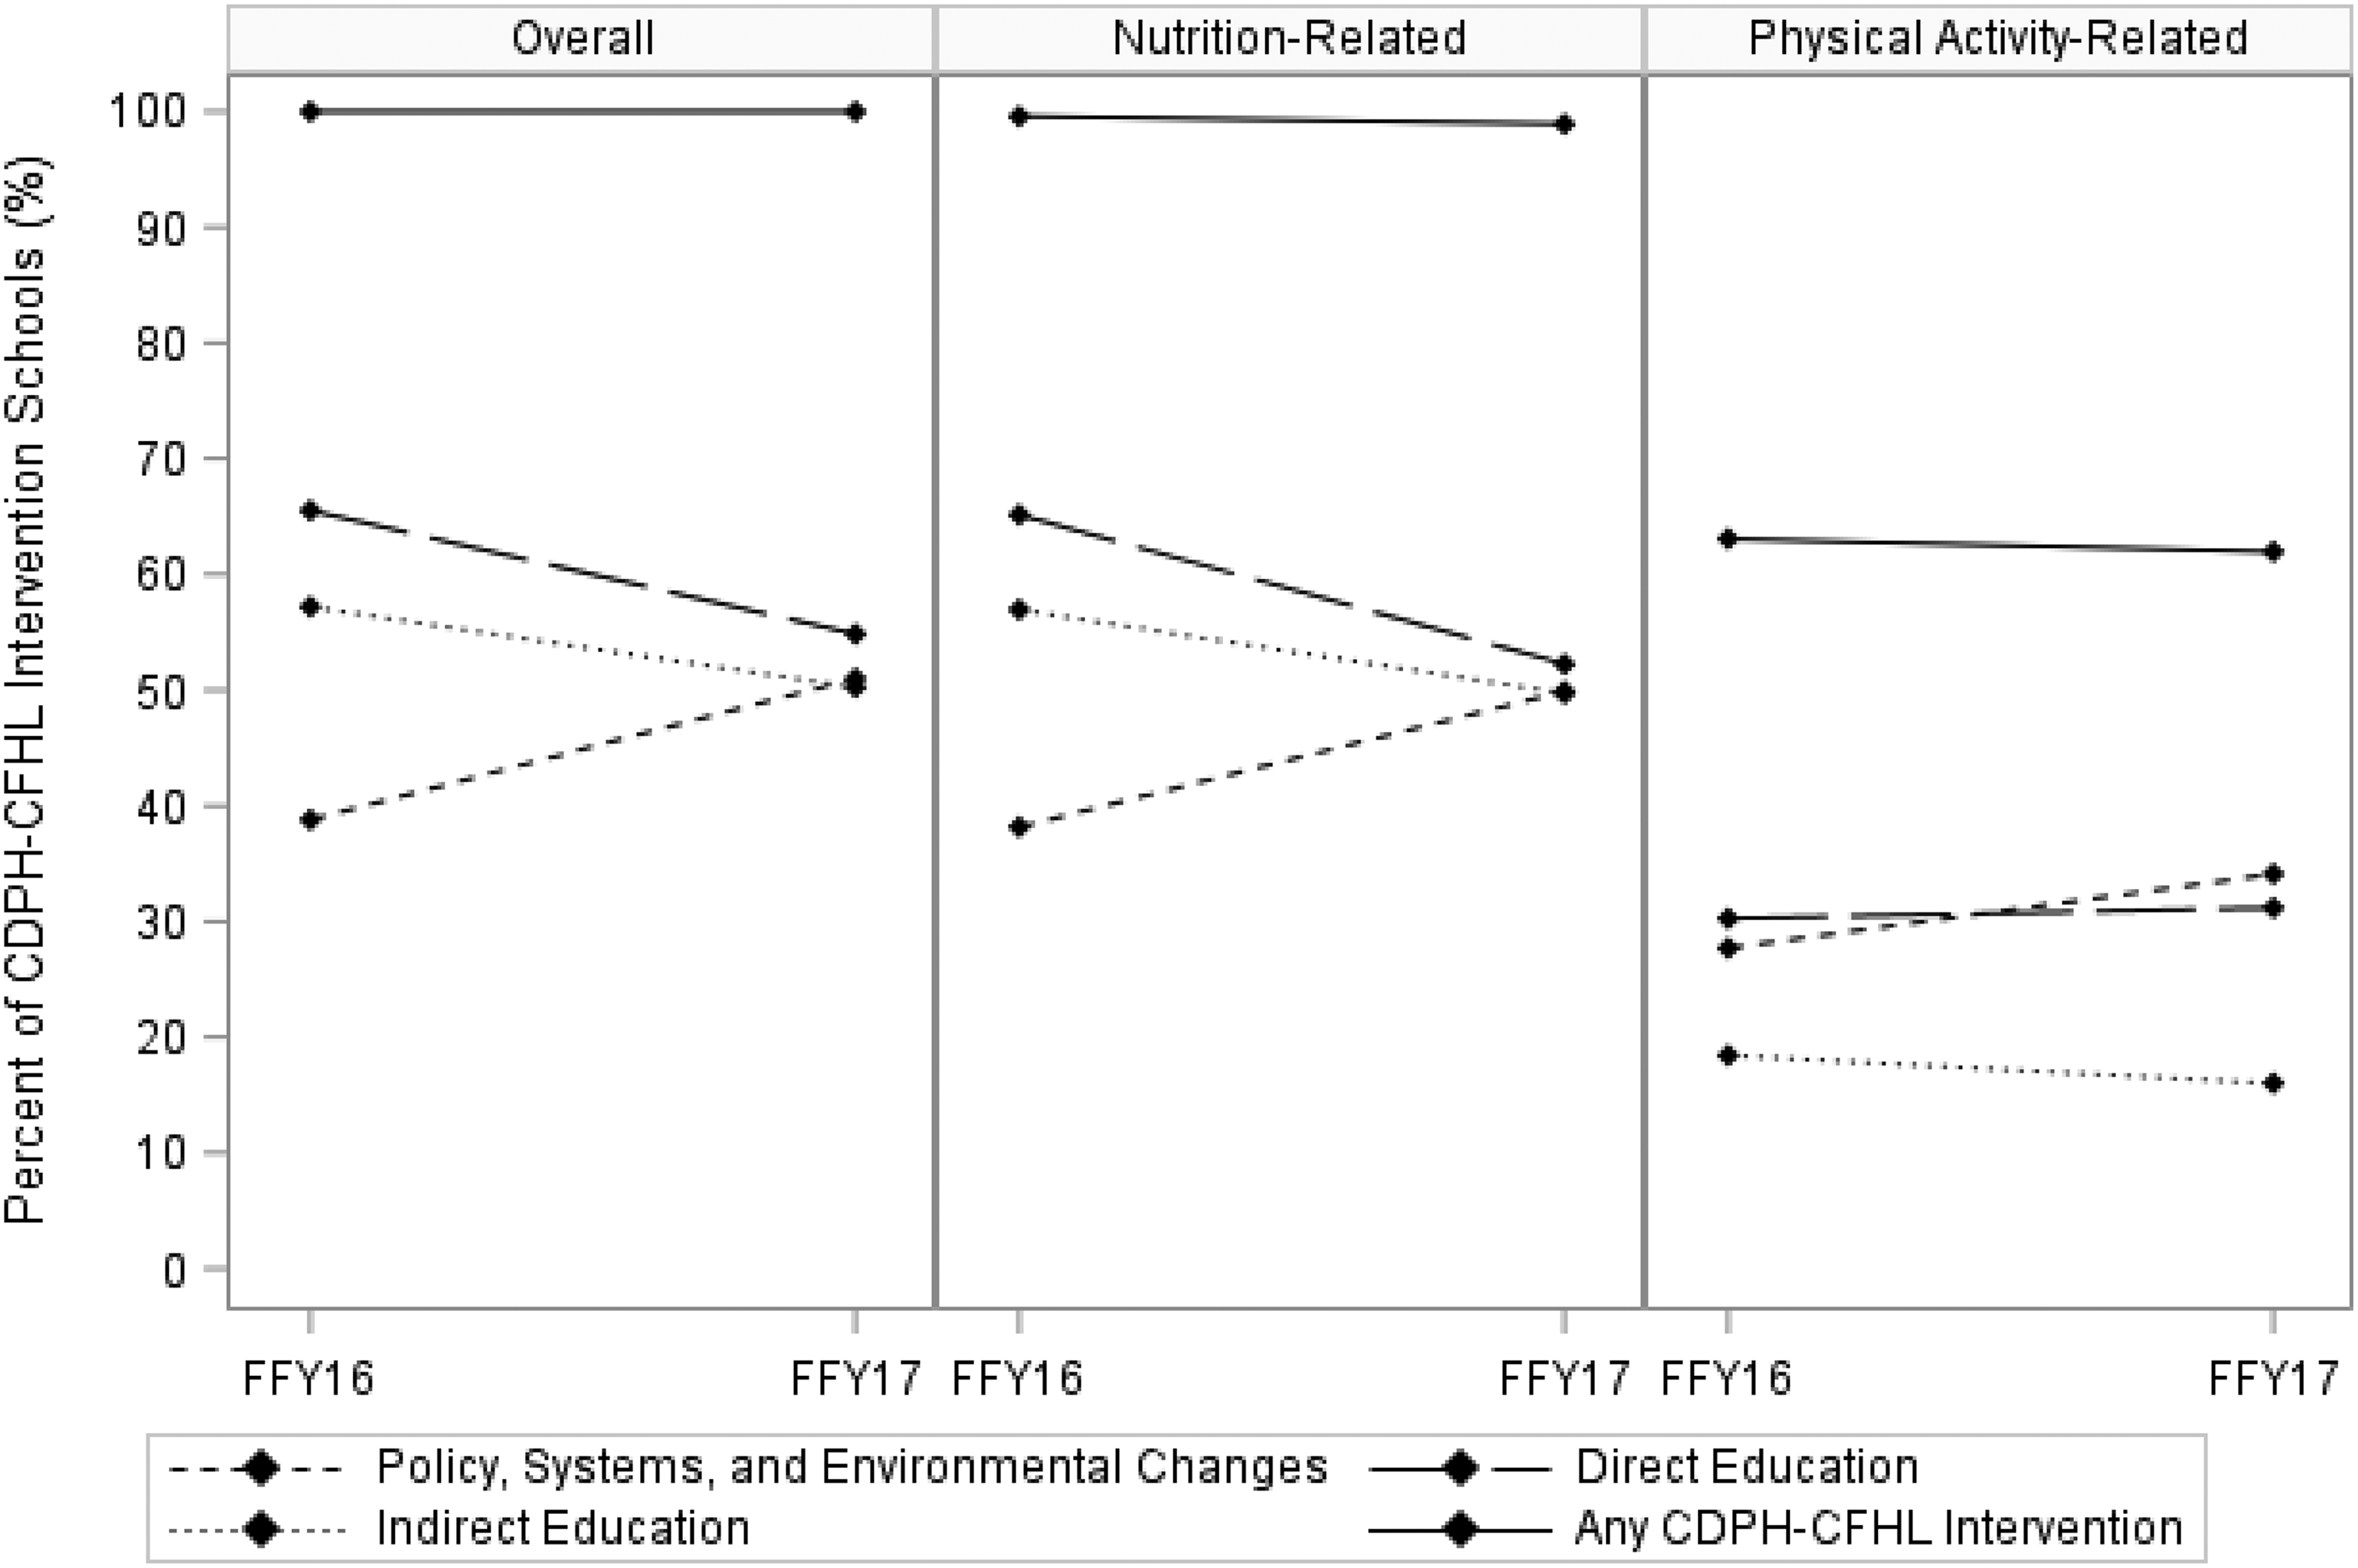
CDPH-CFHL interventions occurred in 1,960 of the 7,742 CFHL-eligible schools in FFY16 and in 1,774 of the 7,030 eligible schools in FFY17. In FFY16, 321 of the 1,386 districts in California had at least one school with CDPH-CFHL interventions, and in FFY17, 282 of the 1,386 districts had at least one school with CDPH-CFHL interventions. In FFY16 and FFY17, districts with at least one school with CDPH-CFHL interventions had a median of two schools (25th percentile, 75th percentile [25th, 75th]: 1, 6) with any CDPH-CFHL intervention and a median of two schools (25th, 75th: 1, 5) with any school-level CDPH-CFHL intervention per district. Nearly all of the CDPH-CFHL intervention schools (99.6% in FFY16, 98.9% in FFY17) conducted nutrition interventions, and over 60% conducted physical activity interventions (Figure 2).
California Department of Public Health’s (CDPH) CalFresh Healthy Living (CFHL) interventions occurring in public schools in California, federal fiscal years (FFY) 2016–2017 (n = 1,960 schools in FFY16, 1,774 schools in FFY17).
Direct education, which occurred at 65% of CDPH-CFHL schools, was the most commonly implemented of the three intervention categories in FFY16, followed by indirect education at 57% of CDPH-CFHL intervention schools and (school- or district-level) PSEs at 39% of CDPH-CFHL intervention schools. There was a substantive increase in the proportion of CDPH-CFHL intervention schools utilizing school- or district-level PSE strategies in FFY17, resulting in a more even distribution of CDPH-CFHL intervention schools implementing each category of intervention; that is, 55% did direct education, 51% did PSEs, and 50% did indirect education in FFY17. This increase over time in proportion of PSEs occurred for both nutrition-related and physical activity–related PSEs.
More CDPH-CFHL intervention schools did nutrition-related work than physical activity-related work in each of the three intervention categories. While direct education was the most common intervention category for both nutrition- and physical activity–related work in FFY16 (at 65% and 30% of CDPH-CFHL intervention schools, respectively), in FFY17, PSE became the most common intervention category for physical activity–related work (at 34% of CDPH-CFHL intervention schools).
Nature of the Interventions
Among CDPH-CFHL intervention schools that implemented PSE interventions, the most common PSE category, by far, was schools belonging to districts that implemented PSE changes, such as wellness policies, at the district level (82.2% in FFY16; 82.5% in FFY17) (Table 2). Of the 625 schools in FFY16 and 747 in FFY17 belonging to districts that did PSE work, 597 in FFY16 and 675 in FFY17 reported no school-level PSE change. The next most common PSE categories were school-level changes that established, expanded, or improved school gardens (10.4% in FFY16; 13.0% in FFY17) and school-level wellness policies (5.9% in FFY16 and 8.8% in FFY17; Table 2). In FFY16, the three least common PSE categories were food distribution (0.0%), recess physical activity (0.7%), and meal program access (0.7%). In FFY17, the three least common PSE categories were meal program access (1.3%), fundraisers (1.3%), and physical education (1.4%).
Distribution by PSE Category of the California Department of Public Health CalFresh Healthy Living Intervention Schools That Implemented Policy, Systems, and Environmental Change Interventions in Federal Fiscal Years (FFY) 2016 and 2017.
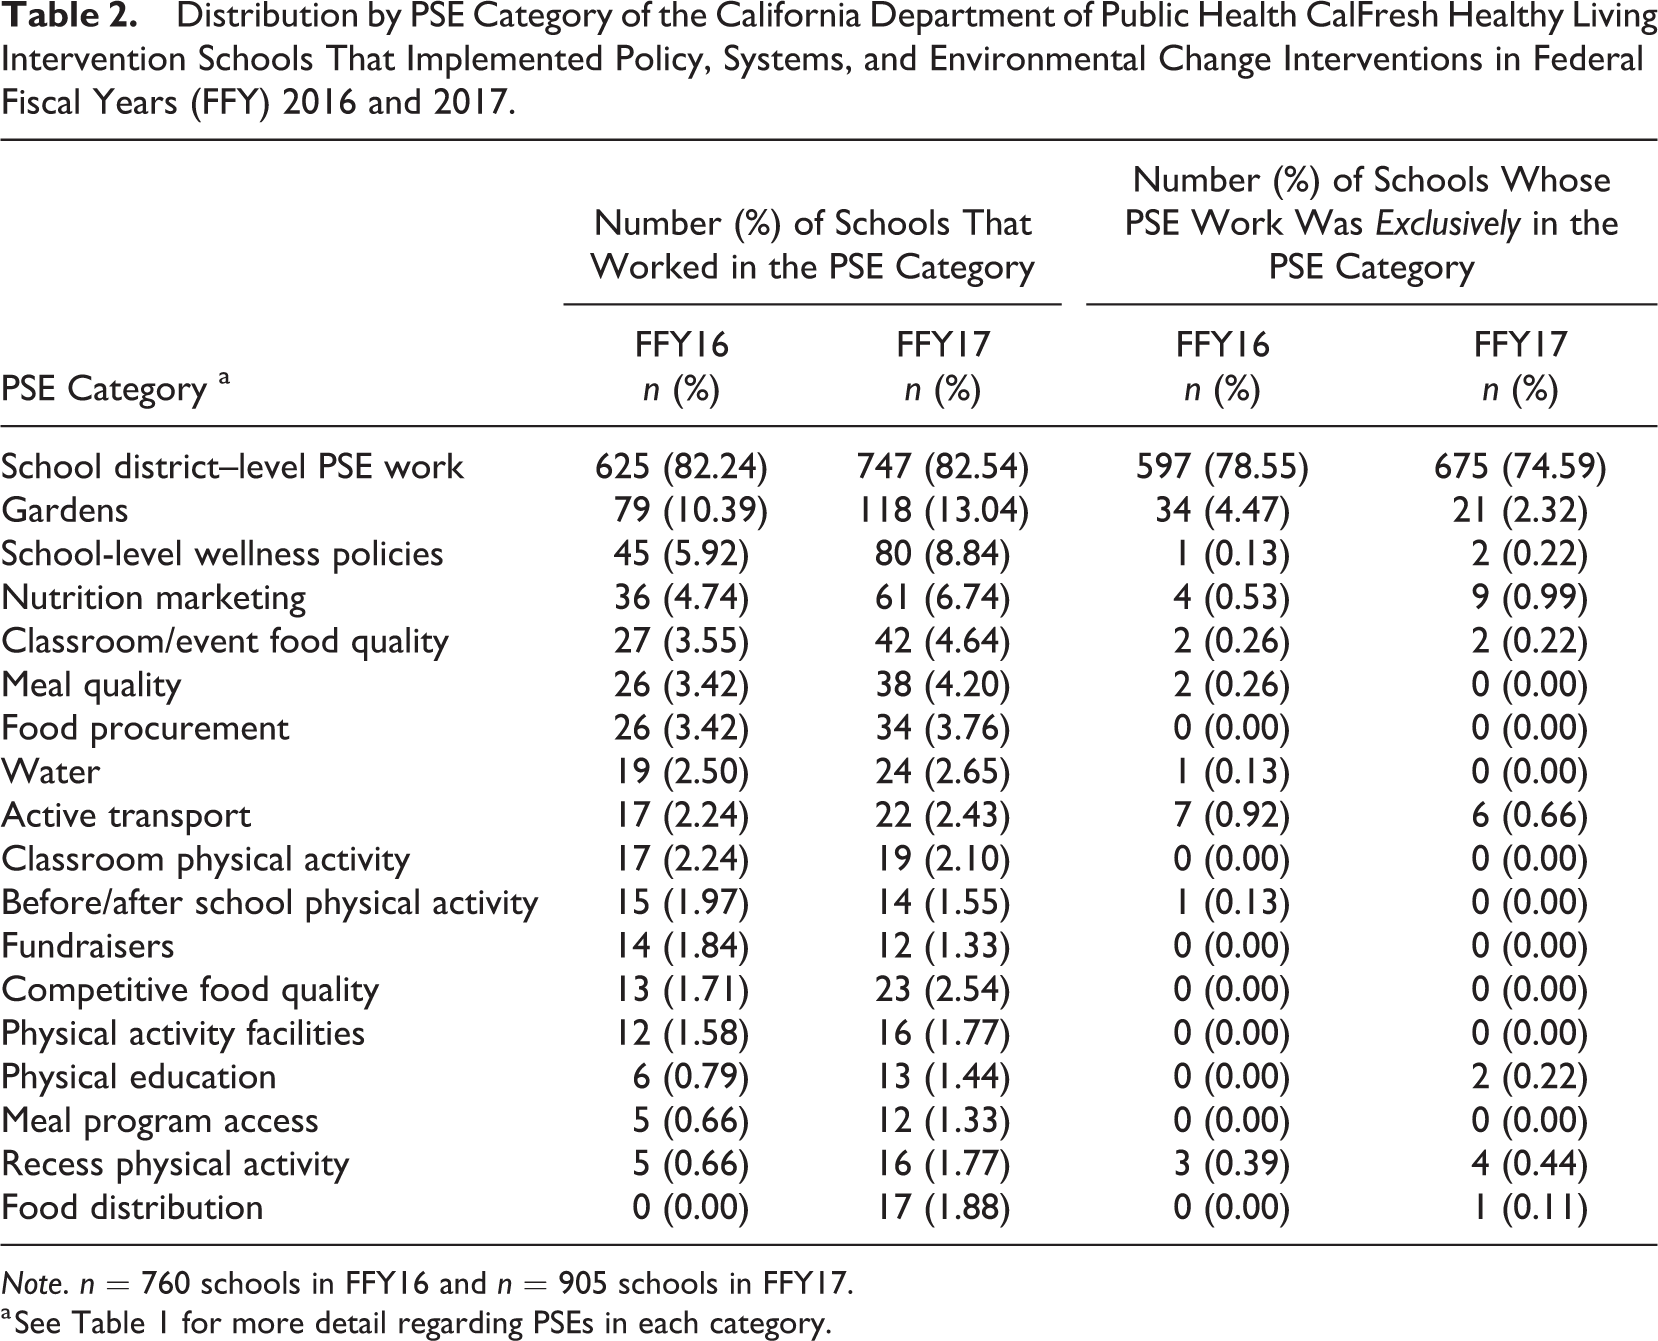
Note. n = 760 schools in FFY16 and n = 905 schools in FFY17.
a See Table 1 for more detail regarding PSEs in each category.
In FFY16, the vast majority of CDPH-CFHL intervention schools implementing any PSE changes worked in only one PSE category (85.8%). More than three quarters of PSE intervention schools had PSE changes implemented solely at the school district level. Gardens were the next most common PSE category among those schools that made changes in only one PSE category. This pattern held true in FFY17 as well though a greater proportion of schools (20.2%) made changes in more than one PSE category.
In FFY16, schools implemented a wide variety of direct education curricula, and most commonly used PowerPlay!, Coordinated Approached to Child Health curricula, and curricula with a focus on MyPlate (data not shown). In FFY17, the most commonly used materials for direct education interventions were Harvest of the Month lessons and handouts, Orange County’s Nutrition 5 Class Lessons, and various MyPlate curricula. In both years, the majority of direct education activities were held in a multisession format.
Schools implementing indirect education interventions most commonly conducted in-person events (66% in FFY16; 55% in FFY17). In FFY16, 43% of schools implementing indirect education interventions distributed materials/media and 39% conducted indirect education classes. In FFY17, 50% of schools with indirect education interventions implemented indirect education classes and 27% distributed materials/media.
CDPH-CFHL Intervention Dose Scores
The intensity portion of the PSE dose score, or number of PSE categories in which interventions were done, ranged from 1 to 11 in FFY16 and from 1 to 9 in FFY17 among CDPH-CFHL intervention schools implementing PSE interventions (data not shown). School-level PSEs had a median reach of 100% (25th, 75th: 82%, 100%) in FFY16 and a median of 100% (25th, 75th: 100%, 100%) in FFY17. District-level PSEs had a median reach of 100% (25th, 75th: 100%, 100%) in both FFY16 and FFY17 among schools with district-level PSEs. After combining the intensity and reach, but before scaling the score, the overall PSE scores ranged from 0.04 to 11.00 at each school with a median of 1.00 (25th, 75th: 1.00, 1.00) in FFY16 and ranged from 0.02 to 9.00 with a median of 1.00 (25th, 75th: 1.00, 1.00) in FFY17. The unscaled PSE score roughly translates to the number of PSE category exposures per enrolled student. For example, the median unscaled PSE score of 1.00 could correspond to 1 PSE category reaching 100% of enrolled students or 2 PSE categories reaching 50% of students. Scaling the score produced overall PSE dose scores which ranged from 0.24 to 40.00 with a median of 6.67 (25th, 75th: 6.67, 6.67) in FFY16 and from 0.15 to 40.00 with a median of 6.67 (25th, 75th: 6.67, 6.67) in FFY17, among CDPH-CFHL intervention schools implementing PSE interventions (Table 3).
Distribution of Policy, Systems, and Environmental (PSE) Change; Direct Education and Indirect Education Dose Scores; and Final, Total California Department of Public Health (CDPH) CalFresh Healthy Living (CFHL) Intervention Dose Scores Among Open, Public Schools in California With CDPH-CFHL Interventions in Federal Fiscal Years (FFY) 2016 and 2017.
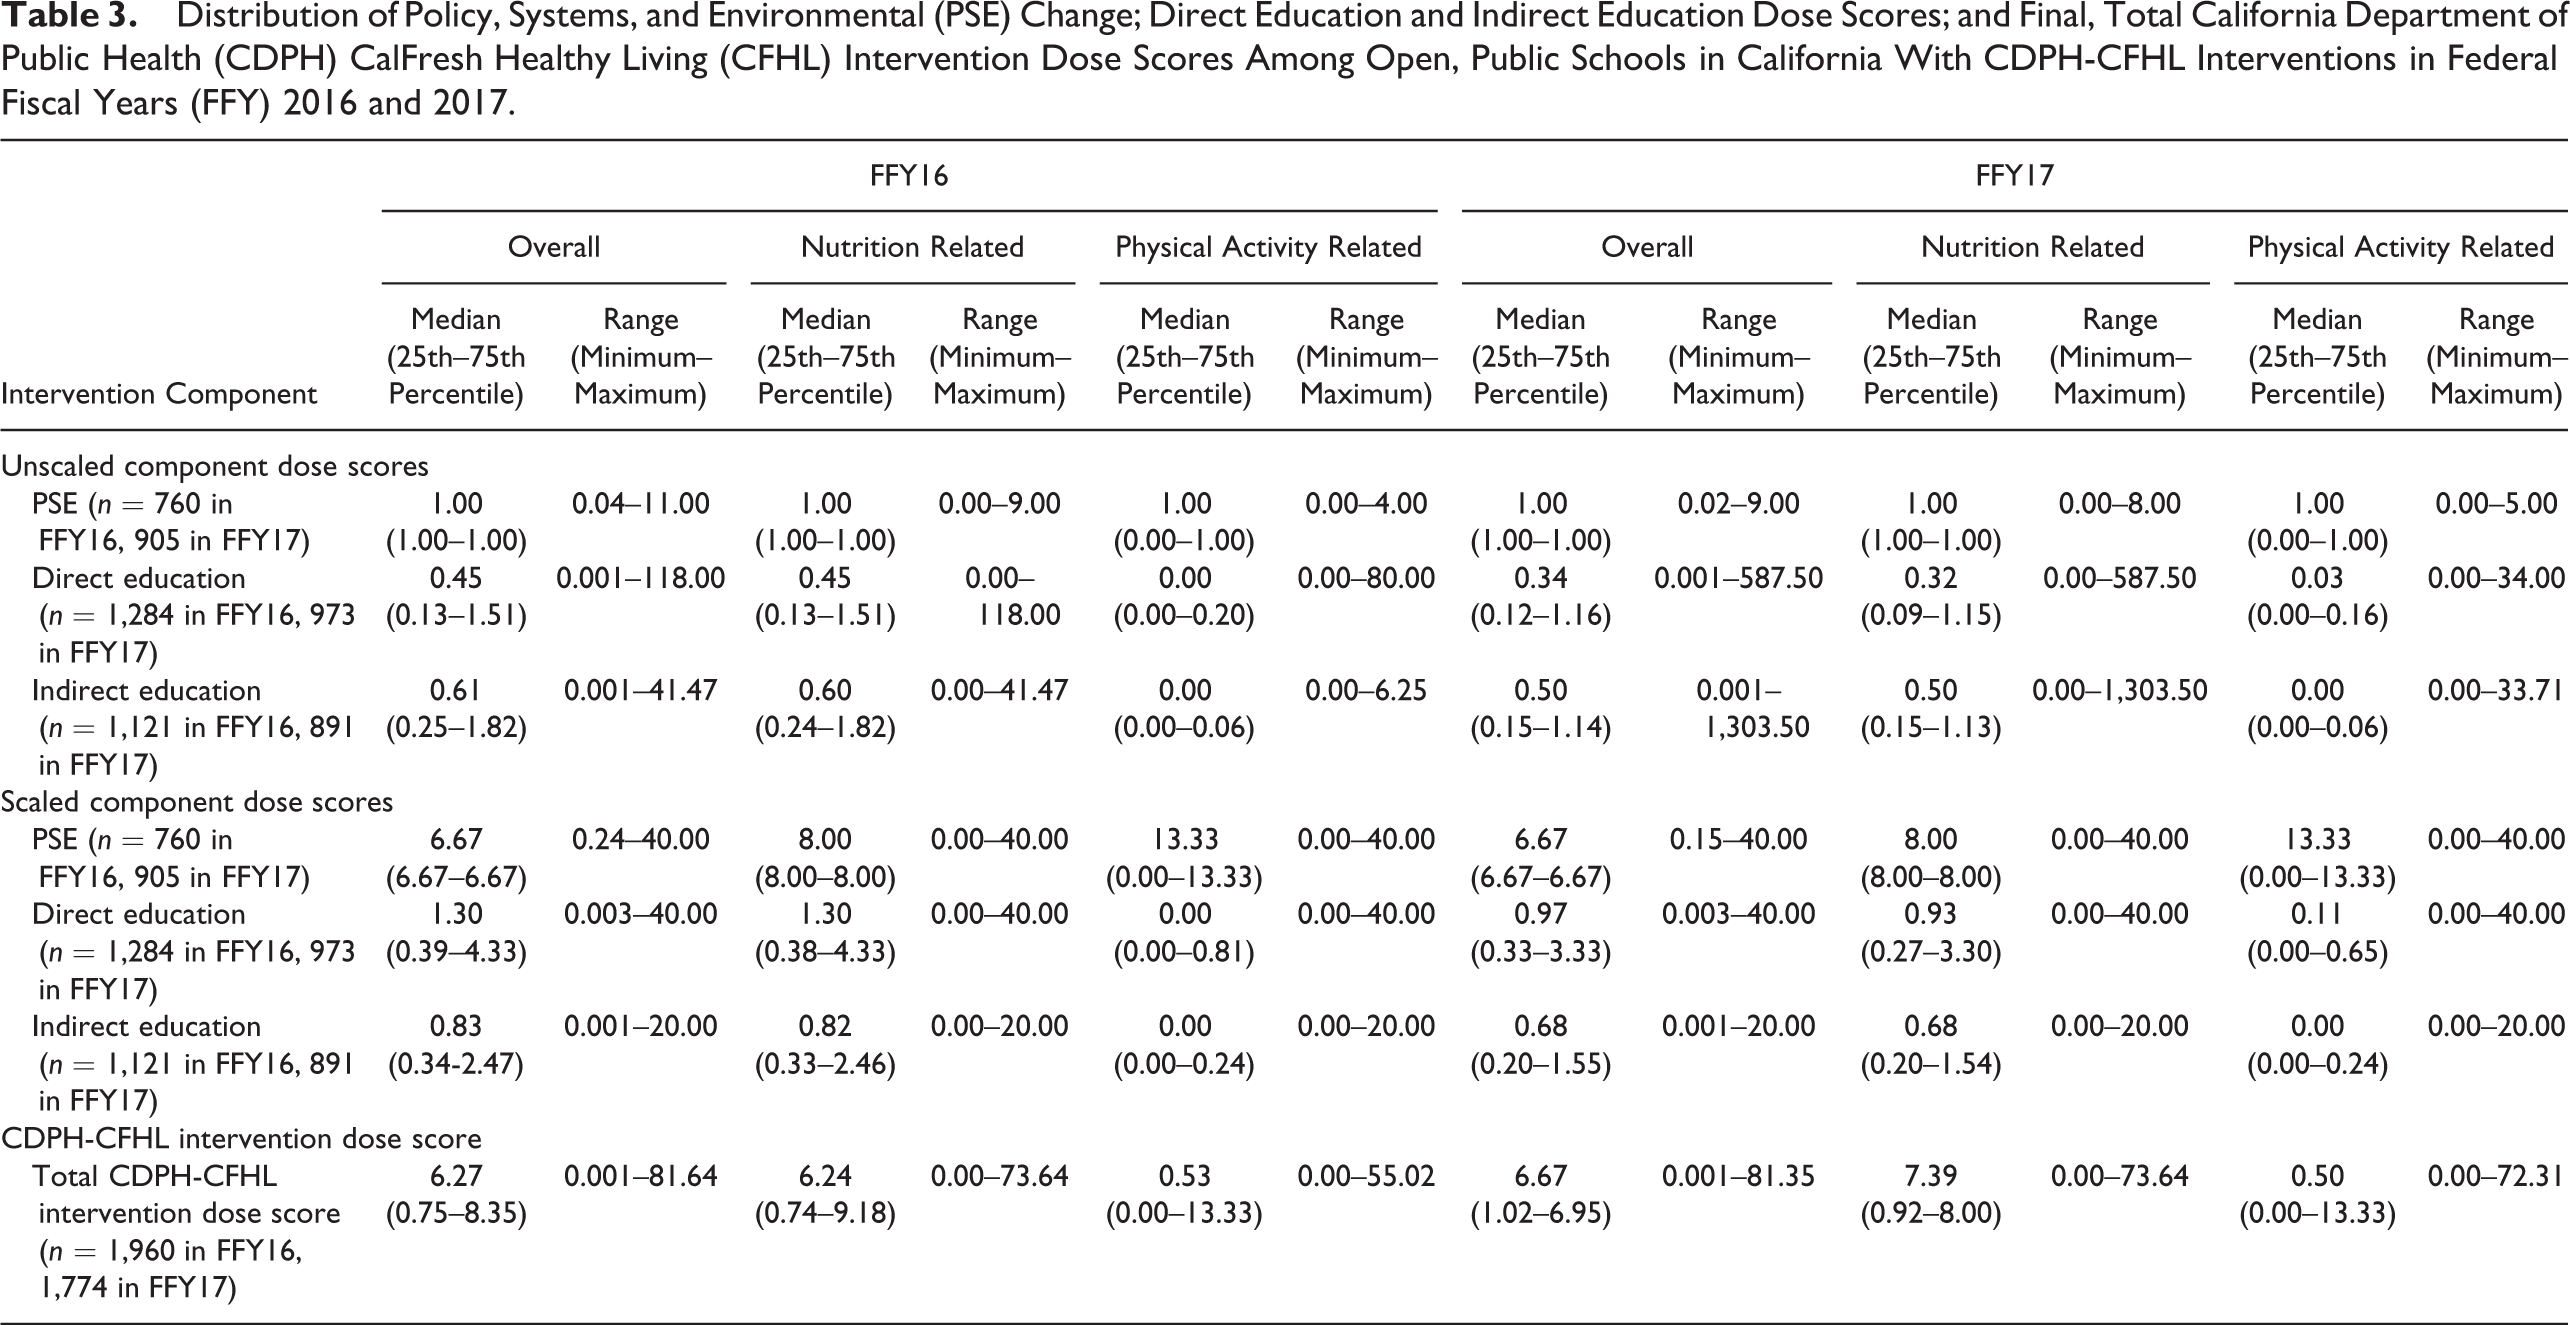
CDPH-CFHL intervention schools implementing direct education conducted a median of 4 (25th, 75th: 1, 9) and 3 (25th, 75th: 1, 9.25) direct education sessions in FFY16 and FFY17, respectively (data not shown). The median intensity (or number of hours) of each session was 0.75 (25th, 75th: 0.5, 1.0) in both FFY16 and FFY17, and each session had a median reach of 6% (25th, 75th: 3%, 19%) in FFY16 and 5% (25th, 75th: 3%, 12%) in FFY17. After combining the intensity and reach, but before scaling the score, the overall direct education scores at each school ranged from 0.001 to 118.00 with a median of 0.45 (25th, 75th: 0.13, 1.51; Table 3). The unscaled median direct education score roughly translates to a median of 0.45 hr of direct education per enrolled student. Scaling yielded direct education dose scores that ranged from 0.003 to 40 for each school in both FFY16 and FFY17. The median score decreased from 1.30 (25th, 75th: 0.39, 4.33) in FFY16 to 0.97 (25th, 75th: 0.33, 3.33) in FFY17.
CDPH-CFHL intervention schools conducting indirect education activities implemented a median of 2 (25th, 75th: 1, 4) indirect education classes (each with an assigned intensity of 1.0); 2 (25th, 75th: 1, 3) in-person events (each with an assigned intensity of 0.5); and 2 (25th, 75th: 1, 6) materials/media distributions (each with an assigned intensity of 0.5) in FFY16 (data not shown). In FFY17, CDPH-CFHL intervention schools conducting indirect education activities implemented a median of 2 (25th, 75th: 1, 4) indirect education classes; 1 (25th, 75th: 1, 4) in-person events; and 1 (25th, 75th: 1, 5) materials/media distributions. Indirect education classes had a median reach of 36% (25th, 75th: 9%, 81%) and 15% (25th, 75th: 6%, 56%), in-person events had a median reach of 23% (25th, 75th: 5%, 77%) and 45% (25th, 75th: 9%, 96%), and materials/media distributions had a median reach of 42% (25th, 75th: 8%,97%) and 13% (25th, 75th: 3%, 83%) in FFY16 and FFY17, respectively. After combining the intensity and reach, but before scaling the score, the overall indirect education scores at each school ranged from 0.001 to 41.47 with a median of 0.61 (25th, 75th: 0.25, 1.82; Table 3). The unscaled median indirect education score roughly translates to a median of 0.61 contacts with indirect education per enrolled student where exposure to one indirect education medium counts as 0.5 contacts and exposure to one indirect education class counts as one contact. Scaling produced indirect education dose scores ranging from 0.001 to 20.00 and with a median of 0.83 (25th, 75th: 0.34, 2.47) and 0.68 (25th, 75th: 0.20, 1.55) in FFY16 and FFY17, respectively.
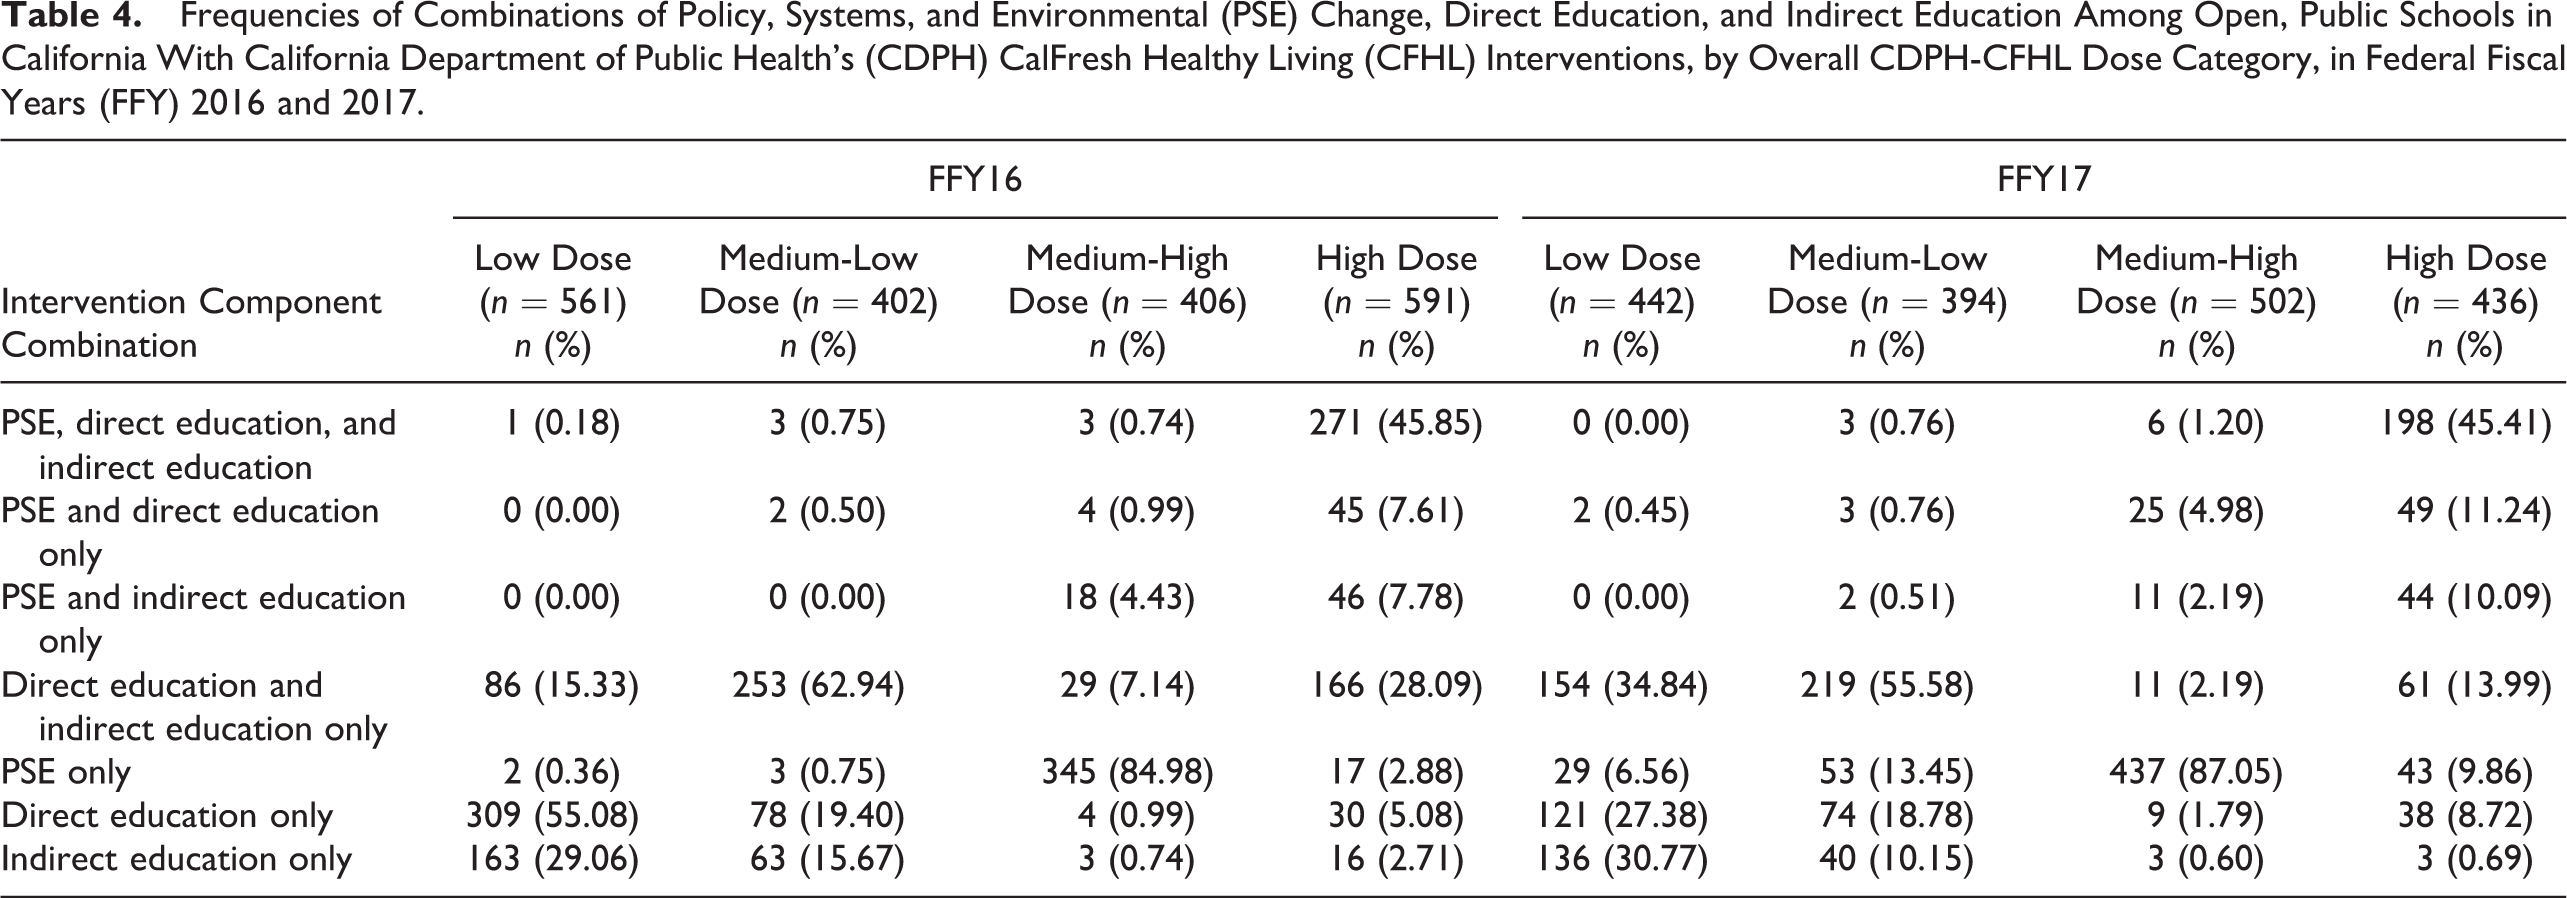
Among schools with CDPH-CFHL interventions, the total CDPH-CFHL intervention score, based on the sum of scaled scores for PSE, direct education, and indirect education, ranged from 0.001 to 81.645, with a median of 6.27 (25th, 75th: 0.75, 8.35), in FFY16, and ranged from 0.001 to 81.355, with a median of 6.67 (25th, 75th: 1.02, 6.95), in FFY17 (Table 3). Because we wanted to create a categorical variable constructed to ensure sufficient power to test the association of differing levels of CDPH-CFHL intervention with student-level outcomes, the distribution of overall, nutrition-related, and physical activity–related scores was, by design, fairly evenly split into the low, medium-low, medium-high, and high categories in both FFY16 and FFY17 (Table 4). In both FFY16 and FFY17, schools with low scores primarily provided only direct education or indirect education and those with medium low scores provided primarily a combination of direct and indirect education. Schools with medium-high intervention scores primarily provided only PSE interventions. Schools with high intervention scores mostly implemented combinations of PSE, direct education, and indirect education interventions.
Frequencies of Combinations of Policy, Systems, and Environmental (PSE) Change, Direct Education, and Indirect Education Among Open, Public Schools in California With California Department of Public Health’s (CDPH) CalFresh Healthy Living (CFHL) Interventions, by Overall CDPH-CFHL Dose Category, in Federal Fiscal Years (FFY) 2016 and 2017.
Discussion
The primary purpose of this article is to describe the development of a score that would enable us to quantify intervention dose for heterogeneous, multicomponent school-based chronic disease prevention interventions, thereby making it possible to statistically test the relationship between intervention dose and outcomes of interest. In the process of creating this score, we characterized CDPH-CFHL interventions over a 2-year period and observed some notable trends. While the number of schools implementing CDPH-CFHL interventions decreased between FFY16 and FFY17, the proportion of eligible schools implementing these interventions remained constant, at about 25%, in both years. In FFY17, there was a noticeable shift in CDPH-CFHL efforts in schools, with a substantial increase in the proportion of CDPH-CFHL intervention schools implementing PSE changes and decrease in the proportions of these schools implementing direct or indirect education. This shift was consistent with guidelines from authoritative bodies, recommending an increased focus on PSE efforts (Kumanyika et al., 2008; Lyn et al., 2013; NAM, 2012), as well as the FFY17-19 CFHL 3-year plan guidance that also put more emphasis on PSE and more comprehensive programming (California Department of Social Services et al., 2016).
We focused on deriving intervention dose scores that could answer the question of how the amount, comprehensiveness, and reach of multiple interventions occurring at the same site are associated with outcomes of individuals at that site as opposed to prior studies that developed scores useful for intervention planning purposes and interpreting results of outcome analyses (Cheadle, Rauzon, et al., 2012; Cheadle, Schwartz, et al., 2012; Kuo et al., 2018) or for examining the association of other intervention characteristics with intervention outcomes (Fawcett et al., 2015; Molitor et al., 2015). We therefore characterized intervention intensity as the quantitative amount and comprehensiveness of intervention provided thereby making it possible to assess the magnitude of the association between intervention dose and outcomes of interest. Specifically, this quantitative scoring methodology makes it possible to statistically test (via multivariate regression) the association between the amount of the intervention (in this case CDPH-CFHL) as delivered and student-level outcomes such as BMI z-scores, fitness measures, or dietary intakes. Once the dose–response relationship, if any, is characterized, additional analyses using the PSE, direct education, and indirect education component scores could be conducted to determine the relative contribution of specific strategies to the overall effect.
By utilizing both intensity and reach data of various interventions, we were able to construct a measure of the expected population-level dose that will allow for more sensitive and nuanced evaluation than using only the presence or absence of interventions or combinations of interventions. For example, our scoring protocol would differentiate between a school that only offered a 1-hr nutrition education class to 1% of enrolled students and a school that offered a 20-hr nutrition education class series to 100% of enrolled students, whereas a more traditional approach of categorizing schools as intervention or no intervention would treat both schools as being equivalent intervention schools.
The ability to make this type of distinction is especially important with regard to evaluating CFHL interventions. Traditionally, evaluations of public health interventions occur in circumstances where analysis of groups according to the presence or absence of interventions is informative, such as those where interventions are standardized and well-defined across all sites. However, CFHL is based on an intervention model that allows for considerable state and/or local input and flexibility regarding intervention selection and design, and the model strongly encourages the use of multicomponent interventions. While the local flexibility is critical for suitability to local conditions and can increase local buy-in, it also contributes to considerable variation in the interventions implemented across sites. Thus, it is crucial that the metric used in evaluating the impact of these efforts accounts for the variation in intervention type, intensity, and reach.
Another strength of our dose scores is that they were created utilizing routinely collected data from two intervention tracking databases, PEARS and the ATF, which undergo thorough data quality assurance and control procedures. This allows for the standardized, systematic, and consistent scoring of interventions across counties and school sites over multiple years.
There were a few limitations when creating dose scores from this secondary data. First, information about the interventions implemented was self-reported by LHDs. However, the very specific reporting requirements of the ATF and PEARS made overreporting of local efforts, and thus overestimation of potential impacts, highly unlikely. We also acknowledge that the number of PSE categories we used to characterize PSE intensity is more a measure of variety or comprehensiveness of intervention but is the best proxy measure of PSE intensity available from the large-scale systematic reporting system and is consistent with the hypothesis that greater saturation of the environment will lead to great effect. Finally, in our overall dose score, the reach of PSE interventions was not specific to each individual PSE intervention but was the maximum reach of all PSE interventions occurring at a school. While this might be expected to diminish sensitivity to detect differences in PSE reach and dose, we did observe a range of estimated reach that showed some differences in reach among schools.
The CDPH-CFHL intervention school dose scores created using the protocol described in this article can be linked with student outcome data sets and used as an independent variable in multilevel, multivariate regressions to assess the association between CDPH-CFHL intervention dose and student health outcomes. Using the protocol described in this article, scores can also be generated for different categories of CDPH-CFHL intervention (e.g., direct education, PSE, gardens, physical education) to examine the relationship between the different intervention strategies and outcomes of interest. The results of future evaluations using these scores can be used to inform practitioners and decision makers of the effect CDPH-CFHL interventions are having on children’s health and to help identify the most promising strategies.
Conclusion
The scoring protocol described in this article provides a basis for the analysis of the relationship between multicomponent CDPH-CFHL interventions and schoolchildren’s behavioral and health outcomes. This is of paramount importance in the evaluation of this USDA-funded program that is large in scope and as varied as there are participating communities and settings. Rational planning and improvements to the program depend on accurate, sensitive evaluation to inform policy makers and practitioners about whether interventions are effective and the dose needed to yield population health benefits.
Footnotes
Authors’ Note
This report was conducted through the California Department of Public Health and funded by USDA SNAP-Ed. These institutions are equal opportunity providers and employers.
Declaration of Conflicting Interests
The author(s) declared no potential conflicts of interest with respect to the research, authorship, and/or publication of this article.
Funding
The author(s) disclosed receipt of the following financial support for the research and/or authorship of this article: This study received funding from California Department of Public Health (Grant ID UCANR 17-10217).