
Abstract
Taking advantage of the merits of both the bootstrap-aggregating method and the Bayesian forecasting approach, this study introduces their combination—the BayesBag method—to the tourism forecasting literature for the first time. In this study, we examine whether the novel BayesBag method can improve the forecasting performance of the traditional Autoregressive-Distributed-Lag (ADL) model in both normal (i.e., pre-COVID-19) and crisis (i.e., during the pandemic) times. This is also the first study to incorporate the global travel sentiment index as a measure of visitors’ behavioral intentions for forecasting tourism demand in a crisis situation. We conduct both ex-post and ex-ante forecasting of European monthly tourism demand, and our empirical results show that the newly proposed BayesBag method outperforms other methods in both periods.
Highlights
BayesBag combines the bootstrap-aggregating method and Bayesian forecasting.
BayesBag improves tourism forecasting accuracy in both normal and crisis periods.
Global travel sentiment index enhances COVID-19 tourism demand forecasts.
The proposed method enhances the robustness of forecasting in volatile scenarios.
Introduction
Although the global tourism market has been on a fast-recovering path from the COVID-19 pandemic, the market continues to face various uncertainties in the post-pandemic period, including changing travel behaviors, shifting government policies, and the potential of future outbreaks. As a result, accurate demand forecasting in tourism management is more important than ever. These challenges have led to significant structural changes since 2020, characterized by not only one-off drops but also more sustained level shifts, making demand patterns increasingly unpredictable in the current tourism landscape. Consequently, forecasting now faces major challenges. While most current forecasting models performed well for pre-COVID-19 periods, they may be prone to overfitting when applied to data with dramatic fluctuations. Therefore, the risk of inaccurate forecasting of tourism demand recovery in the post-COVID-19 period is substantial. Given the increasingly frequent switches between normal and crisis periods, an effective tourism forecasting method should remain robust in both normal and crisis times. However, little research has focused on developing such forecasting models.
The fluctuations in demand data caused by these uncertainties lead to unstable modeling and overfitting, each of which can significantly impact the accuracy of tourism forecasting. Existing models, such as traditional econometric models, often struggle with these challenges. They tend to rely heavily on historical data, making them susceptible to inaccuracies when faced with sudden structural changes like those induced by the pandemic. Additionally, machine learning models, while powerful, often require large amounts of stable data and can overfit when applied to highly volatile environments. The bootstrap-aggregating (Bagging) method is often regarded as an effective technique for improving the performance of forecasting models that suffer from an unstable modeling process (Athanasopoulos et al., 2018; Song et al., 2021). Wong et al. (2006) introduced the Bayesian approach to tourism demand forecasting, which has the unique advantage of overcoming the overfitting estimation issue. This approach has been applied in many tourism forecasting studies (e.g. Assaf, Li, et al., 2019). However, the ability of both approaches to generate reliable predictions, especially when dealing with highly volatile data, remains questionable. Meanwhile, combining the bootstrap-aggregating and Bayesian methods holds the potential for addressing these issues, but it has not yet been developed in either tourism studies or the broader forecasting literature.
The primary aim of this study is to develop a novel BayesBag method, which combines the Bayesian econometric model and the Bagging method to improve traditional forecasting models in both normal and crisis periods. Additionally, this study will introduce the travel sentiment index into tourism demand forecasting. Using COVID-19 as an example of a crisis situation, the research designs both ex-post and ex-ante forecasting scenarios to examine model performance. We select the ADL model as the base for comparing forecasting performance across a pure econometric model, an econometric model with Bagging, a Bayesian econometric model, and a novel combined the BayesBag econometric model and other widely used time series benchmark models.
Our study makes three main contributions to the literature. First, the development of a BayesBag ADL model represents a novel methodological contribution to both mainstream forecasting literature and tourism forecasting literature. Second, the research design of this study considers both normal and crisis situations in forecasting model selection. Our comparison of various models and estimation methods provides further insights into their performance in different forecasting scenarios and offers new perspectives for future model selection. Finally, our innovation involves an initial attempt to apply the global travel sentiment index to track the recovery of the tourism market, demonstrating that this purely statistical method is effective in improving forecasting performance in crisis situations.
The remainder of the paper is organized as follows. In Section 2, we review the relevant literature. Section 3 introduces the methodology and data used in the empirical study. Section 4 presents the main findings of the study, and Section 5 concludes the study.
Literature Review
Forecasting Tourism Demand Using the ADL Model
Chosen as the base model for the different advanced forecasting methods in this study, the ADL model was proposed by Hendry (1995) as a general-to-specific approach and has since become the most widely used among such models (Liu et al., 2022). By incorporating the current values of the independent variables, as well as the lagged terms of both the dependent and independent variables, the equation used to estimate the relationship between the tourism demand variable and explanatory variables can be applied for dynamic modeling and forecasting. Many researchers have utilized the ADL model in tourism contexts, such as Song and Witt (2003) and Jiao et al. (2020). The model has been further enhanced by the incorporation of other advanced techniques. For example, Song and Lin (2010) adapted the ADL model for error correction to identify long-term relationships between economic variables and the short-term error correction mechanism after determining the cointegration relationships of the variables. Similarly, Li et al. (2006) found that the time-varying parameter estimation method could improve the forecasting performance of the ADL model by accounting for gradual structural changes.
Although the ADL model has a solid econometric foundation and offers flexibility in terms of modeling context, its model specification process—that is, the general-to-specific approach—has limitations. The process begins with the most general model that includes all potential variables and their lag terms, and then progressively eliminates unnecessary variables in each estimation step (Song & Witt, 2003). The optimal model specification is selected using various criteria, such as Akaike or Bayesian information criteria. While this approach aims to avoid spurious regression, and reduce model complexity, the selection process may be sensitive to even small changes in the training data. As a result, the estimated model is less robust, which undermines its forecasting power (Athanasopoulos et al., 2018).
The ADL model also faces overfitting issues. When modeling a series with a large variance, the estimated model tends to retain a significant number of variables to offset estimation errors, making it less generalized during the forecasting period (Bušs, 2009). The trade-off between bias and variance suggests that any increase in model fit could potentially lead to increased forecasting variance based on future observations (Clyde & Lee, 2001). Furthermore, using a more complex model by introducing additional lag terms and dummy variables to fit the data as patterns change during crisis periods can heighten the risk of overfitting, and is more likely to result in poor forecasts.
Bagging Forecasting
The Bagging method, developed by Breiman (1996), is commonly used to address uncertainty arising from perturbations in data. This method produces forecasts by aggregating various forecast sets generated from the same predictor via bootstrapping. Instead of relying on a single prediction, Bagging forecasting approximates the original distribution of all predictors, thereby enhancing the robustness and forecasting performance of the model. Inoue and Kilian (2004) introduced the Bagging method into time series forecasting and demonstrated its effectiveness. Since then, Bagging techniques have been developed to counter serial dependence and non-stationary issues. For instance, Cordeiro and Neves (2009) proposed the sieve bootstrap, which simulates the residual of the exponential smoothing decomposition through an autoregressive process, demonstrating that this technique can improve quarterly and monthly data forecasting. Hassani et al. (2009) suggested sampling the noise term from the singular spectrum analysis method and adding it back to the signal to construct the bootstrapping series. Bergmeir et al. (2016) further developed the bagging method for time series data, utilizing the Box-Cox transformation, Seasonal and Trend decomposition using Loess, and moving block bootstrap methods. This has since become the most popular Bootstrap-aggregating method in time series forecasting.
Despite the advantages and the well-established practical foundation of the Bootstrap-aggregating method, this forecasting approach has rarely been applied in tourism research. Song et al. (2017) and Athanasopoulos et al. (2018) made initial attempts to integrate the Bootstrap-aggregating and ADL models, using Hong Kong and Australia as examples, respectively. Song et al. (2021) refined the Bagging technique within the tourism context and compared the predictors generated from ordinary and Bayesian version bootstrapping methods. They demonstrated that both bootstrapping methods can enhance the forecasting performance of the ADL model, although the prediction variance of the latter was lower. Despite these advancements, Bagging forecasting remains an under-researched area in tourism studies.
The Bayesian Approach in Tourism Forecasting
The Bayesian approach is often regarded as a solution to the overfitting problem (Litterman, 1986; Wong et al., 2006). Unlike the frequency probability provided through frequentist inference, Bayesian estimation derives the posterior probability of the parameters from two antecedents: background information and a set of observational data, which represent the prior distribution and the likelihood, respectively. To reduce the risk of overfitting, restrictions can be imposed via prior distribution functions to control the tightness of the coefficients without reducing their number (Wong et al., 2006). Litterman (1986) successfully imposed a prior restriction that treats variables in the Bayesian vector autoregressive model as nearly independent random walks. This commonly used prior specification is known as the Litterman and Minnesota prior (Doan et al., 1984).
The Bayesian approach has been applied in tourism research since the work of Wong et al. (2006) and Gunter and Önder (2015). Empirical evidence in tourism demand forecasting suggests that the Bayesian approach can effectively reduce the over-parameterization risk in different variants of Vector Autoregression models, such as the classical Vector Autoregression model (Gunter & Önder, 2016; Wong et al., 2006). Assaf, Tsionas et al. (2019) suggested that the Bayesian framework offers particular advantages in dynamic panel data forecasting, as the lag term can be effectively regulated through Bayesian estimation. Although the Bayesian approach has been applied to tourism forecasting, the focus has primarily been on vector autoregression models. To date, no study has explored how the widely used ADL model performs within the Bayesian framework.
BayesBag Method
Although the Bayesian approach can be a good solution to model overfitting, its estimation is sensitive to model misspecification, which can lead to biased posterior distributions of the parameters and weak forecasting performance (Huggins & Miller, 2019). Therefore, using only the Bayesian approach can be undesirable. The modeling uncertainty of Bayesian inference under misspecification has been widely discussed in the literature.
The BayesBag method, first proposed by Bühlmann (2014), involves applying the notion of Bagging to stabilize the posterior distribution (Breiman, 1996). This method reduces sensitivity to perturbation and serves as a widely applicable and simple-to-use solution when misspecification occurs (Huggins & Miller, 2019, 2022). As a novel optimization method, the BayesBag method has demonstrated excellent performance, although it has received limited research attention. Through an empirical application, Huggins and Miller (2019) provided theoretical proof of the superiority of the BayesBag method in handling model misspecification. In their simulation study, they found that various bootstrapped point estimation methods performed significantly worse than the BayesBag method in terms of forecasting accuracy. Later, Huggins and Miller (2022) evaluated additional simulations and applications, finding that the Bagging posteriors computed from the BayesBag were more conservative than single Bayesian posteriors, thereby helping to make Bayesian model selection more stable and reproducible.
By combining the strengths of Bayesian inference and Bagging, the BayesBag method, addresses the limitations of each approach individually. It stabilizes the posterior distribution, mitigating the sensitivity to model misspecification inherent in the Bayesian approach, while also reducing the risk of overfitting more effectively than Bagging alone. This integration makes the BayesBag method particularly well-suited for forecasting in contexts characterized by high volatility and structural breaks, such as tourism demand during crisis periods (Song et al., 2017). Therefore, when considering the risk of model uncertainty and the overfitting issues in the ADL model, incorporating the BayesBag method into ADL modeling is likely to outperform both the Bagging and Bayesian approaches when used alone.
In addition, a forecasting method should maintain its accuracy and stability over time—regardless of whether it is used in normal or crisis situations—to serve as a reliable tool for tourism management. In attempts to predict the tourism recovery rate amid the recovery from the COVID-19 pandemic, some studies have applied various artificial intelligence models, hybrid models, or combination forecasting approaches (Liu et al., 2021; Qiu, Wu et al., 2021).To mitigate the sudden drops and the severe structural break resulting from the pandemic and the corresponding travel restrictions, these studies have applied judgmental adjustment strategies that consider the infection rate, expert surveys, or government restriction policies due to the often poor forecasting performance of current statistical methods. However, these adjustment factors are either laborious and time-consuming in terms of data collection, or contain major biases that make it difficult to capture the actual travel patterns during the pandemic.
Alternatively, adding additional explanatory variables to account for the external impact is a common practice in demand forecasting. For example, Qiu, Liu et al. (2021) enhanced the forecasting performance of traditional time series models such as SARIMA, ETS, and STL models by incorporating social media data as the explanatory variable to capture the crisis severity. Artificial intelligence and machine learning models are also highly adaptable to informational variables like search indexes and online reviews (Li et al., 2017; Li et al., 2020).
In demand modeling and forecasting research, sentiment indices are widely used to quantify public sentiment or perceptions, often gathered from news articles, social media, or surveys, in order to improve predictions on consumer behavior and market trends. By incorporating sentiment data into models, researchers can capture non-economic factors that drive demand, such as optimism, fear, or uncertainty (Bram & Ludvigson, 1998; Jiang et al., 2019). Tourists often share their thoughts and preferences about specific destinations, goods, and services related to their journey on social media (Song et al., 2019). The overall sentiment indicated by global social media can more sensitively and accurately reflect tourists’ travel intentions. Sentiment indices have been introduced to tourism forecasting and have shown positive evidence for improving forecasting performance (e.g., Wu et al., 2022). The effectiveness of these sentiment indices, constructed from different granular levels, has been evaluated by a large number of methods in tourism and hospitality demand forecasting (e.g., Li et al., 2023; Wu et al., 2022). However, in the COVID-19 context, no studies have examined their effects during a crisis, or applied the global travel sentiment index in tourism forecasting during the COVID-19 recovery period.
Our literature review reveals various important research gaps. First, although the Bagging technique and the Bayesian approach have been applied to tourism forecasting in several studies, the forecasting performance remains inconsistent due to model selection uncertainty and overfitting issues, particularly in the turbulent recovery period following the COVID-19 pandemic. We aim to provide new guidelines for model specification and estimation by comparing the forecasting performance of the ADL model, combined with the Bagging, Bayesian, and BayesBag methods, across multiple forecasting scenarios. Second, the novel BayesBag method has so far only been applied to cross-sectional data; its effectiveness in more complex tasks, such as time series data, has not been explored. By refining the original BayesBag algorithm and applying it to time series forecasting, we extend the application of this method. Our study therefore contributes not only to the tourism forecasting literature, but also to the broader forecasting field. Third, in terms of tourism forecasting methodology, our study is the first to implement the Bayesian approach when placing the frequentist estimation for the ADL model. Examining whether imposing certain prior restrictions can consistently improve accuracy offers valuable guidance, and highlights the Bayesian approach as a potential solution to the current challenges in tourism demand forecasting. This research also makes a significant contribution to crisis management, as model performance is measured in both normal and crisis times with ex-post and ex-ante forecasting during COVID-19. Our study represents the first attempt to apply a purely statistical method to improve COVID-19 crisis forecasting accuracy by incorporating information from the global travel sentiment index, as indicated by the UNWTO Tourism Recovery Tracker (UNWTO, 2022).
Methodology and Data
The ADL Model
This study considers an ADL model with differenced variables for normal-period forecasting and pure-level variables for crisis forecasting. The literature has found that the ADL model with differences outperforms its pure-level counterpart when dealing with a series that presents a clear unit root (Brännäs et al., 2002). This is particularly pronounced in seasonal time series forecasting, as differencing can eliminate or reduce the trend and seasonal patterns of the variables. An ADL model of order (P, Q, L) with differenced variables for pre-COVID-19 forecasting can be written as
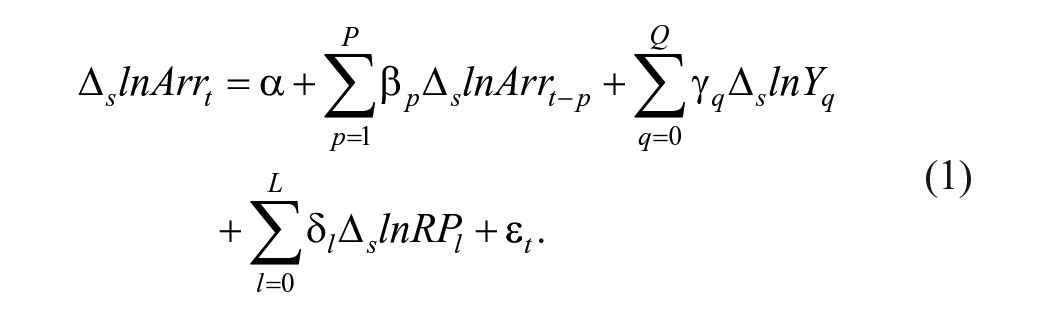
where
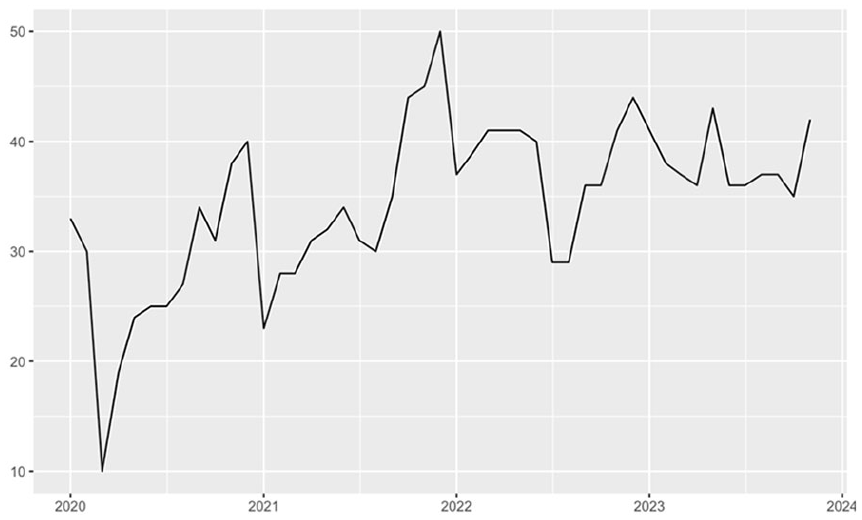
Differencing is not beneficial during the COVID-19 period, as it can lead to more volatility (see Figure 1) due to the severe disruption to the trend and seasonality of tourism demand, making predictions more challenging. Thus, differencing is not appropriate. An ADL model of order (P, Q, L, K) with pure-level variables for crisis forecasting during the recovery phase from the pandemic can be specified as follows:
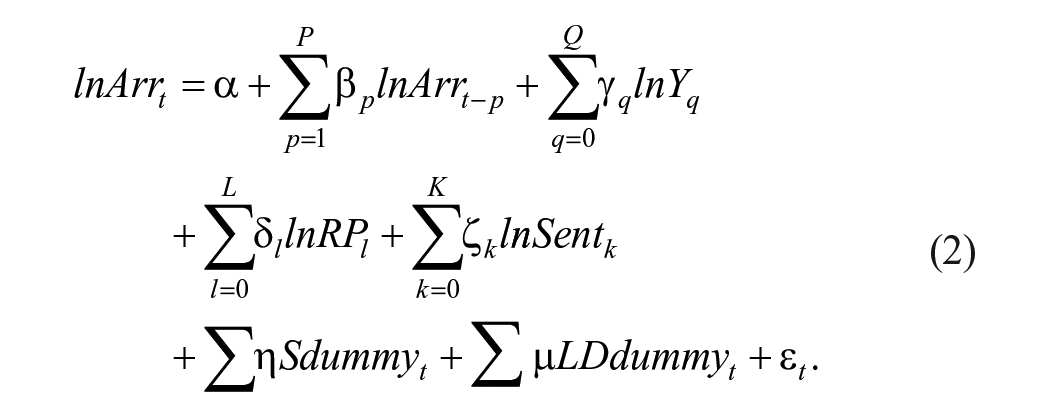
where
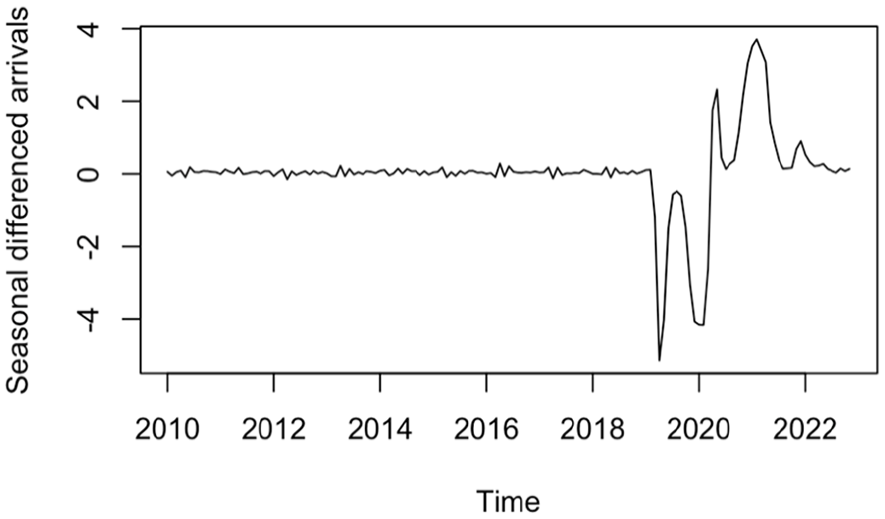
Seasonal Differenced Tourist Arrivals in Austria From 2011M1 to 2022M3 (Logarithmic Scale).
We set the maximum lag of arrivals, income, and relative prices as 12 and the travel sentiment at four, due to the monthly data frequency and the limited data length of the travel sentiment index used. The general-to-specific model selection approach begins with a model that includes all variables and their lag terms, estimated using the ordinary least squares method. Through an iterative process, some predictors are eliminated to minimize the Akaike information criterion.
The Bayesian ADL Model
In Bayesian estimation, the posterior distribution of parameters is derived by updating the data via a likelihood function for the prior beliefs
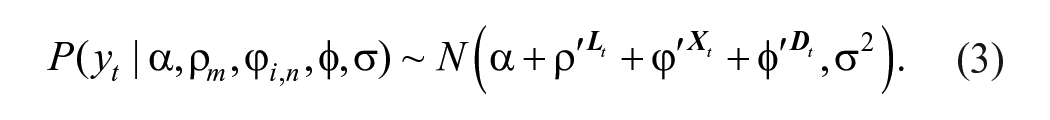
where
By assuming that all parameters follow a Gaussian distribution (a half-Gaussian distribution for

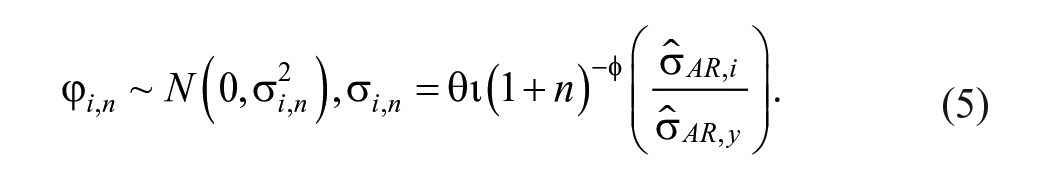
where
Following these specifications, the hyperparameters of the prior are set for Bayesian forecasting in different scenarios. The two relative tightness parameters, k and l, are kept the same across all the models for consistency. To compare the forecasting performance of the Bayesian ADL model in a normal period, the priors associated with each destination’s pre-COVID-19 forecasting are the same. The overall tightness
When making predictions during the COVID-19 pandemic, given the heightened uncertainty and volatility in the data, a more flexible approach is applied for hyperparameter selection. The optimal combination of
Time Series BayesBag Forecasting Procedure
As shown in Figure 2, the proposed BayesBag time series approach adapts the bootstrapping for stationary and seasonal non-stationary data, which improves upon Huggins and Miller’s (2019) original BayesBag sampler algorithm (Bergmeir et al., 2016). We set the Bagging sizes to 100 for forecasting in both normal and crisis times. To accelerate the convergence, each No-U-Turn sampler Markov Chain Monte Carlo function is initialized around the Bayesian ADL model parameter in each estimation.
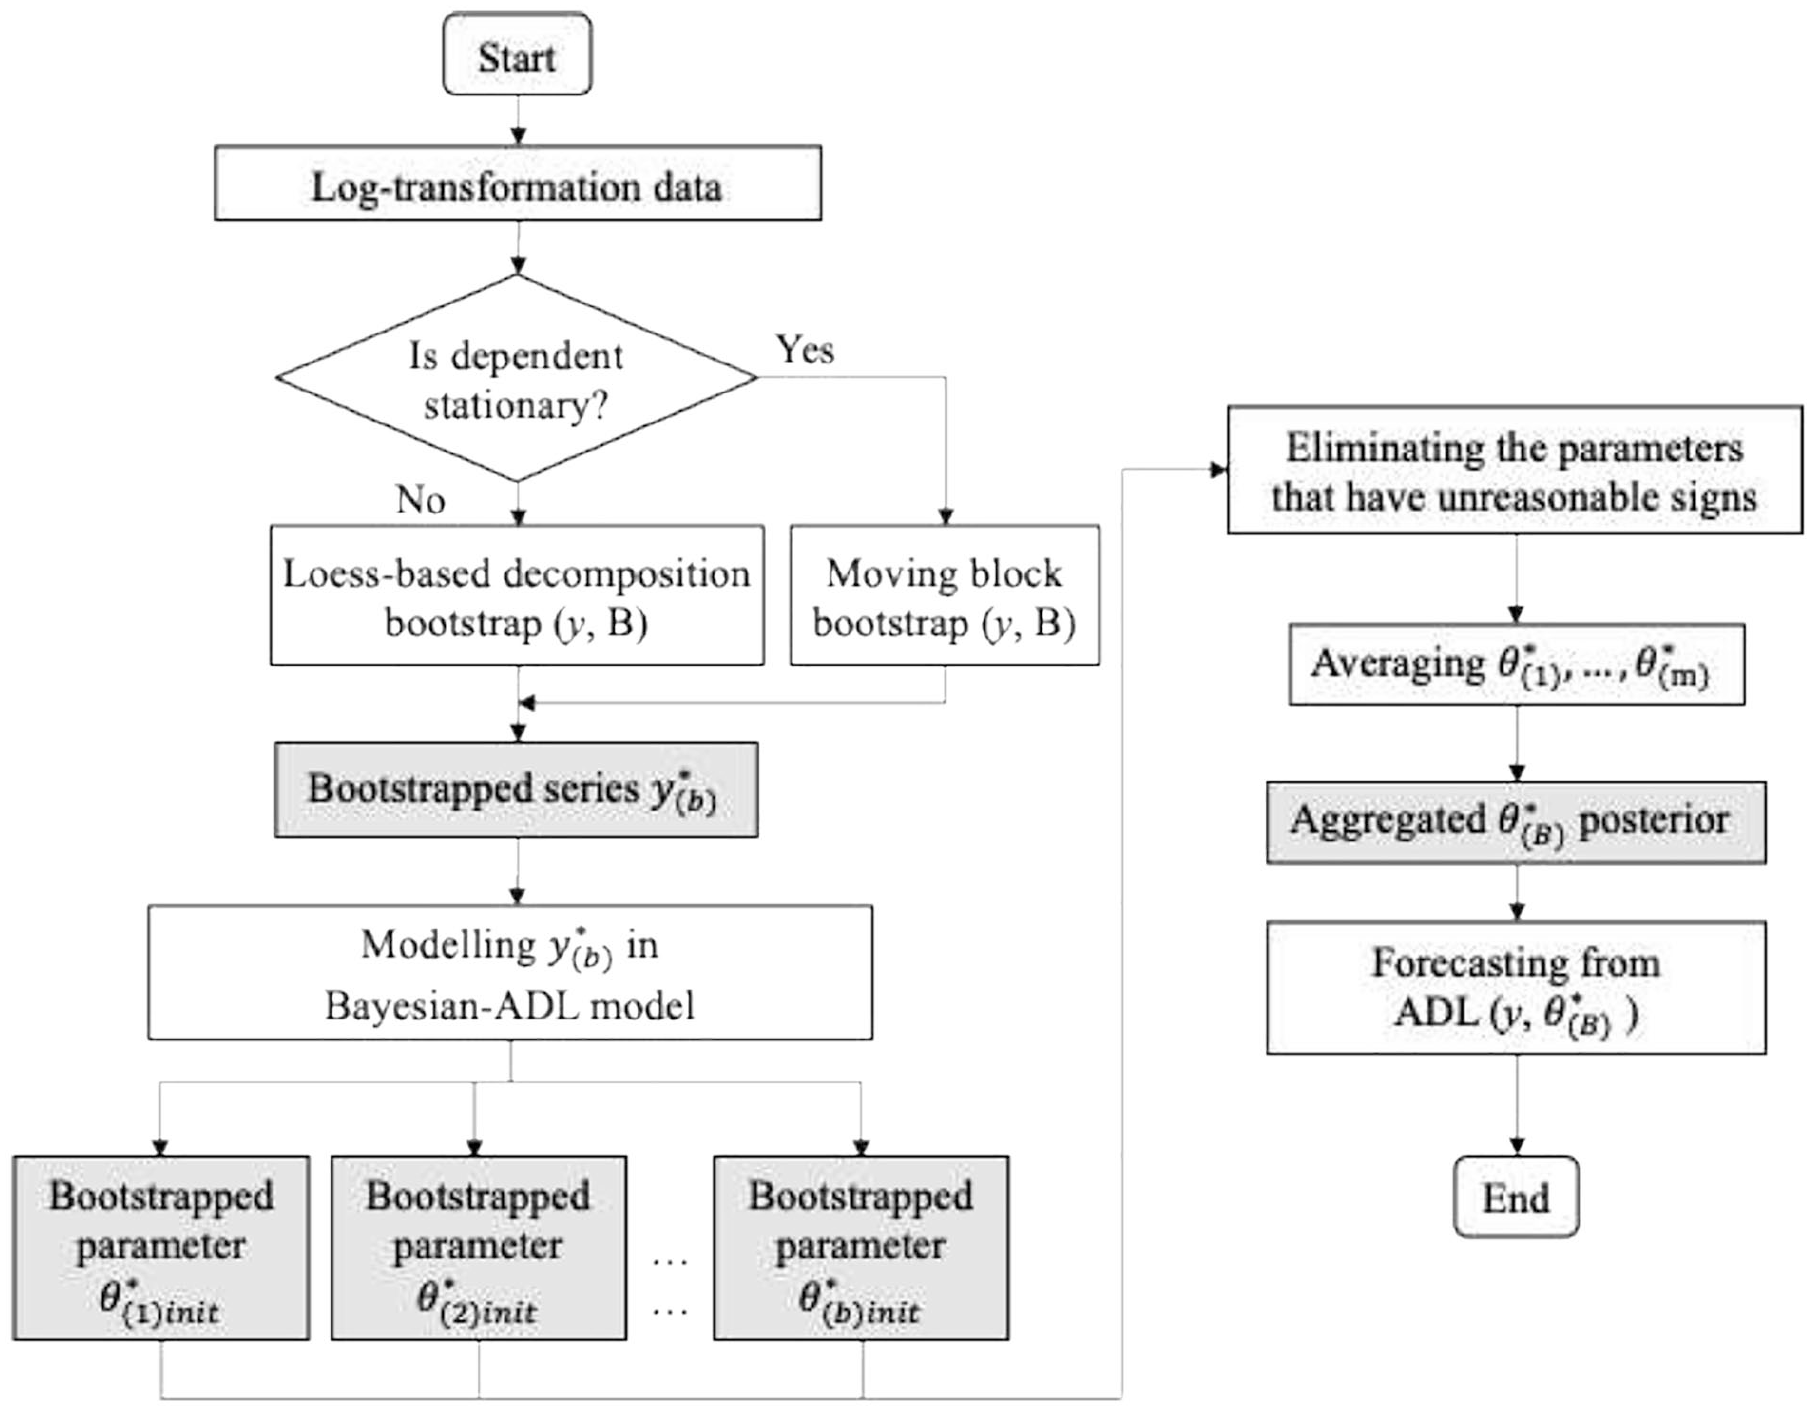
Flow Chart of the BayesBag Method.
Benchmark Models
We select the widely used (Seasonal) Naïve, (Seasonal) Autoregressive-Integrated-Moving-Average (SARIMA/ARIMA), and Exponential Smoothing (ETS) univariate forecasting methods as benchmark models to evaluate the forecasting performance of our proposed model. The SARIMA model includes autoregressive
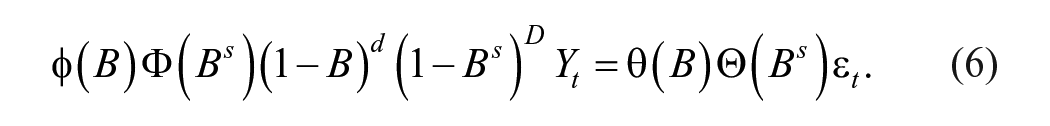
where
The ETS model consists of three terms: error, seasonality, and trend. The trend term can be specified as damped (d) if it exists, while the seasonal and error terms can be additive (A) or multiplicative (M). Therefore, a simple exponential smoothing with additive errors model can be abbreviated as ETS (A, N, N). The ETS and SARIMA model specifications are determined by minimizing the Akaike information criterion in our forecasting practice.
Data Description
Europe is one of the fastest recovery regions in terms of tourist arrivals in the world. This study aims to forecast the monthly inbound tourist arrivals of the top 10 European countries of 2019 where data are available: Austria, Croatia, Czechia, France, Germany, Greece, Italy, the Netherlands, Portugal, and Spain. Figure 3 presents the time series of tourist arrivals in these destinations using a sample covering the period from January 2010 to November 2023.
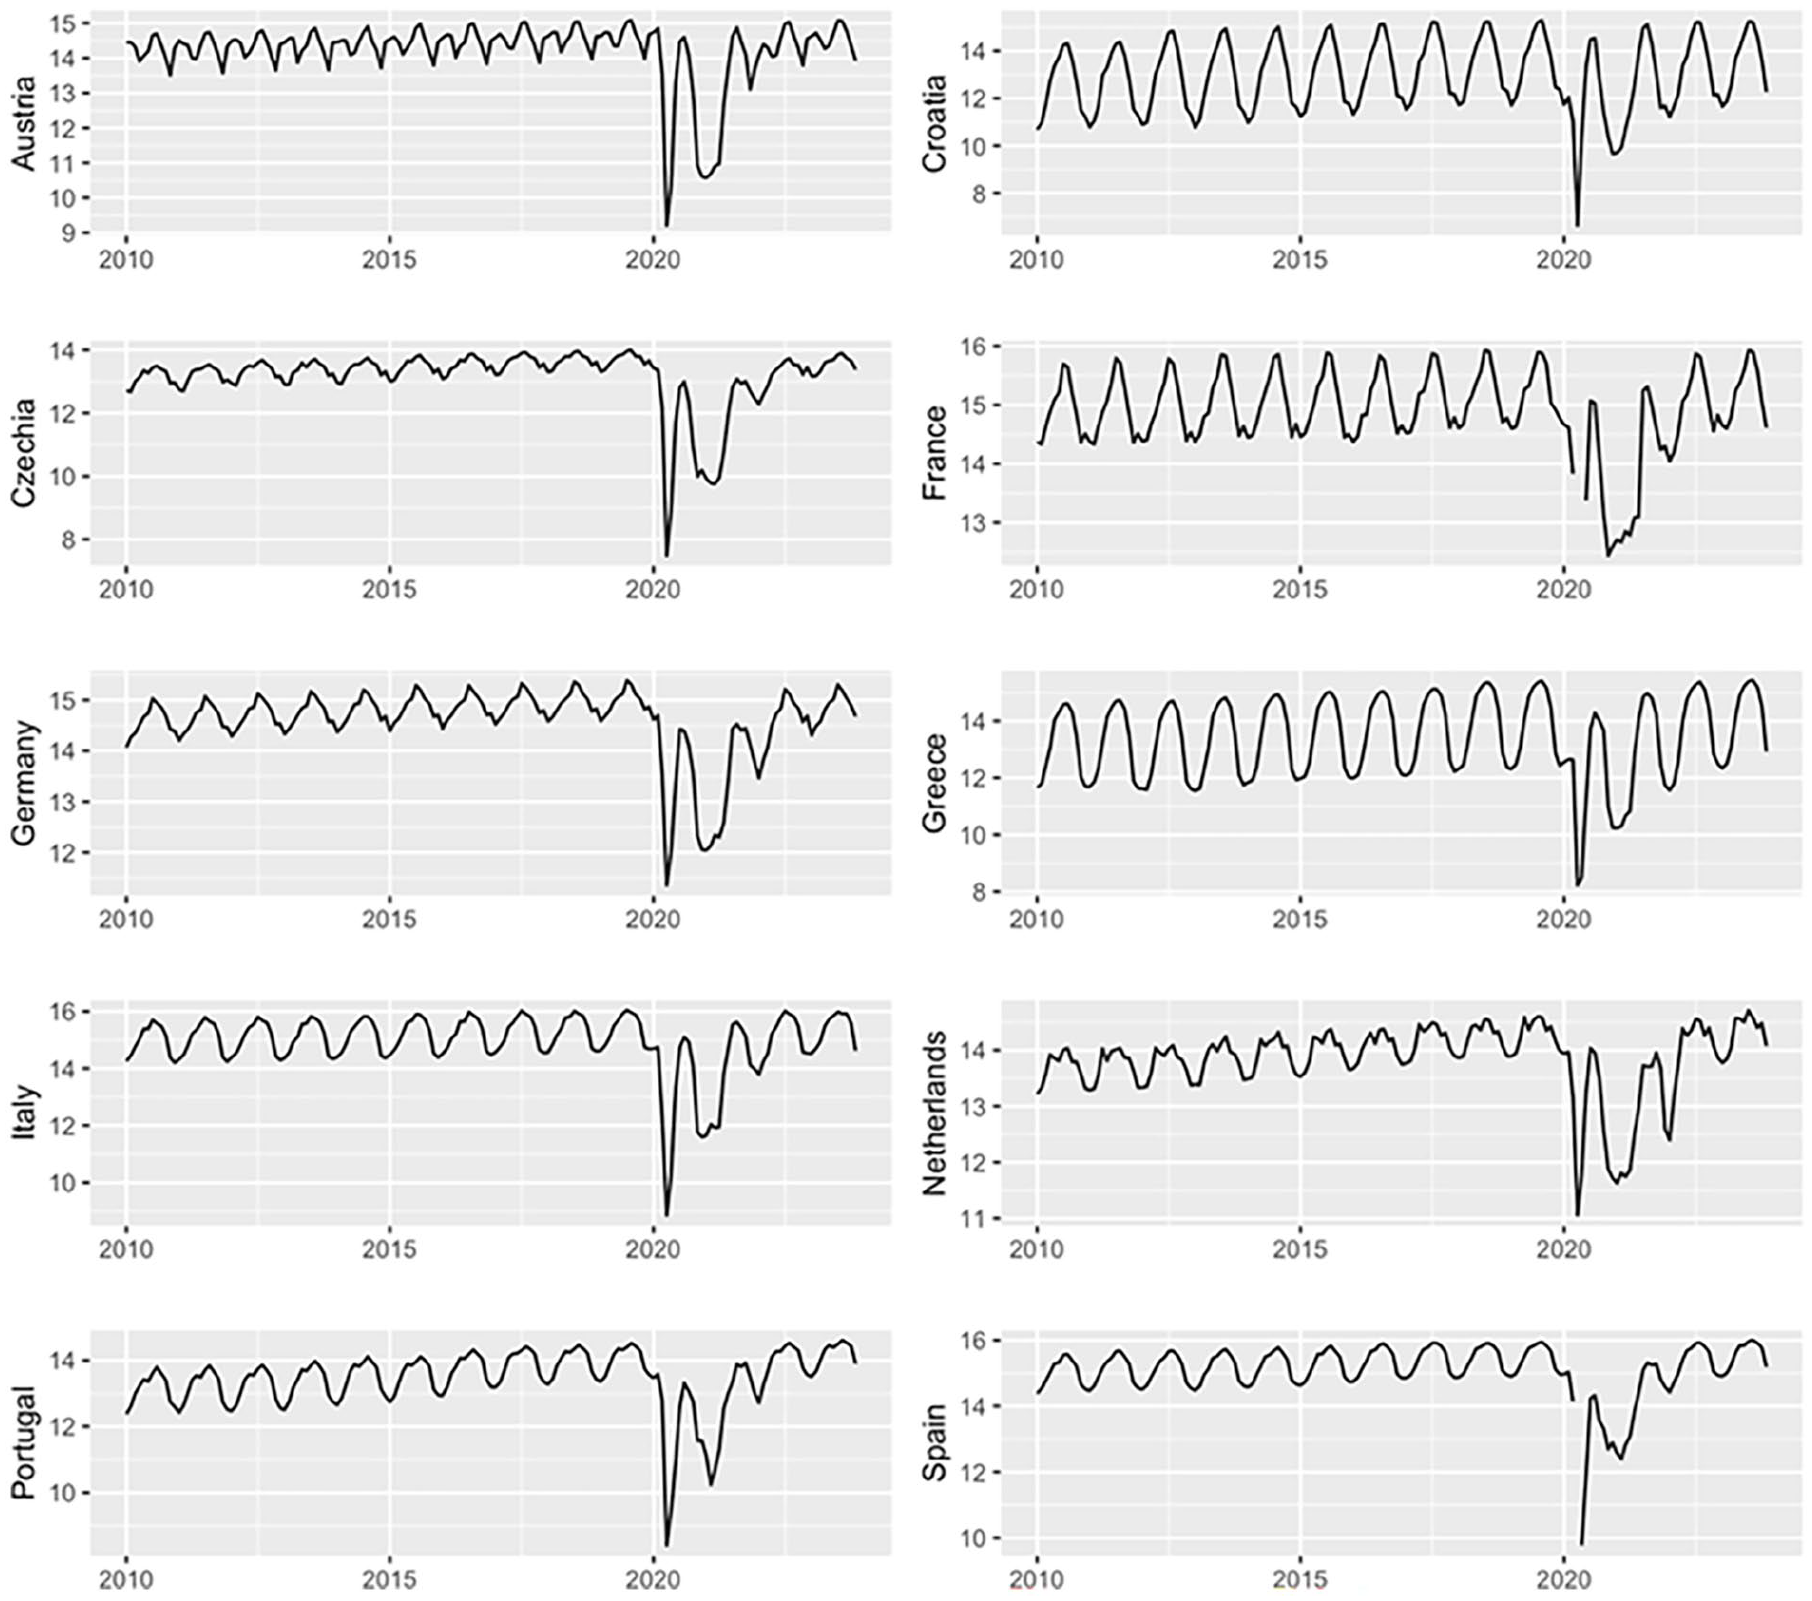
Log Transformed Monthly Tourist Arrivals in Specific Countries From January 2010 to November 2023.
According to the law of demand, tourists’ incomes and the prices of tourism products are considered essential determining variables for tourism demand. Therefore, income and relative price are included as the explanatory variables. Since the tourist arrivals are aggregated at the destination level, we regard the rest of the world as an overall source market for each destination. The tourist income variable is measured by the global industrial production level, excluding the destination country. The relative price is represented by the relative consumer price index between the destination country and the rest of the world. Adjusted by the relative exchange rate between the destination’s local currency and the U.S. dollar, the price variable is defined as
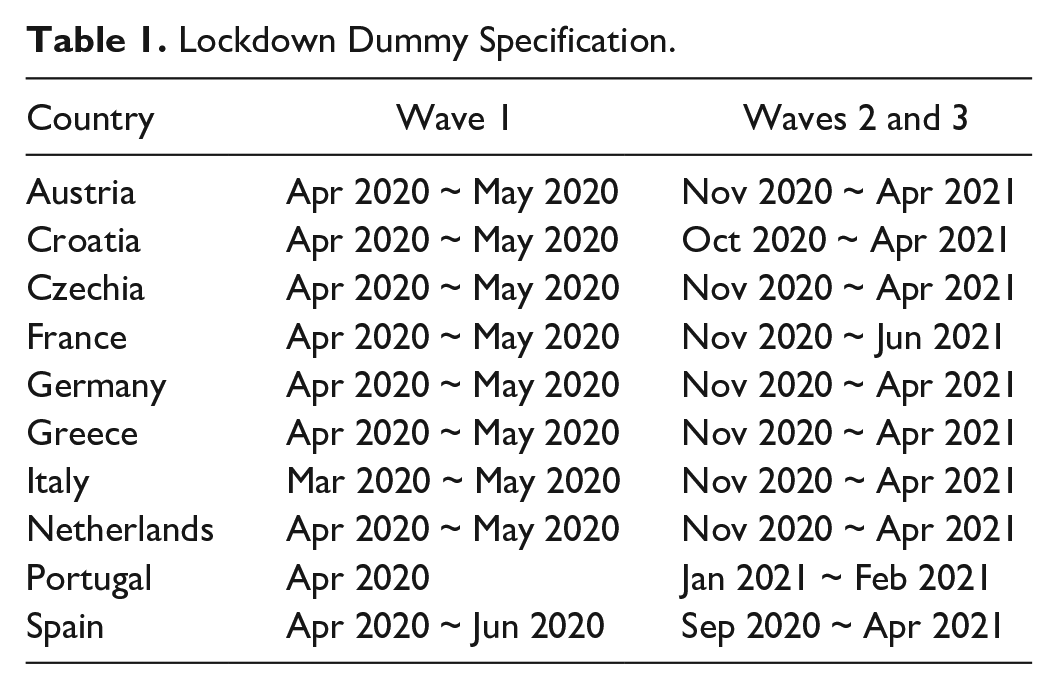
Seasonal dummies are added to the crisis forecasting model to capture seasonal variations in the level variable. The dramatic drop in tourism demand caused by the pandemic can be considered a combination of a level shift that began in January 2020 and one-off events due to various travel restrictions and lockdowns. Sentiment indices have previously been used to transform visitors’ behavioral intention data into forecasting models to improve predictions (Wu et al., 2022). Accordingly, we apply the global travel sentiment index from the UNWTO Tourism Recovery Tracker (UNWTO, 2022) as an additional variable for the pandemic period, accounting for external information and historical data at the global level (see Figure 4). At the destination level, one-off event dummies are included to account for the impact of lockdowns on the first COVID-19 wave and the transition between the second and third COVID-19 waves. The specifications of the lockdown dummy for each destination model are provided in Table 1.
Global COVID-19 Travel Sentiment Index From TCI Research.
Lockdown Dummy Specification.
Forecasting Evaluation
We evaluate the forecasting performance of the ADL model, the ADL with the Bagging method, the Bayesian ADL model, and the ADL with the BayesBag method, in both the normal and COVID-19 crisis periods. To ensure robustness and generalizability, we apply a rolling forecasting method, where forecasts are made iteratively with different starting points in each iteration, ensuring that the models’ performance are not biased by a specific seasonal context.
For forecasting in the normal period, the training dataset is from January 2010 to December 2018, with one- to 12-step-ahead forecasting conducted in a rolling window from January 2019 to December 2019. When running ex-post forecasting (where the out-sample values of the explanatory variables are set using the historical data), the four forecasting methods from the ADL family are compared with the time series forecasting methods (Naïve. ARIMA, ARIMAX, and ETS models) described above to identify the most accurate method(s) in the undisturbed period.
For crisis forecasting during the COVID-19 pandemic, the training dataset covers the period from January 2010 to May 2023, while the evaluation set spans from June 2023 to November 2023 due to data availability. Forecasts up to six steps ahead are generated for the evaluation dataset based on an expanding window. The four ADL methods are compared with benchmarks (Snaïve, SARIMA, SARIMAX, and ETS models) by conducting both ex-post and ex-ante forecasting, where the out-of-sample values of the explanatory variables and travel sentiment index are generated using the ETS method in ex-ante forecasting.
The choice of ARIMA for pre-COVID differenced data and SARIMA for post-COVID level data reflects the distinct characteristics of the two periods. In the pre-COVID period, differencing was applied to achieve stationarity by removing trends and seasonal effects, allowing ARIMA to effectively model the stationary series. In contrast, the post-COVID period involved significant structural breaks and persistent seasonal patterns, which were better captured by the SARIMA model’s explicit seasonal parameters (Brockwell & Davis, 1991). This distinction ensures that each model is appropriately tailored to the underlying data structure, enhancing the accuracy and robustness of the comparisons.
Following the tourism demand forecasting literature (Song et al., 2019), we adopt commonly used error measurements, including the mean absolute percentage error (MAPE), RMSE, and mean absolute scaled error (MASE) to measure forecasting performance. The equations for calculating the three indices are as follows:
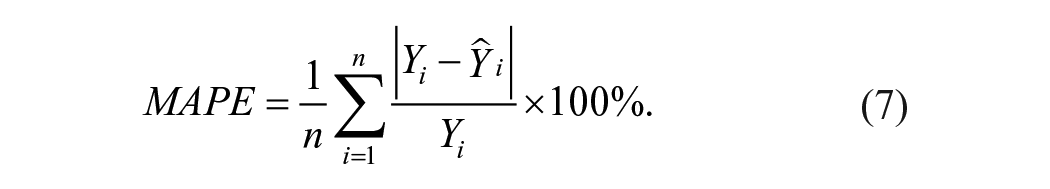
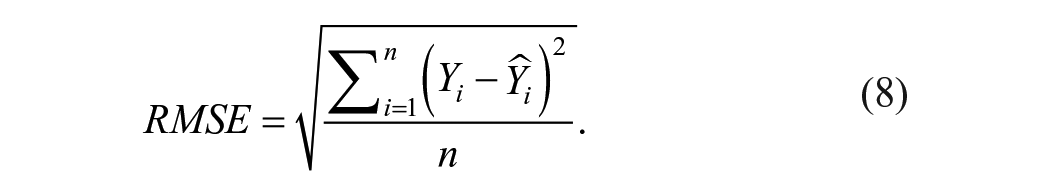
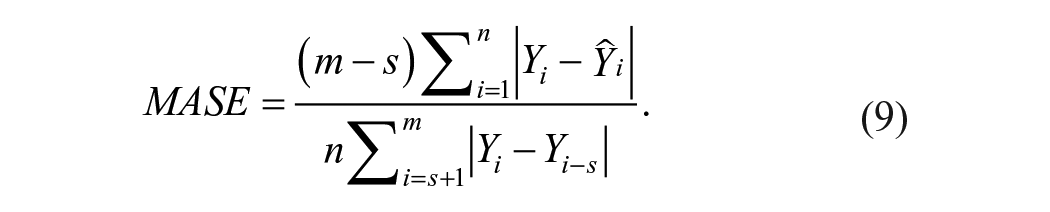
where
Due to the relatively small sample sizes when evaluating forecasting performance during COVID-19, the Harvey–Leybourne–Newbold (HLN) test is applied in the study to test whether the proposed BayesBag method significantly outperforms other forecasting methods in various situations (Harvey et al., 1998). The HLN test, specifically adjusted for small samples, offers a more reliable and accurate measure of forecasting accuracy compared to the Diebold-Mariano test which may overestimate significance in such cases. These findings highlight the HLN test’s usefulness in evaluating the BayesBag method’s ability to handle volatile and limited datasets more effectively than existing methods.
Empirical Results
Data Pre-Test
Following common practice, the seasonality, unit root, and cointegration tests are conducted before the forecasting. The time series plots in Figure 3 show the monthly seasonality in the arrivals for all destinations. The OCSB seasonal unit root test (Osborn et al., 1988) and the nonseasonal unit root test (i.e., the Augmented Dickey–Fuller test) are performed for the above variables. All destination models include variables with an integration order of one, and all variables are either stationary or with an integration order of one before differencing. Due to the presence of seasonality and unit roots, first seasonal differencing is necessary for all destinations when forecasting in the normal period.
These above tests are also prerequisites for the cointegration test of the variables. The variables in most destination models are a mix of stationary and those with an integration order of one, so the ADL bounds test is used to examine the existence of cointegration relationships between the tested variables. When the travel sentiment and lockdown dummy variables are included, cointegrations exist in all models for all destinations at the 1% significance level when the sample covers the pandemic period, except for the t test in the Portugal model. Therefore, it is reasonable to model and forecast the arrival recovery with level variables. Due to the space limit, detailed results of pre-tests are available upon request.
Tourism Demand Forecasting in the Normal Period
The average MAPE values of the pre-COVID-19 forecasting errors of the four ADL models and the three benchmarks are plotted in Figure 5. Both the Bagging technique and the Bayesian approach generally improve the traditional ADL model, but the BayesBag method results in greater improvements. The plain ADL model exhibits the poorest prediction performance amongst all the models, even outperformed by the Naïve model in the long term from six- to 12-step-ahead forecasting. Compared with the ARIMA and ETS models, the ADL model produces the worst forecasts across almost all horizons. The inclusion of exogenous variables does not bring significant advantages to the ARIMAX model, as the ARIMA and ARIMAX models show similar forecasting accuracy.
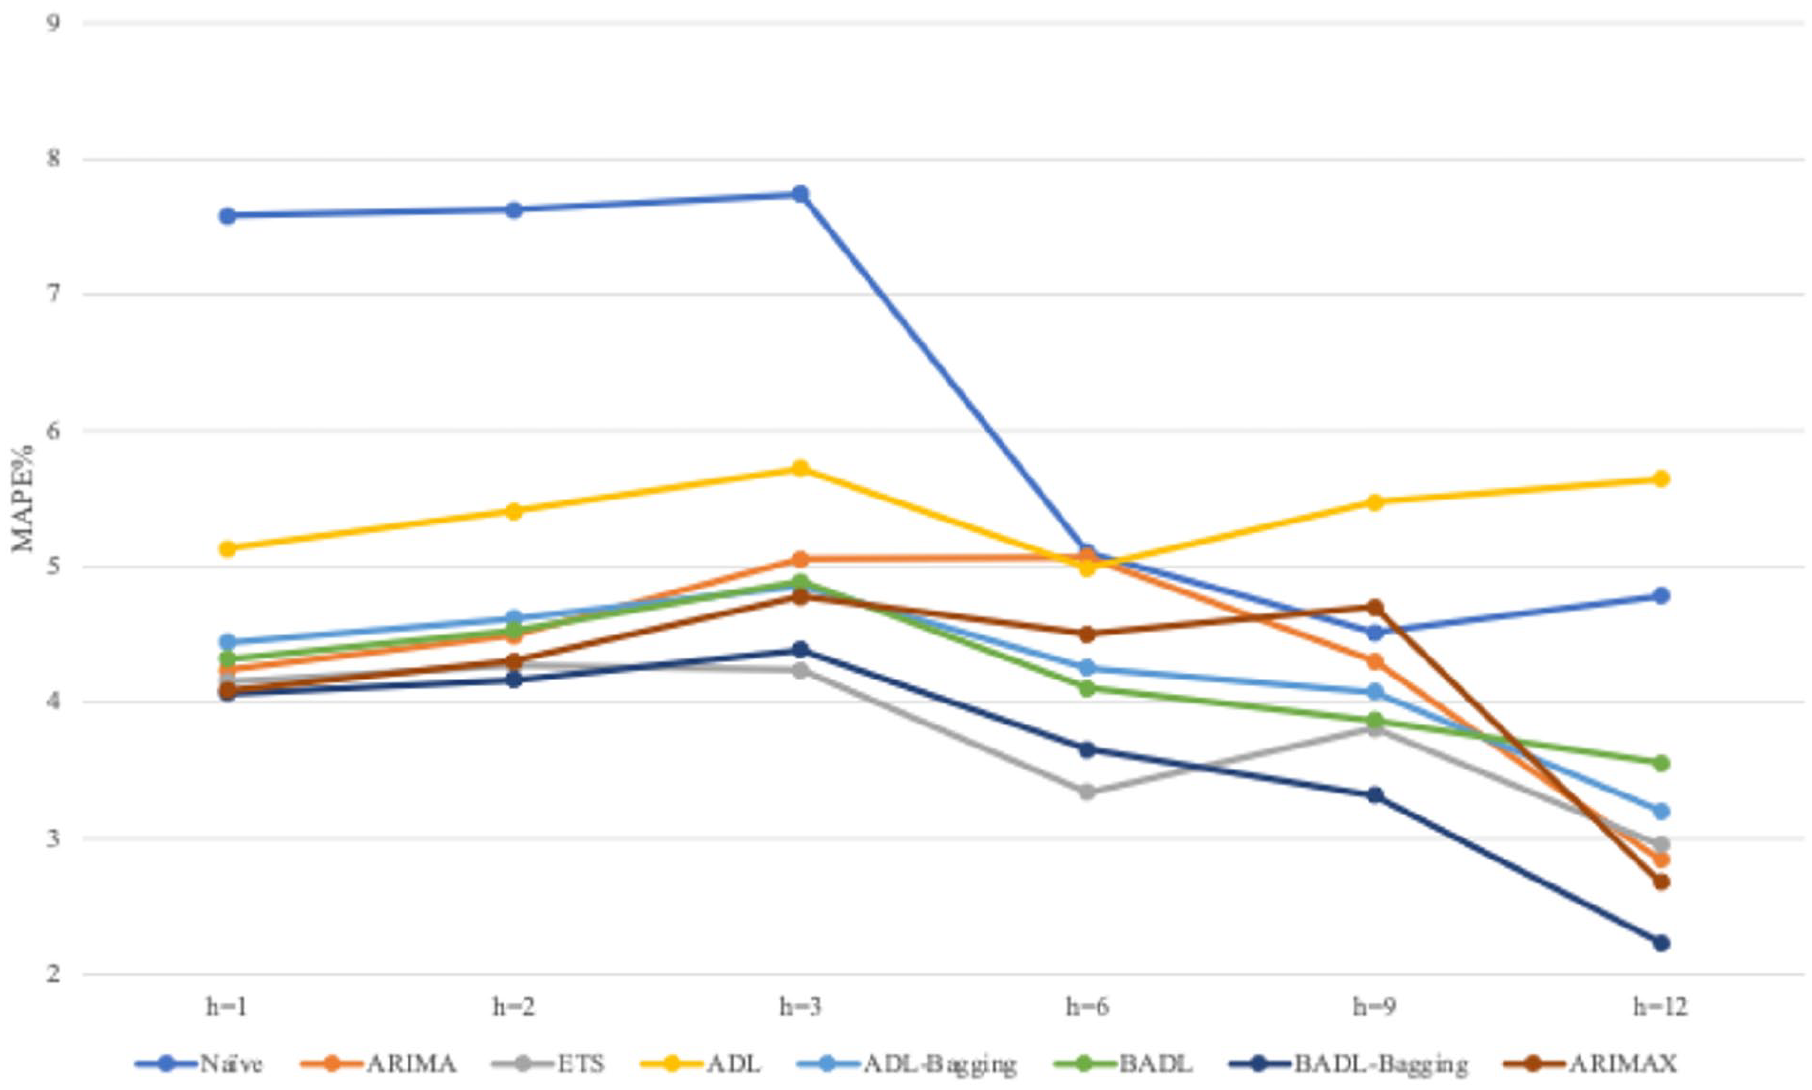
Average MAPE Values of the Different Methods in Normal-Period Forecasting.
The ADL with the Bagging method outperforms the standard ADL model in all forecasts, indicating that the Bagging method can significantly improve European tourism demand forecasting. This finding aligns with the results of Athanasopoulos et al. (2018) regarding Australian inbound tourism, which found that the Bagging method can enhance the forecasting accuracy of the ADL model with differenced variables.
Although the ADL with the Bagging method outperforms the ARIMA model in the medium-term forecasting horizons, it still cannot beat the ETS model in all cases. The Bayesian ADL model demonstrates forecasting accuracy comparable to that of the ADL model with the Bagging method. The expected improvement brought by the Bayesian approach confirms that the ADL model can achieve better forecasting accuracy by imposing restrictions on long-lagged parameters. This superiority of the Bayesian approach is consistent with studies involving the Bayesian vector autoregressive model (Assaf, Li et al., 2019; Wong et al., 2006). The advantage of the BayesBag method is clearly evident in the plot, as the ADL model with the BayesBag method outperforms all the other models. The gradually decreasing forecasting errors indicate that the BayesBag method enhances both the Bagging and Bayesian approaches in ADL forecasting.
The RMSE and MASE values averaged across the 10 destination predictions are compiled in Table 2. The average RMSE and MASE values of the ADL with the BayesBag forecasts are lower than those of the ADL, ADL with the Bagging, Bayesian ADL models and the three benchmark models (i.e., the Naïve, ARIMA, and ARIMAX models). The forecasting methods are ranked based on their RMSE and MASE values, with the average rankings shown in parentheses in Table 2. Once again, the ADL with the BayesBag method outperforms almost all competing models, especially in short-run forecasting (i.e., one- and two-step-ahead). Benefiting from the BayesBag approach, the ADL with the BayesBag method is ranked higher than the other ADL methods across all forecasting horizons. These results are highly consistent with those presented in Figure 5.
Average Performance and HLN Test for Different Methods in Normal-Period Forecasting.
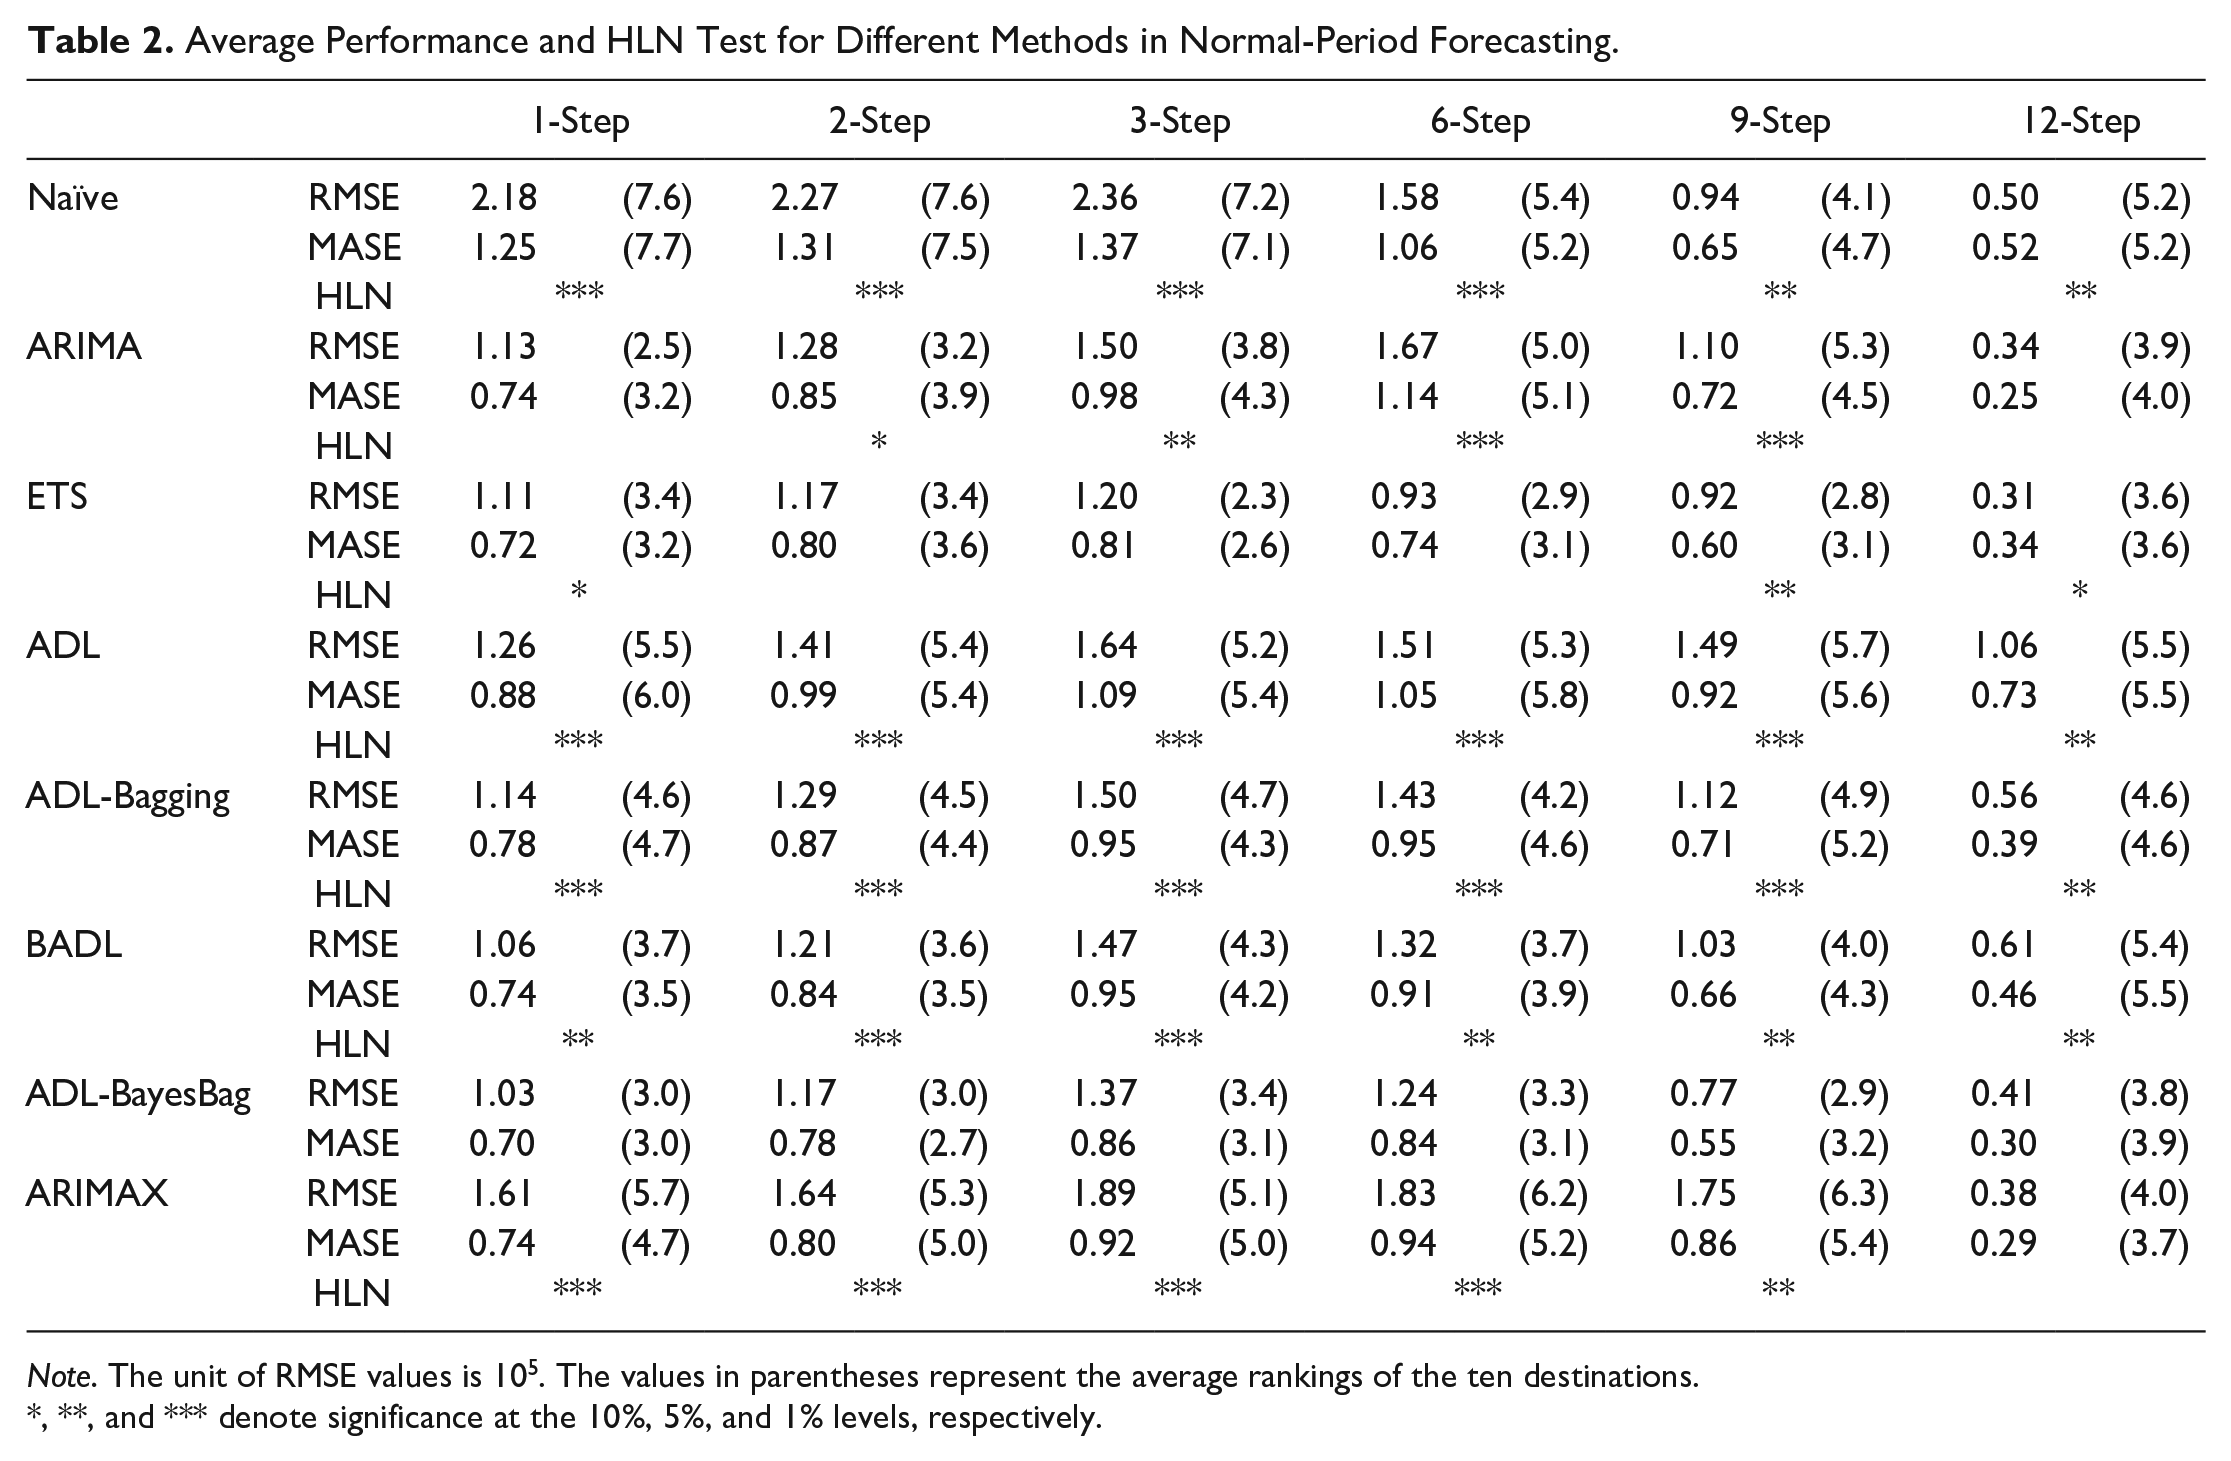
Note. The unit of RMSE values is 105. The values in parentheses represent the average rankings of the ten destinations.
, **, and *** denote significance at the 10%, 5%, and 1% levels, respectively.
Table 2 further confirms the forecasting improvements brought by the BayesBag method and compares the HLN test results of predictions from the ADL with the BayesBag method against those of other models. The superiority of the ADL with the BayesBag method over the other ADL methods is significant in all cases, at least at a 5% significance level. The benchmark ARIMA, ARIMAX, and ETS models have long been used in tourism demand forecasting, and demonstrate relatively good performance, as confirmed by Song et al. (2019) and Jiao and Chen (2019). However, the ADL with the BayesBag method outperforms the Naïve, ARIMA and ARIMAX models in most cases and beats the ETS model in long-term forecasting.
Tourism Demand Ex-Post Forecasting in the COVID-19 Crisis
Figure 6 and Table 3 present the COVID-19 crisis forecasting results, showing significantly reduced forecasting accuracy in the benchmark models. The turbulent data increase the MAPE values of the SARIMA model to at least 17% and up to 40.86% in six-step-ahead forecasting, which is barely useful for tourism management. Similarly, the average MAPE values of the ETS model also increase from 16.88% to 40.82% as the forecasting horizon expands. The SARIMAX model outperforms the ARIMA model in all forecasting horizons, demonstrating the effectiveness of incorporating the sentiment index in crisis forecasting.
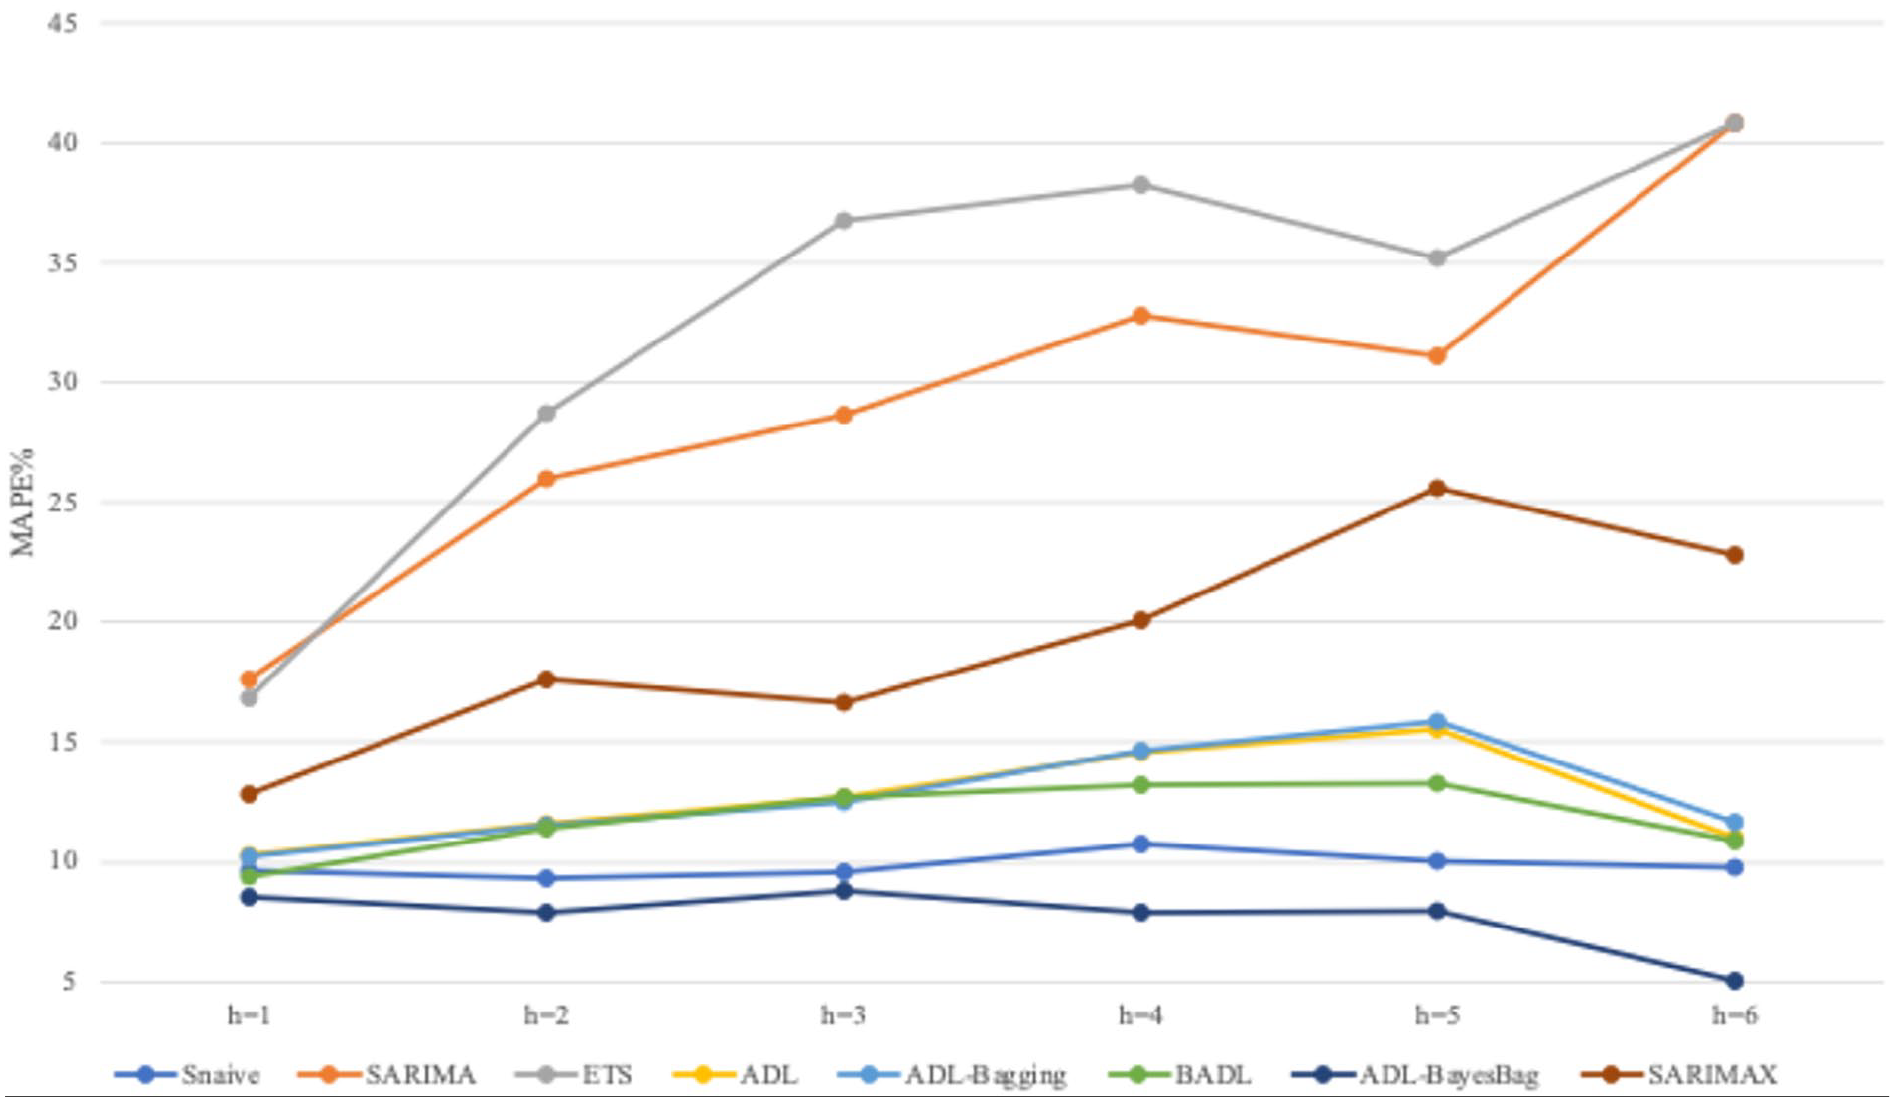
Average MAPE Values of Different Forecasting Methods in COVID-19 Crisis Ex-Post Forecasting.
Average Performance and HLN Test for Different Prediction Methods in COVID-19 Crisis Ex-Post Forecasting.
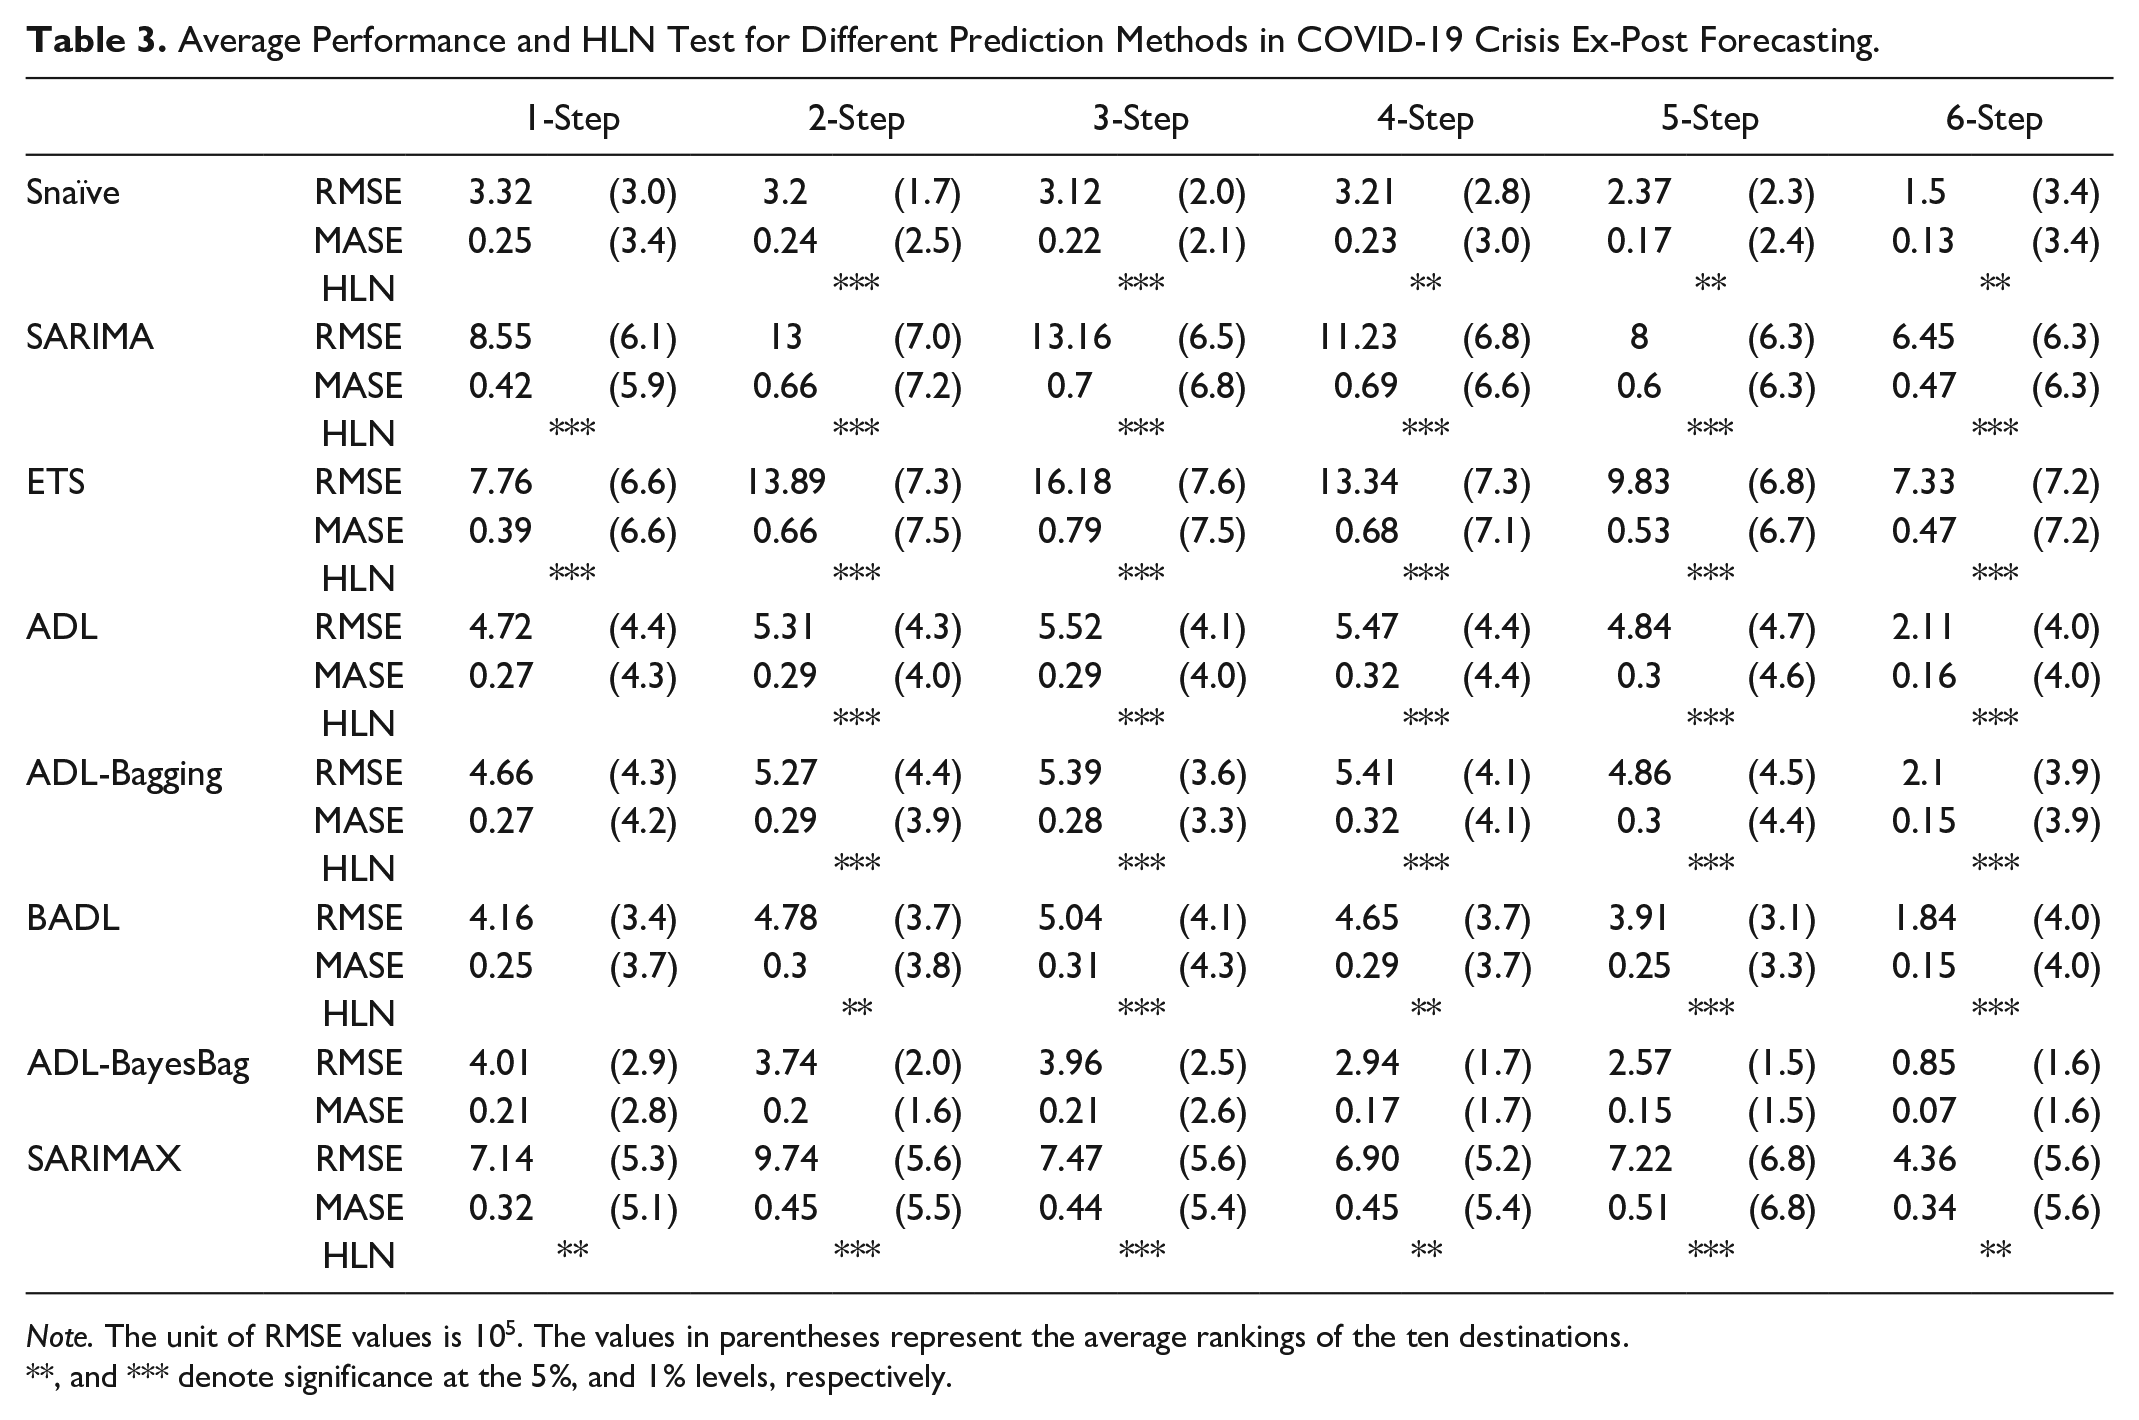
Note. The unit of RMSE values is 105. The values in parentheses represent the average rankings of the ten destinations.
, and *** denote significance at the 5%, and 1% levels, respectively.
According to Figure 3, the tourism markets in all destinations present stable trends and have kept the same seasonality since the second half of 2022, which aligns with the assumptions of the seasonal naïve (Snaïve) prediction model (Brockwell & Davis, 1991). This results in unexpectedly high forecasting accuracy, with the Snaïve model achieving around 10% MAPEs across all forecasting horizons.
The ADL family methods benefit from incorporating the historical global travel sentiment index, resulting in much lower forecasting errors than the univariate SARIMA and ETS models. However, when a turbulent period is included in the training dataset, the pure Bagging method does not offer any improvements over the ADL model, and provides similar forecasting performance to that of the single ADL model, indicating that prediction is not primarily affected by unstable modeling.
In contrast, the Bayesian approach significantly reduces the ADL model’s forecasting error in longer forecasting horizons, by 1.42% and 2.27% in four- and five-step-ahead forecasting. Given the high variation in all coefficients and the tightness for lagged variables determined by grid searched priors, the Bayesian ADL estimation has a greater capacity to handle the major uncertainties in pandemic travel data and sensitivity to recent information, as suggested by Bušs (2009). The ADL with BayesBag method further improves the Bayesian ADL model from two-step-ahead forecasting, confirming that it is preferable in crisis forecasting scenarios.
The results for the RMSE and MASE measures shown in Table 4 are very similar to those of the MAPE. The ADL-BayesBag method emerges as the best forecasting method in most cases. The high average forecasting performance rankings of all ADL methods demonstrate the effectiveness of incorporating the travel sentiment variable in pandemic crisis forecasting. The ADL-BayesBag method achieves average rankings from 1.3 to 2.7, suggesting that it outperforms other methods in most cases. As indicated by the HLN test, the forecasting superiorities of the BayesBag method over other models are significant from the two-step-ahead prediction onward, at the 5% significance level, confirming the excellent forecasting performance of the BayesBag method in longer forecasting horizons.
Average Performance and HLN Test for Different Prediction Methods in COVID-19 Crisis Ex-Ante Forecasting.
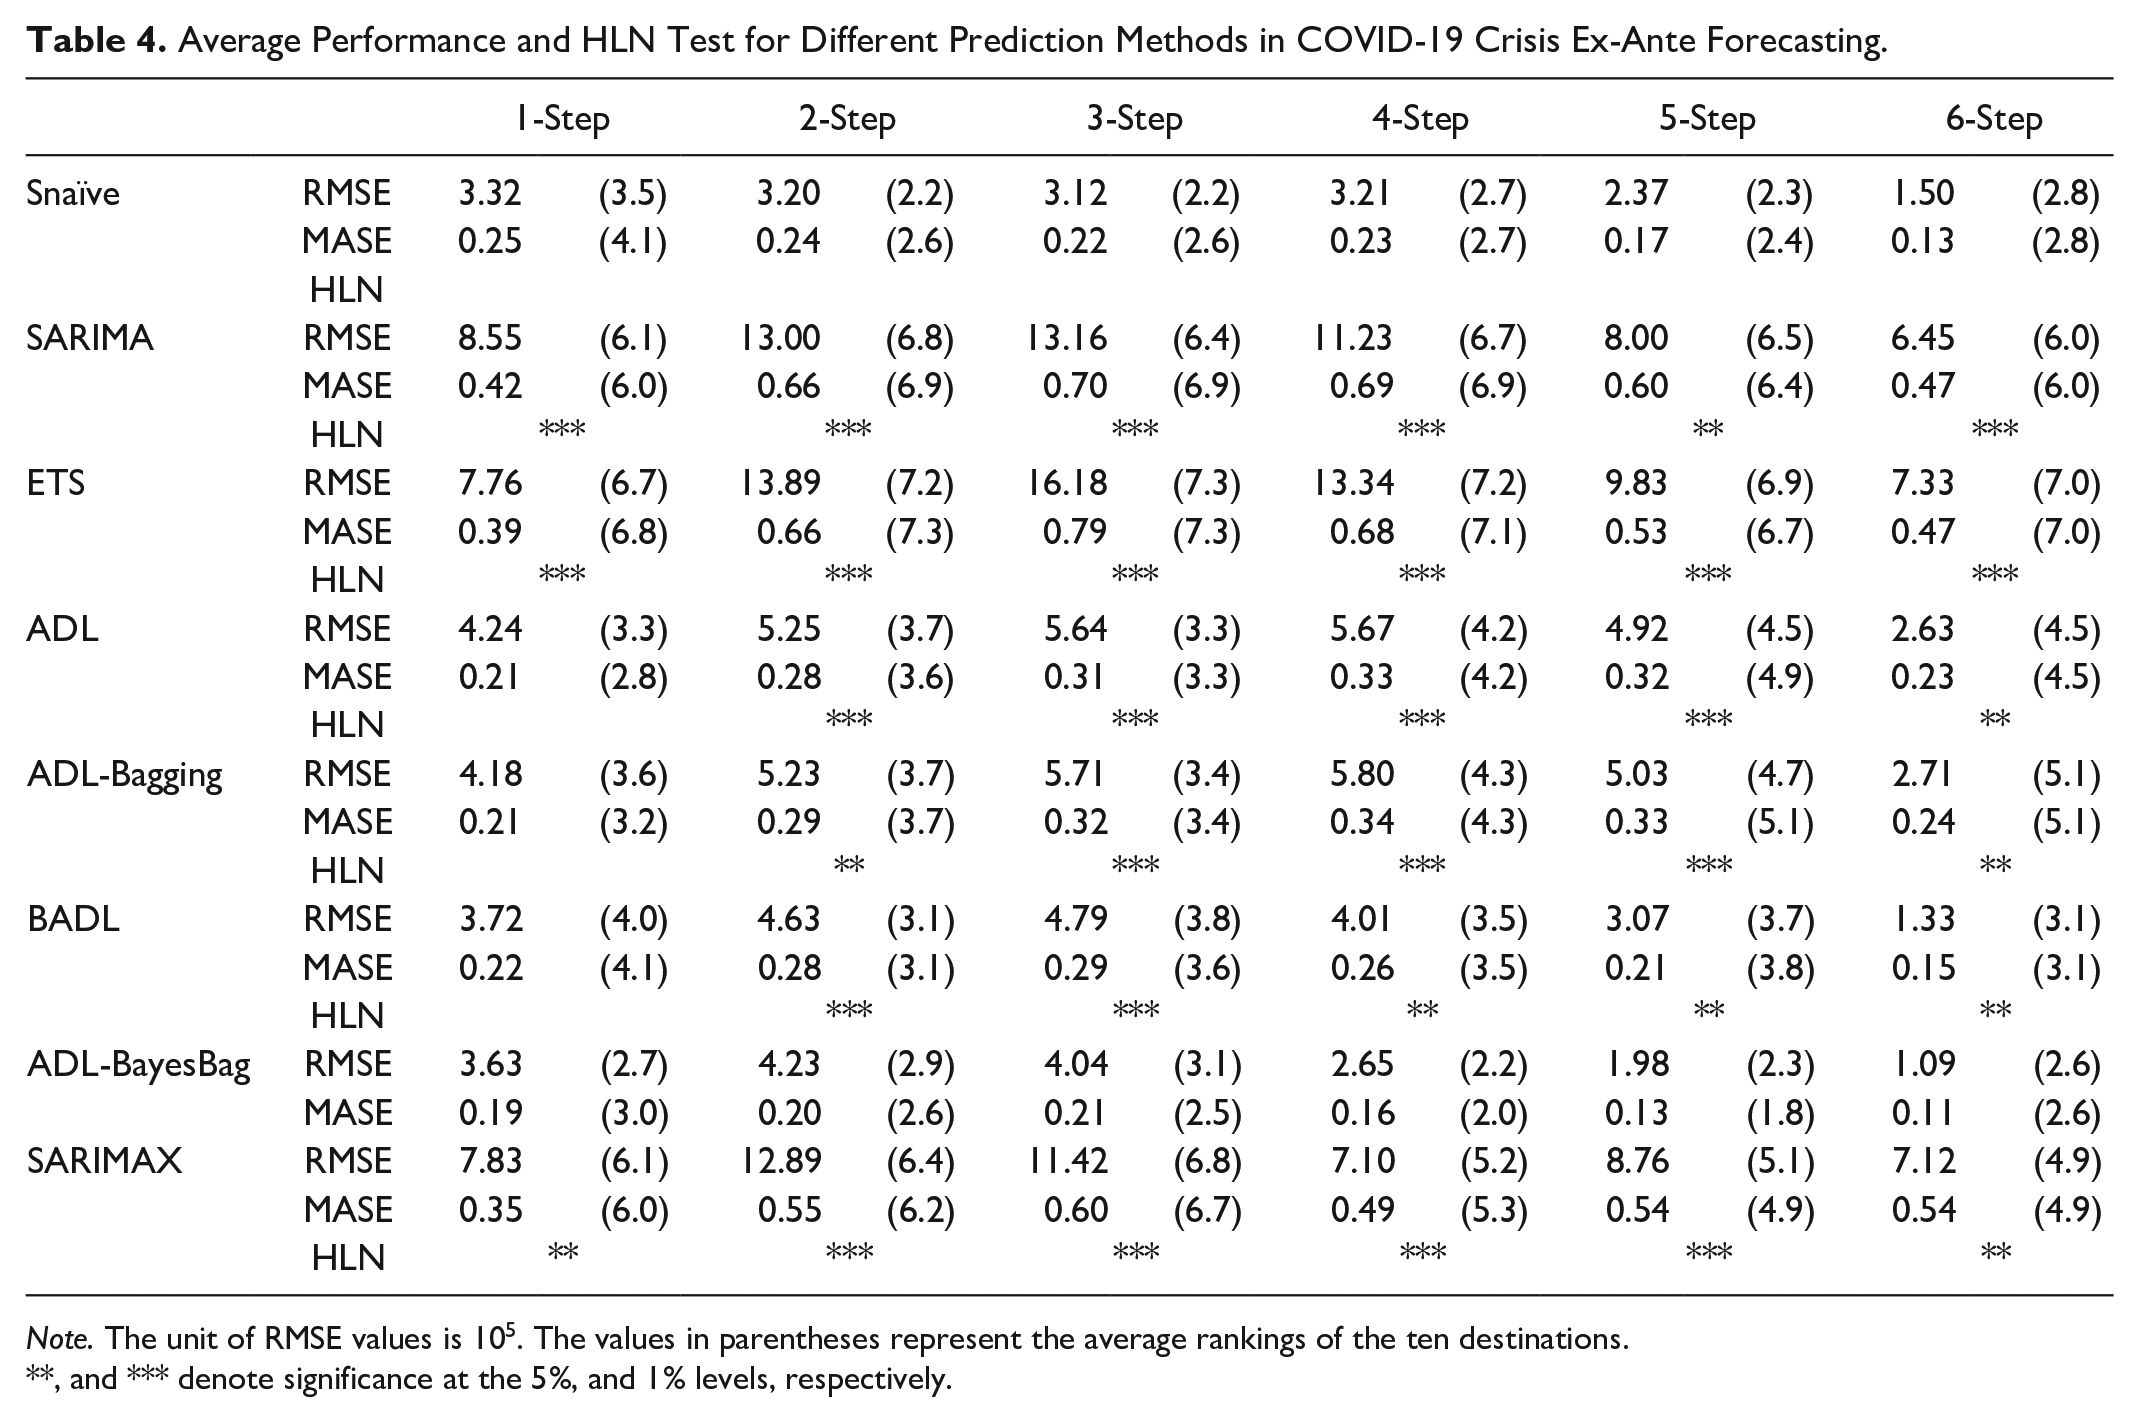
Note. The unit of RMSE values is 105. The values in parentheses represent the average rankings of the ten destinations.
, and *** denote significance at the 5%, and 1% levels, respectively.
Tourism Demand Ex-Ante Forecasting in the COVID-19 Crisis
Although all models in the ADL family outperform the SARIMA, SARIMAX, and ETS benchmarks in the COVID-19 crisis prediction under the ex-post forecasting setting, it is crucial to assess whether this superiority persists in ex-ante forecasting, where values of explanatory variables are unknown. By iteratively expanding the independent variables in different rolling stages, ex-ante forecasting reproduces a real forecast scenario, thereby providing a fairer competition between the univariate benchmarks and the ADL models. Figure 7 clearly shows that the forecasting performance of all ADL models deteriorates compared with the previous ex-post forecasting.
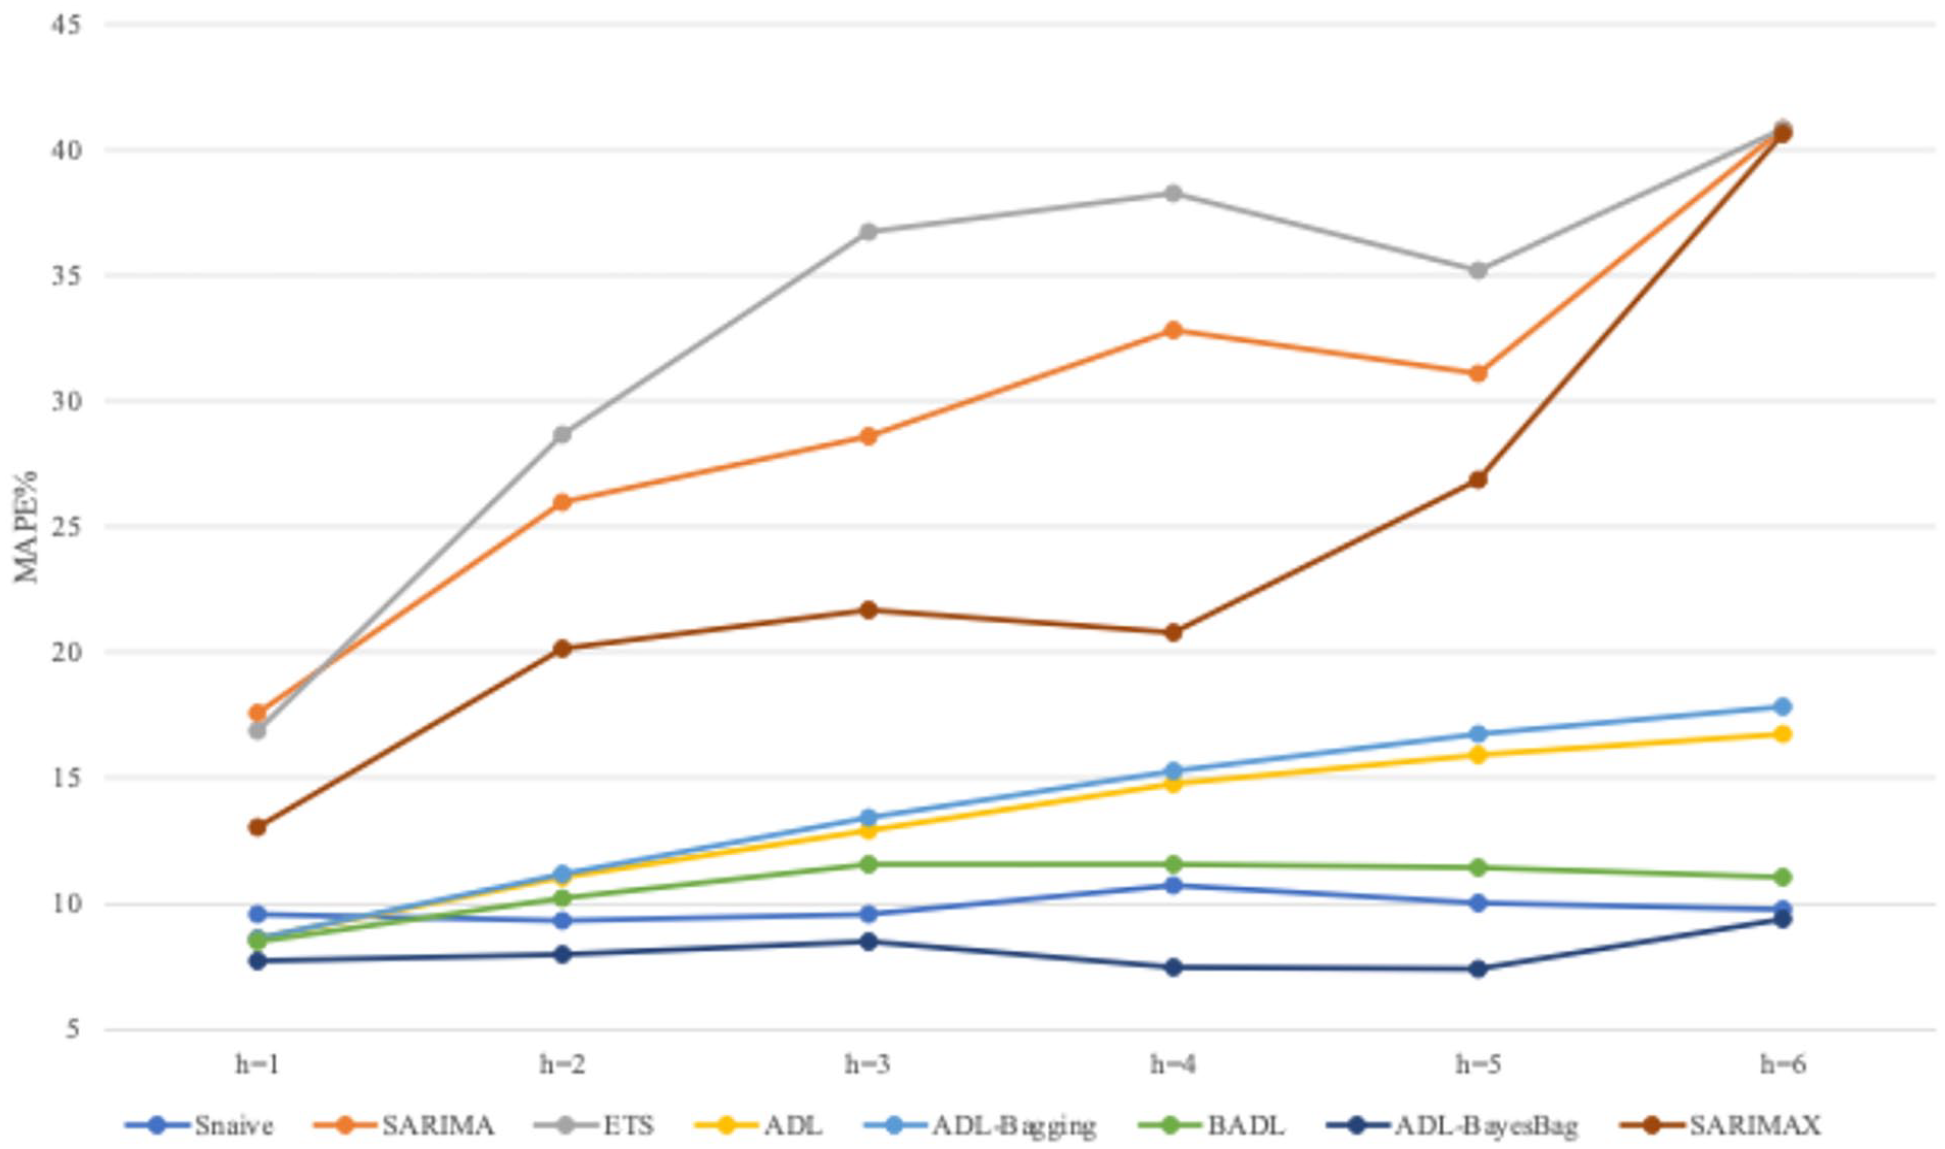
Average MAPE Values of Different Forecasting Methods in COVID-19 Crisis Ex-Ante Forecasting.
Overall, the SARIMAX model gradually loses its forecasting power as the forecasting horizon increases, while the ex-ante forecasting performance of ADL-based models does not differ much from that of ex-post forecasts. The Bayesian ADL model performs slightly better, indicating effective adaptation to the ex-ante forecasting scenario. Furthermore, the BayesBag methods enhance the ADL model’s performance, surpassing all others. However, the limited validation samples for longer forecasting horizons reveal a convergence in forecasts between the BayesBag, Snaïve, and Bayesian ADL models. Once again, the leading average rankings indicate that the ADL BayesBag method outperforms the other methods in most destination cases. The superiority of the ADL BayesBag over the other ADL methods remains significant among all counterparts, as shown in Table 4, except when compared to the Bayesian ADL model in one-step-ahead predictions and the Snaïve model.
To gain further insights into the forecasting performance of the various models across destinations, the frequencies at which each method provides the best or second-best forecasts are provided in Table 5. Compared to the gradually declining forecasting accuracy of the other models, the ADL-BayesBag method consistently ranks in the top two in over half of the cases. In addition to dominating the rankings in two- and three-step-ahead forecasting, the ADL-BayesBag is the most or second most accurate forecasting method in the longer term (four and five steps ahead) for at least seven destinations. The Snaïve model gives comparable performance to the ADL-BayesBag model due to stagnation in most destinations, but this does not indicate a convincingly outstanding performance in this study.
Frequencies of the Top Two Rankings for the Different Methods in COVID-19 Crisis Ex-Ante Forecasting.
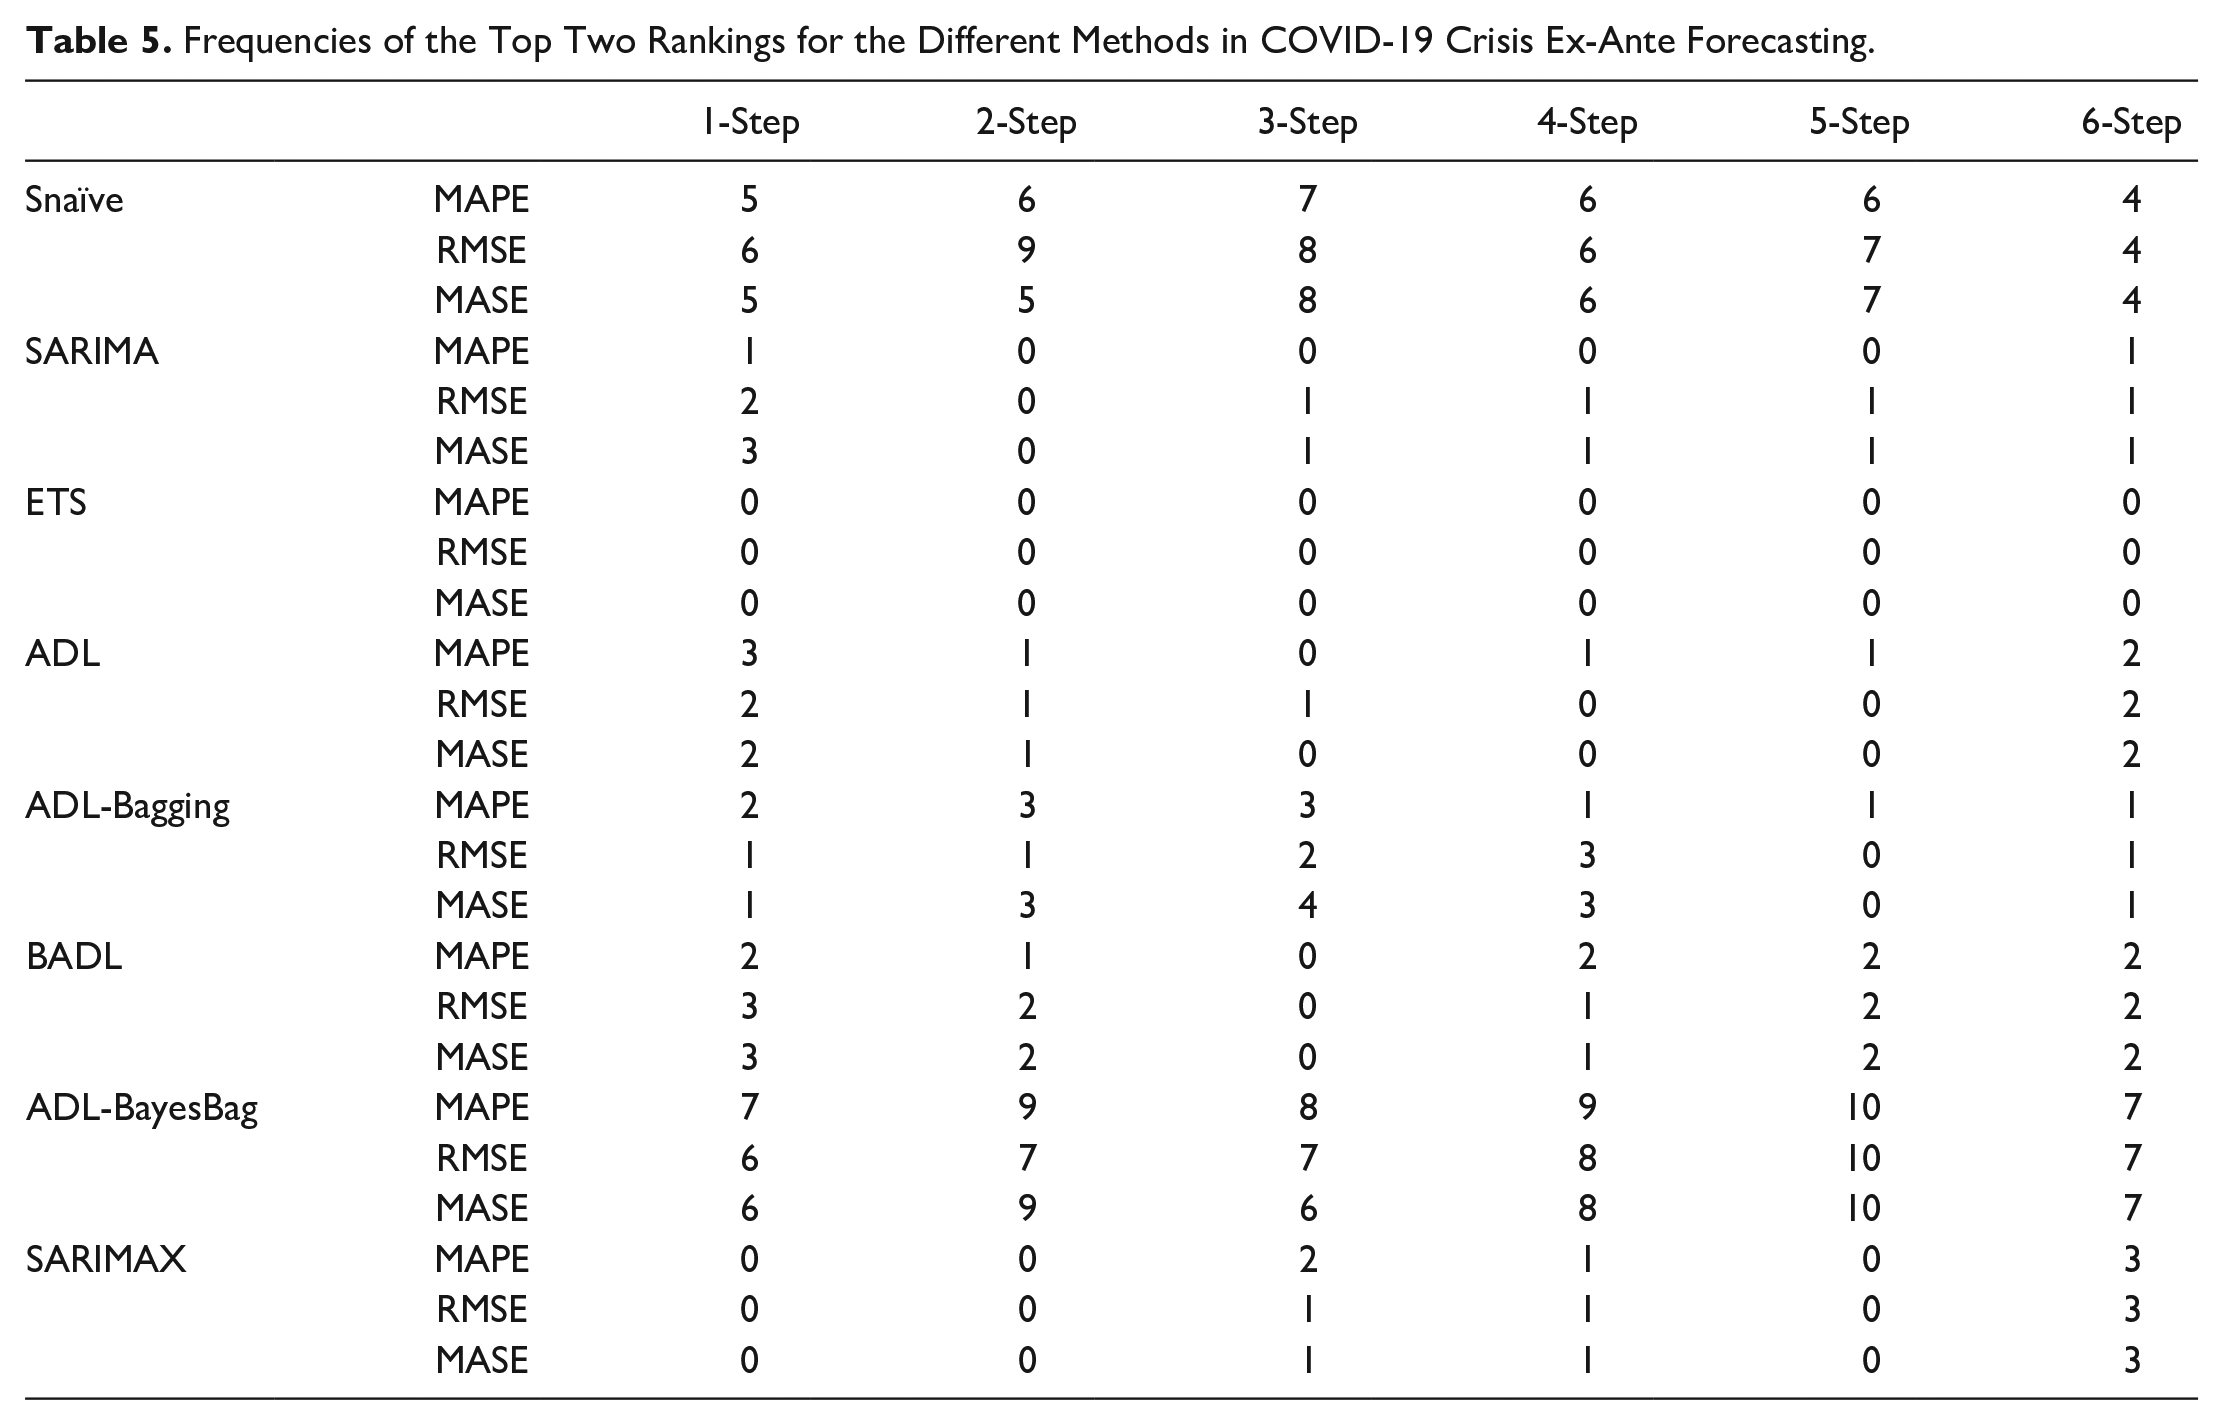
In past prediction practices, the performance of the Snaïve model was often deemed unsatisfactory due to its simplistic assumptions. The unusually accurate predictions of the Snaïve model result from the rapid recovery and subsequent stabilization of the tourism markets in some countries after the pandemic. To assess the forecasting performance of the Snaïve model and compare it with the ADL BayesBag method, six one-step-ahead forecasts of Croatia and Czechia across the validation period, where the Snaïve model exhibits its best and worst performance, respectively, are presented in Figure 8.
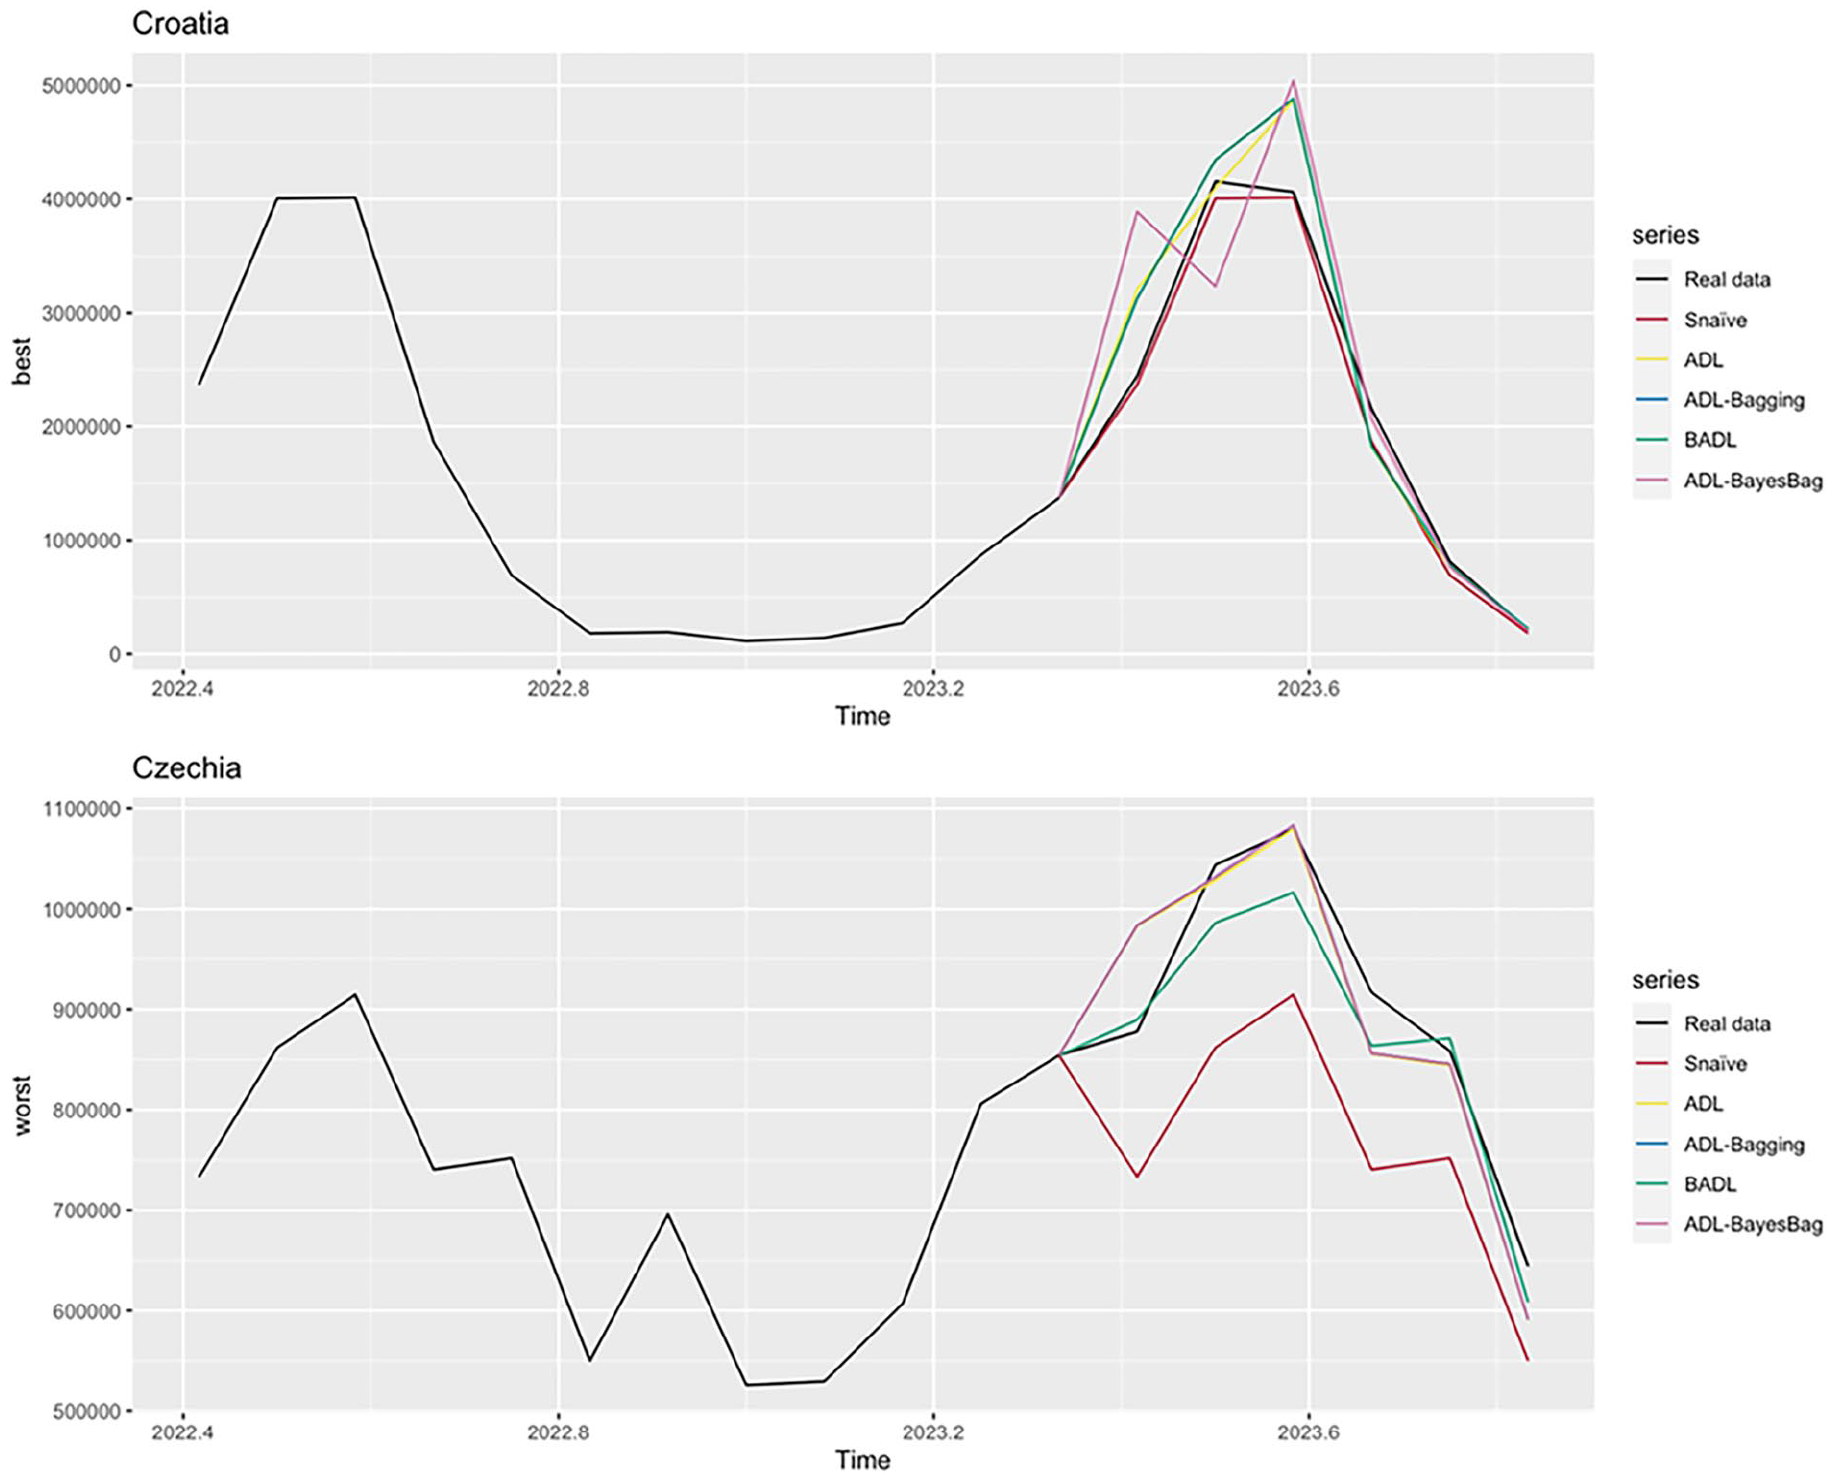
Forecasts and Actual Values (2022M6–2023M11) of Tourism Arrivals in Croatia and Czechia.
In the case of Croatia, international tourism arrivals experienced a rapid rebound and reached 80% of pre-pandemic levels in the first quarter of 2023, with 235 million tourists traveling internationally in the first 3 months, driven by strong intra-regional demand (UN Tourism, 2023). As a result, the ongoing recovery process causes stability in inbound tourism in 2023 compared to the previous year, which coincidently matches the Snaïve forecasts. The four ADL forecasting models produced very similar prediction results. Although none could fully capture the stagnation, they did not deviate significantly from the real data at the end of the forecasting period.
Conversely, in Czechia, the recovery process was stronger and more prolonged, bolstered by new direct flights to Asia and train ticket promotions in July 2023. The Snaïve model underestimated this upward turn from the second half of 2023 (Figure 8). The ADL BayesBag model, which shares similar seasonal patterns with other ADL methods, accurately reflects the significant rebound in Czechia’s inbound market, starting from a higher forecasting level. Based on the ex-ante forecasting evidence, the BayesBag method distinguishes itself in both aggregated and individual forecasting accuracy.
Conclusion and Implications
This study proposes the BayesBag method for tourism demand forecasting to improve tourism forecasting performance in both normal and crisis times. We focus on the European tourism market, especially forecasting monthly tourist arrivals in Austria, Croatia, Czechia, France, Germany, Greece, Italy, the Netherlands, Portugal, and Spain. Three univariate time series forecasting methods, the normal ADL model, and the ADL model with Bagging are compared with the Bayesian ADL and BayesBag models. Given the unprecedented impact of the pandemic on tourism demand, the evaluation involves both ex-post and ex-ante forecasts during the COVID-19 period for a comprehensive comparison. The results indicate that the two Bayesian methods offer improvements upon the ADL forecasts. Although the Bagging method helps address the forecasting uncertainty in the general-to-specific approach, the improvement offered is limited for crisis forecasting. Under different crisis forecasting scenarios, the convergence and divergence are significant between the BayesBag and other methods. The results suggested that in stable, non-crisis periods, the performance of traditional models may be comparable with that of more advanced methods like BayesBag. However, traditional methods may struggle to adapt to structural breaks and data’s volatile pattern during the crisis period. The sound forecasting performance under both normal and crisis forecasting scenarios confirms that the Bayesian approach is consistently effective in addressing the overfitting problem. The proposed BayesBag method enhances ADL forecasting by regulating the parameters to avoid overfitting and by aggregating the bootstrapped posterior to stabilize the Bayesian inference.
Our study makes three main methodological contributions. First, we introduce the BayesBag method as an innovative forecasting technique to improve the forecasting accuracy and robustness of the ADL model. The BayesBag method is more effective than the Bagging and Bayesian approaches in simultaneously addressing forecasting uncertainty and overfitting issues. The sound forecasting performance of the proposed method has been tested to be consistent in both normal and crisis periods. Second, the advantages of the BayesBag method have previously only been demonstrated with cross-sectional data. Our study is the first to apply this method to time series forecasting with bootstrapping, making it applicable to other similar forecasting contexts. In addition, our study provides valuable methodological guidelines for forecasting tourism demand during the uncertainties arising from a major public health crisis such as the COVID-19 pandemic. We make the first attempt to model the impact of the pandemic on tourism demand by introducing the global travel sentiment index, which captures visitors’ behavioral intentions. The global travel sentiment variable and lockdown dummies are found to be effective in tracking the uncertainties associated with the crisis and the related policy impacts. This finding suggests future research directions in tourism forecasting during the pandemic, as highlighted by Song et al. (2022).
The global tourism industry is navigating a period of profound uncertainty as it adapts to a rapidly changing landscape in the post-pandemic era. Destinations now face challenges such as shifting travel behaviors, fluctuating government policies, and the impact of evolving economic conditions on tourism demand. These uncertainties make it increasingly difficult for tourism businesses to predict demand accurately, complicating efforts to manage product inventories, workforce planning, and supply chain logistics. Additionally, new trends such as the rise of remote work, changing preferences for less crowded destinations, and concerns about sustainability have introduced further complexities into tourism management. In this volatile environment, accurate forecasting is essential for destinations to remain agile and responsive to shifting market dynamics. The forecasting method proposed in this study can enable accurate and stable forecasts to be generated by combining past tourism demand trends, macroeconomic conditions, and tourists’ travel sentiments.
From a policy perspective, our findings provide important insights for tourism management and crisis recovery strategies. First, the superior performance of the BayesBag method highlights the importance of adopting advanced forecasting techniques that can account for structural breaks and high volatility. Policymakers should incorporate such models into tourism management systems to make more informed decisions regarding resource allocation, tourism promotion, and crisis response measures. Second, the inclusion of sentiment data suggests that real-time traveler information, such as sentiment indices or social media data, can be valuable in predicting tourism recovery patterns. Governments and tourism authorities should invest in data collection infrastructures that capture real-time sentiment to enhance predictive capabilities in crisis situations. Third, the ability of the model to perform well in both short- and long-term forecasting indicates that it can be used to inform both immediate crisis responses and longer-term recovery strategies, helping policymakers develop more adaptive and resilient tourism policies. Also, beyond the crisis context, accurate demand forecasts from the proposed BayesBag method can guide long-term planning to balance tourism growth with environmental and social sustainability, aligning policies with broader sustainable development goals.
While our findings offer valuable insights into tourism management and policy, the study has several limitations. First, the availability of data, particularly for the global travel sentiment index, limits the length of the time series and the number of variables that can be included, which may affect the generalizability of the model to other regions or time periods. Second, our study focuses primarily on European destinations; future research should explore the applicability of the BayesBag method in other geographical contexts and industries. Finally, the model’s performance could be further enhanced by incorporating more granular sentiment indices or other real-time indicators, such as online search trends or social media data, to capture evolving traveler intentions more accurately.
This study reveals several future research directions. First, this study used a global travel sentiment index to fit each European destination model due to data unavailability. Future studies could investigate the incorporation of destination-specific sentiment indices or alternative real-time data sources, such as social media or online search trends, to further enhance the model’s predictability during volatile periods. Second, the recovery of tourism demand between specific origin-destination pairs warrants further investigation, particularly when analyzing tourists’ travel intentions and demand elasticities. Third, future research could examine how crises impact tourism demand differently across destinations, highlighting the role of destination profiles in shaping recovery patterns. Comparative analyses could reveal insights for targeted recovery strategies. In addition, future studies could explore hybrid models that integrate artificial intelligence and machine learning techniques with the BayesBag method. These extensions may provide more precise forecasting during turbulent periods, contributing further to the resilience and recovery of the global tourism industry.
Footnotes
Declaration of Conflicting Interests
The authors declared no potential conflicts of interest with respect to the research, authorship, and/or publication of this article.
Funding
The author(s) disclosed receipt of the following financial support for the research, authorship, and/or publication of this article: This research was funded by the Hospitality and Tourism Research Centre of the School of Hotel and Tourism Management, The Hong Kong Polytechnic University (Grant No. 5-ZJLP) and the Start-up Foundation of the School of Hotel and Tourism Management, The Hong Kong Polytechnic University (Grant No. 1-BE89).