
Abstract
Tourism seasonality negatively affects hotels’ operational and financial performance and then survival probabilities. Several studies have evaluated the impact of tourism seasonality on hotels’ exit risk. However, the empirical findings are ambiguous, probably due to the overall seasonality and different measures used in these studies. Against this background, this study explores the impact of tourism seasonality on hotel firms’ exit risk, using a proportional hazards model. We controlled for financial ratios, the main factors influencing the exit risk, and used two measures of tourism seasonality by market segment, namely, leisure, business, and conference tourism. The case study is the Norwegian hotel industry. The empirical results suggest that the different seasonal patterns of tourism demand in the market segments mitigate the impact of the overall seasonality on hotels’ exit risk, and that seasonality measures of various tourism segments affect the exit risk in different ways.
Introduction
Tourism seasonality is defined as demand variations on a regular time horizon and in regular frequencies as a result of climate and institutional characteristics (Cuccia & Rizzo, 2011; Li et al., 2018; Lundtorp et al., 1999; Martín Martín et al., 2017; Tkaczynski et al., 2015) as well as other factors, such as business cycles, travel costs, and sociodemographic characteristics (Nadal et al., 2004; Xie & Tveteraas, 2020). Seasonal overtourism has long been recognized as one of the overriding issues hindering sustainable development of the tourism industry worldwide (Cuccia & Rizzo, 2011). Sustainability consists of economic growth, social inclusion, and environmental protection (Pegg et al., 2012), which are all affected by tourism seasonality. For example, researchers have documented that tourism seasonality generally has a negative impact on tourism growth and regional economic development (Cuccia & Rizzo, 2011; Pegg et al., 2012). At the hotel level, seasonal fluctuations in tourism demand tend to hurt operational and financial performance and then reduce hotels’ competitive advantage and efficiency. An extreme variance of occupancy rates in a tourist destination increases the exit risk and the likelihood of business failure for hotels in that destination (Falk & Hagsten, 2018; Lado-Sestayo et al., 2016; Vivel-Búa et al., 2019).
Economic sustainability is a critical and fundamental factor influencing the tourism industry’s development (Martín Martín et al., 2017). A profitable tourism firm generally has high motivation and capacity to address environmental issues. Hospitality firms with desirable financial results are better able to allocate resources to environmental practices (Jackson et al., 2015). In contrast, tourism firms facing exit risk are less likely to be eco-friendly. As such, survival ability is a critical factor for sustainable tourism. Promotional campaigns and marketing strategies aimed at mitigating tourism seasonality by attracting tourists in off-peak seasons may improve firm performance and competitive advantage. Additionally, policies targeting sustainable tourism should take firm performance into account.
Tourism seasonality affects hotels’ exit risk through its impact on operational and financial performance. Underutilization of capital assets in off-peak seasons has been generally recognized as an obstacle to operational and financial performance (Baum, 1999; Zhang et al., 2020). Tourism seasonality affects elements of operational performance, such as occupancy, average daily rate, and revenues per available room. A low level of tourism seasonality may improve hotel firms’ operating performance. Hotel capacity designed to meet peak demand is not sufficiently utilized in off-peak seasons, resulting in poor financial performance. Georgantzas (2003) found that alleviating tourism seasonality enhances hotel profitability. Researchers have documented that organizational performance, such as competitive advantage and survival ability, is a consequence of financial and operational performance. However, few studies on the seasonality and bankruptcy nexus were based on a standard accounting model, which relies on financial ratios that represent various aspects of profitability and capital structure, to predict bankruptcy.
Another issue that is rarely discussed in the literature is whether seasonality by tourism segment affects the exit risk in various ways. The pattern of tourism seasonality varies across tourism segments due to different determinants of tourism demand. The leisure travel market is more subject to climate and institutional characteristics, suggesting that this segment has a stable seasonality pattern over a long period (Cannas, 2012). However, Xie and Tveteraas (2020) documented that the leisure travel market segment has a much larger income elasticity and is more sensitive to changes in the exchange rate than the business and conference travel segments. Unlike leisure travelers, tourists for business and conferences are more sensitive to economic factors and business cycles. In general, private households for vacationing are more price-sensitive than those for businesses regarding travel decisions (Brons et al., 2002).
Different driving forces of individual tourism market segments lead to heterogeneity in their demand variations, which may amplify or mitigate the overall seasonal pattern in tourist attractions (Garín-Muñoz, 2009). Consequently, two empirical issues need to be addressed. First, in the case where the overall seasonality is mitigated, the overall seasonality may not correlate with hotels’ survival probabilities. As such, the mixed evidence of the impact of seasonality on hotels’ exit risk in the literature (Falk & Hagsten, 2018; Lado-Sestayo et al., 2016) may occur due to the aggregate measure. Second, heterogeneity in the demand variations of the individual tourism market segments may cause their different impacts on the probability of insolvency. Using seasonality measures for tourism segments can uncover the relative importance of those segments, which is one of the essential inputs when evaluating the remedies for seasonality. This coincides with Oklevik et al.’s (2019) proposition that segmenting the markets by tourists’ price receptions, net income, length of stay, activities, and spending can efficiently reduce the negative consequences of tourism seasonality.
In this study, we investigate the impact on hotels’ survival probabilities of tourism seasonality by market segment, using a standard accounting model that uses financial ratios as control variables. This study is the first one that incorporates the demand variations at the market segment levels to investigate the exit risk of hospitability firms. Considering the different driving forces and seasonality patterns, we categorized tourism market segments by travel purposes such as leisure, business, and conference and course (referred to as “conference,” hereafter). The empirical findings provide support for the industry to take well-designed marketing strategies in different tourism segments to mitigate the consequences of tourism seasonality. For financial ratios, the accounting literature and tourism studies have widely documented how financial ratios reveal financial risk and survival probabilities (Altman & Hotchkiss, 2005; Kim & Gu, 2006; Maté-Sánchez-Val, 2020).
Norwegian tourism is a useful case study to fulfill our research purpose as Norway is particularly marked by seasonal variations due to its geographical location. The sample period spans from 2008 to 2018. In 2018, the number of tourists traveling around Norway was 14.7 million, about three times the population of Norway, indicating the importance of the tourism industry and the potential negative impact of demand variations. The hotel market has, however, becoming increasingly competitive. During the sample period, there were 104 bankruptcies. 1 The empirical question is whether seasonality and financial ratios explain the business failure in the Norwegian hotel industry.
The article is organized as follows: The second section describes the Norwegian tourism industry, followed by the third section, which details the data presentation and research methods. After this, the fourth section reports and interprets the empirical results, and the fifth section discusses the empirical findings and their implications. The study concludes with a summary and implications in the last section.
Background
Norway is well known for its spectacular sceneries throughout each season. Many tourists associate Norway with fjords, the midnight sun, northern lights, and exciting city life, culture, and history (Innovation Norway, 2017, 2018). The Norwegian fjords were added to the UNESCO World Heritage list in 2004. Disney’s aminated movie Frozen and the TV series Vikings have successfully promoted Norway as an exotic destination for snow, mountains, Vikings, and fjords (Metcalf et al., 2015; Oklevik et al., 2019; Prebensen, 2007).
However, tourism demand for Norwegian attractiveness is primarily concentrated in summer, with tourists focusing on visiting popular summer attractions (Oklevik et al., 2019; Tkaczynski et al., 2015). Accordingly, Innovation Norway has been promoting Norway’s winter activities in the global market. 2 As a result of growing wintertime interest, the government has been pursuing campaigns for year-round tourism of fjord areas, especially in the leisure market segment (Oklevik et al., 2019).
The business and conference market segments depend on economic activities and business cycles. As the oil industry dominates the Norwegian economy, economic activities are sensitive to oil price changes. As of mid-2013, the oil price collapse has had a tremendously negative impact on economic activities, which has further reduced travel for businesses and conferences. The reduction in economic activity caused further depreciation of the Norwegian currency. However, the weakened currency improved the country’s price competitiveness compared to other destinations. Tourism became cheaper for inbound tourists, while it was more expensive for Norwegians to travel abroad. The different responses of various tourism market segments to the economic factors indicate their various patterns of demand variations.
According to Statistics Norway (2019), overnight hotel guest stays in Norway increased from 18.2 million to 25.48 million between 2008 and 2018, a growth of 39.8%. 3 As seen in Supplement Table 1 (available online), in 2018, the share of tourist overnight stays by travel purpose was 50.8% for leisure travel, 37.2% for business travel, and 12.0% for conference travel. These statistical analyses suggest a constant upward trend in the leisure tourism segment. Between 2008 and 2018, overnight stays of tourists for leisure increased by 54.9%, while they increased by 31.0% for business tourists and 16.2% for conference travel. This coincides with Xie and Tveteraas’s (2020) findings that the weakened Norwegian currency caused by the oil price collapse has made Norway more attractive as an international destination for leisure tourists.
Although Norway’s market size of tourism is large, relative to its population, its overdependence on oil and the 2008 financial crisis have made the hotel industry increasingly risky. Supplement Table 2 (available online) shows that, between 2008 and 2018, there were 104 bankruptcies. In terms of the percentage of failed hotels out of the number of surviving hotels, 2009 saw the greatest proportion of bankruptcy cases, with a value of 4.52%. After this, the share of failed hotels had a downward trend until 2014.
Supplement Figure 1 (available online) illustrates the average monthly overnight tourist stays by travel purpose. For leisure travel, the peak season is from June to August, which accounts for 46.1% of annual leisure tourist overnight stays. For the conference and business sectors, the period from June to August only accounts for 20.34% and 27.5% of tourist overnight stays, respectively. While there is no obvious peak season for business travel, the peak season for the conference segment is from September to November. This is related to the driving forces behind individual tourism segments. Many of the international leisure tourists visit Norway’s most popular attractions in summer since their travel dates are subject to their holiday calendars and the Norwegian climate conditions (Prebensen, 2007; Tkaczynski et al., 2015). The peak season from June to August for leisure tourists is echoed by the off-peak in the same period for travel for businesses and conferences. Except for the peak season, the degree of fluctuations in tourist arrivals for conferences is close to that of business tourists, which are both more stable than the leisure segment.
Data and Methods
Data
All Norwegian-registered hotel firms are required to submit their annual financial reports to the Brønnøysund Register Center, 4 which provided hotel firms’ accounting data from 2008 to 2018, for a total of 4,622 firm-years. The data on monthly hotel guest overnight stays by province for the same period are from Statistics Norway (2019). Combining the calculated seasonality measures by province and year with the annual accounting variables yields the data set for the empirical analysis.
Measuring Seasonality
Researchers have applied various approaches to measure tourism seasonality. Among them, the Gini index is the most common measure used in tourism literature (Duro & Turrión-Prats, 2019; Falk & Hagsten, 2018; Fernández-Morales et al., 2016). The Gini index accounts for the skewness of the distribution and is less affected by extreme values (Cisneros-Martínez & Fernández-Morales, 2015). However, the Gini index gives more weight to observations near the mean (Duro & Turrión-Prats, 2019). Another measure is the coefficient of variations (CV), which is insensitive to the place where demand variations happen (Turrión-Prats & Duro, 2018). Lado-Sestayo et al. (2016) applied variance of average annual occupancy in the tourist destination as a proxy of seasonality and tested the impact of seasonality on hotel firms’ survival probabilities. Recently, Falk and Hagsten (2018) and Sainaghi and Mauri (2018) used the Gini index to examine the impacts of seasonal demand on hotel operational and organizational performance. In this study, we used both the Gini and CV measures to represent seasonal demand changes for tourism market segments and evaluated whether the impact of seasonality on hotels’ survival probabilities depends on the measure of seasonality.
The Gini index (
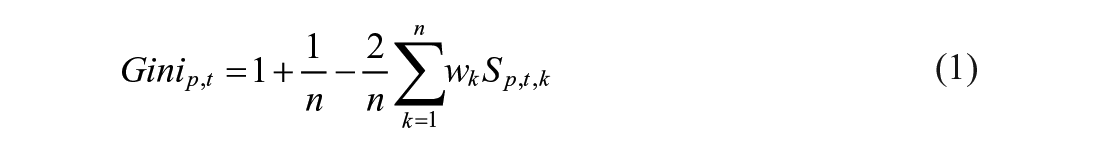
where n is the number of observations (= 12 for our monthly data).
The CV is defined as the ratio of the standard deviation (SD) to the mean of the hotel guest overnight stays for p province in year t:

To illustrate the change in seasonal concentration over the years, we plotted the Gini and CV seasonality indices in Supplement Figure 2 (available online). For each tourism segment, the magnitude of the Gini index is much smaller than the corresponding CV. For each of the two measures, the leisure tourism segment has the greatest seasonal demand, followed by the conference and business segments, which is in line with the changes in the average monthly number of guest hotel overnight stays by travel purpose (see Supplement Figure 1 [available online]). The leisure segment is more seasonal compared with the business and conference segments since holiday travel is more subject to institutional patterns, such as school or calendar holidays. Regardless of the measure of seasonality, the leisure tourism segment experienced the greatest demand fluctuations, while conference tourism had the smallest market share and a moderate level of demand fluctuations. The business segment has a moderate market size and the most stable demand.
Supplement Figure 2 (available online) further shows that the degree of seasonality for the leisure segment has been mitigated in recent years. However, this segment has the highest level of seasonal demand variations during the sample period. In contrast, the business and conference segments have become more volatile, with a record in 2017 for the two measures of seasonality.
Bankruptcies Versus Seasonality
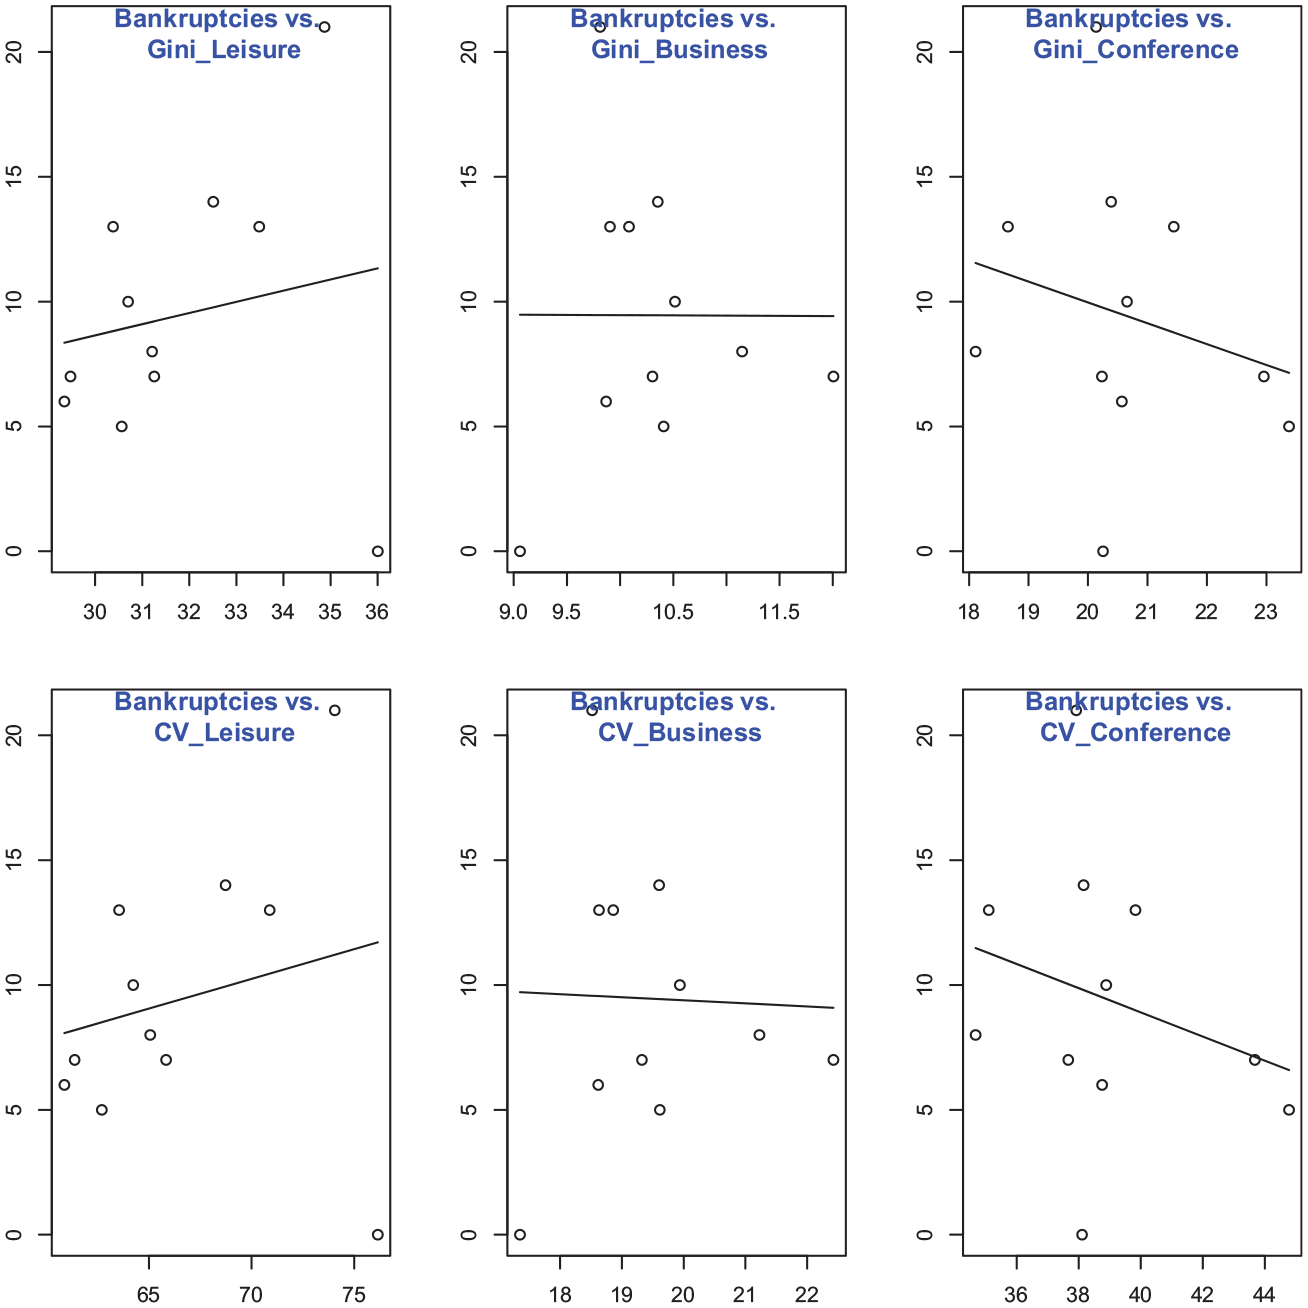
Figure 1 illustrates the number of failed hotels against the measures of seasonality by tourism segment for both the Gini index and CV. The plots inform an initial idea about the correlation between seasonality and the exit risk. For either the Gini index or CV, demand variations in the leisure segment have a positive correlation with the number of bankruptcies; the opposite is true for the conference segment. It seems there is no correlation between the demand changes in the business segment and bankruptcy. The empirical issue is how to separate the impact of seasonality on the exit risk after controlling for other factors, such as financial ratios, which, together with seasonality, jointly affect the survival probabilities of hotels.
Seasonality and Bankruptcies
Econometric Model
In this study, we applied a duration analysis approach to fulfill the research purpose. The duration analysis comprises a survival function and a model for estimating the hazard rate on the explanatory variables. As shown later, the hazard rate takes account of all available information over time. This gives the hazard model an advantage compared to other single-period and static models (Falk & Hagsten, 2018; Shumway, 2001; Vivel-Búa et al., 2019).
Duration analysis starts with the measures of the survival probability and hazard rate:

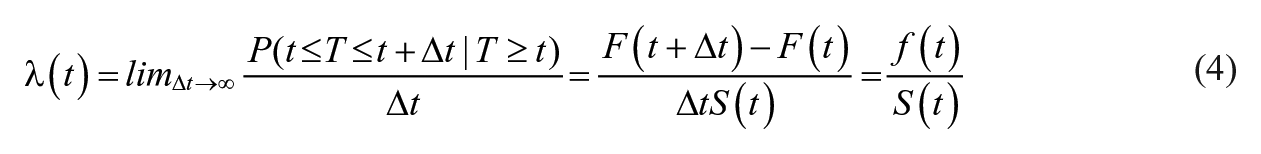
where S(t) is the probability of a hotel survival not shorter than t;
After deriving the hazard rates, the Cox proportional hazard model (Cox, 1992) is further applied to explore how the covariates affect the hazard rate. The Cox model assumes a proportional relationship between the baseline hazard rate and the hazard rate as a result of changes in a covariate of interest. As such, it is not necessary to specify the baseline hazard. As indicated by Equations (3) and (4), if a covariate increases the hazard rate, this covariate therefore has a negative impact on the survival probability. The Cox model is in the form:

where
Although previous studies suggest that financial indicators are the best predictors of business failure (Maté-Sánchez-Val, 2020), the choices of financial indicators vary. Li et al. (2018) followed Olsen et al. (1983) and used six financial ratios to identify the failed hospitality businesses. Li and Sun (2012) used Altman’s (Altman & Hotchkiss, 2005) five financial ratios to forecast the tourism hotel failure. In this study, we used Altman’s five financial ratios, as the potential determinants of bankruptcy. Those financial ratios represent different aspects of capital structure and financial status and are helpful in forecasting hospitality firm failure (Atiya, 2001; Li & Sun, 2012). This gives rise to:
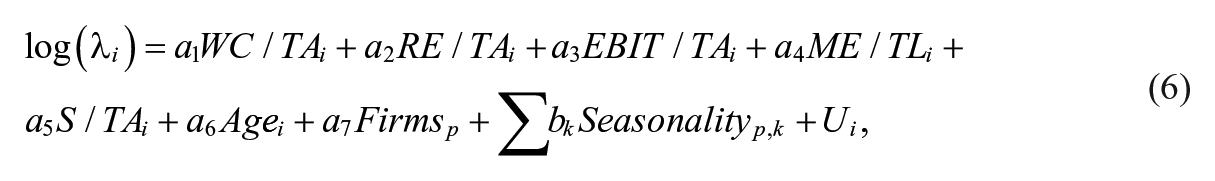
where U is the error term. According to the measure of seasonality, we estimated four models, namely, Model A for Gini-Overall, Model B for Gini-Leisure, Gini-Business, and Gini-Conference, Model C for CV-Overall, and Model D for CV-Leisure, CV-Business, and CV-Conference.
For control variables, WC/TA = working capital to total assets; RE/TA = retained earnings to total assets; EBIT/TA = earnings before interest and taxes to total assets; ME/TL = market value equity to total liabilities; S/TA = sales to total assets. Due to data availability, we used book value equity as a proxy of market value equity to calculate ME/TL. Additionally, firm age (Age) is included in the model to capture the difference in the exit risk between the young and older hotels. Young firms need to build up capital or cumulative earnings, generating uncertainty in the process and then facing a high exit rate (Golombek & Raknerud, 2018). The number of firms (Firms) measures the level of competition for the province p where firm
The exponential of a parameter represents the ratio of the hazard rate (in response to one unit change in the corresponding covariate) to the baseline hazard. For example, the exponential of
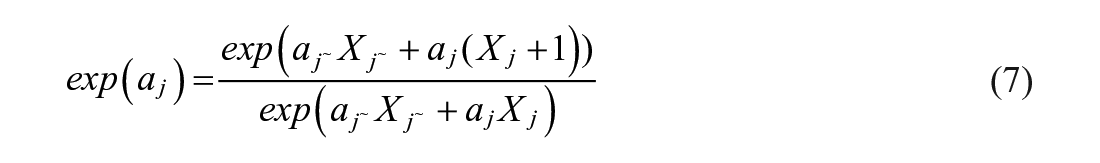
where
The definitions of variables used in the Cox model and their descriptive statistics are presented in Supplement Table 3 (available online). For the whole sample, the mean of WC/TA (and hence working capital) is negative, indicating that the hospitality industry has lower liquidity, in line with high financial leverage (the inverse of ME/TL, which is about 0.33).
Supplement Table 4 (available online) presents the pairwise correlation between the variables incorporated in the model specification. As shown in the top-left part of the table, the correlation coefficients of the financial ratios are generally smaller than .5, with the exception of two coefficients, which are slightly greater than .5. A low correlation between the financial ratios indicates that those variables reflect the overall financial status and performance from different angles. The bottom-right part shows correlations between the two seasonality measures for the three tourism segments as well as the whole market. For a particular segment (and the whole market), the coefficient of correlation between the Gini and CV indicators is very high, although their values are substantially different, as shown in Supplement Figure 2 (available online). For the Gini index, the coefficients of correlation between the three segments range between .24 and .34; for the CV, the values range between .22 and .38. The small degree of the positive correlation between the seasonality of the individual segments indicates a lower level of seasonality in the whole market.
Empirical Results
This section starts with the test results for mean differences of variables for the surviving hotels and failed hotels. Afterward, we reported the estimation results of the survival function and the Cox model regressions.
Univariate t Tests. Supplement Table 5 (available online) displays the results of mean difference testing for financial ratios and firm age of surviving hotels and bankruptcies. The t-static values imply that all the mean differences are significant, indicating the heterogeneity of surviving hotels and bankruptcies. Except for S/TA, all financial ratios for the surviving hotels are greater than those of the failed hotels, indicating that good financial performance and liquidity probably reduce the exit risk. Failed hotels have a greater S/TA than surviving hotels, which may be attributed to the small size of their total assets. The average age of the surviving hotels is much higher than the failed hotels (2.84 vs. 1.60, on the logarithmic scale). The operational experience and cumulated earnings of the hotels with long histories successfully extend longevity.
Estimation of the survival function. The fundamental element of the hazard rate in the Cox model is the survival function, which is modeled as a sequence of conditional probabilities that hotels will survive beyond year t, given they have already existed in the market for t years. Like other data sets used in duration analysis, our data set contains censored observations. Some hotels were established before the sample period and some hotels are still in the market after the sample period. For censored data, the Kaplan-Meier method is commonly used to estimate the robust probabilities of the survival function. The value of the survival function is one in the base year, then falls as some hotels went bankrupt. Supplement Figure 3 (available online) presents the estimated survival curve.
Inspection of Supplement Figure 3 (available online) shows that the survival probability starts at 100% since there were no bankruptcy cases in 2008. Afterward, the value of the survival function falls as some hotels went bankrupt. The value dropped sharply to 90% in 2011, and since then, the estimated curve has been relatively flat. This is also evidenced at the end of the sample period, where the survival probability is still 82% in 2018. In the later period, 2015 saw the greatest reduction in the survival probability (about 3%), which may be attributed to the increased price competitiveness, as discussed above.
Estimation of the Cox model. Tables 1, 2, 3, and 4 reports the estimation results of the Cox models. For each model, there are three regressions, namely, Regression 1 only with financial ratios, Regression 2 with additional variables for firm age and the number of firms, and Regression 3 with further seasonality. For the four models, Regressions 1 and 2 are the same, which are used to compare with the different Regression 3. For all regressions, both the loglikelihood ratio test results and the Wald test results indicate the joint significance of all the explanatory variables. For each model, the regression with more variables has a greater R2 value than regressions with fewer variables. For Models B and D, the F-test results indicate the joint significance of the separate seasonality measures. As such, we are to discuss the estimation results of Regression 3 for each model. As noted above, if the coefficient in the Cox regressions is positive (i.e., the corresponding exponential is greater than 1), changes in the variable raise the hazard rate, holding the influence of all other variables constant. Hence, the reported significance levels are for the null hypothesis that the reported parameter is zero, and equally, the corresponding exponential of the parameter is one.
Estimation Results of Model A
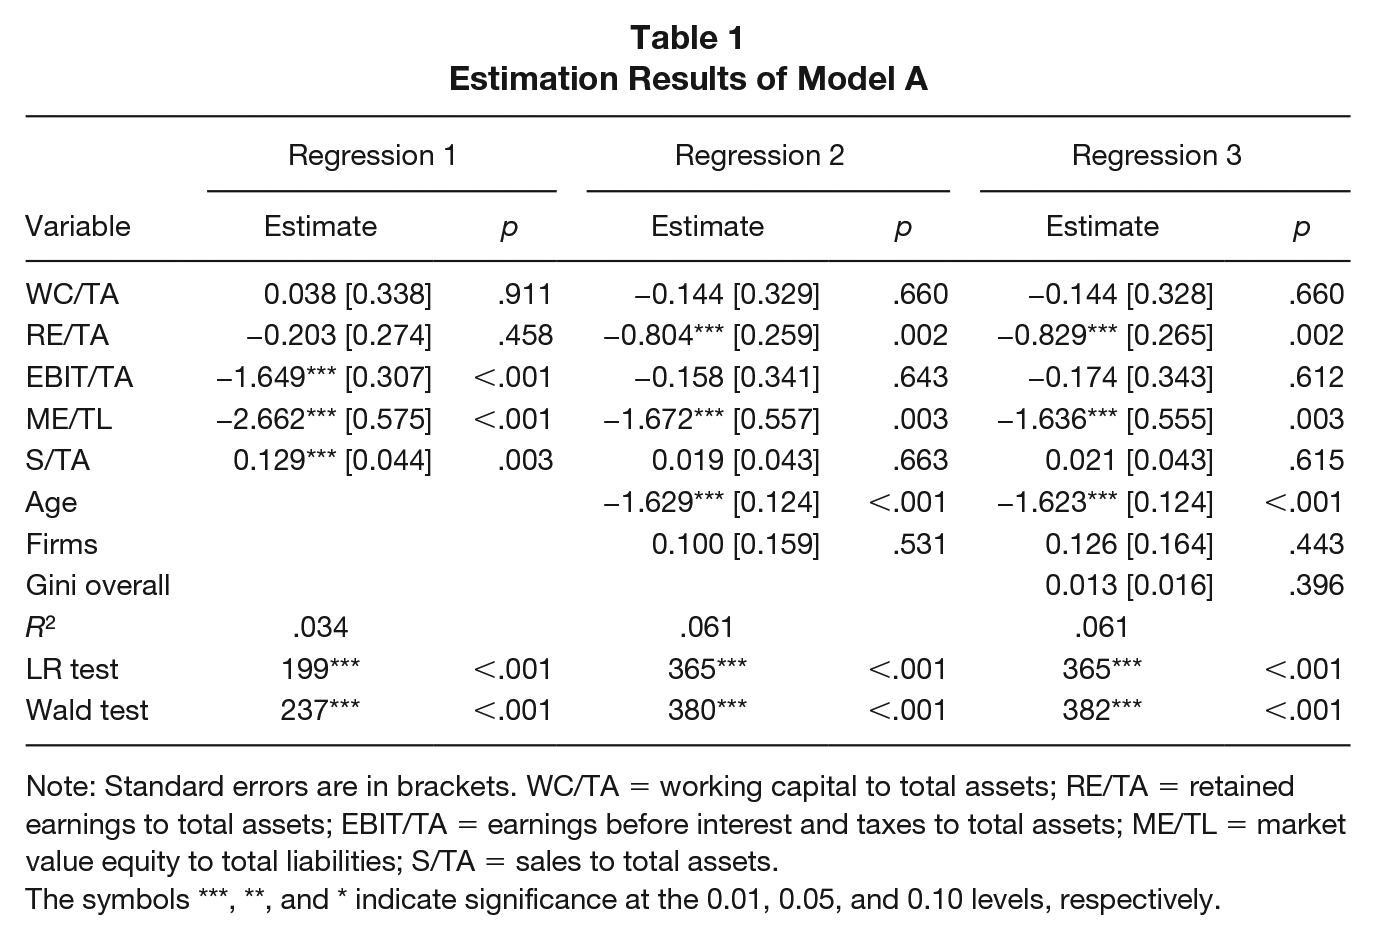
Note: Standard errors are in brackets. WC/TA = working capital to total assets; RE/TA = retained earnings to total assets; EBIT/TA = earnings before interest and taxes to total assets; ME/TL = market value equity to total liabilities; S/TA = sales to total assets.
The symbols ***, **, and * indicate significance at the 0.01, 0.05, and 0.10 levels, respectively.
Estimation Results of Model B
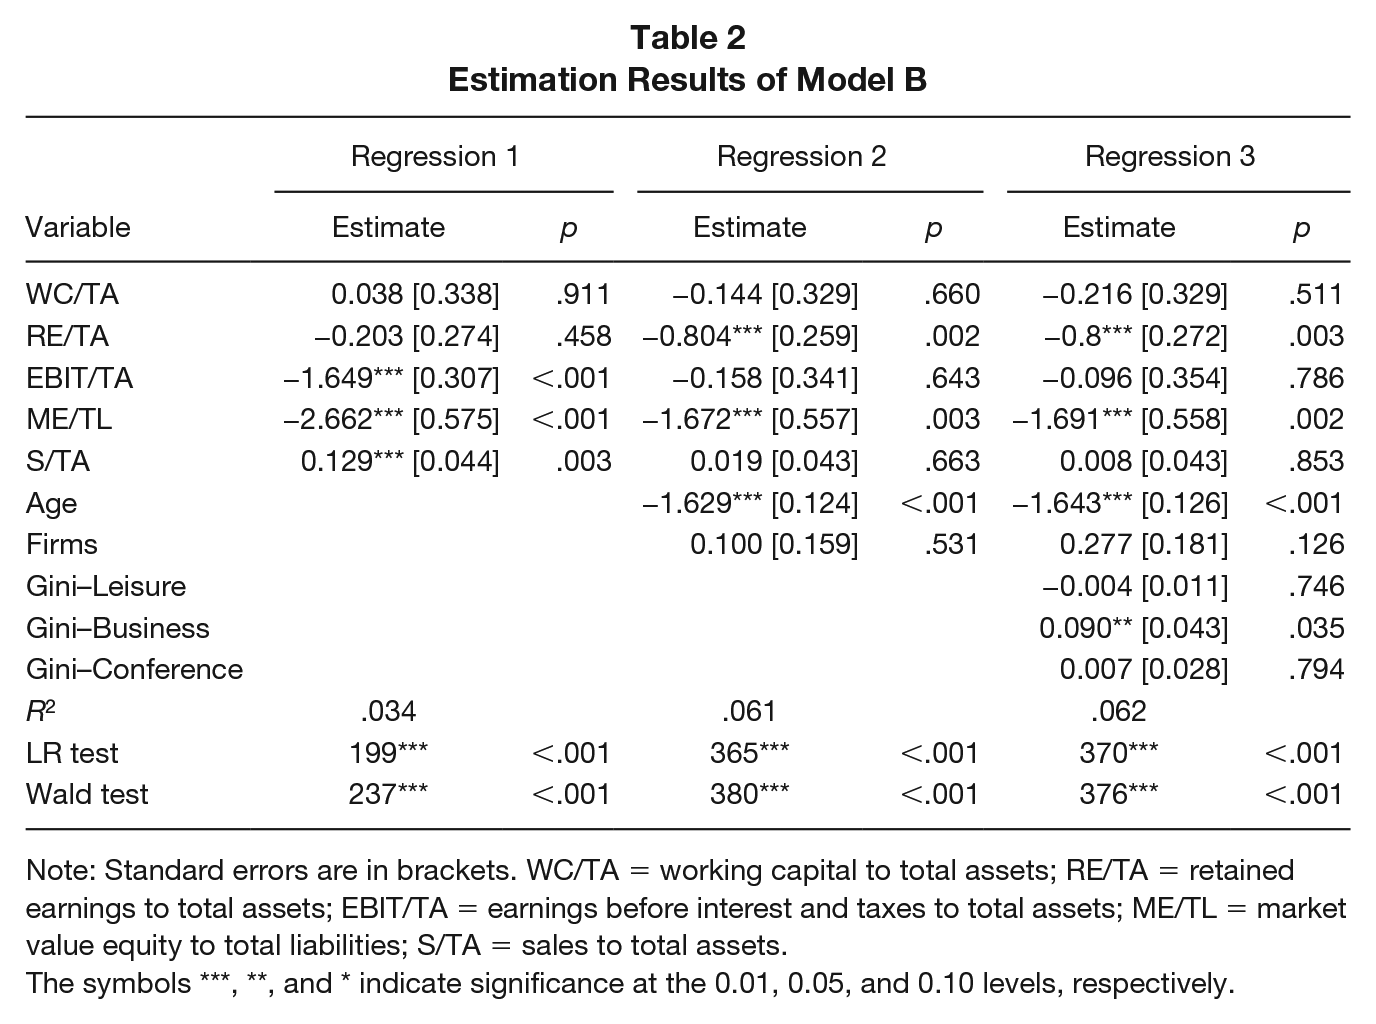
Note: Standard errors are in brackets. WC/TA = working capital to total assets; RE/TA = retained earnings to total assets; EBIT/TA = earnings before interest and taxes to total assets; ME/TL = market value equity to total liabilities; S/TA = sales to total assets.
The symbols ***, **, and * indicate significance at the 0.01, 0.05, and 0.10 levels, respectively.
Estimation Results of Model C
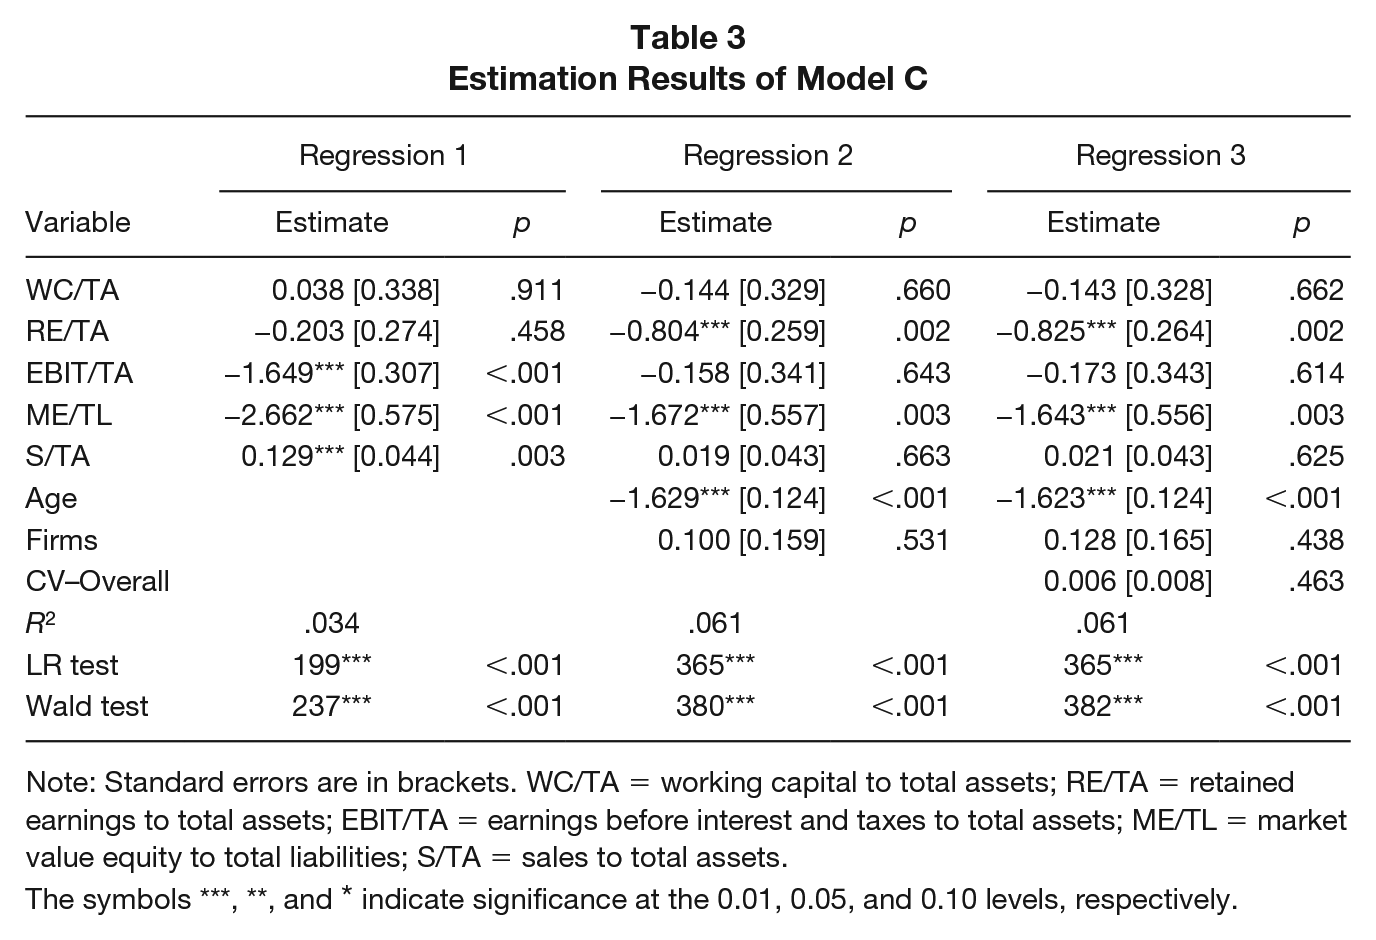
Note: Standard errors are in brackets. WC/TA = working capital to total assets; RE/TA = retained earnings to total assets; EBIT/TA = earnings before interest and taxes to total assets; ME/TL = market value equity to total liabilities; S/TA = sales to total assets.
The symbols ***, **, and * indicate significance at the 0.01, 0.05, and 0.10 levels, respectively.
Estimation Results of Model D
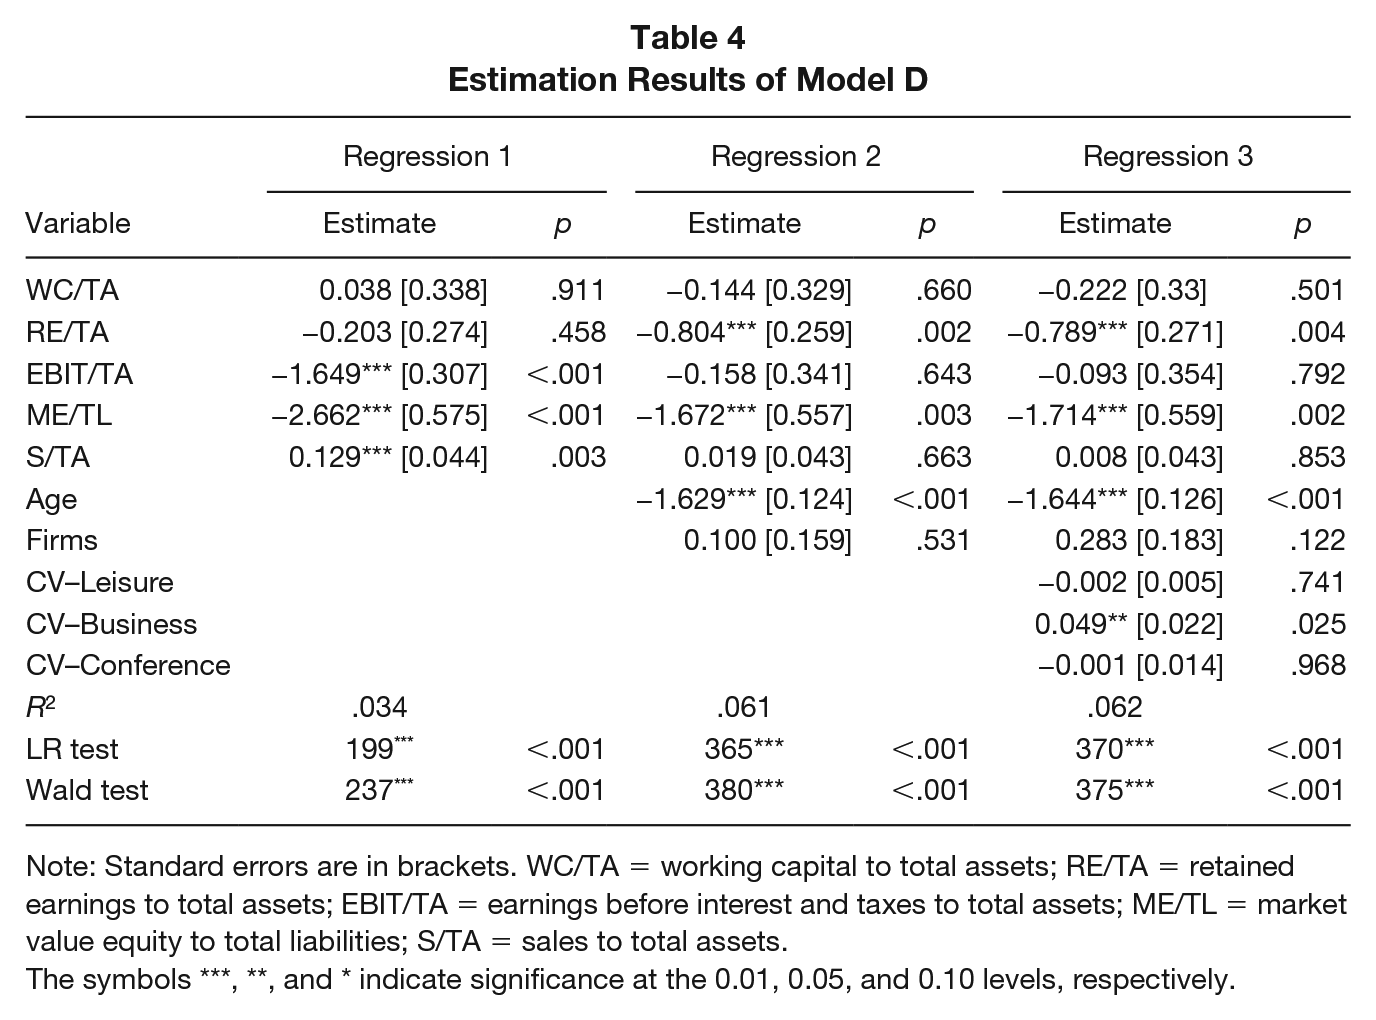
Note: Standard errors are in brackets. WC/TA = working capital to total assets; RE/TA = retained earnings to total assets; EBIT/TA = earnings before interest and taxes to total assets; ME/TL = market value equity to total liabilities; S/TA = sales to total assets.
The symbols ***, **, and * indicate significance at the 0.01, 0.05, and 0.10 levels, respectively.
For Model A (in Table 1, the estimation results of Regression 3 indicate that the coefficient of the overall seasonality is insignificant. This finding supports the hypothesis that the seasonality for the whole market does not affect the exit risk of hotels, regardless of the measures of seasonality. As shown in Supplement Table 1 and Supplement Figure 1 (available online), the two primary tourism segments, the leisure and business markets, have roughly opposite patterns of seasonality. The peak season for the leisure market is exactly the off-peak season for the business market. The different seasonality patterns in those two tourism segments mitigate the overall seasonal fluctuations, resulting in the lack of a connection between the overall seasonality and hotels’ success or failure.
As one sees in Table 2, for Regression 3 of Model B, Gini–Leisure and Gini–Conference are not significant, while Gini–Business is significant. Even though the leisure market is the largest segment, there is no impact of its seasonality on the exit risk, which may be attributed to its predictable seasonal pattern. The driving forces behind the demand variations in leisure tourism are climate and institutional characteristics, which do not differ significantly over the years. As such, the seasonal pattern of the demand in the leisure segment is relatively predictable. Operating strategies in response to the predictable seasonality may mitigate the consequences of the seasonality. The null impact of the seasonality in the conference segment is probably due to the small market share of this segment. Among the three segments, the business segment stays in the second position and has a moderate level of demand variations. This segment is more sensitive to economic activities and business cycles, resulting in a less predictable seasonality. The less predictable seasonal demand and high spending of the business segment explain the positive and significant coefficient of Gini–Business. The exponential of the coefficient of Gini–Business is about 1.094, indicating that the baseline hazard rate increases by 9.4% in response to a 1% increase in the Gini seasonal concentration indicator of the business segment. For Model C (in Table 3), the estimation results of Regression 3 indicate that the coefficient of the overall seasonality is insignificant.
As seen in Table 4, for Regression 3 of Model D, only CV–Business is significant, the same as the results of Model B. The coefficient of CV–Business is 0.049, with the corresponding exponential at the value of 1.050. A 1% increase in the CV of the tourist arrivals in the business segment would raise the baseline hazard rate by 5%. The impact of CV–Business on the exit risk is about half the impact of Gini–Business. However, the mean of CV–Business is two times the mean of Gini–Business. Thus, taking their means into account, CV–Business and Gini–Business have a similar role in the business success or failure of hotels.
For financial ratios, the estimation results in Regression 3 for the four models do not differ much. RE/TA and ME/TL are significant and negative, indicating that better-retained earnings and lower financial leverage reduce hotels’ exit risk. The coefficient of EBIT/TA is insignificant, indicating that cumulated profitability (RE/TA) is a more relevant predictor than current profitability when predicting bankruptcy. As we used equity value to calculate ME/TL, a high ME/TL means lower financial leverage, which implies a lower probability of insolvency. The size of working capital relative to total assets (WC/TA) is not associated with the probability of bankruptcy. The insignificant coefficient of S/TA is consistent with the statistic feature of the variable. As shown in Supplement Table 5 (available online), failed hotels even have higher sales relative to total assets than surviving hotels. One possible explanation is that the total assets of failed hotels are relatively small.
The coefficient of Age is significant in all the regressions. A relatively young hotel needs time to build up its cumulative earnings or form good connections with customers or financial institutions. Thus, like firms in other industries, young hotels are more likely to be classified as bankrupt than their counterparts, older hotels. A large number of hotels (Firms) in a province do not influence the probability of insolvency of hotels in that province. While the number of hotels is an indicator of the level of competition, firm performance is probably better for hotels within the clusters due to the spillover effect of knowledge, management, innovative activities, and market size. The two opposite impacts of clustering on firm performance lead to an insignificant impact of Firms on the hazard rate.
Discussion
Tourism seasonality reflects the variations in tourist arrivals due to natural attractions, institutional systems, economic development, and business cycles. It is well recognized that tourism seasonality influences sustainable tourism worldwide. Many studies have investigated the negative effects of seasonality on sustainable tourism development in terms of both environment and culture. In addition, a large body of research has evaluated the impact of tourism seasonality on hotels’ operational and financial performance, which further affects hotels’ competitive advantage and exit risk. Financial performance and competitive advantage are the key factors influencing the sustainable development of the tourism industry since hotels with poor financial performance or facing exit risk have lower motivation and limited capacity to engage in sustainable practices.
Duration analysis is a useful tool for estimating the determinants of the exit risk. This analysis comprises the survival function and a Cox proportional model for testing how seasonality and other financial ratios, which are the potential determinants of bankruptcy (Altman & Hotchkiss, 2005), impact the hazard ratio. This article contributes to the hotel bankruptcy literature by working on seasonality by tourism segment rather than the overall tourism seasonality. To the best of the authors’ knowledge, few studies have separated the overall tourism seasonality into seasonal demand changes by tourism segment. This is a relevant issue, since the different patterns of seasonal demand by each of the tourism segments may offset each other in the aggregate measure, resulting in the previous studies’ ambiguous empirical findings regarding the impact of the seasonality on bankruptcies. Additionally, the different impacts of the demand variations of each of the tourism segments provide implications for governments, the hotel industry, and individual hotels regarding taking appropriate strategies to mitigate the negative impact of seasonality on financial performance, competitive advantage, and hotels’ longevity.
For our case study, the data analysis first suggests that the leisure tourism segment has the greatest degree of demand fluctuations, followed by the business and conference segments. In addition, the peak season of the leisure segment is echoed by the off-peak for the conference and business segments, indicating the smoothed seasonal variations of the whole market. Heterogeneity between the tourism segments is further reflected in the measures of seasonality. The leisure segment has the greatest seasonal demand variability in terms of both the Gini index and CV, among the three segments over the years. During the sample period, the seasonal patterns of the three tourism segments differ from each other. Most notably, the differences in monthly variations and annual seasonality measures of the three tourism segments indicate their different roles in hotel’ survival probabilities.
The key findings of the estimation results of the Cox model regressions are as follows. First, the overall seasonality of the tourism market does not influence the exit risk, regardless of the measures. The complementary seasonality patterns of different tourism segments lead to a less volatile seasonality at the level of the whole market, which explains the insignificant impact of the overall seasonality in this study and in previous studies (Lado-Sestayo et al., 2016; Vivel-Búa et al., 2019).
Second, the impact of seasonality on hotels’ survival varies across tourism segments. While demand fluctuations in the leisure and conference segments do not raise the probability of insolvency, seasonal changes in the business segment do increase this probability. Compared with the leisure segment, the business segment has high spending and is more sensitive to economic activities and business cycles. The less predictable seasonal pattern and the essential contribution to hotels’ revenue make the business segment’s seasonality a good predictor of bankruptcy. Although conference tourism has a similar seasonal pattern to that of business tourism, its relatively small market size explains the insignificant estimate of the seasonal measures of this segment.
Third, hotels with high cumulative earnings and low financial leverage are less likely to exit from the industry. The two financial ratios may also capture the impacts of liquidity and current profit on the survival probabilities since both working capital and EBIT are insignificant. In this respect, our empirical findings are consistent with Kim and Gu (2006) who documented that a lower EBIT and high total liabilities increase the exit risk of restaurant firms. In addition, young hotels are more likely to be classified as bankrupt than older hotels due to low cumulative earnings, among other reasons. For a particular province, the number of firms does not influence the probability of insolvency. This is not unexpected, considering that the number of hotels indicates the level of competition on the one hand and the positive clustering effect on the other.
Conclusions
In this study, we explored the impact of seasonality by tourism segment on hotels’ exit risk, using a case study of the Norwegian hotel industry. The negative impact of tourism seasonality on hotels’ survival probabilities indicates the need to improve operational activities throughout the year. The different impacts of the seasonal demands of tourism segments on the exit risk make it necessary for hotels to consider the features of these segments when devising remedies for seasonality, such as pricing strategies in response to the seasonal demand, market diversification, and new attractions and events. This is in line with Fernández-Morales et al.’s (2016) proposition that the seasonal variations in tourism demand are subject to travel purposes and destinations, which then determines the possibility of using marketing efforts to reduce the consequences of tourism seasonality.
Policy makers and the hotel industry need to implement remedial solutions to the seasonality by considering the tourism segments in regard to the seasonal patterns (and their driving forces), spending, and responses to price changes. The identified efficient tourism segment mix can effectively minimize the negative impact of tourism seasonality on operational and financial performance, which consequently prolongs the lifetime of hotels and further motivates them to implement intensive green practices. Besides the practical implications, the study also contributes to the theory of business failure. As summarized in Falk and Hagsten (2018), efficient firms have higher survival rates than inefficient ones, according to the theory of “Noisy selection.” Tourism seasonality may affect the efficiency of hotel firms and reduce the survival probability. However, hotels with a long history or of large size are more likely to be survivors in the market, according to the population ecology theory (Falk & Hagsten, 2018).
In the end, we would like to discuss limitations and several avenues for future research. The impact of seasonality (and financial ratios) on business failure may vary over time. It would be interesting to use longer time series to test structural changes in the link between seasonality and bankruptcy. In this study, the measure of seasonality is applied to individual markets. For each of the segments, there may exist differences between inbound and local tourism. A promising research area is to test the impact of market segments by travel purpose and tourist origin on exit risk. This can provide detailed insightful implications for designing marketing strategies to reduce tourism seasonality. Regarding research methods, although the duration analysis is the prevalent method for identifying bankruptcies, a comparative study using various methods can further check the predictive power of the covariates. Finally, the current COVID-19 pandemic will have both short-term and long-term effects on the hotel industry. In the short run, the exit risk of hotel firms has increased due to government mandates for safety, such as travel restrictions and cross-border closures. In the long run, the changing travel patterns in the business and leisure segments may continue after the pandemic, which may alter the relationship between seasonality pattern and business failure of hotel firms, suggesting the direction of future research.
Supplemental Material
sj-pdf-1-jht-10.1177_10963480211016038 – Supplemental material for Influence of Tourism Seasonality and Financial Ratios on Hotels’ Exit Risk
Supplemental material, sj-pdf-1-jht-10.1177_10963480211016038 for Influence of Tourism Seasonality and Financial Ratios on Hotels’ Exit Risk by Dengjun Zhang and Jinghua Xie in Journal of Hospitality & Tourism Research
Footnotes
Supplemental Material
Supplemental material for this article is available online.
Notes
References
Supplementary Material
Please find the following supplemental material available below.
For Open Access articles published under a Creative Commons License, all supplemental material carries the same license as the article it is associated with.
For non-Open Access articles published, all supplemental material carries a non-exclusive license, and permission requests for re-use of supplemental material or any part of supplemental material shall be sent directly to the copyright owner as specified in the copyright notice associated with the article.