
Abstract
Retail media is of growing interest to brands, and online retailers offer a large collection of product information that is freely available for consumers’ online and offline purchase decisions. In this study, the authors map webrooming across ten product categories by combining internal data from consumer browsing behavior at an online retailer and survey responses from the same customers about their offsite behavior. Moreover, they build a random forest machine-learning model to predict the magnitude of webrooming across categories. They find that webrooming is economically substantial. On average, for every 10 customers who research the product category on-site and buy on-site, 17 other customers research the product category on-site and buy off-site. As to retail media's impact, upper-funnel and always-on online ad forms are associated with a higher number of online searchers in the laptop category who buy the brand offline. Beyond finding support for their propositions, the authors provide directions for future research on the cross-channel effects of retail media and how they generalize across brands, categories, and retailers.
Keywords
Driving revenue through retail media advertising requires a strong focus on a full-funnel strategy that addresses all components of a consumer's buying journey. (Gees 2023, p. 358)
Beyond their role as distribution channels for purchasing products, retail websites offer a large collection of product information, reviews, prices, and similar information that is freely available 24/7. Customers often use the on-site product details to inform their purchase decisions, even if they end up purchasing elsewhere (Ghimire 2022). We use the term “on-site research” to denote products consumers search for on a retail website but purchase elsewhere (i.e., off-site). Currently, many brands and advertisers focus their marketing efforts on retail websites to drive on-site purchases. Indeed, retail media is on the rise, reaching $125.7 billion in 2023 and expected to surpass television in 2028, when it will represent 15.4% of total ad revenue (Davey 2023). Amazon, Instacart, Kroger, Target, and Walmart are key U.S. players in this arena. However, a sole focus on same-channel conversion may cause brands to miss opportunities to support customers who are researching on-site for subsequent off-site purchases with appropriate marketing and advertising actions. Quantifying the magnitude of the off-site purchase behavior can help brands account for the impact of their presence on retail websites in terms of on- and off-site purchases and use these insights for media allocation and planning decisions.
Several studies have investigated consumers’ multichannel behaviors of researching online and purchasing offline (i.e., “webrooming”; e.g., Arora and Sahney 2017) as well as the reverse behavior of showrooming, which refers to researching offline and purchasing online (e.g., Gensler, Neslin, and Verhoef 2017). Recent studies show that webrooming is practiced by a majority of consumers and is more prevalent than showrooming (Guo, Zhang, and Wang 2022; Osbourne 2022). Previous literature has also shed light on the reasons consumers like to search for products online, including because it narrows down their choices (Wolny and Charoensukasai 2014), they negotiate well in physical stores (Verhoef, Neslin, and Vroomen 2007), and in general due to interchannel synergy between internet search and in-store purchase (Guo, Zhang, and Wang 2022; Valentini, Montaguti, and Neslin 2011). These effects may highlight causal (Montaguti, Neslin, and Valentini 2016) or merely purchase funnel progress aspects of multichannel behavior. Furthermore, evidence shows that a multichannel presence and promotion can improve the overall ad effect (e.g., Abdelmaged 2021; Blom, Lange, and Hess 2017). In field experiments, Johnson, Lewis, and Reiley (2017) find that online display retail ads increased off-site sales of a brand, while Montaguti, Neslin, and Valentini (2016) find that a multichannel message not coupled with coupons produces the most multichannel customers and increases profits. Online research could also influence decision making in a customer journey. For example, Flavián, Gurrea, and Orus (2019) examine the perceptions and feelings of customers who use online and physical channels (i.e., webrooming and showrooming) in the fashion industry. They find that webroomers had greater perceptions of time/effort savings and of making the right purchase, felt smarter about their shopping behavior, and felt more responsible and in control of their purchase outcomes than showroomers. Likewise, Flavián, Gurrea, and Orus (2021) find that for electronics products, online reviews posted by anonymous customers were even more influential than friends’ opinions, whereas for fashion accessories, it was the other way around. Similarly, in two experimental studies Orus, Gurrea, and Ibáñez-Sánchez (2019) show that webrooming improves customers’ shopping experience in terms of product choice and choice confidence. However, little is known about the magnitude of webrooming and the relationship between on-site search and purchase and off-site purchase across products and product categories, particularly at the individual brand level. In addition, no research has studied the effect of retail media ads on webrooming behavior. Therefore, our research objectives are to (1) quantify webrooming at the brand level, (2) explore its potential drivers in retail media marketing, and (3) demonstrate the effects of different retail media forms on brand webrooming.
To achieve these objectives, we leverage unique clickstream data from one of the largest retail websites, matched with survey data of more than 40,000 retail customers with respect to their off-site purchases. We measure webrooming by research on-site, purchase elsewhere share (ROPES), or the share of off-site buyers of a brand who researched on-site. As an easy-to-interpret measure for brand managers, we also discuss the amplifier ratio (AR), or the ratio of off-site to on-site purchases among on-site category visitors. We calculate these measures across ten product categories to explore differences in channel choice based on product type (Ansari, Mela, and Neslin 2008; Guo, Zhang, and Wang 2022). We find that webrooming is economically substantial, with ROPES varying from 11% to 21%, and an AR of 1.7 on average across product categories. This means that for every 10 customers who research the product category on-site and buy on-site, 17 other customers research the product category on-site and buy off-site. We then build a random forest machine-learning (ML) model to predict off-site purchase shares from on-site clickstream behavior. Our random forest model to quantify ROPES achieves a high level of accuracy for out-of-sample product categories, out-of-sample products, and out-of-sample time periods.
We next focus on a particular category, laptops, and show how ROPES can help advertisers make informed ad decisions to drive off-site sales (e.g., using ad products commonly differentiated in retail media). We find that the effect of on-site advertising on off-site purchases ranges from 16% to 44% from the overall effect of ad products on both on and off-site purchases across different ad products and brands. Consistent with our propositions, we report stronger webrooming effects for retail media ad products that (1) target the upper funnel and (2) are always on. Our directions for future research explore the boundary conditions of these findings and their generalizability across brands, product categories, and online retailers.
Research Context
Our study fits in the larger field of omnichannel research, which has seen many developments over recent years (for recent reviews, see Liu, Lobschat, and Verhoef [2018] and Verhoef [2021]). While the original focus was on showrooming (i.e., searching offline and buying online), both industry reports (Sopadjieva, Dholakia, and Benjamin 2017) and academic research (De Keyser, Schepers, and Konuş 2015; Konuş, Verhoef, and Neslin 2008) failed to find a showrooming segment in the consumer population. Instead, webrooming (online-to-offline, originally called “research shopping”) is more prevalent than showrooming (Verhoef, Neslin, and Vroomen 2007). The online-to-offline shopper segment is substantial and growing. Herhausen et al. (2019) found that the online-to-offline shopper segment increased from 20% to 26% between 2013 and 2016. Consumers in this segment are more involved, have a longer journey duration and more online experience, and spend more than customers who stay in the offline channel (Herhausen et al. 2019). Several industry reports confirm the importance of webrooming behavior in the United States, Europe, and Asia (BusinessToday 2019; Kleinlercher et al. 2020). A survey of 2,000 shoppers showed that 74% of U.S. and U.K. consumers engage in webrooming behavior, predominantly for electronics, clothing, and household goods (JRNI 2019). Likewise, in Switzerland, webrooming is more common among customers than showrooming (Fuhrer and Hotz 2018).
Kleinlercher et al. (2020) note that “only a few empirical studies have managed to shed light on the [webrooming] phenomenon.” Among these, Flavián, Gurrea, and Orus (2020) actively manipulate showrooming and webrooming behavior in an online experiment to assess the influence of these two research shopping behaviors on the customer experience. Consumers perceive webrooming to save more time and effort and to help them make the right purchase decision. Furthermore, the authors find that webrooming behavior is perceived to produce higher levels of control and responsibility among customers than showrooming behavior. A conceptual study by Arora and Sahney (2017) integrates the theory of planned behavior and the technology acceptance model to derive propositions on potential drivers of webrooming, such as perceived ease of online search and lack of trust in purchasing online. Viejo Fernández, Sanzo Pérez, and Vásquez-Casielles (2018) examine more than 4,000 customer journeys and find that product attributes are more important for the purchase decision for webroomers than they are for showroomers. Furthermore, they find that most webroomers travel to the physical store with extensive knowledge on the product and its features and with an already precise idea of what they want. Table 1 summarizes the empirical literatures on webrooming, omnichannel marketing, and retail media.
Study Positioning in the Webrooming, Multichannel Marketing, and Retail Media Literature.
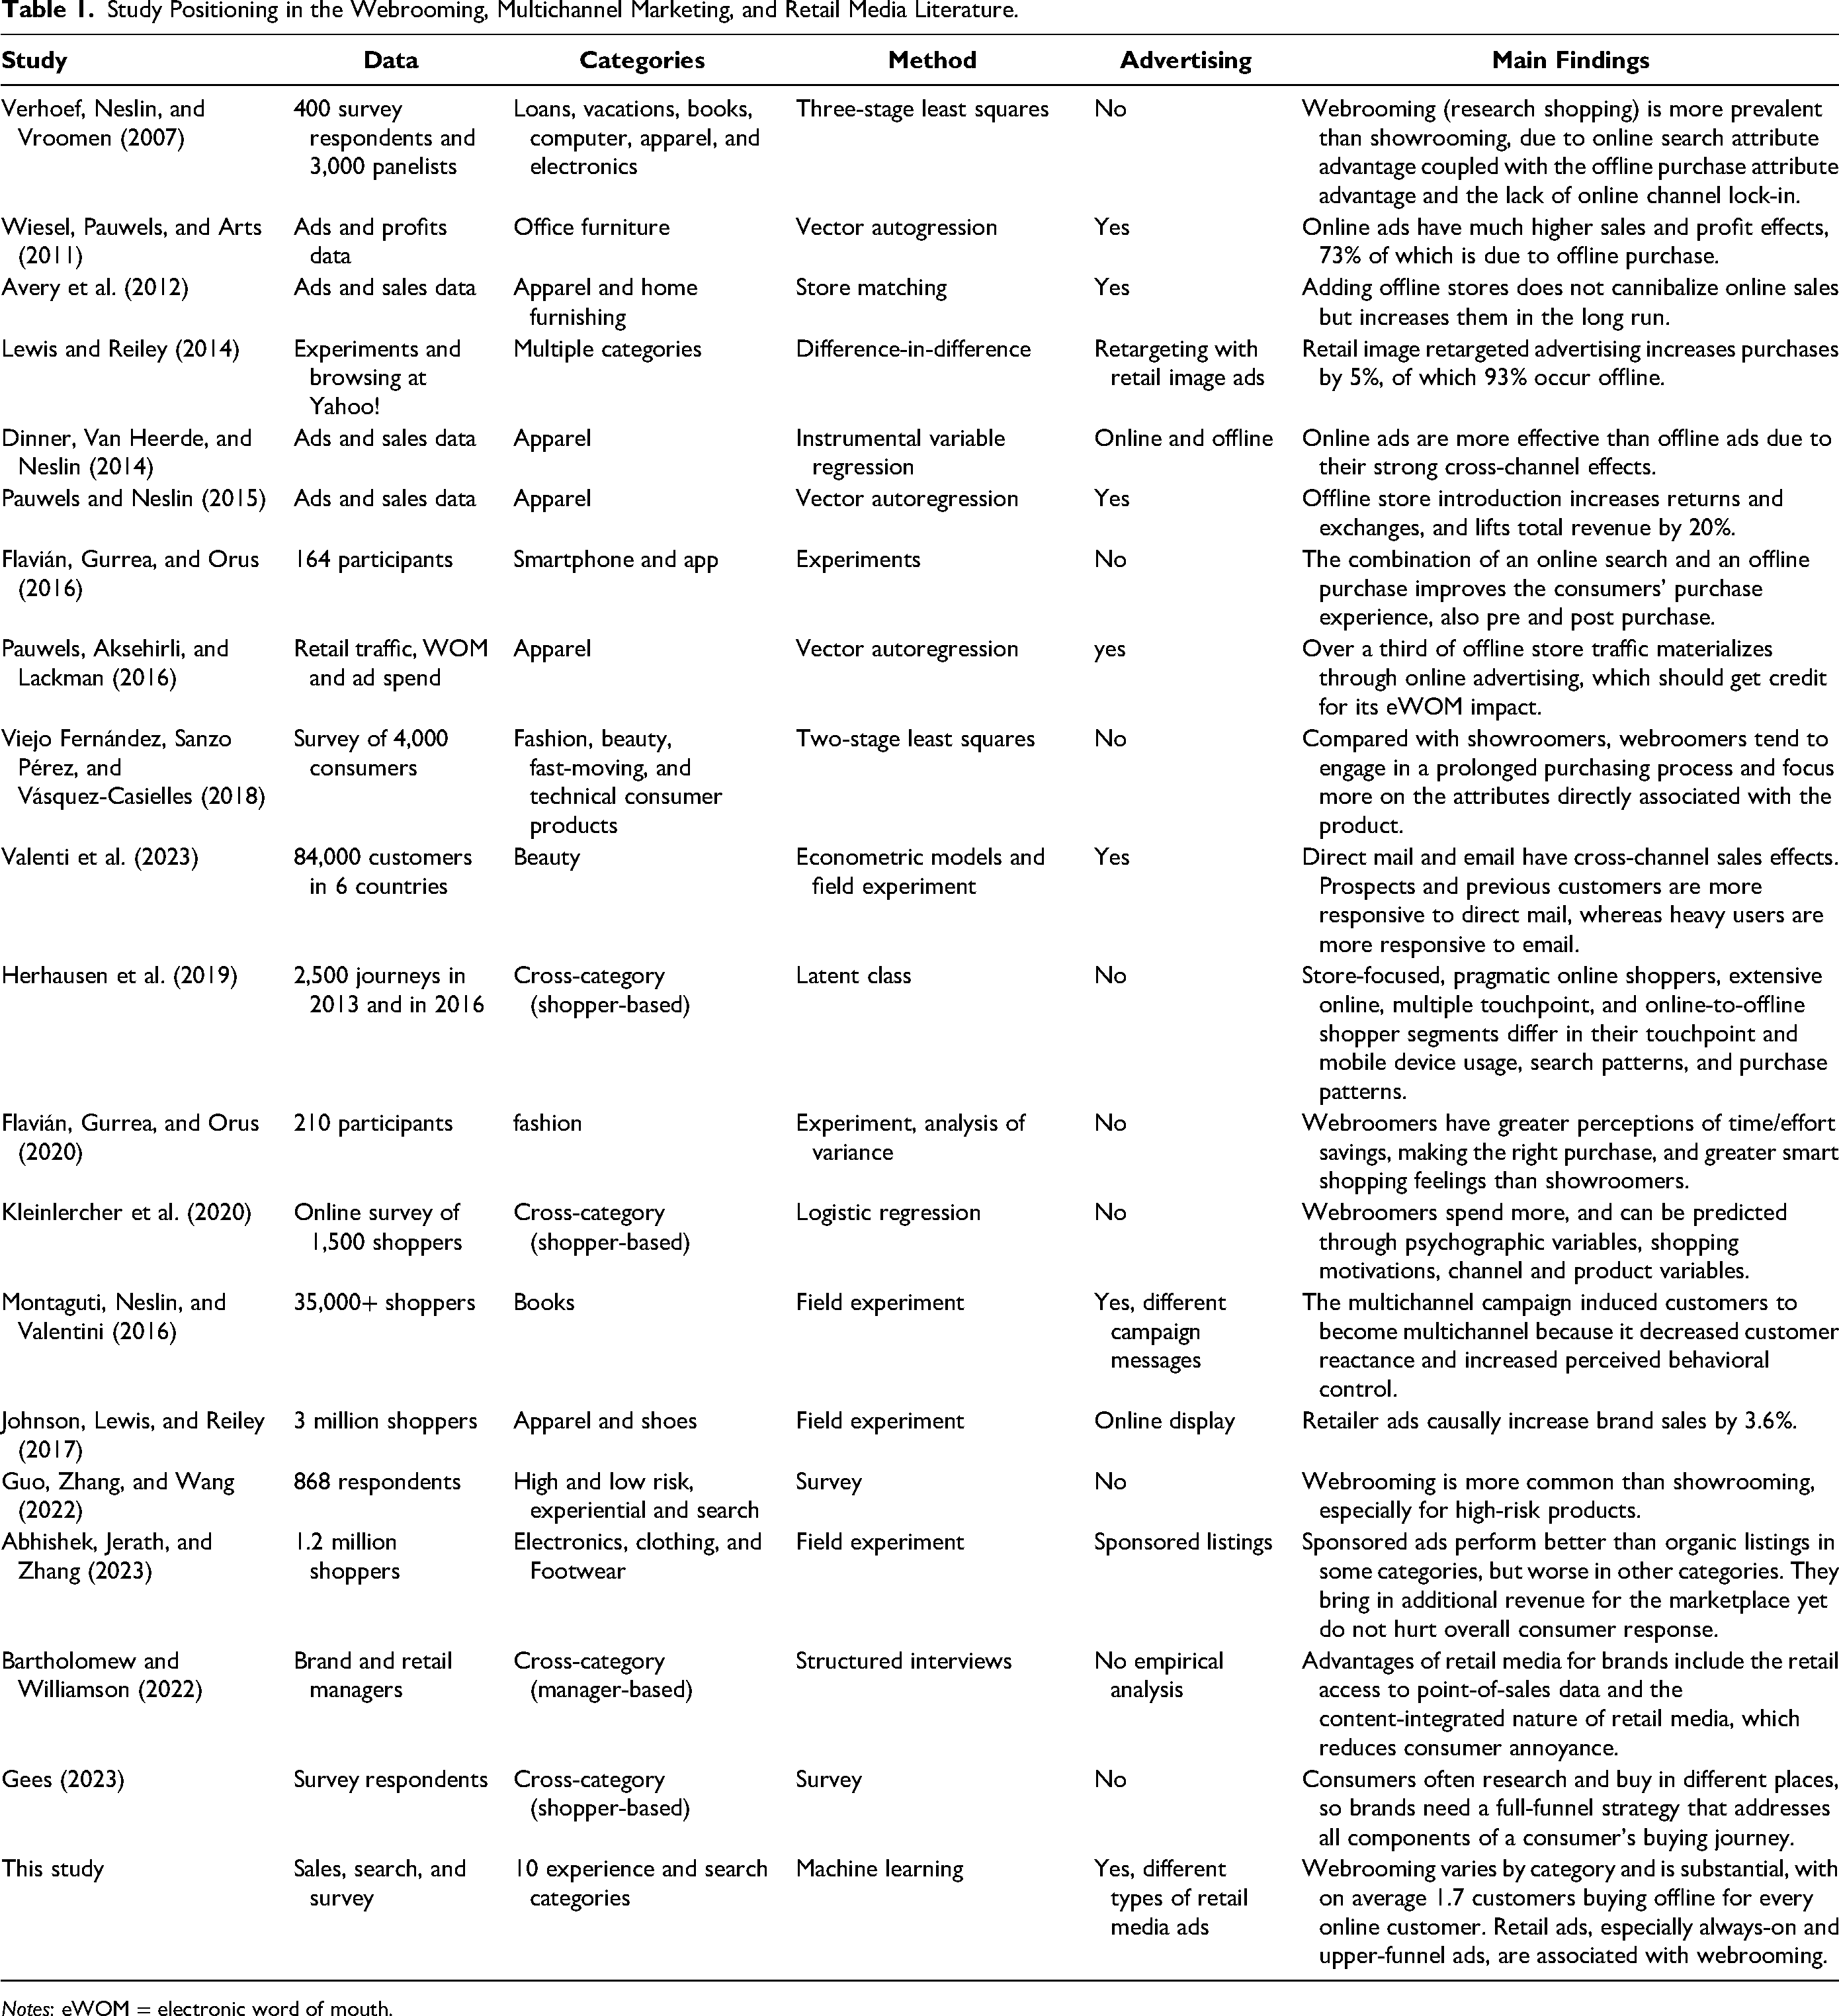
Notes: eWOM = electronic word of mouth.
Our article is the first to empirically analyze the spillover effects of retail media ads at scale. We contribute to the existing literature in several ways. First, we use a combination of secondary data from the online retailer with survey data to estimate magnitude of webrooming across a large number of categories. Second, we build an ML model to allow for scalable predictions of the magnitude of webrooming over time periods and across categories and brands. Moreover, unlike most previous work on webrooming, we take the brand perspective to estimate webrooming at the brand level, capturing the magnitude of webrooming for each brand. We propose a new metric to evaluate how many consumers who searched for a brand on-site then purchased it either on-site or off-site: the research on-site, purchase elsewhere share (ROPES). Finally, we demonstrate how brand advertising and consumer actions on an online retail site are associated with consumer purchase both on the site and off the site.
The second related research stream concerns online advertising. Previous literature has shown that such ads put the product in view of consumers, which can help them become aware of the product and motivate them to search for more information, which can ultimately persuade them to purchase it—online or offline (Dinner, Van Heerde, and Neslin 2014; Lewis and Reiley 2014; Wiesel, Pauwels, and Arts 2011). Rutz and Bucklin (2011) find that online banner advertising induces brand browsing, and Bronnenberg, Kim, and Mela (2016) find that the share of online search for a brand closely tracks the ultimate purchase likelihood for that brand. Moreover, purchase funnel and sales value effects are approximately three times higher for online ads that are congruent with the consumer’s reason to visit the website (e.g., explore and buy products) versus those that are not (De Haan, Wiesel, and Pauwels 2016). Likewise, Dinner, Van Heerde, and Neslin (2014) find that online ads are more effective than offline ads due to their strong cross-channel purchase effects. Beyond these information and persuasion functions in the prepurchase funnel, advertising may also remind existing customers about the brand's benefits and product offerings and thus induce repeat purchases (Valenti et al. 2023). Indeed, Pauwels, Aksehirli, and Lackman (2016) find stronger sales effects for online versus offline advertising across different brand size conditions, but especially for larger brands. While some authors claim that online advertising is not as good as offline advertising for brand building, Draganska, Hartmann, and Stanglein (2014) find similar brand recall lift, and Chan, Wu, and Xie (2011) find substantial lifetime value for customers acquired through online ads, much of which materializes through offline purchases. Most recently, Bayer et al. (2020) find that online search advertising increases sales, and online display advertising increases firm value more than offline advertising does. As to the power of marketing to drive channel choice, authors have observed general interchannel synergy between internet search and in-store purchase (Guo, Zhang, and Wang 2022; Valentini, Montaguti, and Neslin 2011). A multichannel presence and promotion can improve the overall ad effect (e.g., Abdelmaged 2021; Blom, Lange, and Hess 2017).
Finally, retail media is a subject of strong managerial relevance (a Google search on March 3, 2024 revealed 4.6 billion hits), but little research attention. A few papers demonstrate the relative benefits of e-retail formats, with Abhishek, Jerath, and Zhang (2016) finding that the marketplace format reduces double-marginalization channel cannibalization. A follow-up field experiment finds that ads bring in additional revenue for the marketplace yet do not hurt overall consumer response in the short run. A game-theory model by Fei Long (2023, p. 1) reveals that “consumers benefit from retail media in a larger parameter space compared to the platform itself, suggesting that a retail online platform may be incentivized to offer too ‘little’ rather than too ‘much’ sponsored advertising.” The rationale is that sponsored advertising can help mitigate the issue of double marginalization by allowing the platform to earn additional advertising revenue, which in turn reduces its reliance on the sales margin. This reduces retail prices, ultimately benefiting the consumers.
Beyond this work, several recent papers are based on interviews and surveys focusing on how retail media works and how consumer privacy is protected (Bartholomew, Hampton, and Briegel 2023; Bartholomew and Williamson 2022) or on which website page consumers prefer ads (Li and Chiu 2023). Bartholomew and Williamson (2022) use structured interviews to explore retailers’ exchanges of customer data and personalization through targeted advertising on retail media networks. They find that large retailers are becoming retail media networks by providing new advertising forms that include display advertising, responsive banner ads, video advertising, and branded pages. Retailers then monetize this media by creating access points for suppliers and their agencies to leverage anonymized data of consumer segments made available within the retailer's media network. Within the retail media network, retailers use the data management platform to create audience segments and then push those audiences to demand-side platforms where targeted media opportunities are purchased. Key advantages of retail media for brands include the retail access to point-of-sale data (in contrast to social media sites or general search engines) and the content-integrated nature (De Haan, Wiesel, and Pauwels 2016) of retail media ads: “Unlike other ads that tend to be disruptive to customers, this is not the case for retail ads, since customers desire purchase goods on retail websites and are seeking product information from the retail media sites, so the purchase intent is congruent with the desired ad information for the brands that they are shopping for” (Bartholomew and Williamson 2022, p. 2). Gees (2023) proposes that the rise of retail media presents brands with a multilayered challenge, for which they need a full-funnel strategy that addresses all components of a consumer's buying journey. His paper summarizes surveys conducted by ChannelAdvisor to identify where consumers have been beginning their buying journeys and where they are conducting research about the products in which they are interested.
In summary, the current literature lacks an empirical framework and analysis for studying the effect of retail media ads on webrooming. We offer such a framework, apply it to ten categories, and then demonstrate how our approach scales across categories and allows for quantifying the webrooming effects for different types of retail media ads.
Measuring Research On-Site Purchase Off-Site Shares (ROPES)
As Gielens and Steenkamp (2019, p. 372) note, “Whereas, most consumer brands have long established relationships with B&M [brick-and-mortar] retailers, their ecommerce relationships are not nearly as mature. Brands struggle to find the relevant shopper and transaction metrics.” We measure and quantify the magnitude of off-site purchases among on-site researchers using the metric of ROPES. ROPES captures the share of on-site category researchers who purchase the brand off-site. Specifically, ROPES is the number of off-site brand buyers divided by the number of on-site category researchers who ended up not buying on-site, where on-site category researchers are customers who researched the product category on-site (i.e., viewed at least one product in the product category on-site) but did not buy on-site within a certain period. The mathematical representation of ROPES is: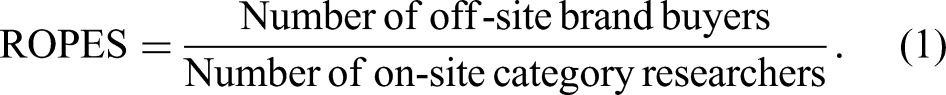
A brand may wish to maximize the size of its ROPES metric, as this number reflects the off-site purchase volume of A1C among non-on-site buyers (while keeping the on-site purchase volume of A1C). Given the number of on-site category researchers, we can use ROPES to estimate a brand's number of off-site buyers and sales. ROPES has the number of category researchers in the denominator instead of the number of brand-specific researchers for two reasons. First, it represents how much of the category potential the brand captures. This is similar to a share-of-the-aisle metric in physical supermarkets: of all the consumers going down an aisle, how many looked at or bought the brand? Limiting the denominator only to brand researchers may miss the opportunity to convert category researchers into brand purchasers. Second, ROPES has an easy interpretation, with a higher metric preferable in general, as outlined previously. Having brand researchers in the denominator could lead to a metric that increases with fewer brand researchers versus higher brand purchasers. We note that the ROPES metric itself does not imply a causal cross-category purchase metric but rather quantifies the size of the opportunity.
In addition to ROPES, we calculate a related measure of off-site purchases, the amplifier ratio (AR). AR captures the ratio of the brand's off-site buyers to on-site buyers. AR can be thought of as an adjustment factor reflecting the amplification of on-site purchases. If a brand or an advertiser is using a return-on-advertising-spend (RoAS) measure that is based on on-site purchases, AR can serve as a proxy to amplify the RoAS metric.
2
Equation 2 shows AR as a formula: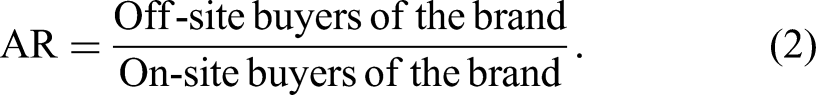
Modeling Approach for Share of Off-Site Purchases
Data Description
While an online retailer often observes purchases and research behavior on its own site, it rarely understands off-site behavior. To be able to measure both on- and off-site behavior, we need to match on-site behavior (search and purchases) with off-site purchases. For our analysis, we collected survey responses of 41,946 online retailer customers across ten categories in 2021 (i.e., audio speakers, computer printers, doll toys, laptop computers, microwaves, power drills, running shoes, smartphones, tablet computers, and televisions). We conducted a first wave of surveys for the computer printers, laptop computers, smartphones, and televisions categories from February 8, 2021, to March 2, 2021. We ran a second wave of surveys for the audio speakers, doll toys, laptop computers, microwaves, power drills, running shoes, smartphones, and tablet computers categories from July 7 to July 21, 2021, and from October 7 to October 14, 2021 (see Web Appendix A for survey details). The two survey waves enable a comparison and model prediction evaluation across time.
We matched the survey data with search and purchase data of these customers on the online retailer using anonymized survey links and identifiers. We targeted the survey only at consumers who researched the category on the online retailer and viewed at least one product detail page in the category 90 days before the survey. Moreover, respondents are considered off-site buyers if they reported having purchased a product in the product category off-site sometime in the four weeks before the survey and could recall the specific brand purchased off-site. 3 We asked respondents in the survey whether they had purchased a product in the category on- or off-site in the past four weeks and, if so, when they purchased the product and which brand they purchased (see survey questions in Web Appendix A). In ROPES we need to remove on-site buyers from the denominator, and in AR, the denominator includes information on on-site buyers. We consider on-site buyers to be only the respondents who reported having purchased on the online retailer's site before the survey and for whom we also observe a corresponding purchase in internal data. For customers who reported purchasing the product on-site, we can compare the survey responses to actual purchases with the online retailer's internal data because all respondents were retailer customers. We find that more than 90% of respondents have a matching reported and observed purchase on the retail site. This finding indicates a high level of accuracy for our survey instrument, mitigating general common concerns with self-reported surveys (e.g., Baumgartner and Steenkamp 2006). When examining specific brands in a product category, we consider brands for which we had at least ten off-site buyers in the survey and combine all other smaller brands into a joint brand that we denote as “Other.”
Reported Shares of Off-Site Purchases Across Categories and Brands
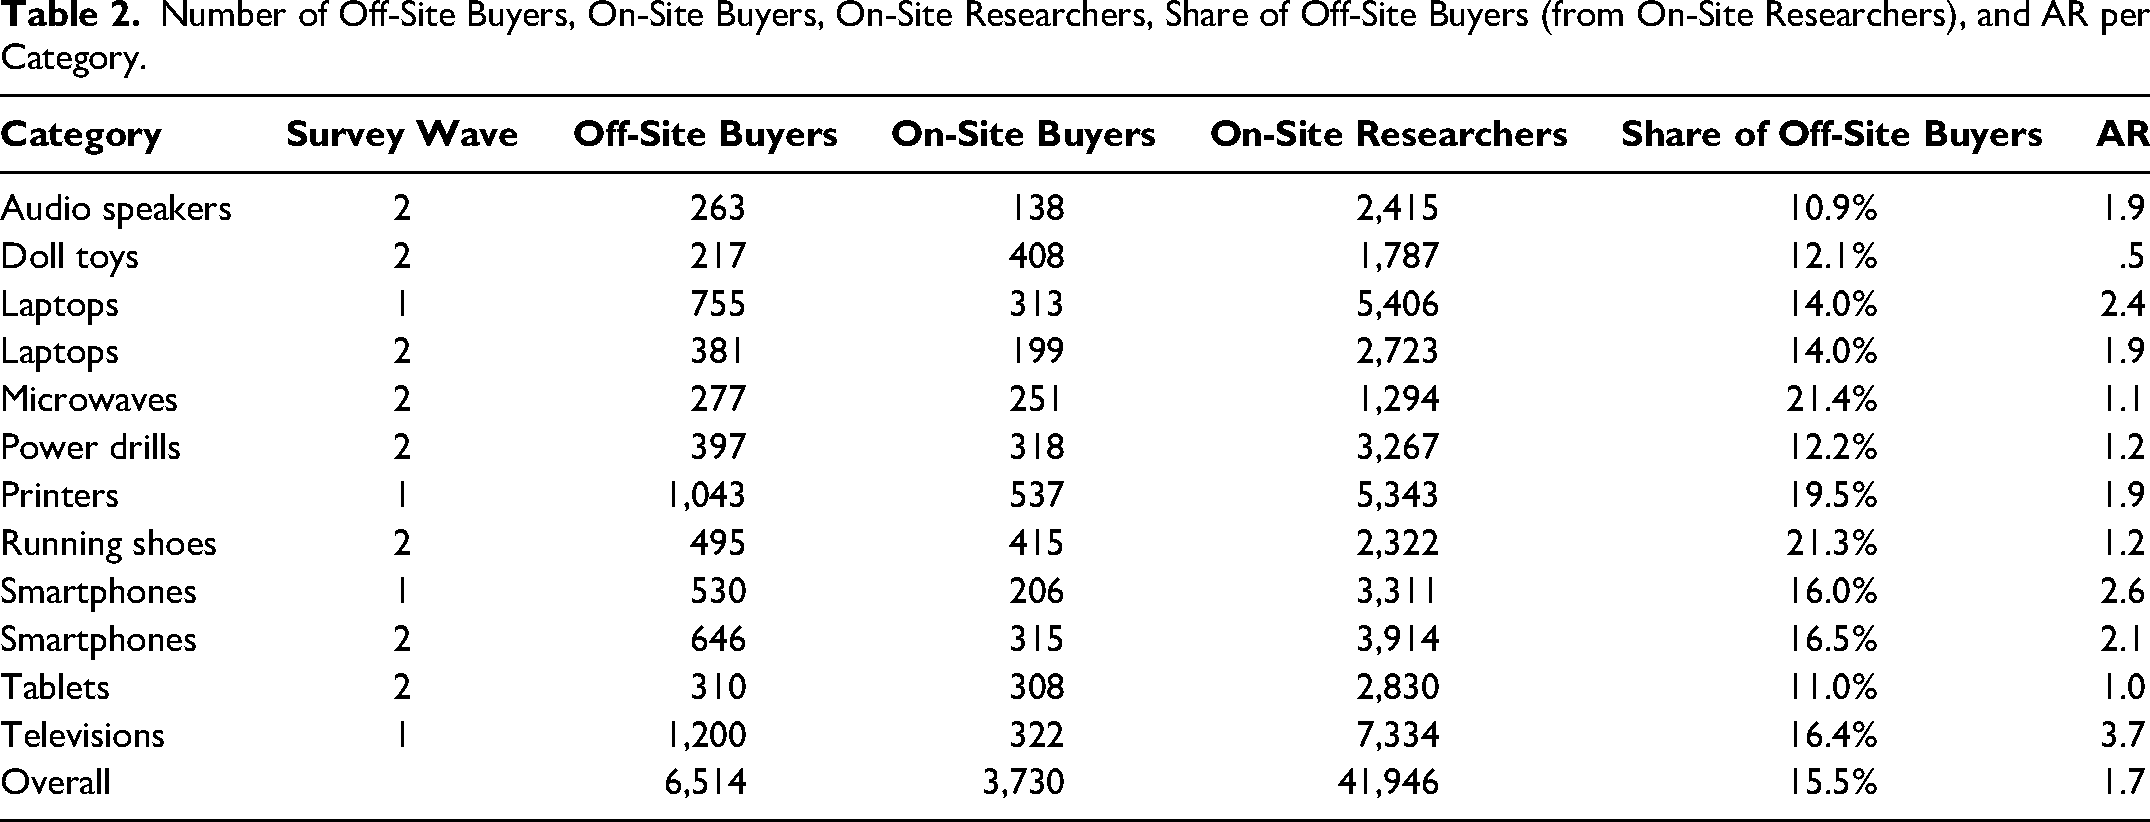
Tables 2 and 3 provide the ROPES and AR scores across brands as reported in the surveys. 4 As the tables show, the ROPESs are sizable across the considered categories and brands. Similarly, the ARs are greater than 1 for all categories and for most brands. Thus, among customers who research in the category on-site, the fraction of off-site buyers is higher than that of on-site buyers. Overall, across the ten considered categories, we find an AR of 1.7. In other words, the ROPES buyers are 170% of the on-site buyers. If we assume that buyers spend the same dollar amount on- and off-site on average, the overall sales value generated for the brand among on-site researchers is 2.7 times the commonly reported sales values based on on-site purchases alone.
Number of Off-Site Buyers, On-Site Buyers, On-Site Researchers, Share of Off-Site Buyers (from On-Site Researchers), and AR per Category.
Summary Statistics of Share of Off-Site Buyers (i.e., ROPES) and AR Across Brands per Category.
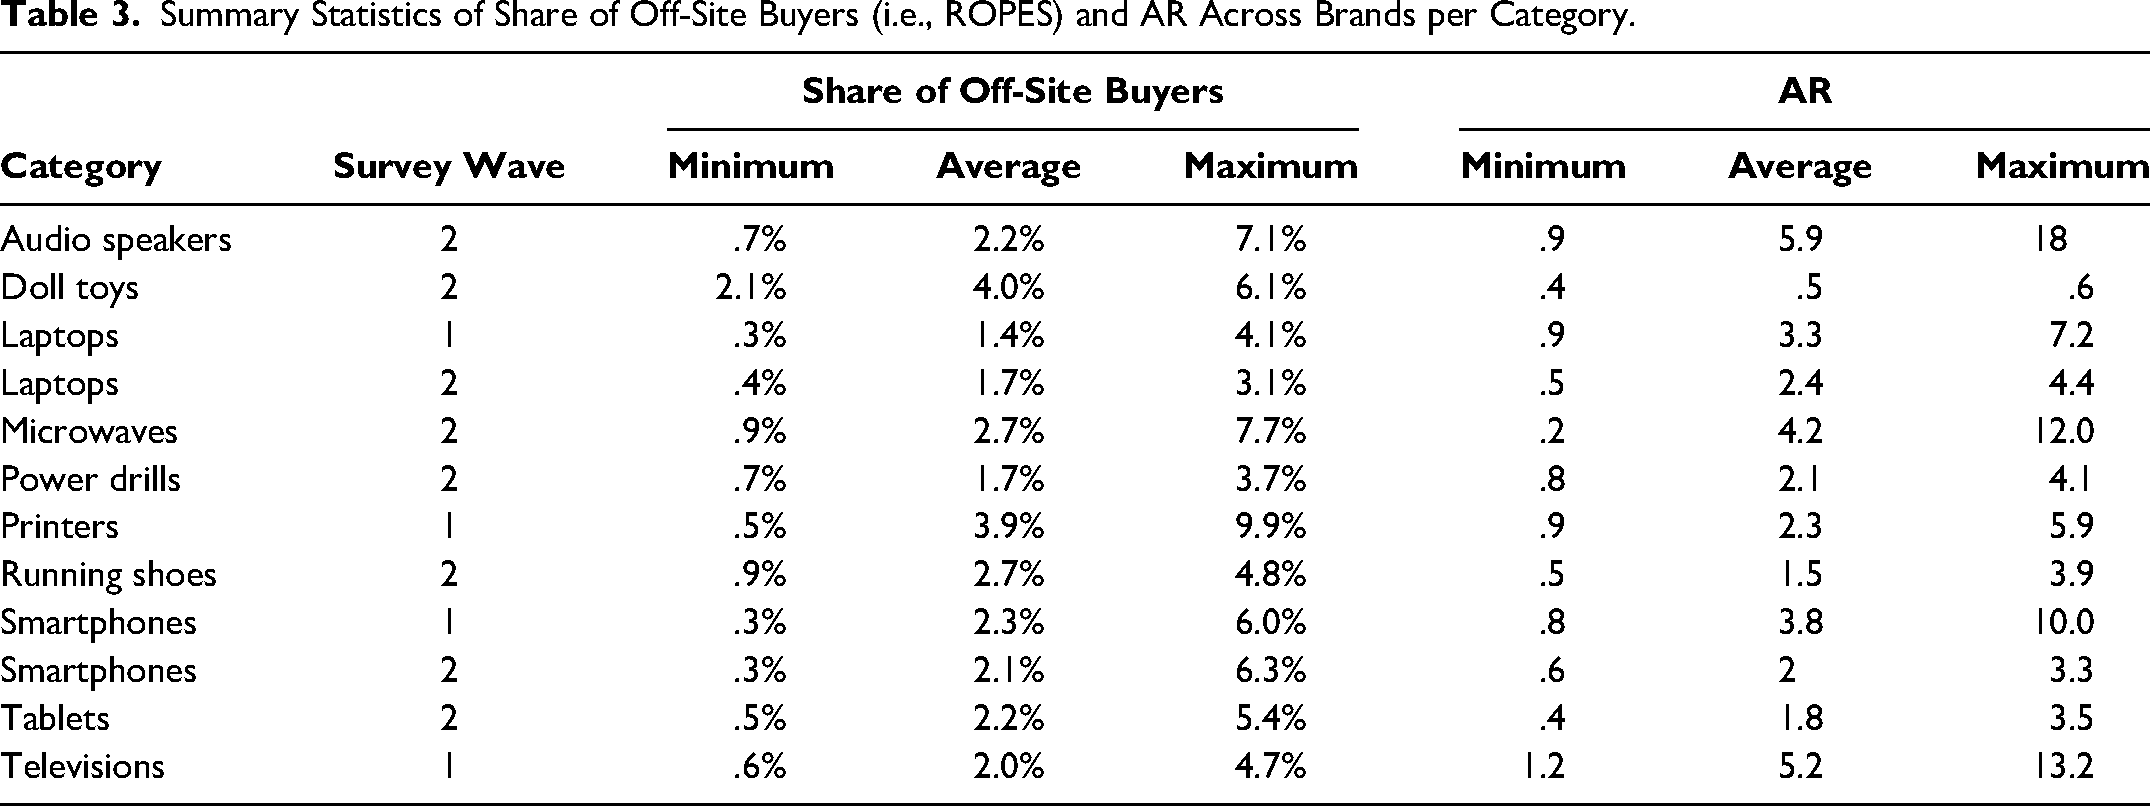
These numbers show the substantial economic importance of webrooming behavior. Even an AR of, for example, .2 would reflect an economically substantial fraction of business, as we would need to multiply the on-site sales by 1.2 to evaluate the overall on- and off-site purchase. Similarly, we find that the ROPESs of all brands range from approximately 11% to 21% across categories. Figure 1 shows the share of off-site buyers (i.e., ROPES) across brands grouped by product category. We find that the ROPESs are smaller and less spread out for categories such as audio speakers and laptops but larger for categories such as doll toys and printers. The figure shows that the shares of off-site sales are sizable across products and brands. These findings confirm the importance for brands to include on- and off-site sales in their on-site marketing strategy.
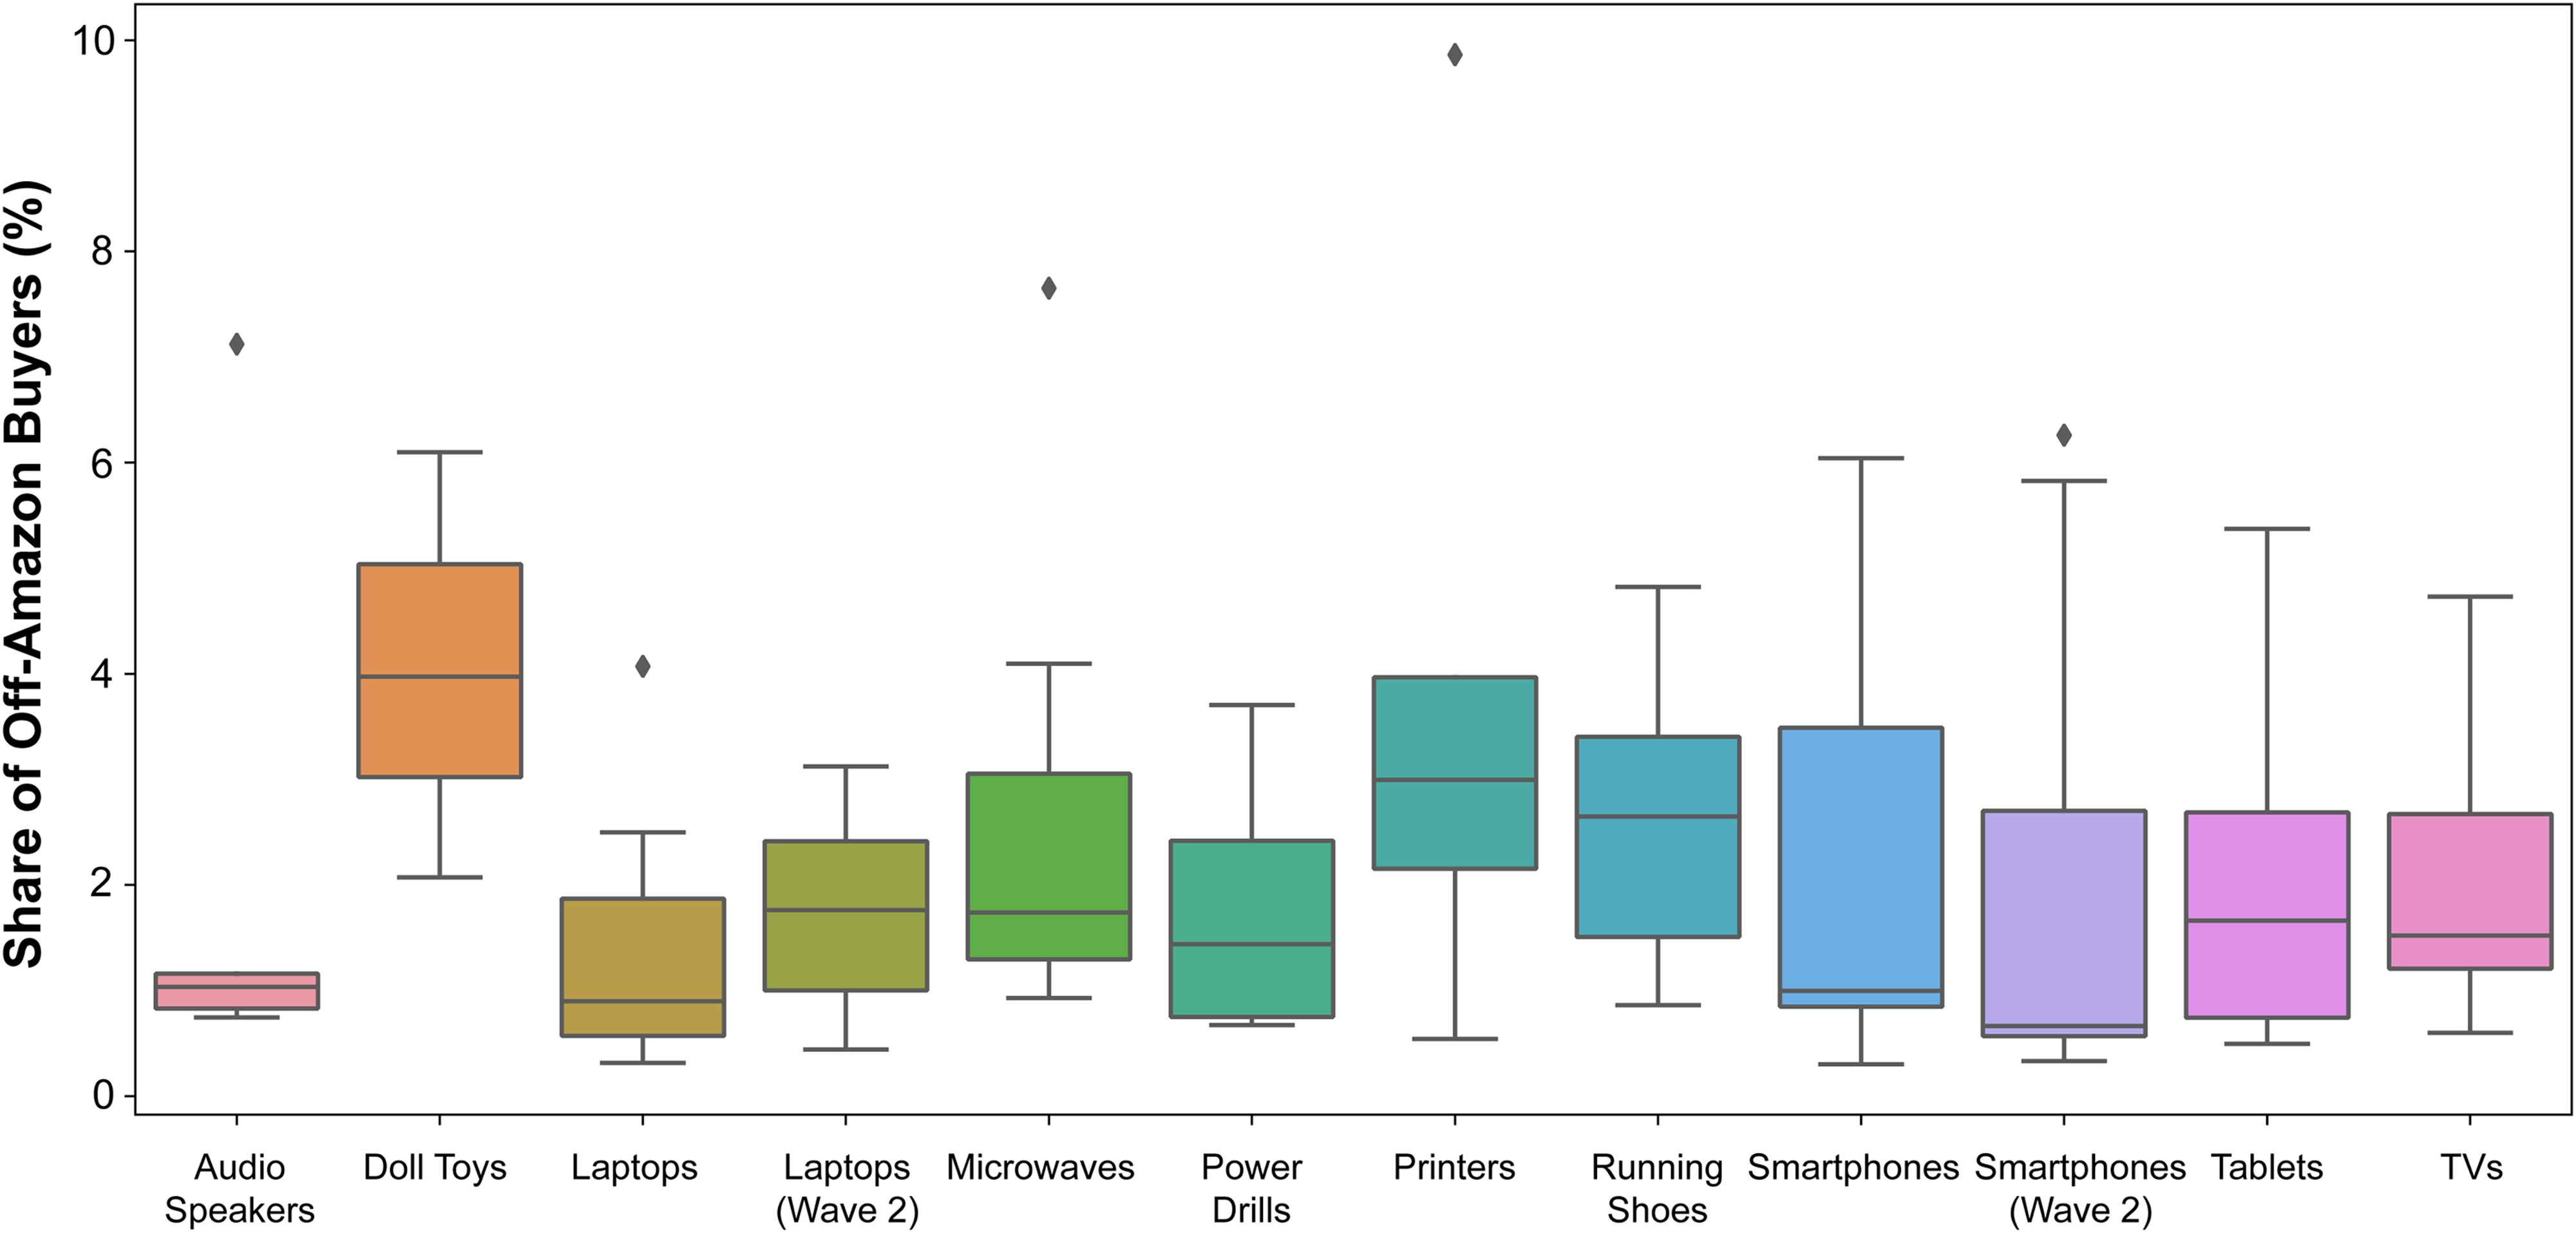
Share of Off-Site Buyers (from On-Site Researchers) for Different Brands in a Box Plot per Product Category.
Modeling Approach to Scale the Survey Responses
Tables 2 and 3 show the ROPES and AR measures calculated directly from the survey responses. However, scaling the calculation of these measures using surveys for all brands and periods is impractical for any retailer. Therefore, we use our data collected across 12 product categories (10 unique categories and 2 repeat categories in two periods) and 82 brand and survey wave combinations (including the “Other” brand) to calibrate a predictive model of ROPES. As detailed in the metric discussion, we focus on predicting ROPES because brand managers may wish to maximize it, and we can calculate AR directly from the predicted ROPES, given the observed number of on-site purchases.
Thus, the objective of our modeling approach is to use on-site research and purchases to estimate the shares of off-site purchases at the brand level. An alternative approach would be to predict whether any particular customer purchases on- or off-site given their activities on the retail site. However, aggregate share predictions are likely to be more accurate than individual-level predictions, given our objective of estimating ROPES at the brand level. The variation across brands and categories enables us to pursue our modeling approach directly at the brand level. 5 Web Appendix C provides mathematical details of our formulation of the aggregate shares.
Bootstrapping
Because we have only one ROPES observation for each brand per survey wave, we conduct a bootstrap analysis to allow for statistical analysis of the relationship between predictive features and ROPES. Specifically, we randomly split the survey data into a training and test set. For both sets, we carry out stratified bootstrapping sampling of approximately 10% of the respondents per category with 50 repetitions. 6 For each repetition, we aggregate both the dependent variable (ROPES) and the predictors at the brand level. The variation in both the aggregate dependent variable and the independent variables across brands and bootstrap draws allows us to identify the relationship between the two. Overall, our sample size for estimation is 4,100 observations (50 [repetitions] × 82 [brand and survey wave combinations]).
Predictors of Share of Off-Site Purchases (ROPES)
We can divide the predictors (i.e., explanatory variables or input features) we use to predict ROPES of a brand into four sets:
Research behaviors on-site related to the brand, such as the number of detail-page views for the focal brand or the number of visits to the brand's review section; Research behaviors in the product category on-site, such as the overall time spent on product pages in the category or the number of detail-page views in the focal product category; Past purchase behaviors on-site on previous journeys, such as the total dollar amount spent on-site during the last year; and Brand-specific information, such as advertising spending, the share of on-site buyers of the brand in the category, or the average review ratings for products of the brand.
The full list of predictors is available in the Web Appendix D. Table 4 shows our propositions on the ROPES drivers, based on the extent and result of consumer search activity on the online retail site.
Webrooming and Retail Media's Impact: Propositions and Future Research Directions.
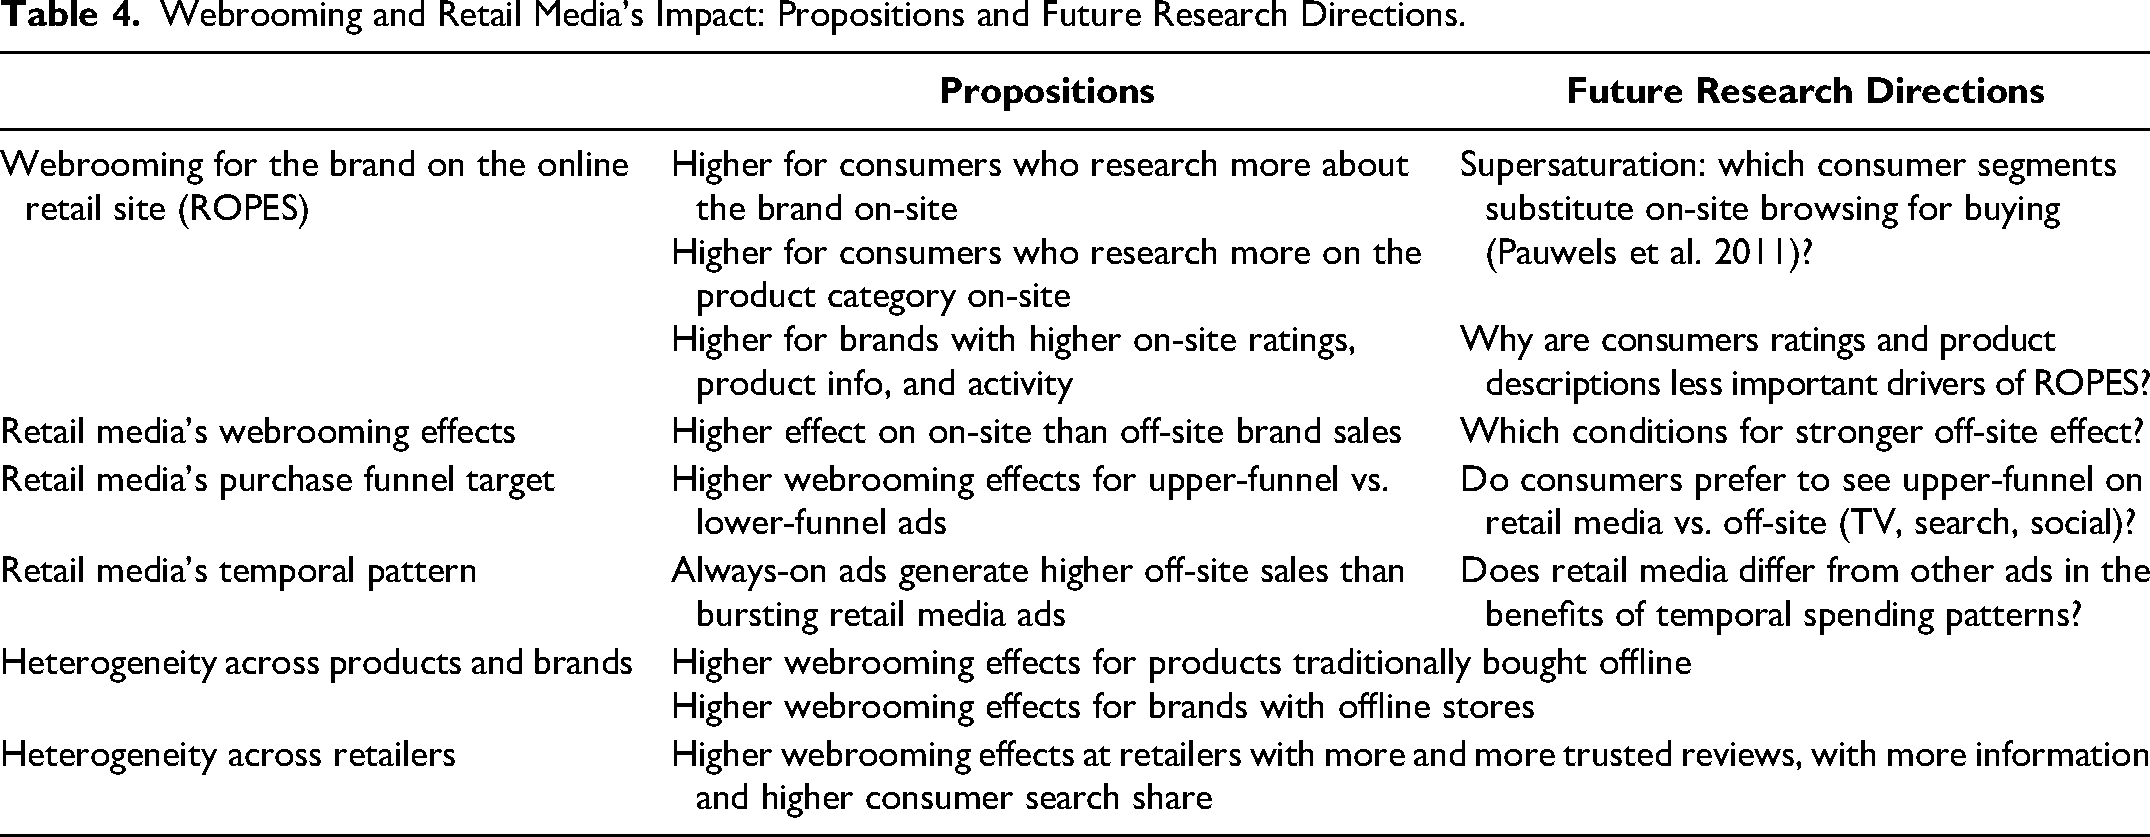
First, the share of off-site buyers to on-site researchers (ROPES) should be higher for consumers who interact more deeply with the specific brand on the specific retail site. The main motivations for consumers to webroom are time and effort saving, feeling of control (Flavián, Gurrea, and Orus 2019, 2020), and the ability to focus on product characteristics (Viejo Fernández, Sanzo Pérez, and Vásquez-Casielles 2018). Investigating products online prior to purchase allows consumers to arrive to the point of purchase with extensive knowledge about the product, its features, and its price (Viejo Fernández, Sanzo Pérez, and Vásquez-Casielles 2018). Accordingly, we would expect predictors of webrooming behavior to include deeper consumer interaction with the brand on the retail site.
Second, the result of this on-site search matters: consumers should be more likely to buy a brand, also off-site, if the on-site search revealed high quality and prominence. Therefore, we expect higher ROPES for brands with higher review volume and valence, extent of detailed product information, and retail media ads. Furthermore, Kleinlercher et al. (2020) argue that higher price attractiveness of the off-site options are positively related to webrooming behavior. Therefore, we include the ratio of on-site and off-site price as a ROPES predictor.
Model Calibration
Given the large number of predictors in our model, the use of traditional econometric models is infeasible. Accordingly, we use a random forest ML model to predict the share of off-site purchases at the brand level, given the set of four ROPES predictors. We calibrate 300 decision trees based on random samples after obtaining hyperparameters from a random grid search via cross-validation using the training data for each considered case in the prediction scenarios outlined subsequently (see Web Appendix E for the hyperparameter selection).
We compared the random forest model with alternative ML models (e.g., gradient boosting models, deep learning neural nets). We found that the random forest model had the highest out-of-sample prediction accuracy. 7
Results and Performance Evaluation
To assess the goodness of fit and prediction of the proposed model, we consider three prediction scenarios: (1) an out-of-sample product category scenario, (2) an out-of-sample period scenario, and (3) an out-of-sample brand scenario. These three scenarios mimic the three use cases of predicting ROPES for products at different points in time. The first scenario mimics the situation of predicting ROPES for a category for which no survey was conducted. This scenario represents the most common scenario of our scalable approach where we collected data for a set of categories and want to predict the share of off-site buyers for other categories that were not included in any survey. We train the model using all but one category and predict ROPES for the left-out category. We repeat the training and prediction in turns so that each category is used once as out-of-sample. The second scenario mimics the situation of predicting ROPES for a category in a period different from when the survey was conducted. We train the model using the first period and predict ROPES for the following period as out-of-sample. The third scenario mimics the situation of predicting ROPES for a brand for which no survey was conducted but other brands in the category were surveyed. We train the model using all but one brand and predict ROPES for the left-out brand. We repeat the training and prediction in turns so that each brand is used once as out-of-sample.
Table 5 shows the predictive performance. On average across evaluation scenarios, we find that for approximately 92% of the cases, the differences between the predicted and observed ROPES are not significantly different from zero. Specifically, we compare the difference between the observed and predicted brand ROPES across brands using a Wald test with normal approximation at the 5% significance level when also accounting for randomness across bootstrap samples. 8 The average Pearson correlation coefficient of predicted and observed brand ROPES is .83. For prediction performance for each individual brand, see Web Appendix F.
Performance of Predicted Versus Observed ROPES for Major Brands.
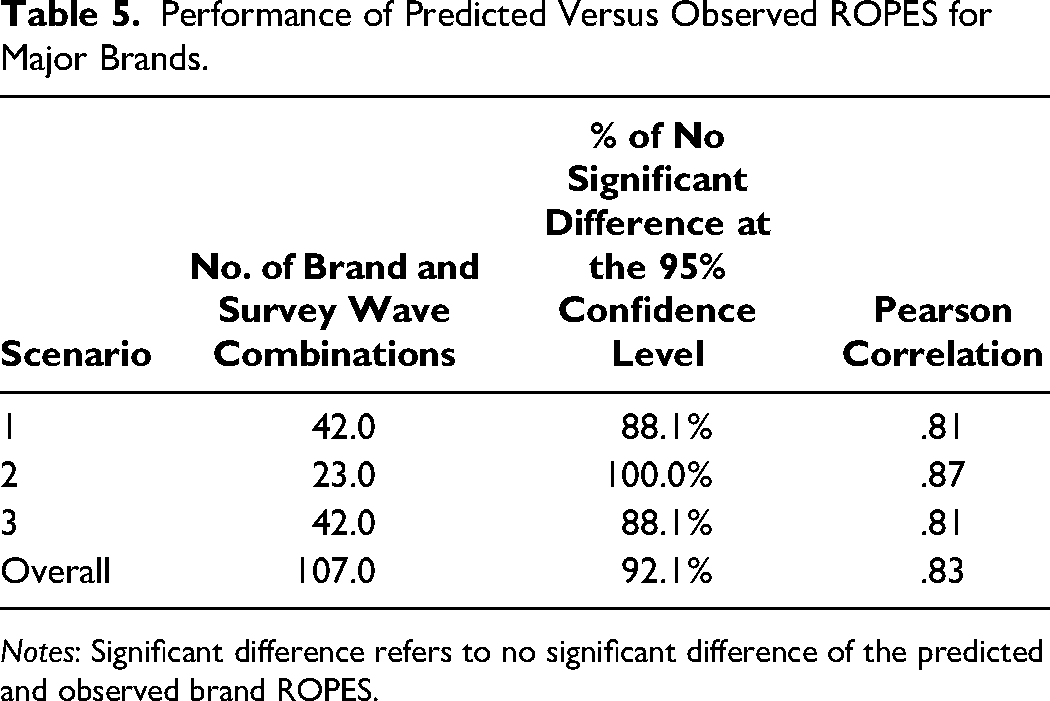
Notes: Significant difference refers to no significant difference of the predicted and observed brand ROPES.
For the out-of-sample product category prediction scenario, we find that approximately 88% of differences of the predicted and observed ROPES are not significantly different from zero. The Pearson correlation coefficient of predicted and observed brand ROPES is .81. For the out-of-sample period prediction, we find that all differences of the predicted and observed ROPES are not significantly different from zero. The Pearson correlation coefficient of predicted and observed brand ROPES is .87. For the out-of-sample brand prediction, we find that approximately 88% of differences of the predicted and observed ROPES are not significantly different from zero. The Pearson correlation coefficient of predicted and observed brand ROPES is .81.
Overall, the results suggest that our scalable approach to predict the share of off-site buyers predicts out-of-sample product category, out-of-sample period, and out-of-sample brand off-site sales well. Therefore, retailers could run a limited number of surveys in a few product categories and periods to reliably estimate ROPES across product categories, brands, and periods.
Because our random forest model is a nonlinear ML model, direct interpretation of the predictors’ effects is not possible. However, we can use the attributes’ importance calculated from the model to interpret which features best predict ROPES. Figure 2 shows the top variables in terms of importance for the model trained on all brand and survey wave combinations.
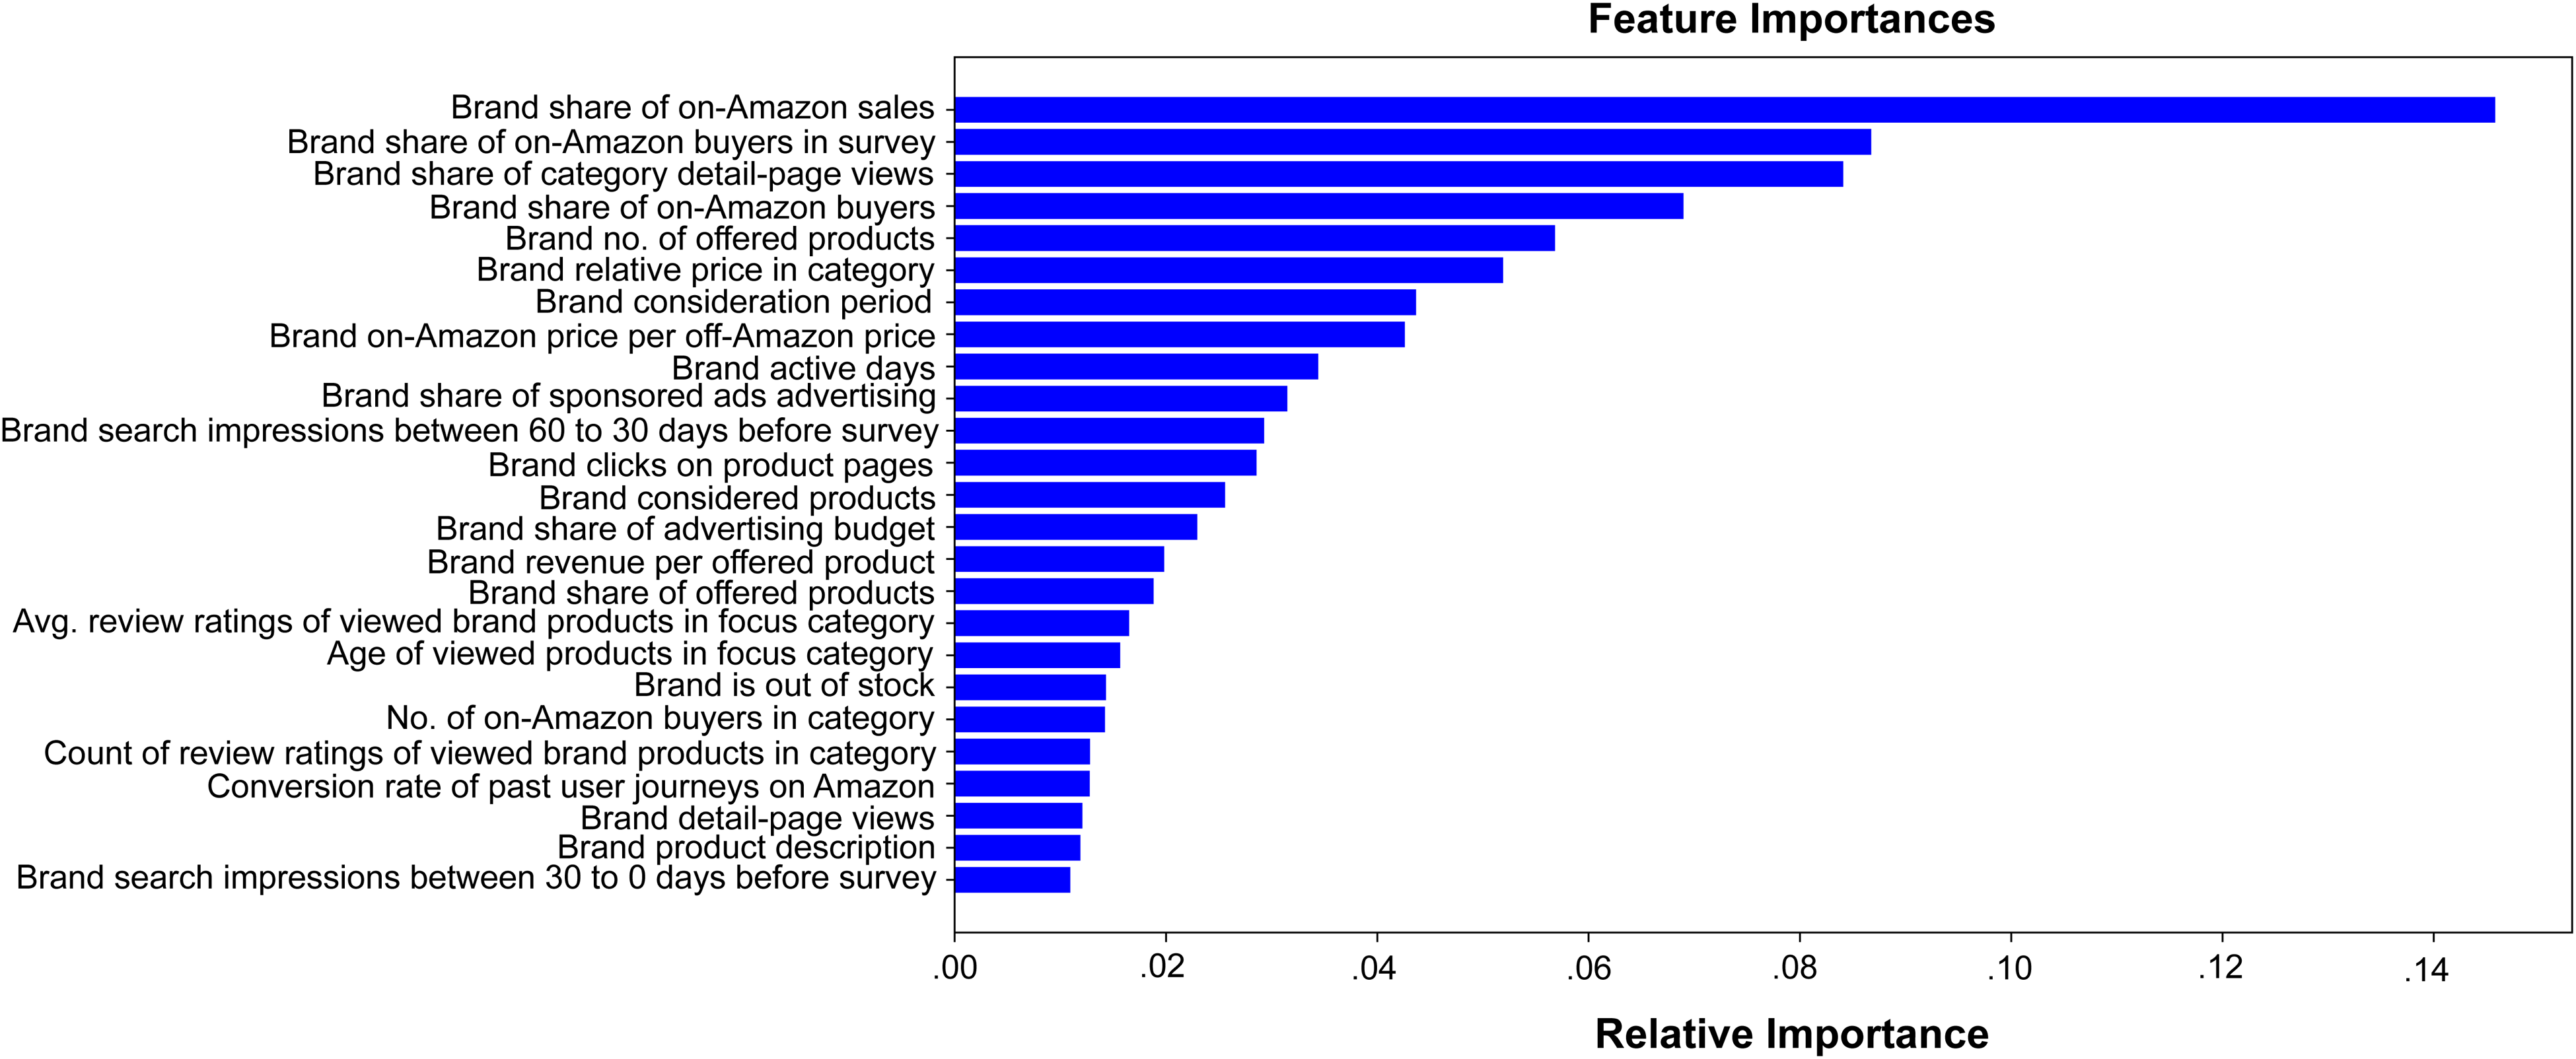
Importance of Predictors (i.e., Explanatory Features).
Evaluating the variables most predictive of off-site purchase shows support of most of our propositions. Consistent with previous research, which suggests that webrooming customers are more involved (Kleinlercher et al. 2020) and often evaluate products based on their features (Viejo Fernández, Sanzo Pérez, and Vásquez-Casielles 2018), we find that the most important predictors of whether the customer will buy a brand off-site are brand-specific variables that reflect the degree to which customers interacted with the brand on-site (e.g., the brand share of category detail views, brand search impressions, or average review ratings of viewed products). These variables highlight the role of the online platform in customer education prior to off-site purchases. We also find that several of the top predictors are related to overall brand strength (e.g., the brand share of on-site sales or on-site buyers). As expected, price-related variables (Kleinlercher et al. 2020) such as the ratio of on-site price to off-site price and the brand-relative price in the category are also predictive of ROPES. Interestingly, customer-level predictors such as past on-site behavior were not highly predictive of brand-level off-site purchases. As to the potential role of on-site advertising, we find that the brand's share of advertising spend in sponsored brands and sponsored products, as well as the percentage of products advertised, tend to have high importance in predicting off-site purchases.
The Relationship Between Off-Site Sales and Ad Products: The Case of Laptops
While the prediction of ROPES included advertising variables, one should treat these as a signal that on-site advertising is related to ROPES but not necessarily that it affects it, due to the static nature of our analysis and possible endogeneity of the decision to advertise. To focus specifically on the effect of advertising on ROPES, we look at the laptops product category in the United States to explore a time series analysis of multiple types of retail media advertising and assess their relationship to ROPES.
The second half of Table 4 shows our key retail media predictions, together with future research directions. First, we expect all retail media ad products to have a greater effect on on-site than on off-site sales. Previous literature reported such higher same-channel versus cross-channel effects (Avery et al. 2012; Dinner, Van Heerde, and Neslin 2014; Pauwels and Neslin 2015), and we also expect these for our business-to-consumer categories. However, future research may delve deeper into exceptions, such as in the business-to-business setting of Wiesel, Pauwels, and Arts (2011), who find that on-site actions are more likely to result in off-site actions because purchase managers prefer to negotiate with a salesperson.
Second, we expect a higher off-site purchase impact of retail media that targets the upper part of the customer funnel. Recently, retail media publishers have been touting the “discovery” and “exploration” nature of on-site browsing, which presents opportunities for the brand to reach consumers who are not immediately looking for its product. Upper-funnel retail media ads (such as display and video) are aimed and successful at increasing awareness and consideration (Qin, Pauwels, and Zhou 2024), which may translate into an off-site purchase for the brand. In contrast, lower-funnel retail media such as sponsored product ads is targeted at shoppers searching within the category and likely to want to buy the product fast and through the online channel. We note that most brands start with retail media through such lower-funnel ads, and only later add more upper-funnel retail media aimed at awareness and consideration. An open question for future research is the relative effectiveness of retail media as compared with more traditional upper-funnel ads, such as through offline (TV, radio, print, outdoor) and online search and social media.
Third, a key proclaimed benefit of retail media is that it can be “always on” (i.e., activates whenever an online shopper shows the relevant behavior at any stage of their online purchase journey). Some retail media ads are always on, while others show the more traditional pulsing behavior of spending the budget in bursts at certain points in time (Gijsenberg and Nijs 2019). While possibly effective at “breaking through the clutter,” such bursting ads limit the number of potential customers the brand can interact with and are more likely to focus on when customers are ready to buy. Future research should build on Gijsenberg and Nijs’s (2019) offline advertising studies to demonstrate the boundary conditions of the benefits of always-on versus bursting retail media ads. For one, competitive conditions may be an important driver of whether retail media advertisers want to advertise in sync or out of sync with their competitors at the same retailer.
Data and Model to Assess the Relationship Between Advertising and Shares of Off-Site Purchases
Our data include 12 major laptop brands (i.e., A1A, A1C, AAB, ACB, BAA, BBB, BBA, BCA, C11, CA1, CA2, and CAB) in the United States. 9 For each brand, we collect brand-level data aggregated from 50,000 randomly selected on-site browsing and purchasing records on a monthly cadence over ten months (March–December 2021). We then use a two-step approach in which we first use our random forest ML model, trained on the survey data to predict the ROPES for each brand and each period. 10 To obtain a brand's off-site sales, we multiply ROPES by the average unit sales and the number of site category researchers. 11 In total, we have 120 predictions (12 brands × 10 months) of off-site sales for each of the 12 laptop brands. We couple the off-site sales information with the corresponding brand advertising spending across a host of ad products on the retail site (e.g., sponsored products ads, video ads).
In the second step, to assess the relationship between ad products and ROPES, we regress the predicted off-site sales on advertising spending on each advertising product while controlling for potentially confounding variables, such as the on-site sales of the brand, the brand's (on-site) price, the brand's ad spend on other on-site ad products at the same time, and the on-site lagged-sales effects. The brand's on-site sales should help control for possible time-varying endogeneity (e.g., laptop brands may advertise more and sell more around back-to-school periods).
To further account for possible endogeneity in advertising spending, we conduct two-stage least squares instrumental variable regressions (2SLS IV; Greene 2018). Specifically, to analyze the relationship between off-site sales and ad spend, we use the following two-stage regression-based approach: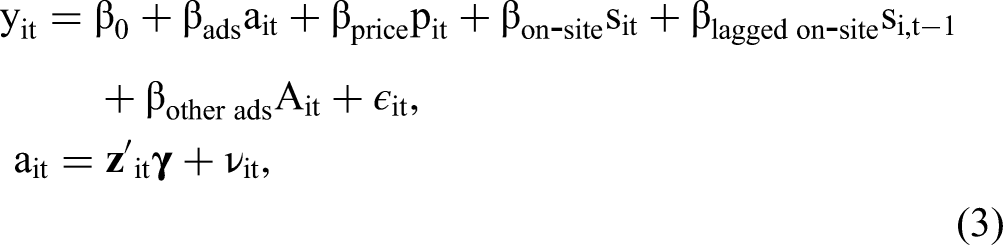
As instrumental variables
With Equation 3, we can estimate the effects of ad product a on off-site sales while controlling for potentially confounding variables, such as the (current and lagged) on-site sales of a brand and the brand's (on-site) price.
We run the 2SLS IV regression separately for each of the 27 site ad products studied (e.g., number of days with sponsored products/sponsored ad, use of sponsored display ads, streaming TV ads; see Web Appendix G for the full list of ad products examined and their description). The model allows us to compute the magnitude and significance of the effect of the 27 retail media ad products on off-site sales. We employ the model results to predict the off-site sales for advertisers either when applying or when not applying the ad product. 13 Doing so enables us to derive the percentage difference of off-site sales attributed to using ad product a for a focal brand b. We denote this value as OFFa,b.
Next, we derive the percentage difference of on-site sales attributed to using ad product a for a focal brand b in a similar manner, replacing the dependent variable with on-site sales and removing on-site sales from the right-hand side. We denote this value as ONa,b. Finally, we compute the relative contribution of for ad product a to off-site sales as follows: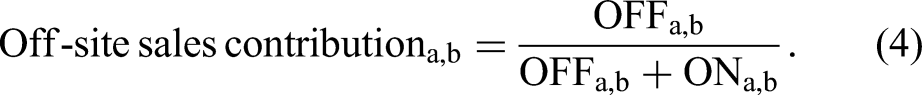
Results
Overall, we find that the models fit the data well. The R-squares across the 27 regression analyses are .88–.89. The coefficient signs have face validity: all 27 price coefficients were negative, and 26 out of 27 ad products had a positive effect on off-site sales. Of the 27 ad products, 13 had a statistically significant and positive effect of advertising on off-site sales (at the 10% significance level). Moreover, the effects of ad products on off-site sales were meaningful in magnitude. Ad products increased off-site sales by 10% or more for more than two-thirds of the brands. As Table 6 shows, display ads, video ads (nonstreaming TV), sponsored display, sponsored brands, sponsored products ads, and always-on ad products are all associated with higher off-site sales (see Web Appendix G for the full list of examined ad products and their description).
Ad Products That Significantly Increase Off-Site Sales.
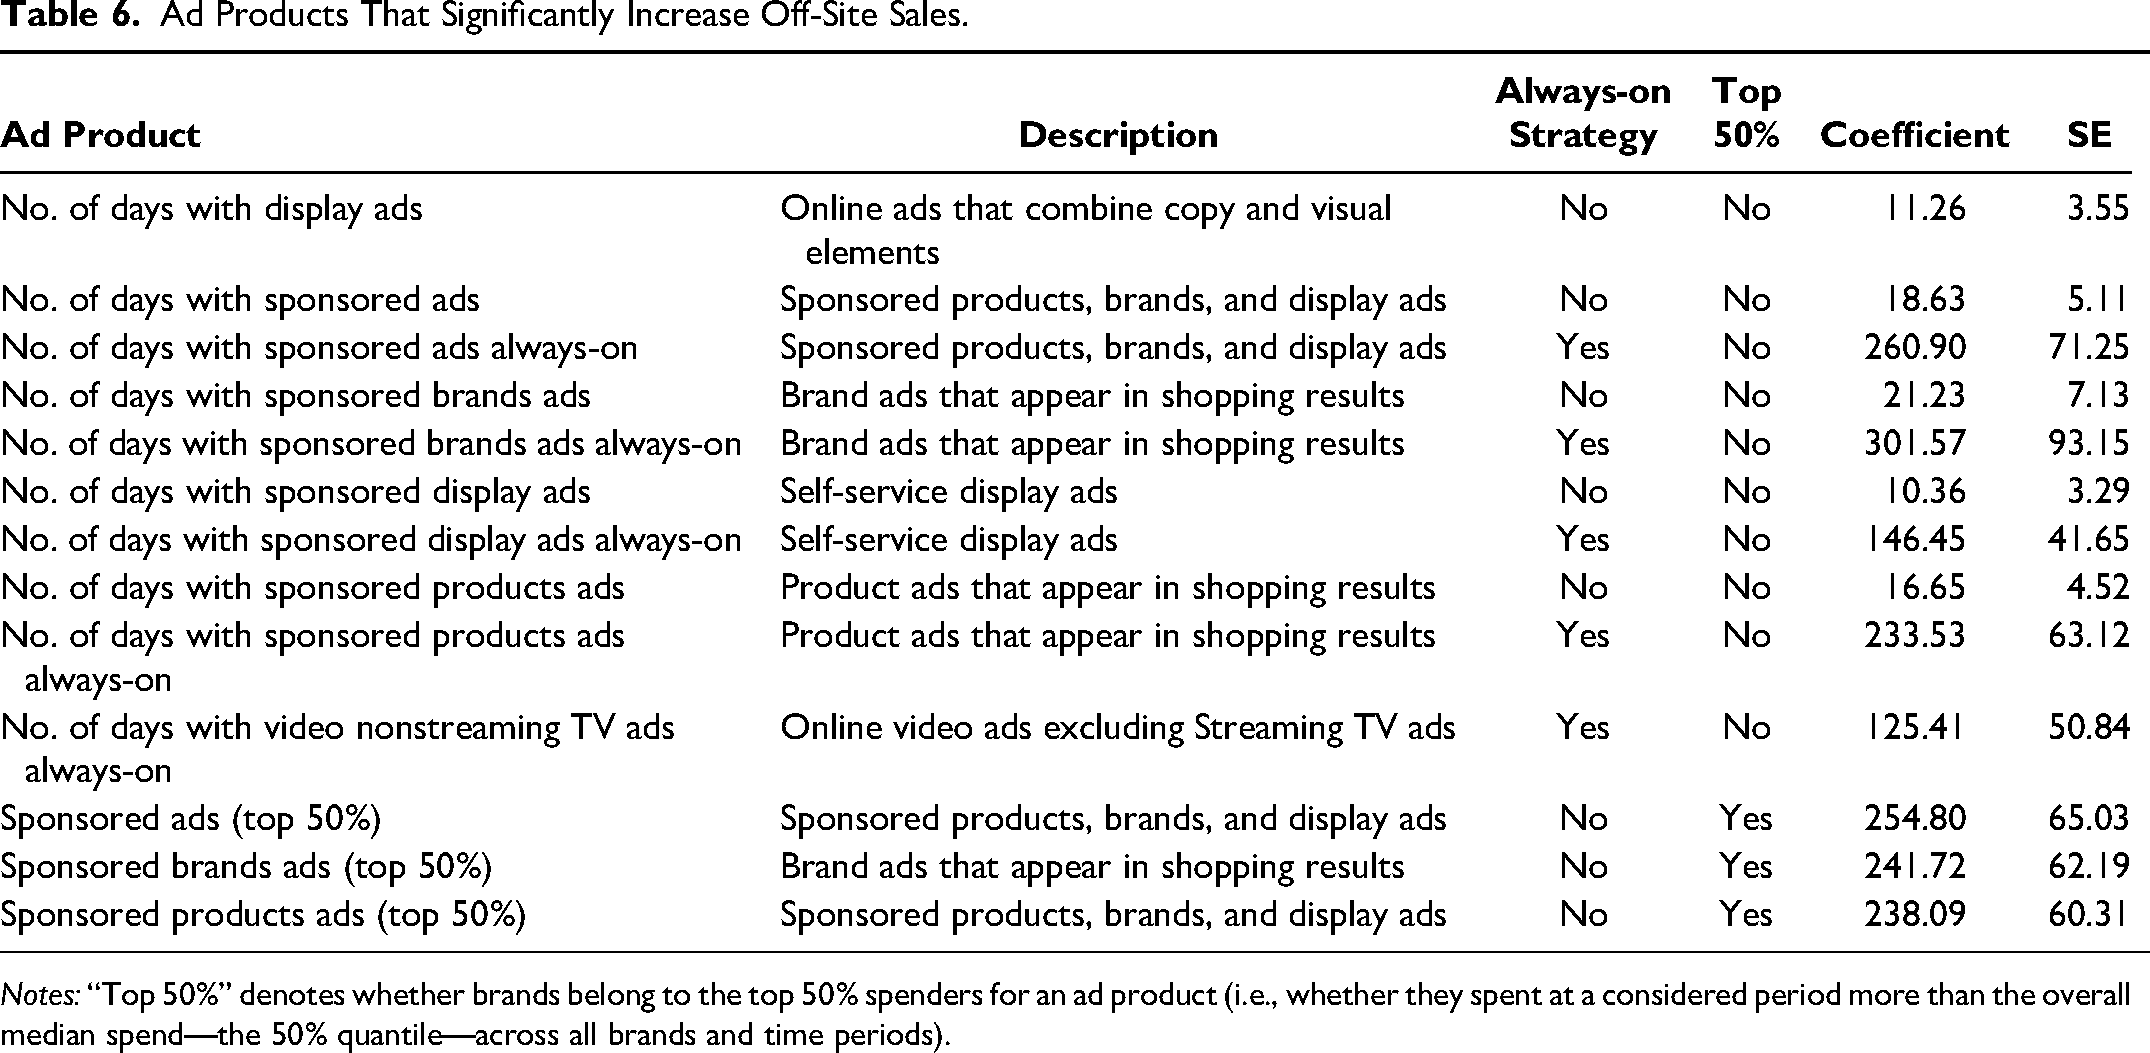
Notes: “Top 50%” denotes whether brands belong to the top 50% spenders for an ad product (i.e., whether they spent at a considered period more than the overall median spend—the 50% quantile—across all brands and time periods).
We analyze for how many brands and periods the advertisers applied the 13 identified ad products. We find that, on average, advertisers missed the opportunity to use these ad products in 25% of periods across ad products. This means that in these cases, an advertiser did not use the ad product but should have considered doing so to support off-site sales of the brand.
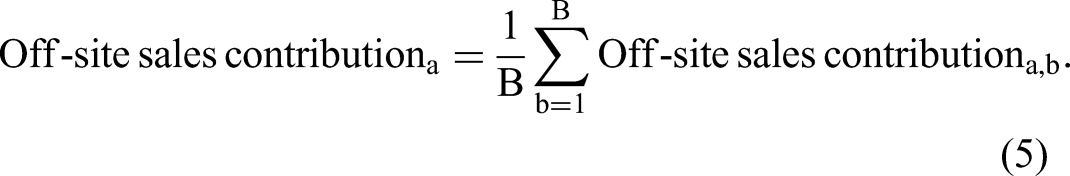
An on-site ad can have an effect on both on- and off-site sales. We employ the model results to predict the off-site sales for advertisers, either when applying or when not applying the ad product. Similarly, we apply the model to predict the on-site sales for advertisers due to each advertising product. This allows us to compute the contribution of off-site sales to on- and off-site sales for an ad product. We then calculate the fraction of the overall effect of the ad product (on- and off-site) that can be attributed to the off-site effect per Equation 4. The off-site contribution share measures the impact of an ad product on off-site purchase of the overall ad impact. Thus, for example, if an ad product generates $100,000 in off-site sales and $400,000 in on-site sales, the off-site contribution share would be 20% ($100,000/[$100,000 + $400,000]). Figure 3 shows off-site sales contributions in comparison with the overall effect for on- and off-site sales for different ad products.
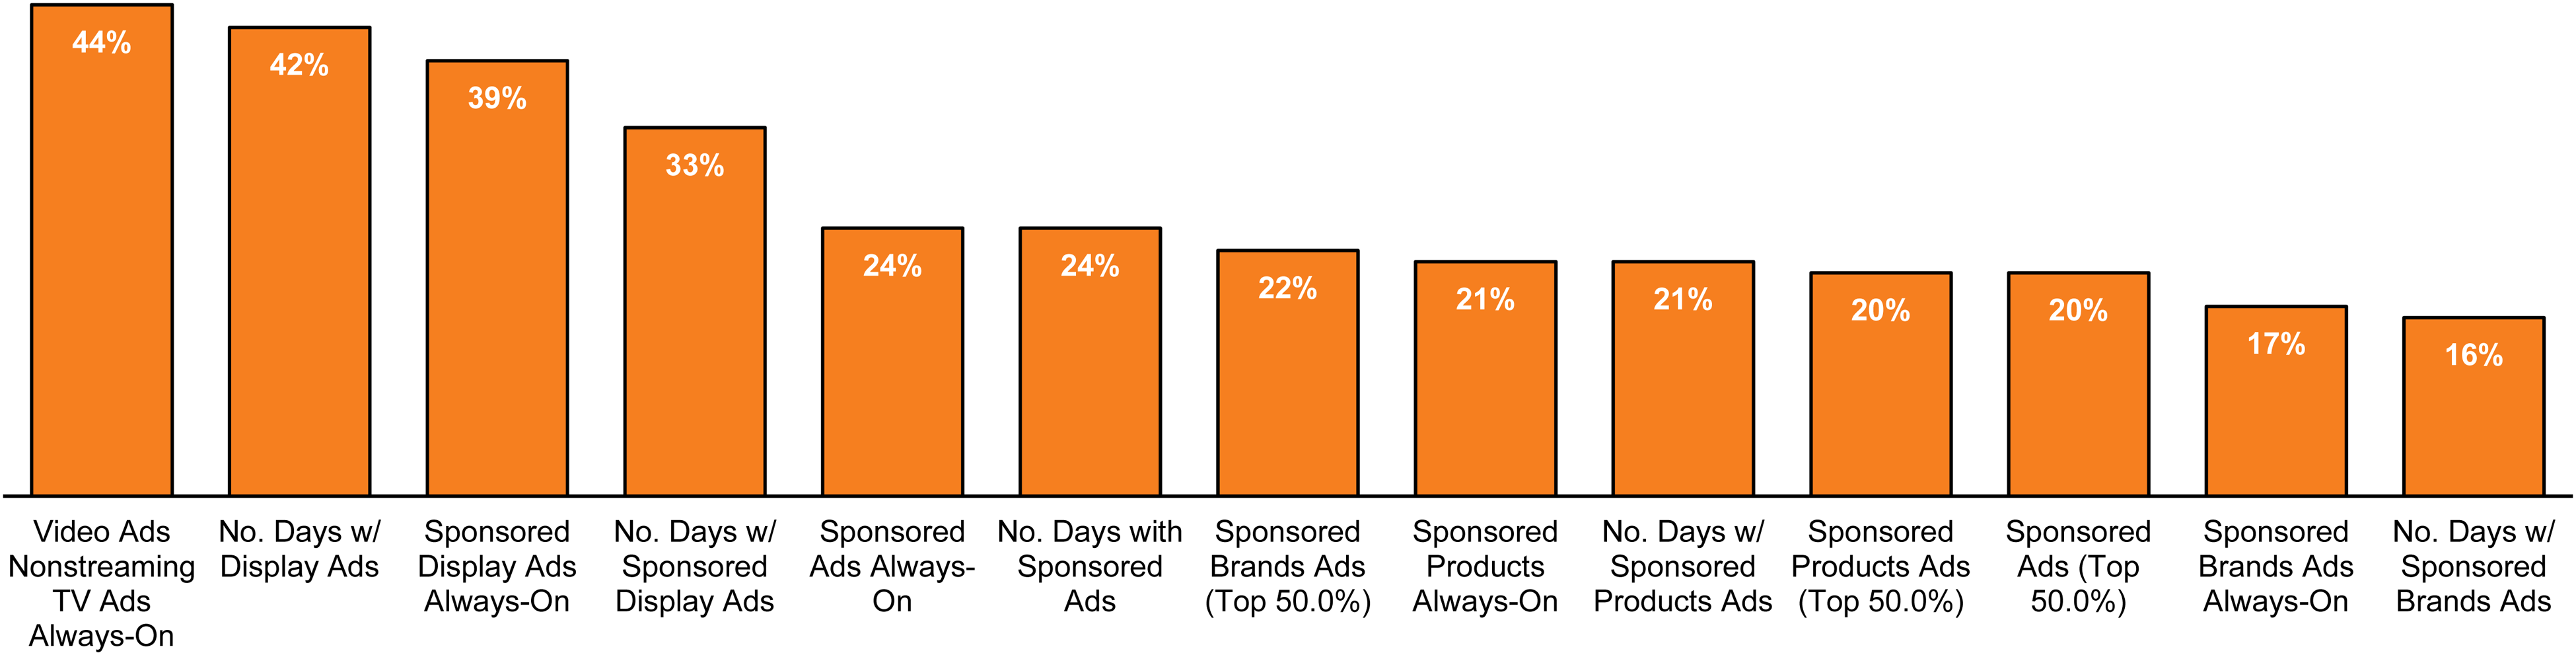
Contribution of Off-Site Sales to On- and Off-Site Sales for Different Ad Products.
Figure 3 depicts three key insights. First, as predicted in Table 5, the effect of all ad products on on-site sales is greater than the effect on off-site sales. That is, all off-site contribution shares in Figure 3 are smaller than 50%. Second, as predicted, we find that upper-funnel advertising (such as display ads, video ads [nonstreaming TV], and sponsored display ads) tends to have a relatively larger share of off-site sales contribution, with on average 39%, than lower-funnel advertising (such as sponsored products or brands advertising) that primarily impacts on-site sales, with an average share of off-site sales contribution of 19%. Third, we find that always-on-related ad products have a larger relative share of off-site contribution (29%) than non-always-on-related ad products, with an average contribution of 25%.
The higher off-site contribution of upper-funnel and always-on ads is consistent with validated theories of consumer decision journeys. In response to the retailer's initiated marketing, customers are more likely to stay in the same channel when the ad is close to the purchase stage in their “journey” or “funnel” (Pauwels, Aksehirli, and Lackman 2016; Wiesel, Pauwels, and Arts 2011). This applies in our setting to lower-funnel ad products such as sponsored product ads. In contrast, upper-funnel ads such as display, video, and TV are intended to reach audiences not yet close to purchase. Consumers may see the ad, think about the brand, and then start a search that can end up in a purchase in the current channel or other channels. In a similar manner, always-on spending helps reach consumers at any stage in the customer journey. Again, such customer–brand interactions can lead to purchases in the same or a different channel. It is because of these strong cross-channel effects that online display and search ads are more effective than traditional advertising, in settings ranging from apparel (Dinner, Van Heerde, and Neslin 2014) to office furniture (Wiesel, Pauwels, and Arts 2011).
Summary of Implications for Advertisers
Overall, we find that 13 on-site ad products are associated with higher off-site sales. These insights are important for brands. For example, we find that advertisers missed the opportunity to use these ad products in 225 periods across ad products. We find sizable contributions of off-site sales of 16%–44% for the different ad products on average across brands. The relative contribution tends to be greater for upper-funnel ad products such as those using always-on and display advertising. These advertising forms are positioned by the retailer as helping brands reach audiences in the awareness and consideration stages.
Discussion and Conclusion
Using a combination of survey data of more than 40,000 customers and their on-site behavior, we find a substantial degree of research on-site, purchase elsewhere behavior as a share of online category search activity (ROPES). On average, across ten product categories, we find that for every customer who searches in the product category on-site and purchases a product in the category on-site, 17 customers search in the product category on-site and then purchase a product in the category elsewhere. We propose a random forest ML approach to predict webrooming (ROPES) at scale. We show that the proposed brand-level approach can well predict the share of off-site purchases across three prediction scenarios: out-of-sample product categories, out-of-sample time periods, and out-of-sample brands. We find high correlations (.87–.81) between the predicted and actual shares of off-site purchases.
Using our proposed modeling approach to estimate ROPES and derive off-site sales, we examine the relationship between ad products and off-site sales. To this end, we apply an instrumental variable regression–based approach that controls for possible endogeneity of advertising to analyze the relationship between 27 retail media ad products and off-site sales for 12 major laptop brands in the United States across ten months in 2021. We find 13 on-site ad products that significantly increase off-site sales. We find sizable contributions of off-site sales of 16%–44% from the overall effect of the ad products on- and off-site for the different ad products. These findings highlight the importance for advertisers to consider the cross-channel effects of advertising. Table 4 goes deeper into our specific propositions on which types of retail media ads have the highest cross-channel effects as well as our future research directions on boundary conditions—also with regard to heterogeneity across brands, products and retailers.
How do our retail site findings relate to the broader literature on webrooming? First, our aggregate results are consistent with individual behavior studies showing that webrooming is pervasive (Guo, Zhang, and Wang 2022; Osbourne 2022). Moreover, our category-specific results support Guo, Zhang, and Wang’s (2022) survey findings that consumers webroom when buying high-risk informational products (such as printers in our study) and high-risk experiential products (such as running shoes in our study). We concur with their explanation that online search helps consumers reduce uncertainty for high-risk informational products, while enabling them to enjoy the opportunity to touch and feel high-experiential products. Indeed, the high importance of predictors such as the number of detail-page views on the online platform and the number of online reviews in predicting ROPES points to the informational value of online search prior to purchase. Interestingly, we also see high levels of ROPE behavior for toys, for which Chinese consumers prefer a single channel in Guo, Zhang, and Wang (2022), who label toys as a “low-risk” experiential product (scoring just below their threshold for high risk). Future research should address this discrepancy, which could be driven by our specific category of doll toys (for which consumers may require physical inspection and/or offline sales staff assistance), country differences (United States vs. China), or their survey sample of “young, urban and highly educated consumers” (p. 540). Combining actual webrooming behavior with consumer perceptions would help move these category distinctions forward. Likewise, future research can distinguish brands with better off-site presence, which should stimulate customers to buy off-site after researching the brand online (Table 4). In contrast, we don’t expect much webrooming for brands with little presence outside the online retail site. To this point, an interesting question for future research is whether some consumers use on-site search as a substitute for purchase, which would show up as supersaturation: after a threshold, more search leads to less buying. This behavior has been demonstrated for informational retail websites (Pauwels et al. 2011), but never for retailers that allow on-site purchases.
More generally, our findings are consistent with the emerging consensus on the important role of cross-channel behavior. The internet appears to be a preferred search channel because it provides fast and easy access to a vast amount of information, including reviews and answered questions, and thereby facilitates product evaluations (Verhoef, Neslin, and Vroomen 2007). In contrast, the physical store offers rich opportunities to experience the product through all senses and enjoy personal, interactive service (Pauwels and Neslin 2015). Therefore, online and offline channels act as complements to improve the consumer journey and also increase brand sales (Pauwels and Neslin 2015). In the words of Herhausen et al. (2019, p. 25), such multichannel consumers “should be served through multiple touchpoints in the search phase, and purchasing opportunities should be provided offline as well as online and mobile” and “served online in the search phase and offline in the purchase stage” by “providing an attractive online assortment and inspiration.” Still, diminishing returns should be a key topic for future research: To what extent does adding even more product assortment, information, and “inspiration” increase brand purchases on-site or off-site?
The effect of different online ad products on webrooming is a unique contribution of our study to literature. While Johnson, Lewis, and Reiley (2017) demonstrated the causal impact of online retail ads to offsite brand sales, they only had data on online display ads and therefore could not distinguish between different types of online ads. Previous conceptual literature is consistent with our finding that upper-funnel ads are more likely to increase webrooming because they are intended to raise awareness and consideration of consumers (Hanssens et al. 2014; Srinivasan, Vanhuele, and Pauwels 2010), who may then decide to buy the product elsewhere (Verhoef, Neslin, and Vroomen 2007). In contrast, lower-funnel ad products typically encourage consumers to “buy now” on the site. Still, more research is needed on such ad type differences. Our work is focused on top brands, which are likely to have stronger off-site presence than long-tail brands. We encourage future research to explore the effect webrooming on top versus long-tail brands. Finally, consumer segments likely differ in the relative benefits of online search and physical store purchase, depending on their distance to the physical store (Pauwels et al. 2011) and whether shopping is goal directed or experiential (Avery et al. 2012; Pauwels and Neslin 2015). Just as Gensler, Neslin, and Verhoef (2017) uncovered different consumer reasons to showroom, future research on webrooming should shed light on consumer reasons to webroom, from price to perceived quality and service time differences.
Would our findings generalize to other online retailers? We believe cross-channel effects should be higher for retailers with more and more trusted reviews, with more information and higher consumer search share (Table 4). The studied online retailer has a large assortment and rich product recommendation information (Flavián, Gurrea, and Orus 2021; Gielens and Steenkamp 2019). Therefore, we expect variation across retailers both in the number of consumers searching at the online retailer and the value they extract from searching on the retail website. A promising area for future research would be to distinguish consumer perceptions of different retailers in terms of relative benefits such as the time/effort savings and ease of mind (Orus, Gurrea, and Ibáñez-Sánchez 2019). To what extent does each retailer make consumers feel like “smart fans” (Pauwels et al. 2011, p. 13) or “confident and smart shopper[s]” (Flavián, Gurrea, and Orus 2019, p. 1)? Our considered use case focused on retail media advertising and did not take into account brand advertising in other channels. Future research could extend our analysis and include different advertising forms to compare their effectiveness with that of retail media. In addition, our approach concentrated on top brands. This offers an avenue for future research to apply our proposed methodology to study smaller brands with lower activity levels on the site. To this end, future research could oversample the customers of these brands in an accompanied survey to reach a sufficiently large enough number of off-site buyers to enable the training and testing of a subsequent ML model.
As to heterogeneity across time, our survey was conducted at the tail end of the COVID-19 pandemic, which may have affected the ratio of on-site to off-site purchases. Additionally, we avoided surveying people during the busy shopping period on the retail site during November and December. Future research could further explore the longitudinal robustness of our results. In particular, what are the theoretical implications of the extent and drivers of webrooming over time? Have consumer motives changed as a result of the pandemic? For one, Mende et al. (2023) draw on meaning-making theory and life course research to propose that some consumer behaviors (e.g., visiting offline stores) may quickly return to normal, whereas others can elicit turning point and cohort effects, such as decreased control and increased risk perceptions. Does extensive online search represent a risk-reduction strategy that is likely to endure?
Prior research has suggested that investigating products online prior to purchase allows consumers to arrive to the point of purchase with better knowledge about the product and its features (Viejo Fernández, Sanzo Pérez, and Vásquez-Casielles 2018). Furthermore, prior research argued that webrooming customers tend to exhibit higher involvement. Consistent with prior literature, we find that the strongest predictors of webrooming behavior include deeper consumer interaction on the site and particularly with respect to the focal brand. We encourage future research to uncover more brand-level drivers of webrooming that can help managers increase their purchase share of online searchers. In the analysis for this study, we controlled for possible endogeneity in the effect of advertising on off-site sales, using an instrumental variable approach. A methodological area for future research is to extend our findings by means of an A/B test to directly examine the causal effects of advertising on off-site sales.
Overall, we find that webrooming on online retail websites is substantial. Brands and advertisers on these sites should consider the effect of their presence and advertising on these sites on off-site purchases. Retail websites serve not only as a sales channel but also as major billboards for purchases occurring off-site.
Supplemental Material
sj-pdf-1-jnm-10.1177_10949968241246257 - Supplemental material for Amplifying Off-Site Purchases with On-Site Retail Media Advertising
Supplemental material, sj-pdf-1-jnm-10.1177_10949968241246257 for Amplifying Off-Site Purchases with On-Site Retail Media Advertising by German Zenetti and Koen Pauwels in Journal of Interactive Marketing
Footnotes
Acknowledgments
The authors thank the online retailer for its support for this research.
Editor
Sonja Gensler
Declaration of Conflicting Interests
The authors declared no potential conflicts of interest with respect to the research, authorship, and/or publication of this article.
Funding
The authors disclosed receipt of the following financial support for the research, authorship, and/or publication of this article: This work was supported by the online retailer.
Notes
References
Supplementary Material
Please find the following supplemental material available below.
For Open Access articles published under a Creative Commons License, all supplemental material carries the same license as the article it is associated with.
For non-Open Access articles published, all supplemental material carries a non-exclusive license, and permission requests for re-use of supplemental material or any part of supplemental material shall be sent directly to the copyright owner as specified in the copyright notice associated with the article.