
Abstract
Demand spillovers between distribution channels are critical for revenue streams in the music industry. Drawing on consumption capital theory, this study investigates the impact of a subscription (unsubscription) or upgrade (downgrade) in music streaming on live, physical, and digital music consumption. The propensity score matching approach applied to a biannual panel with six waves indicates that conversion in music subscriptions spills over to the live market and changes willingness to pay (WTP) and demand for live events. Converting from no streaming or free streaming to a premium subscription leads to a particularly high surplus in WTP and demand for live music. Unsubscribing or downgrading a music subscription decreases WTP and demand for live events. However, changes in music subscriptions are rather unrelated to physical and digital purchases. A scenario analysis indicates that deleting the free streaming option outperforms restricting the features available to free users. The authors provide contingencies of this finding.
After a period of steady decline in global sales of recorded music, since 2015 revenues have been increasing again, reaching U.S. $25.9 billion in 2021 (International Federation of the Phonographic Industry 2023). This renewed growth is mainly due to music streaming revenues (e.g., Spotify, the largest player in the market). As of 2021, music streaming revenues accounted for 65% of global revenues from recorded music. However, income from recorded music accounts for only 28% of the music industry's overall revenues; live music events are responsible for the remaining 72% (Federal Association of the Events Industry 2017). Therefore, labels and artists depend heavily on live music events as their major source of income, which is also the most profitable revenue stream in the digital music era (Wang 2018). Essentially, live music events “pay the bills for most artists” (Black, Fox, and Kochanowski 2007, p. 155), except for the most popular ones. Given the growth of the music streaming market and the importance of revenue from live events, labels and artists are interested in the demand spillovers that occur when consumers convert (subscribe, upgrade, downgrade, or unsubscribe) their music streaming subscriptions (subsequently referred to as music subscriptions), cannibalizing or promoting their live music events and their digital and physical albums.
Thus, we investigate the impact of different types of conversion of music subscriptions on live music events and physical and digital purchases. We propose a consumption capital–based theoretical framework in which a conversion stimulates the consumption capital accumulation process (Stigler and Becker 1977). Subscribing to a digital subscription plan or upgrading the subscription provides service features that make music consumption more convenient and reduce search costs, which facilitates the accumulation of consumption capital and shifts its level upward. Downgrading a digital music subscription or unsubscribing restricts service features or denies access to the service, which harms the acquisition of new consumption capital. The acquired stock of consumption capital dilutes over time if no further consumption is added to the stock. Changes in consumption capital affect cognitive, emotional, and behavioral engagement, which is observed as demand spillovers to other distribution channels. However, the magnitude and temporal pattern of demand spillovers depend on novel service feature usage as well as the perceived complementarity between salient attributes of the distribution channels. Thus, potential spillovers and corresponding revenue effects require an empirical investigation.
Our literature review reveals that, to date, previous research has not analyzed the impact of different types of conversions in music subscriptions on demand spillovers in live music and physical and digital purchases. Results from related literature indicate an important effect of service features on conversion behavior (e.g., Cziehso, Schaefers, and Kukar-Kinney 2019; Mäntymäki, Islam, and Benbasat 2020) and changes in consumption capital accumulation after a conversion. Music subscription adoptions increase total music expenditures (e.g., Wlömert and Papies 2016) through facilitated accumulation of consumption capital (e.g., more music discovery; Datta, Knox, and Bronnenberg 2018). Other studies observe demand spillovers between different music distribution channels (e.g., Aguiar and Waldfogel 2018), indicating their interrelatedness. However, these studies do not consider demand spillover effects in relation to conversions in music subscriptions.
We address this research gap and contribute to the literature by analyzing the impact of conversions in music subscriptions on live music and physical and digital purchases. In this context, we define conversions as users who change their music subscription and nonconversions as those who do not change their music subscription. We observe conversions in Spotify music subscription and changes in live, physical, and digital music consumption for each person over time, using online survey panel data. Beginning in winter 2018–2019, the panel data capture six biannual waves conducted over three years (n = 11,744 observations) at the individual level. We use propensity score matching to estimate the impact of a conversion and control for observed heterogeneity between users with and without changes in their subscription.
Our results indicate that changes in music subscription especially influence consumption of live music. Conversion in music streaming spills over to the live market and significantly changes willingness to pay (WTP) for live events. Subscribing or upgrading a subscription increases the WTP for live events per user by €16.6 in the 0–6 months and by €12.5 in the 6–12 months after conversion. Converting from no streaming to a premium subscription leads to a particularly high surplus of €28.2 (0–6 months) and €31.9 (6–12 months) in WTP for live music events and .8 additional live music visits (0–6 months after conversion). Thus, we provide empirical evidence that a conversion-induced change in consumption capital spills over to other music distribution channels.
We also show that users who unsubscribe (switching from either premium or free subscription to no subscription) or downgrade (switching from premium to free subscription) exhibit a decrease in WTP for live events by €32.9 (0–6 months) and €32.2 (6–12 months after conversion). Unsubscribing or downgrading a subscription further decreases the number of live events attended by 1.7 events per user in the first six months after conversion. Thus, we demonstrate that cutting the inflow of consumption capital reduces demand spillovers to the complementary distribution channel for live events. However, we observe no change in demand for physical and digital purchases if consumers change their subscription type.
We conduct a scenario analysis and consider whether streaming services can use additional restrictions in the service features or delete the free version to capitalize on the estimated promotional effect of music streaming on live music, increasing live and total revenues. We find that restricting the free streaming option increases total music revenues per user by €9.7, while deleting the free version leads to a total annual surplus of €18.5. We provide different contingencies for this finding, such as conversions of heavy users, different combinations of conversion rates for both interventions, and changes in the magnitude of demand spillovers.
Managerially, we provide new insights into conversion-induced demand spillover effects that occur when consumers change their music subscription. Conversion-induced spillovers are especially relevant in the current environment, as payouts from music streaming services are low for many artists and artists have even released albums as free giveaways to generate ticket sales (Paine 2010). Our research supports the industry and especially nonsuperstar artists by pinpointing a way to maximize total revenues and even realize a surplus, potentially leaving every party better off. Furthermore, the scenario analysis may help industry stakeholders decide whether and in what form to offer a free version to capitalize on the promotional effect on live music.
Conceptual Framework
Literature Review
Table 1 provides an overview of the various related literature streams and the contribution of our study. Extant literature discusses the role of service features in conversion decisions (literature stream 1a) and the consequences of a conversion (literature stream 1b). Other studies investigate the interrelatedness of music subscriptions and physical and digital purchases (literature stream 2a) as well as music subscriptions and live music (literature stream 2b). However, no study builds the link between conversion of music subscriptions and demand spillovers to live music and physical and digital purchases (literature stream 3). We review the relevant literature streams and discuss the main results.
Literature Overview.
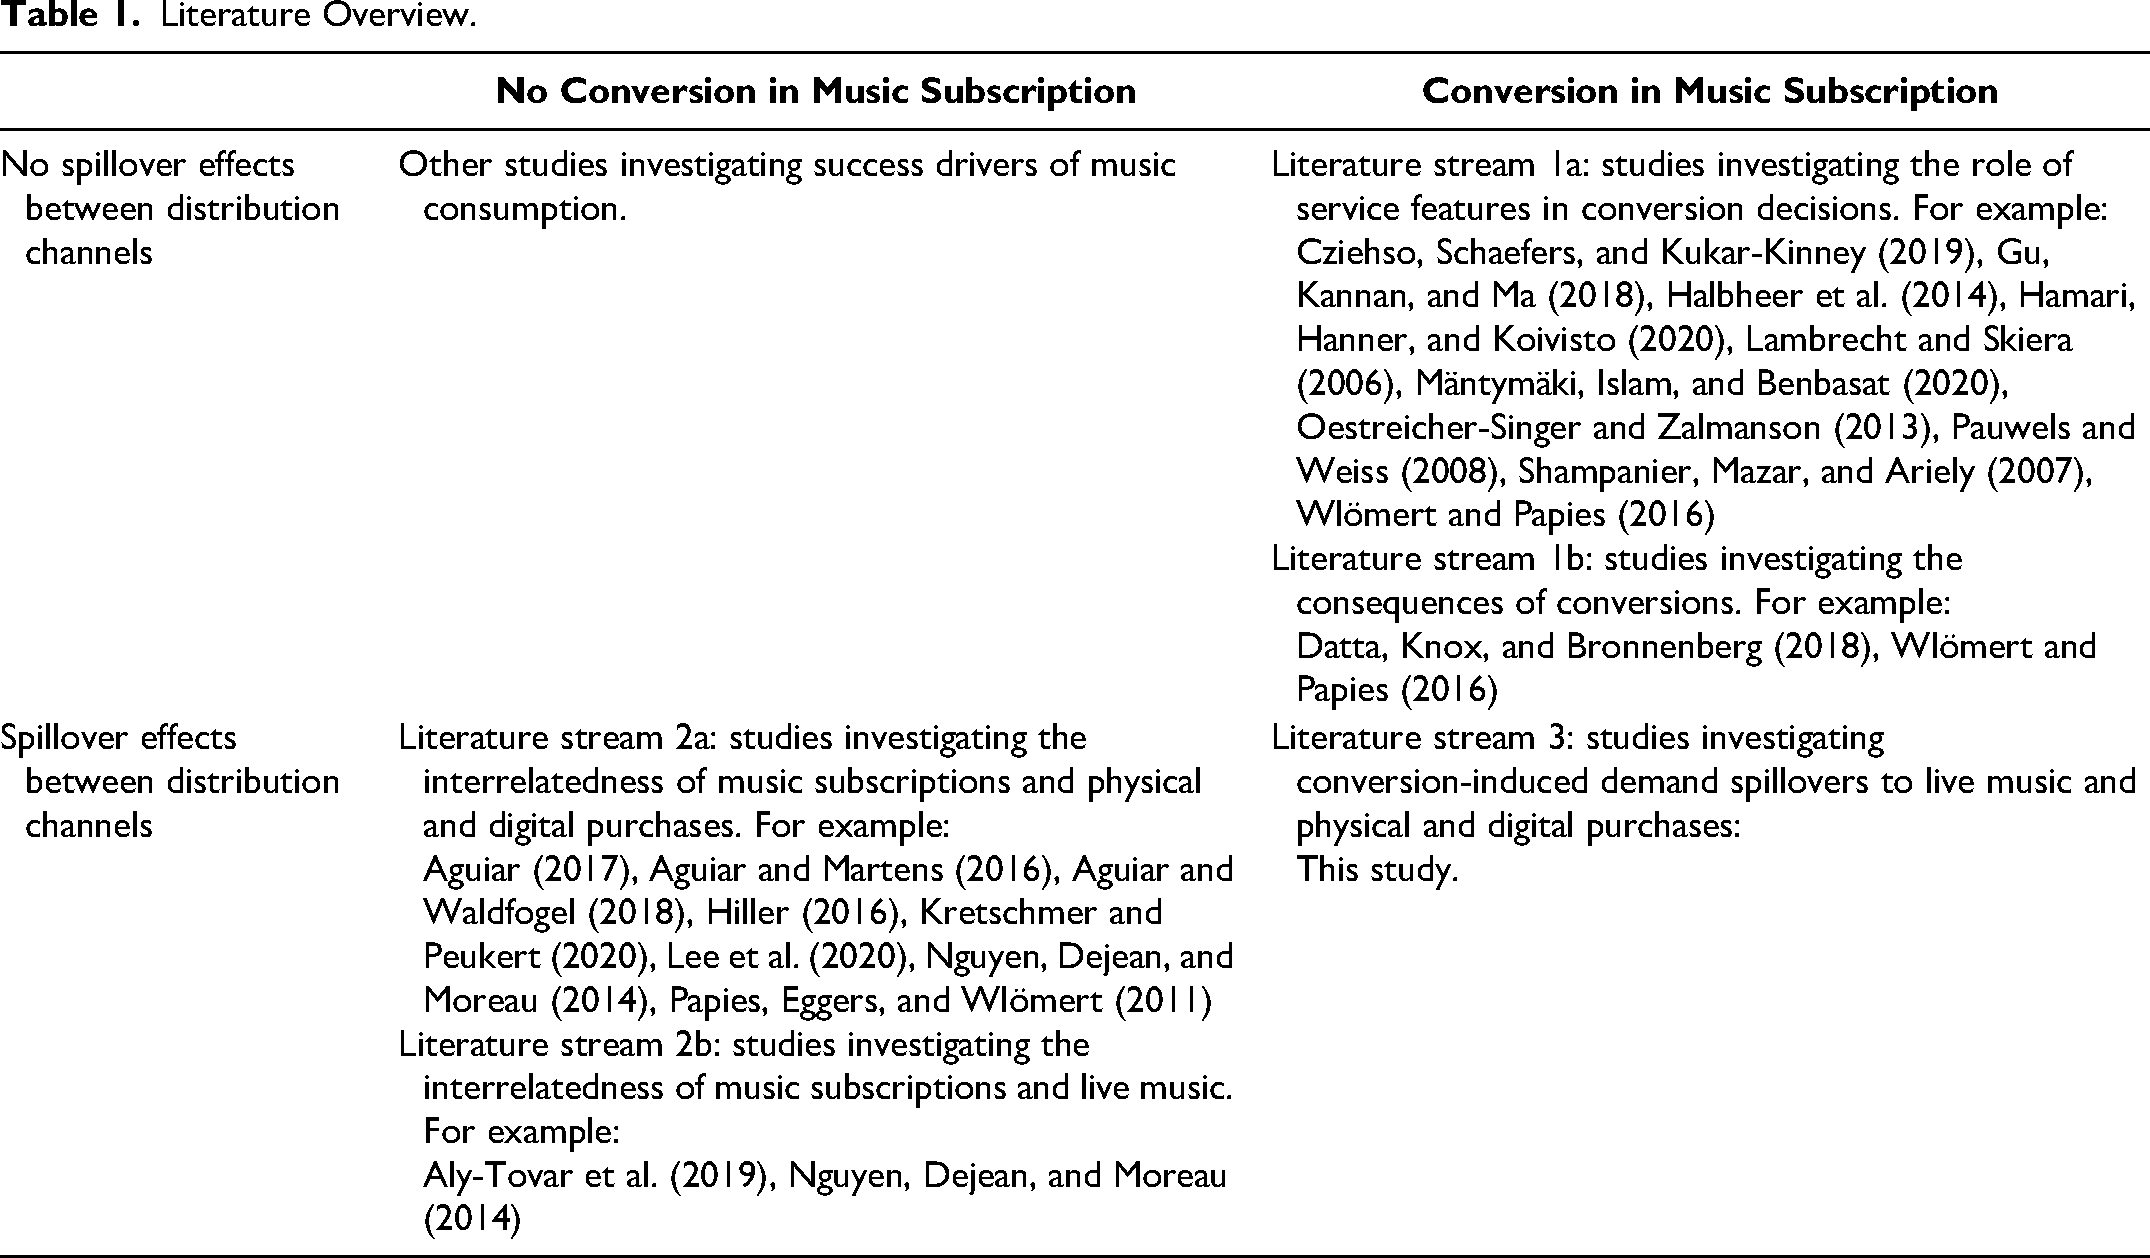
Different studies (literature stream 1a) investigate the role of service features on conversion behavior (e.g., that consumers subscribe to Spotify or upgrade their subscription). Extant research proposes the importance of service features (e.g., Gu, Kannan, and Ma 2018; Halbheer et al. 2014), and Cziehso, Schaefers, and Kukar-Kinney (2019) find that balancing the number of available features in the free version can increase purchase intention for the premium version. Mäntymäki, Islam, and Benbasat (2020) find that the enjoyment and cost related to the premium subscription predict the intention to upgrade to premium, while retention in the premium subscription is driven by ubiquitous and convenient accessibility of the service and features that enable users to discover new content. Streaming services may also decrease the utility of the free version (e.g., restricting the number of features) to incentivize users to adopt the profitable paid channel (Wlömert and Papies 2016), as users may become dissatisfied with the free version's value (Mishra et al. 2018). In line with this argument, Hamari, Hanner, and Koivisto (2020) propose the “demand through inconvenience” hypothesis, which claims that high enjoyment of the free version decreases the intention to switch to the premium version. Using data from the freemium service Last.fm, Oestreicher-Singer and Zalmanson (2013) show that a high level of community participation increases the utility of users and, subsequently, their WTP for the premium version. Furthermore, free customers overestimate the value of the free version due to the zero price effect (Shampanier, Mazar, and Ariely 2007), while the insurance, taxi meter, and overestimation effects (Lambrecht and Skiera 2006) motivate consumers to subscribe to a premium service even though they do not use most of the premium service features (flat-rate bias). Ultimately, Pauwels and Weiss (2008) discuss potential marketing interventions (e.g., price promotions) that facilitate the change from a free to a paid business model. However, these studies do not consider the link between conversion of music subscriptions and demand spillovers to live, physical, and digital distribution channels.
Considering the consequences of a conversion (literature stream 1b), Wlömert and Papies (2016) take a first step toward the overall effect of conversions on total music consumption. They investigate in a quasi-experiment the entry of Spotify into the German market and find that a subscription to music streaming has a positive effect on total expenditures for music driven by the positive revenue effect from premium streaming. Datta, Knox, and Bronnenberg (2018) observe Spotify adopters and nonadopters and find that subscribing to free or premium Spotify increases total consumption. Spotify adopters demonstrate more musical variety and discovery, especially in the adopted music subscription service, which indicates that a music subscription leads to a reduction in search costs and increases the stock of consumption capital. Therefore, music labels might be interested in consumers who subscribe to or upgrade their music subscription.
The second literature stream provides evidence of spillover effects between distribution channels without considering conversions in music subscriptions. In this context, we also review the impact of restricting or deleting the free version on demand spillovers. Considering spillovers from music subscriptions to physical and digital purchases (literature stream 2a), the results from Papies, Eggers, and Wlömert (2011) indicate that free advertising-based music subscription models can attract consumers who would otherwise refrain from downloading music. Aguiar and Martens (2016) study clickstream data and find a positive relation between clicks on legal music streaming websites and digital purchase websites, indicating a positive propensity to purchase music after clicking on music streaming websites. Lee et al. (2020) observe that music subscriptions are positively associated with increasing physical album sales. Moreover, Aguiar and Waldfogel (2018) show that both free and premium music subscriptions displace music downloads, but displaced sales are outweighed by music subscription revenues. However, imposing a listening cap (restricting the free version) decreases the traffic on music download websites of French heavy free streamers (Aguiar, 2017). Kretschmer and Peukert's (2020) estimates indicate a promotional effect from the availability of legal free sampling (e.g., user-generated or professional online music videos) on physical and digital purchases. In contrast to this finding, Hiller (2016) studies the deletion of free sampling on YouTube and finds that especially physical sales of top artists benefit from the deletion.
Considering spillovers from music subscriptions to live music (literature stream 2b), a survey of French artists indicates that artists who receive most of their revenues from live events perceive free music streaming as a promotional tool for their live shows (Aly-Tovar et al. 2019). A consumer survey confirms this finding and reports positive demand spillovers from free music subscriptions to attendance at live music events for national and international artists (Nguyen, Dejean, and Moreau 2014). However, these studies do not examine whether the spillover effects are driven by conversion of music subscriptions.
The third stream (Table 1; literature stream 3) is captured by this study and links music subscription conversions and pertaining demand spillover to live music and physical and digital purchases, which have not been addressed in extant literature. We address this research gap by analyzing a panel data set and estimating the impact of a conversion on live, physical, and digital music consumption.
Theoretical Background
We present our framework in Figure 1, which builds the link from conversions in music subscriptions (“1” in Figure 1) over changes in the consumption capital accumulation process (“2” in Figure 1) to changes in the demand spillover on live music and physical and digital purchases (“3” in Figure 1).
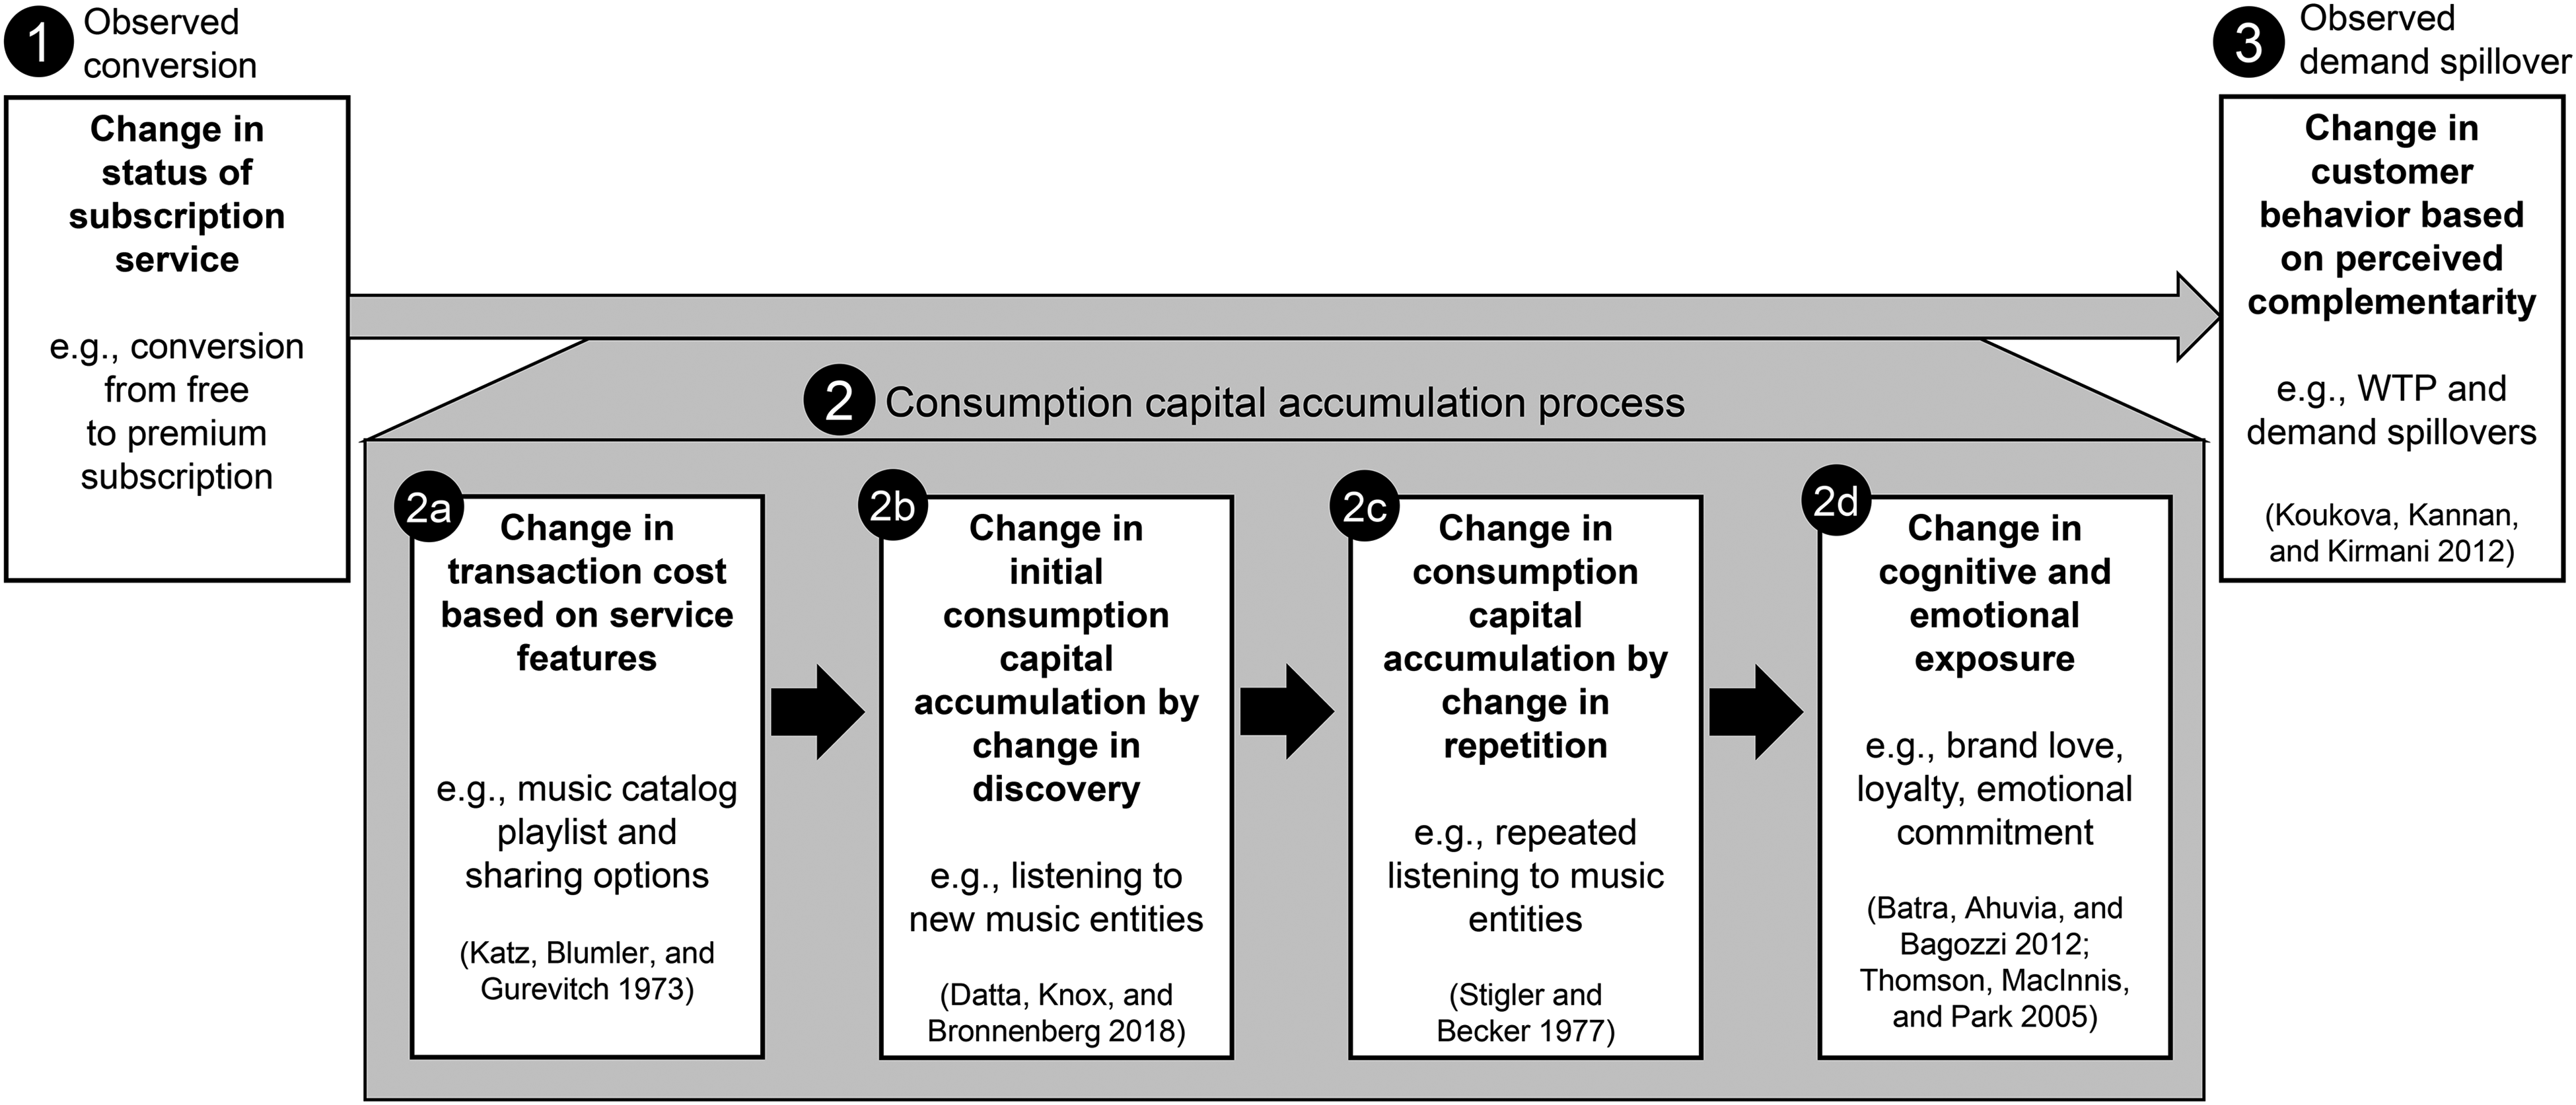
Theoretical Framework.
In this context, we focus on users and nonusers of a music streaming service and consider subscriptions and upgrades, in addition to downgrades and unsubscriptions. We capture demand spillovers from music subscription consumption to live music and physical and digital purchases. We propose an underlying consumption capital accumulation process (Stigler and Becker 1977), which explains the direction and magnitude of demand spillovers to live music and physical and digital purchases. Each conversion changes consumers’ access to different service features (“2a” in Figure 1), which changes the search costs and interactions with musical entities (Lemon and Verhoef 2016). When users decide to subscribe, they unlock additional touchpoints with musical entities. They gain access to large music libraries with millions of songs, which increases music discovery (e.g., new artists) and music repetition (e.g., algorithmic playlists based on prior music consumption). Additionally, many streaming subscription services provide social features for premium customers to share music preferences with their peer groups and observe others’ music tastes to satisfy specific consumer needs for social belonging (e.g., Katz, Blumler, and Gurevitch 1973). Consumers upgrading or downgrading to a free music subscription have (reduced) music library access without a monthly fee at the expense of advertising and restrictions in service features. Consumers converting to no subscription need to access content through other free channels (e.g., online radios), which are noninteractive and do not allow searching for music, making music consumption less convenient.
Consumers build a stock of consumption capital for musical entities starting with the first interaction (“2b” in Figure 1) with a musical entity (e.g., first song listened to). With each consumption, consumers convey feelings, fantasies, and emotions (Hirschman and Holbrook 1982) and experience different music facets (e.g., understanding and remembering lyrics). With each additional consumption (“2c” in Figure 1), consumers further strengthen associations between the music and experiences (e.g., first date song), increasing the stock of consumption capital. A subscription or an upgrade increases the level of music consumption and shifts consumption capital to a higher level. Even if the consumption of specific musical entities (e.g., an artist or song) slows down at some point after repeated consumption, overall music streaming consumption remains at a higher level as Spotify continuously provides new music (e.g., through playlists based on prior music consumption). The increase in the magnitude of consumption capital accumulation in the conversion period is particularly strong when consumers are triggered by novel service features that were previously unavailable to them (Hirschmann 1980). This novelty of service features decreases gradually with repeated usage (wearout effect; Wu and Huberman 2007), thereby mitigating the magnitude of the consumption capital accumulation in the postconversion period. However, these novelty-driven consumption capital accumulation patterns may be delayed when novel service features are unfamiliar to consumers immediately after conversion, and their utility increases only after repeated usage (wear-in effect).
Unsubscriptions and downgrades reduce music consumption, thereby reducing the acquired stock of capital over time through time-related decay and interference-based forgetting (e.g., when attention is occupied by concurrent consumption; Portrat, Barrouillet, and Camos 2008) if no further consumption is added to the stock. Some users might switch to competitive offers such as Google Music, which compensates for the break in the accumulation of consumption capital by the downgrade or unsubscription from Spotify. In our data of German Spotify users, we do not detect substantial switching behavior to competitive free and premium services after downgrading or unsubscribing from Spotify. This pattern indicates that unsubscribing or downgrading is not predominantly because of Spotify customers’ dissatisfaction and might instead be driven by a flat-rate bias (Lambrecht and Skiera 2006). Other consumers stimulate consumption capital when they switch to illegal music consumption, such as peer-to-peer networks, but we expect that this phenomenon is limited to a very low number of consumers (Clement, Rangaswamy, and Vadali 2012).
An increase in consumption capital impacts the marginal utility for the respective musical entity, fostering cognitive and emotional (“2d” in Figure 1) as well as behavioral (“3” in Figure 1) engagement (Dessart, Aldás-Manzano, and Veloutsou 2019). Greater cognitive and emotional engagement stimulates music-specific perceptions and feelings toward the consumed musical artist or song. These perceptions and feelings become stronger with repeated consumption, thereby increasing brand love (Batra, Ahuvia, and Bagozzi 2012) and long-term attachment to the musical entity (e.g., artist, song) with emotional commitment (Thomson, MacInnis, and Park 2005). Furthermore, Shankar and Bayus (2003) find that engaged members of a service respond more positively to marketing activities. This idea can be transferred to consumers with a high level of consumption capital as these consumers are likely to be more responsive to marketing messages (fan engagement). The break in consumption capital from unsubscriptions and downgrades decreases consumers’ awareness, thereby deleting musical entities from the consideration set (Macdonald and Sharp 2000) and decreasing brand love.
Finally, cognitive and emotional engagement stimulates musical entity behavior (“3” in Figure 1). Subscriptions and upgrades increase cognitive and emotional exposure, which can spill over to demand for distribution channels. On the contrary, unsubscriptions and downgrades harm cognitive and emotional exposure, potentially stimulating negative demand spillovers to distribution channels. The direction and magnitude of demand spillovers depend on the perceived degree of complementarity of salient attributes of the distribution channels. With each conversion, a change occurs in the perceived complementarity of salient attributes of the music subscription and the other distribution channels (Koukova, Kannan, and Kirmani 2012). For example, consumers subscribing or upgrading gain salient attributes that are complementary to those of live music, inducing positive demand spillovers. In particular, entering a premium subscription with unlimited access to prerecorded music content complements the social experience of attending prechoreographed live music events in real time. Unsubscribing or downgrading decreases the perceived complementarity of salient attributes of the subscription and live music. However, changes in music subscriptions lead to no or even negative demand spillovers if distribution channels are unrelated (e.g., serving distinct customer segments) or provide substitutive salient attributes (e.g., both distribution channels offer unlimited music access).
Methodological Framework
Data
We collected an extensive panel data set at the individual level to investigate the impact of conversions in music subscription on demand spillovers in other distribution channels. Table 2 presents descriptive statistics. We report further information on the online survey (Figure W1), the sample selection (Table W1), the panel structure (Table W2), and representativity (Table W3) in the Web Appendix. The structure of the data enables us to observe conversions in the Spotify music streaming service and changes in live, physical, and digital consumption for each user over time. The panel data include six biannual waves of an online survey (Clement et al. 2021) with 11,744 observations, beginning in winter 2018–2019 and representing the German population age 18–70 years. The respondents were incentivized and recruited by the market research institute Respondi according to quotas representative of Germany for age, gender, education, employment status, and children (see Table W3). 1
Operationalization and Summary Statistics.
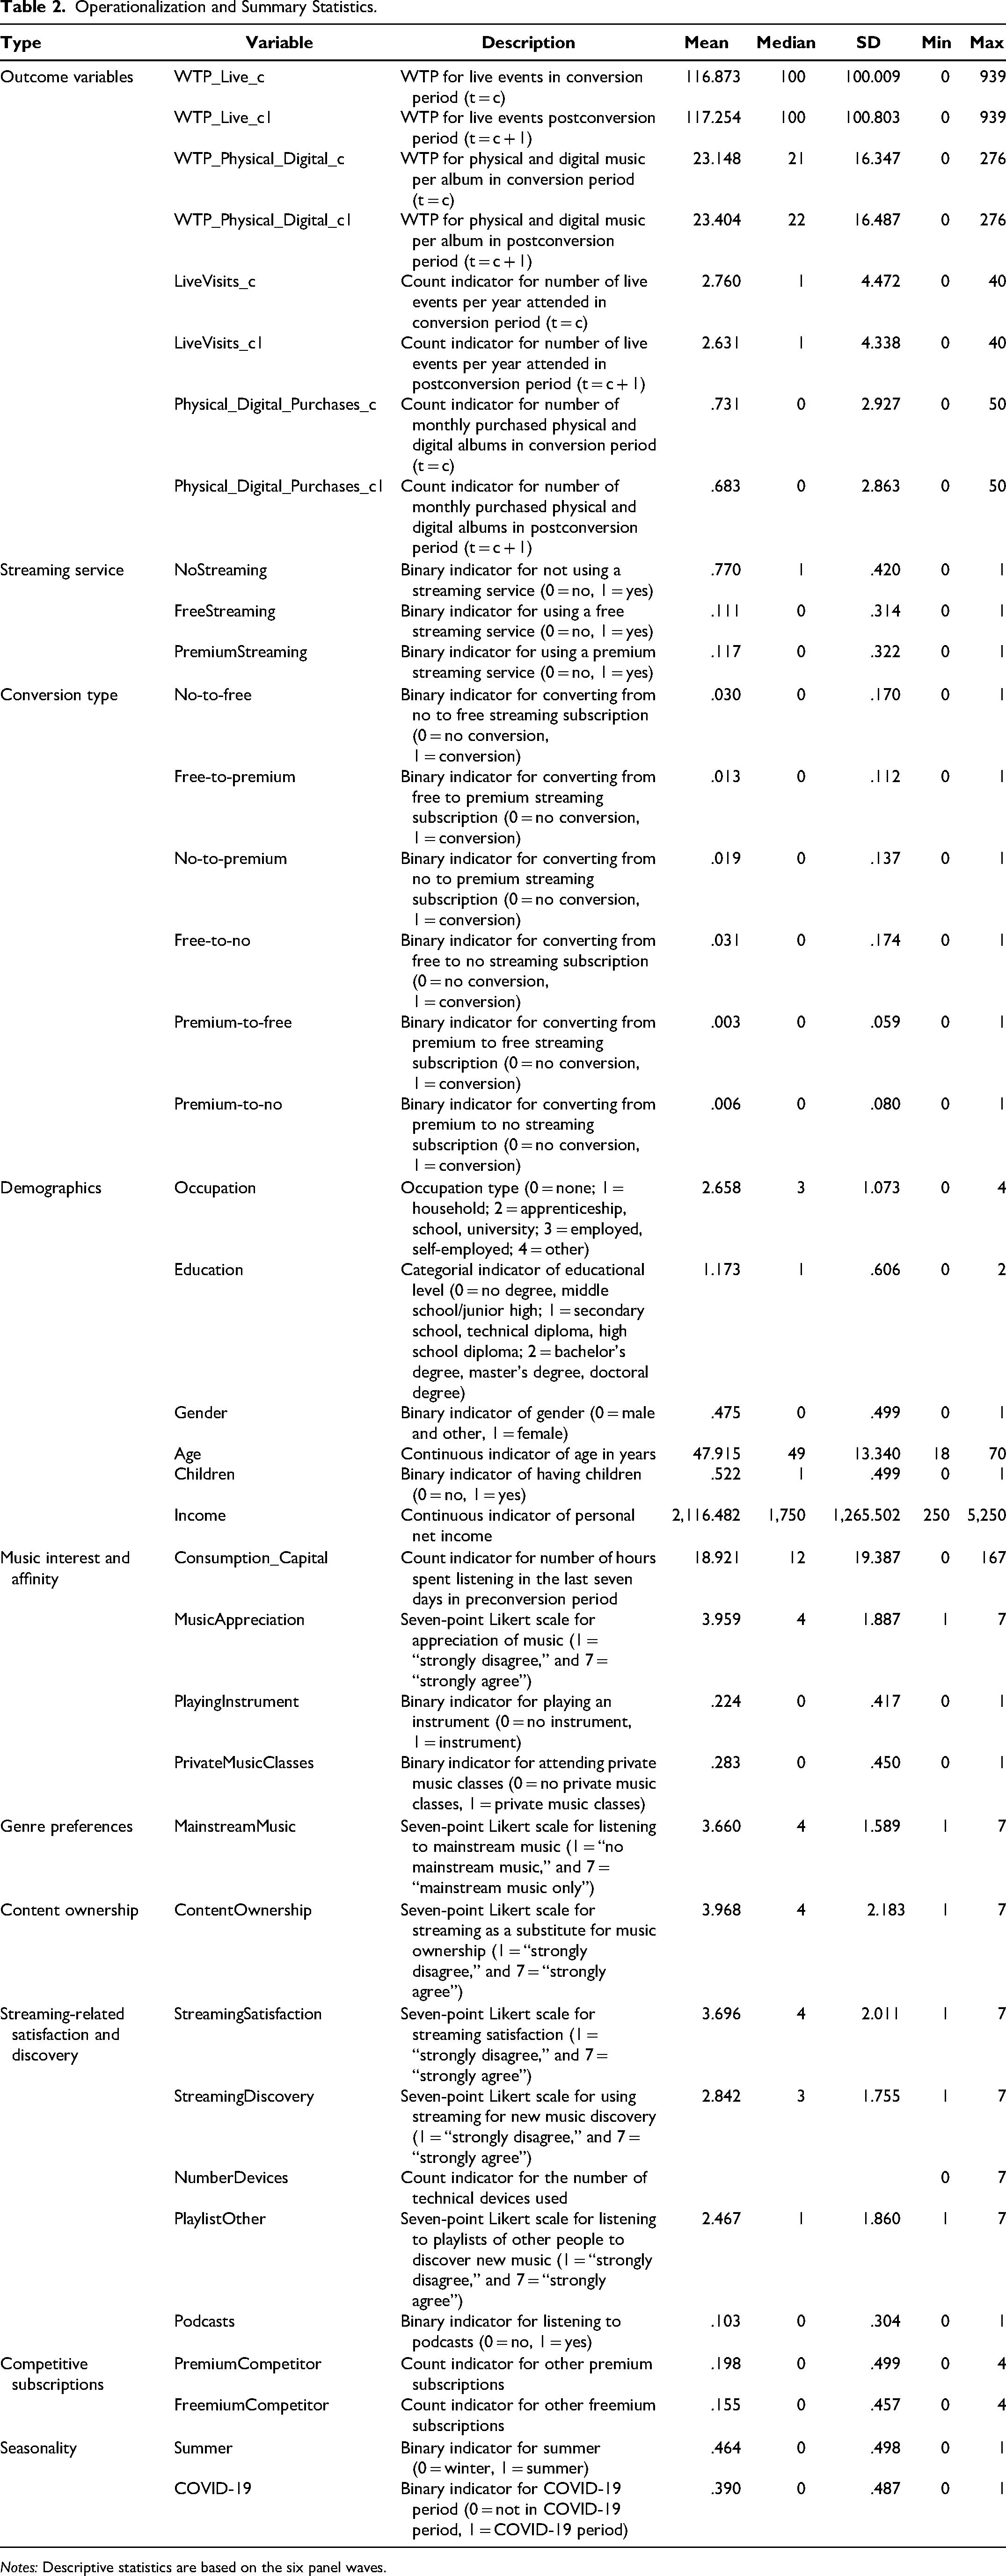
Notes: Descriptive statistics are based on the six panel waves.
We observe subscriptions and upgrades as well as unsubscriptions and downgrades in the Spotify music streaming service using two binary indicators. In addition, we use binary indicators to differentiate changes in users’ Spotify music subscription in terms of conversions from no to free subscription, no to premium subscription, and free to premium subscription as well as conversions from premium to no subscription, premium to free subscription, and free to no subscription.
We measure the WTP for live, physical, and digital music in euros, live events attended, and physical and digital albums purchased with count indicators (Table 2). We treat WTP for live music as indicating the cumulative value of the subcategory's concerts, festivals, and club concerts. The WTP for live music per year is €116.9 on average and is €23.1 on average for physical and digital purchased albums. The respondents reported attending 2.8 live events per year and purchasing .7 digital or physical albums per month.
We integrate an extensive set of control variables to capture individual heterogeneity. We include relevant demographic data, such as occupation, education, gender, age, children, and income. The average respondent age is 47.9 years for the full sample (Spotify free: M = 41.5 years; Spotify premium subscribers: M = 36.9 years); 47.6% are female, 52.3% male, and .1% other; and 52.2% have children. We collected data on music interest and affinity with several indicators. We measure consumers’ consumption capital as the number of hours spent listening to music in the last seven days (M = 18.9 hours) and music appreciation on a seven-point Likert-type scale (M = 3.96; 1 = “no appreciation,” and 7 = “strong appreciation”); 22.4% of respondents play an instrument, and 28.3% attend private music classes. We operationalize content ownership (M = 3.97; 1 = “strongly disagree,” and 7 = “strongly agree”) and the streaming-related control variables streaming satisfaction (M = 3.70; 1 = “strongly disagree,” and 7 = “strongly agree”) and streaming discovery (M = 2.84; 1 = “strongly disagree,” and 7 = “strongly agree”) on seven-point Likert scales. Regarding the competitive environment, 20.0% of respondents have at least one premium subscription to another music streaming service, and 15.5% have other freemium music subscriptions. We control for seasonality and the onset of the COVID-19 pandemic using binary indicators that identify summer (M = .46; with 1 = summer) and COVID-19 periods (M = .39; with 1 = COVID-19 period).
Model-Free Evidence
We provide model-free evidence that an increase in consumption capital spills over to WTP and demand in other distribution channels. As shown in Figure 2, we observe substantial differences among premium streamers, free streamers, and nonstreamers. Respondents with a Spotify premium music subscription have a higher WTP for live music than free streamers and nonstreamers (see Table W4 in the Web Appendix; t-test with Bonferroni adjusted p-values, all ps < .01). Comparing the mean number of annual live visits, we again observe the same pattern of substantial differences among the three music subscription types (Table W4). Again, premium users attend more live events than free streamers and nonstreamers.
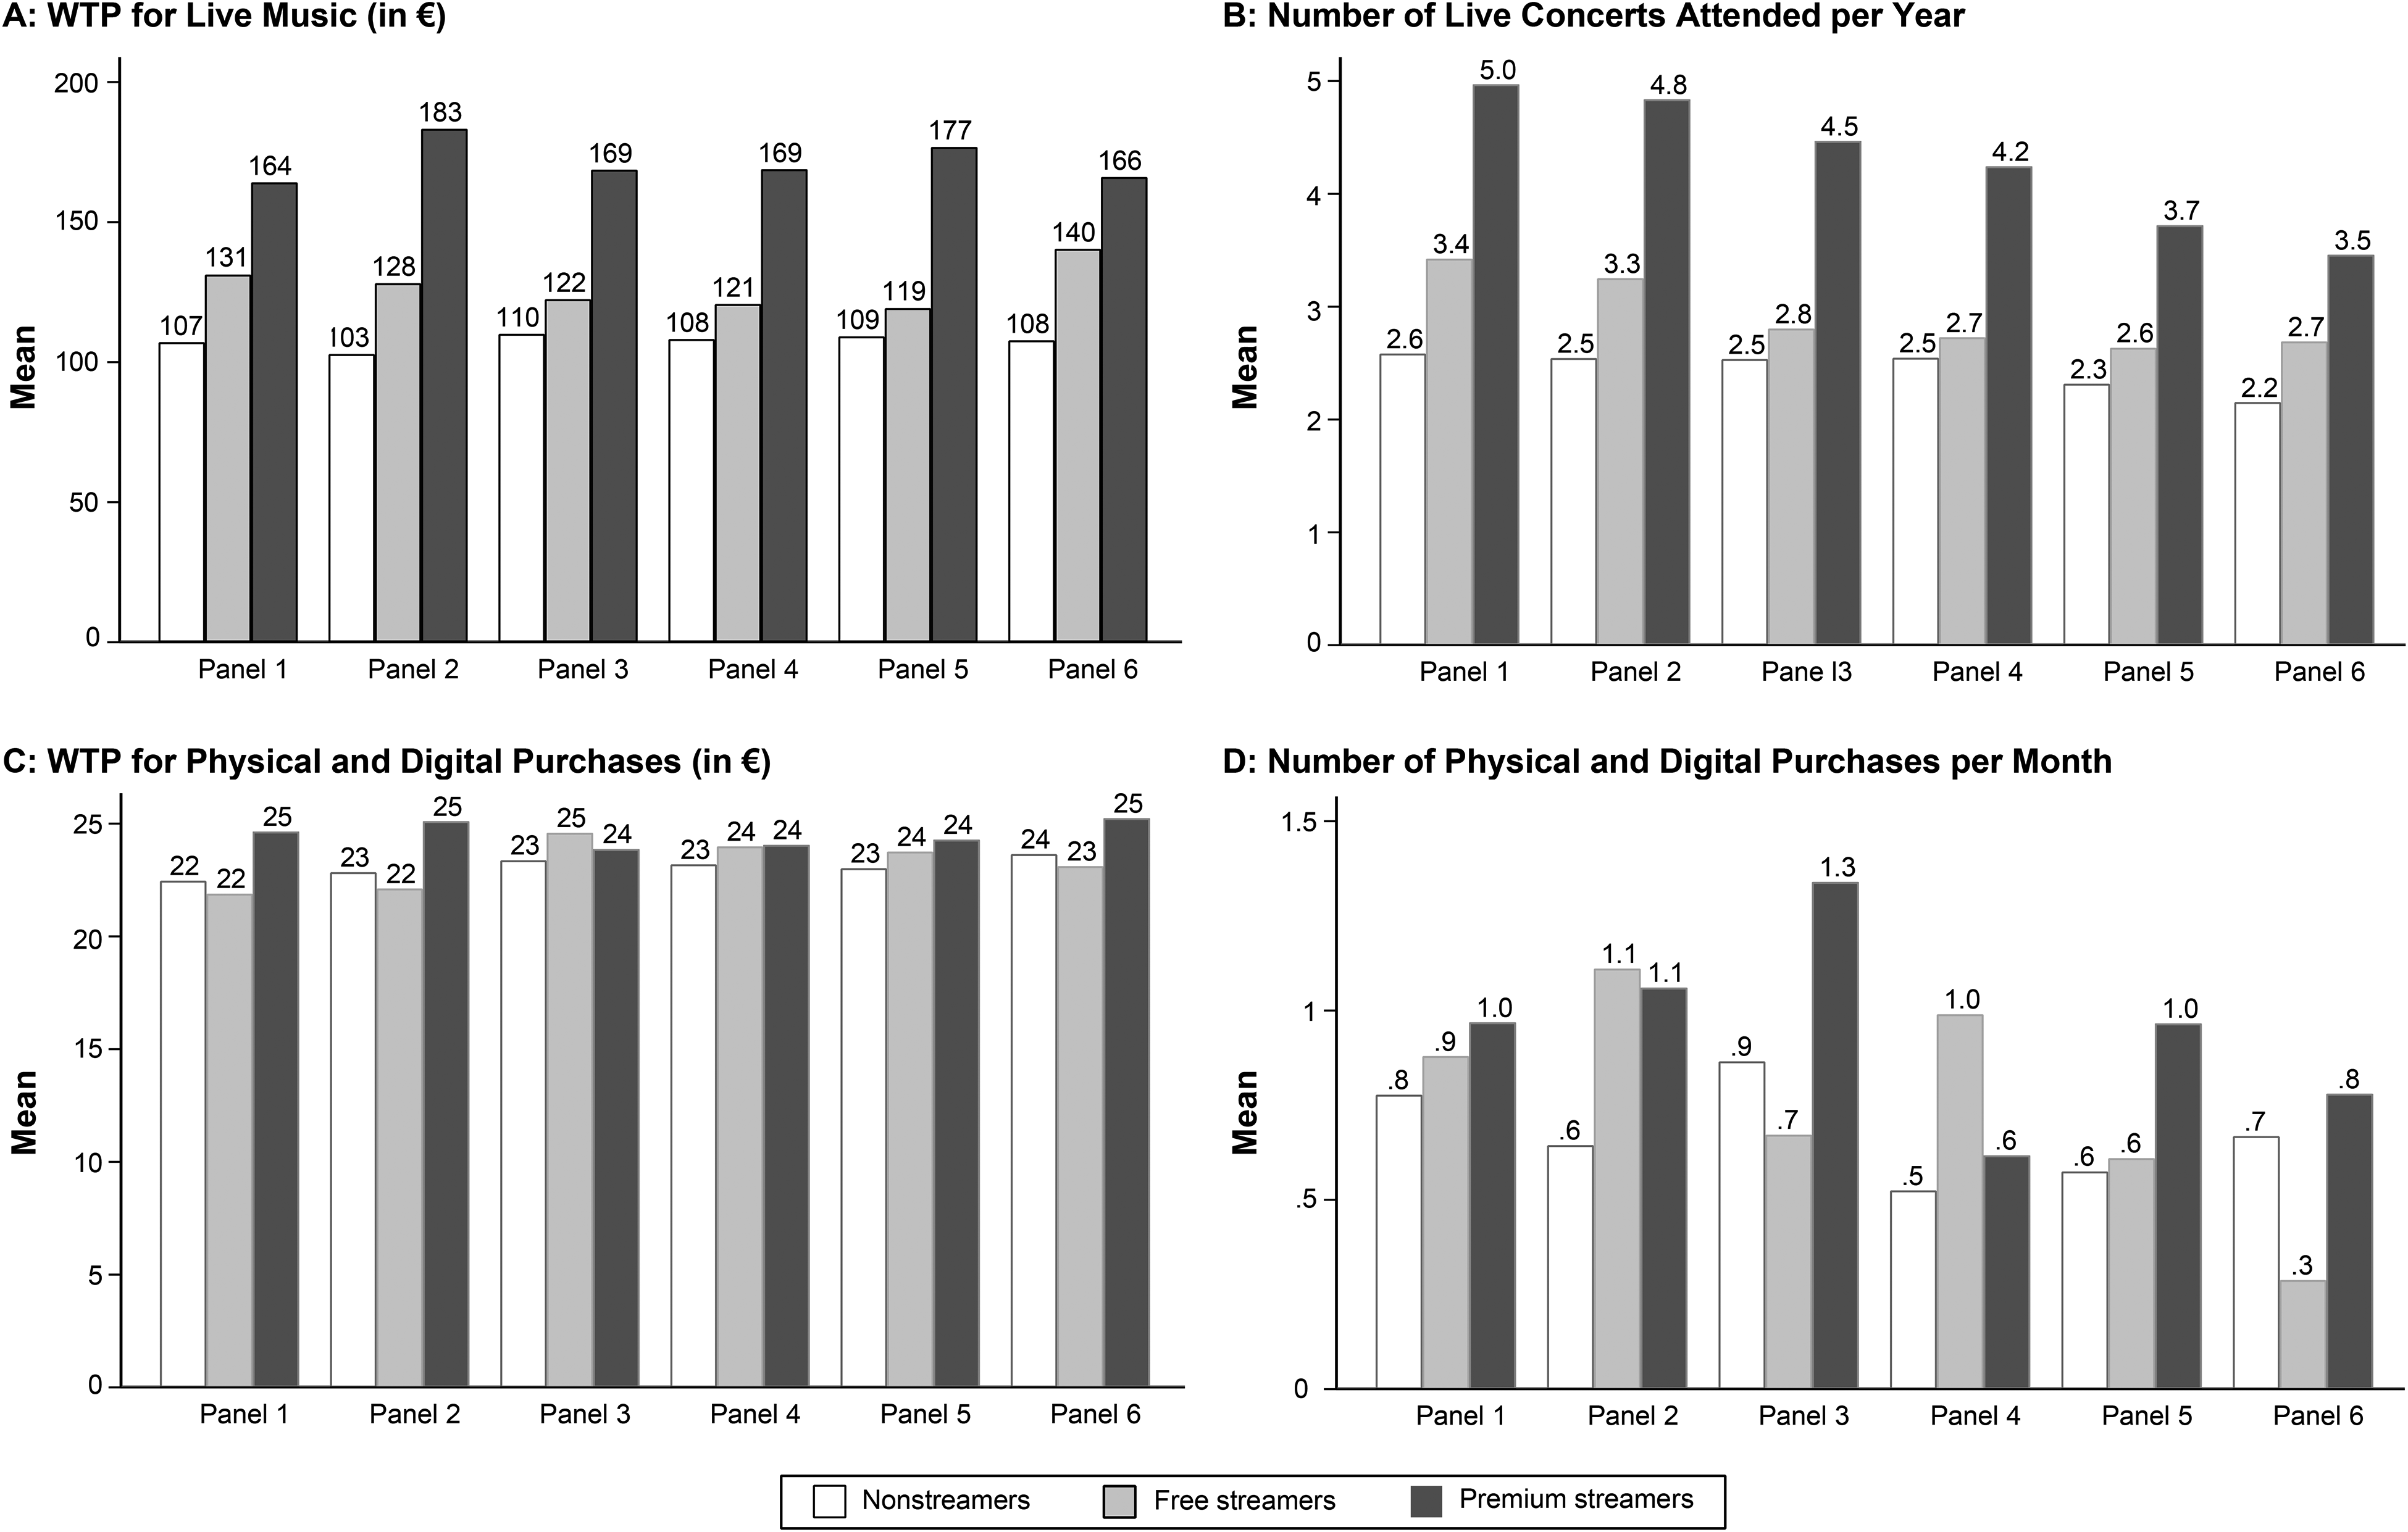
Model-Free Evidence of Music Consumption by Subscription Type.
Figure 2 further indicates that WTP for physical and digital purchases only increases for premium music subscriptions. Premium streamers have substantially higher WTP than nonstreamers and free streamers (Table W4 in the Web Appendix). However, the number of purchases only differs between nonstreamers and premium streamers. Overall, a mean comparison of premium streamers, free streamers, and nonstreamers indicates that subscription type especially influences consumption of live music, while subscription type slightly influences physical and digital purchases. Consequently, artists and labels should benefit from converting consumers to the premium version. Comparing free and premium streamers, we observe an underperformance of free streamers. Thus, the industry might consider deleting the free version or making this version inconvenient, to induce more consumers to convert to premium.
However, differences in group means might be driven not by the subscription type but by the difference in underlying characteristics among premium streamers, free streamers, and nonstreamers. For example, these groups could differ in demographics, music interest and affinity, and streaming-related factors (e.g., preference for content ownership). To disentangle these effects and determine the impact of a conversion in music streaming on demand spillover in other distribution channels, we need an econometric model that accounts for potential self-selection bias, which we discuss in the next section.
Modeling Strategy
We analyze the impact of conversions in music subscription on demand spillovers in other distribution channels and use propensity score matching to account for self-selection biases (Rosenbaum and Rubin 1983) in individual streaming type choice. Propensity score matching is a common method used in various disciplines (Davies 2003; Heckman, Ichimura, and Todd 1997; Perkins et al. 2000) and has received considerable attention in the marketing field (e.g., Ballings, McCullough, and Bharadwaj 2018). The cross-sectional matching procedure balances observed heterogeneity between individuals converting and not converting to disentangle the self-selection bias and estimate the impact of the conversion on music consumption in other distribution channels. We use an extensive set of covariates to capture observed heterogeneity between users in different conversion types. Finally, we assume that a respondent's conversion status does not have an impact on other respondents’ conversion (stable unit treatment value assumption), which seems reasonable considering that converting one’s subscription is a personal decision.
Econometric Model
Figure 3 provides an overview of our modeling approach. We investigate a freemium model with consumers that have no subscription, a free subscription, or a premium subscription from Spotify. We test how a conversion s of consumer i in the Spotify music streaming service in period t (Cist) affects consumption in distribution channel f in periods t = c and t = c + 1 (Yisft).
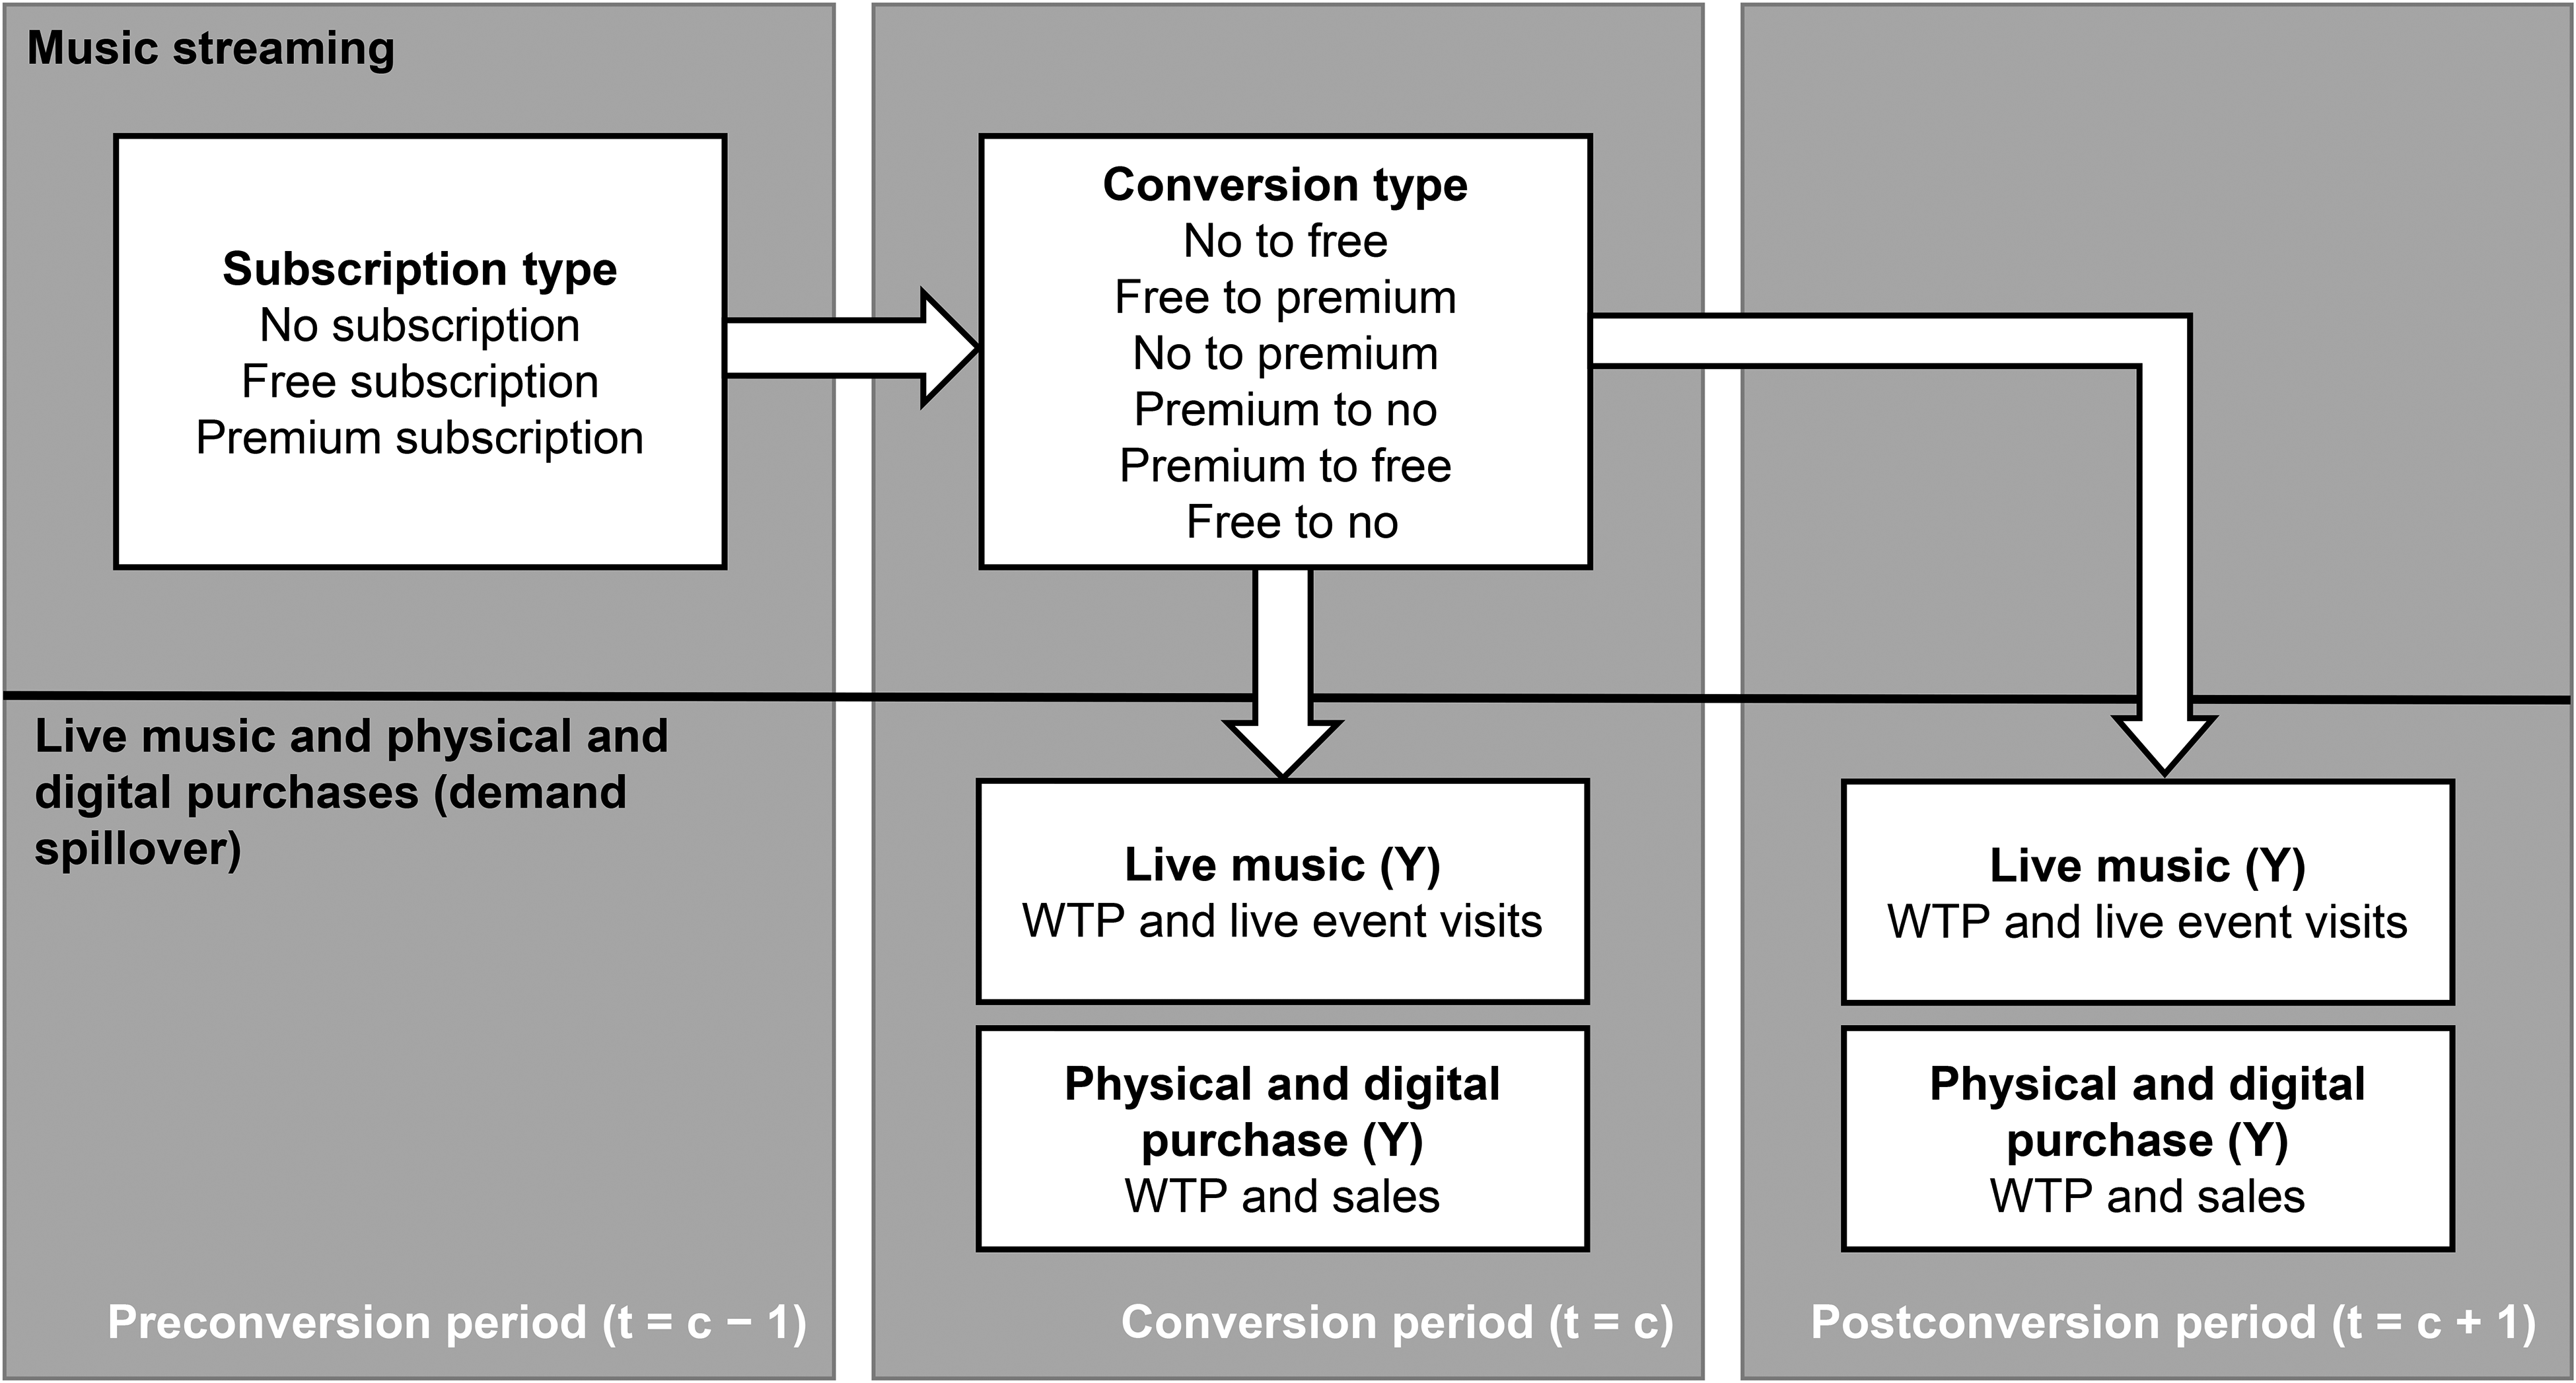
Modeling Strategy.
We model conversions Cist using a binary indicator that equals 0 if consumer i remains a nonstreaming, free streaming, or premium streaming consumer and equals 1 in the period after the observed conversion (t = c) along with the following periods until another conversion is observed. We consider six conversion types (s): no to free streaming, free to premium streaming, no to premium streaming, premium to no streaming, premium to free streaming, and free to no streaming.
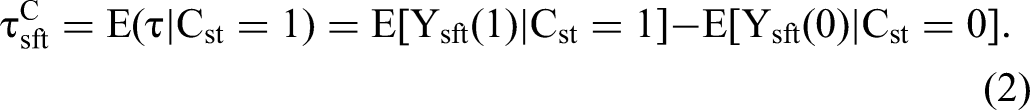
However, we can only observe one of these potential outcomes Yisft for each consumer, and the counterfactual outcome is unobservable. Furthermore, we expect that the different types of consumers are not randomly assigned to their conversion type s, which may bias a simple comparison of the mean outcomes. Our empirical data confirm this notion and indicate that consumers differ in characteristics other than just the decision to convert. Therefore, we use propensity score matching to find a proper substitute for the unobservable component E[Yisft(0)|Cist = 0] and approximate the counterfactual live music and physical and digital purchases of consumers in the nonconversion group by calculating the probability of being in the conversion group and finding users with similar propensity scores in the nonconversion group. Following Rosenbaum and Rubin (1983), we estimate for each individual i and conversion type s a balancing score Pist(Xit), which is a function of the relevant factors specific to individual i, capturing observed heterogeneity Xit, such that the conditional distribution of Xit given Pist(Xit) is independent of the assignment to the conversion Cist. Balancing the observed heterogeneity between users with and without conversion, we ultimately compare the outcome in WTP and demand for live music and physical and digital purchases per user. Equation 3 denotes the propensity score estimator, which is the mean difference in outcomes f, specific to conversion type s and period t, weighted by the propensity score Pist(Xit) of the users with conversion, as denoted by 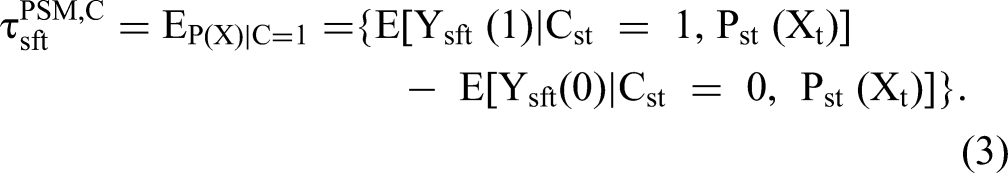
Model Estimation
We apply this estimator to the outcomes (Yisft) of WTP and demand for live music and physical and digital purchases, which are specific to individual i, conversion type s, distribution channel f, and the periods t = c and t = c + 1. Following Caliendo and Kopeinig's (2008) approach, we run binomial logit models to estimate the propensity scores Pist(Xit), with βs being the coefficients specific to conversion type s, distribution channel f, and period t. The vector 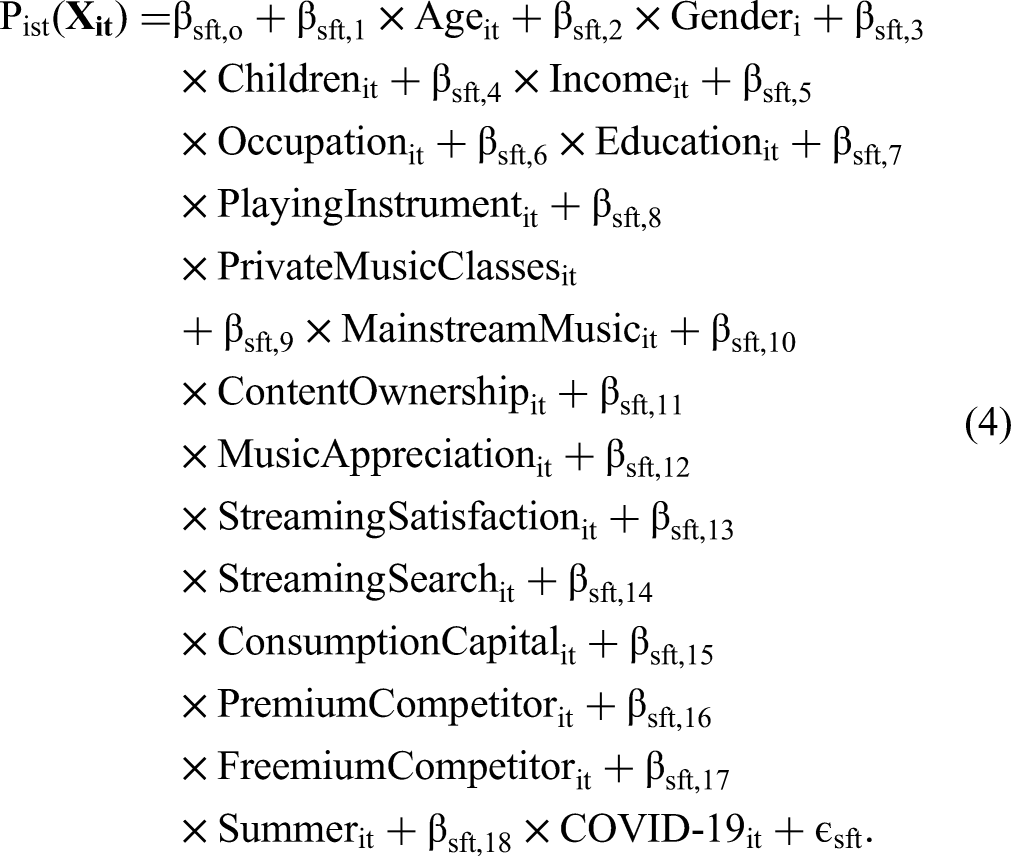
We include variables of individual i in period t = c that might be related to both the conversion and the outcome variables in the matching procedures. We rely on previous empirical studies (e.g., Datta, Knox, and Bronnenberg 2018) to identify relevant variables capturing observed heterogeneity. We integrate a wide range of demographics, because we expect younger respondents to be more likely to adopt music subscriptions and to attend live music events and respondents with a higher income to be more likely to adopt premium music subscriptions and to attend live music events. In addition, occupation could conceivably affect music consumption behavior; for example, employed consumers could have potentially higher expenditures on live music events, and students might have more time for music consumption. Being well educated might decrease music consumption given limited time capacities; however, spending also could increase, as music counts as a cultural asset. Having children might also affect the decision to adopt music streaming services and attend live music events, as many music streaming services offer discounted fees for families and having children decreases the spare time to attend live music events.
Compared with people who have little interest in music, people with high music interest and affinity (e.g., appreciation for music, playing an instrument, attending private music classes) experience higher involvement in music, which leads to more music consumption. We further include a proxy for consumption capital, which captures the notion that consumers with a higher stock of acquired consumption capital are more likely to subscribe or upgrade their service. Genre preferences (e.g., listening to mainstream music) may induce different consumption patterns. A strong preference for content ownership (streaming vs. music ownership) may decrease the probability to subscribe or to upgrade a music subscription and influence consumption in the respective channel. Streaming-related satisfaction and discovery of music (streaming satisfaction, streaming music search) both increase the probability that a consumer will stay with the music streaming service and engage in higher consumption. People with high affinity for podcasts may upgrade their music subscription, as providers often offer podcasts as complementary products to music in current music subscription models. As playlists of other people are only accessible to premium subscribers, music listeners with preferences for playlists might also opt for a premium music subscription. Having other music subscription opportunities might affect the decision to stay with the current music streaming service. A binary indicator differentiating winter and summer seasons captures differences in music subscription and consumption between these seasons (e.g., more interest in festivals during the summer season). Finally, we include a binary indicator to control for demand shocks induced by the COVID-19 pandemic.
Companies’ marketing activities constitute another important driver of consumer behavior. We collected data on price changes for the premium version of Spotify and marketing activities, such as free trials and new service features in the premium version. However, we assume these variables have no statistical impact, because we observe almost no variance in these marketing activities. We also considered that consumer sentiment and social contagion may affect conversion and consumption, so we collected data on Spotify search volume (Figure W2 in the Web Appendix) and consumer sentiment (Figure W3 in the Web Appendix). However, we again observed no variation over time.
Conversion and demand spillover can be driven by private information such as individual consumption experiences (e.g., consumers see artists on television), changes in personal circumstances (e.g., COVID-19 constraints), and social motivations (e.g., peer-group pressure, status signaling after attending a live concert, COVID-19) that are unobservable to the researcher. Furthermore, consumers may have different underlying consumption modes, which may affect the direction of the consumption process between music streaming conversions and demand in other distribution channels, and may lead to a simultaneity bias. For example, digital consumers tend to use multimedia devices and subscribe or upgrade their music subscription to accumulate consumption capital, leading to demand spillovers in the live market. Consumers with nondigital habits may have changes in demand in other distribution channels (e.g., live music) before changing their subscription plan (e.g., subscribing to Spotify). A common approach to alleviate this endogeneity concern is to use an instrumental variable approach. However, our data set does not provide a valid instrument. Thus, we keep our model (Equation 3) to avoid introducing potentially weak instruments and corresponding biases (Wooldridge 2016).
We execute the propensity score matching estimator using kernel matching with the Epanechnikov kernel function and a bandwidth parameter of .06 (Silverman 1986) for all comparisons. To facilitate drawing inferences on the significance of the effect, we report bootstrapped standard errors with 1,000 replications (Heckman, Ichimura, and Todd 1997).
Results
We run detailed analyses on the matching quality for all propensity score matching procedures (Table W5 in the Web Appendix). Our propensity score captures heterogeneity across groups (pseudo-R2 before matching: M = 23.40%; Max = 33.50%), and matching removes the systematic differences in the distribution of the covariates between users with and without conversions (mean standardized bias: M = 7.67%; Max = 13.60%; pseudo-R2 after matching: M = 3.43%; Max = 12.80%). We ensure that users without a conversion have a positive probability of belonging to the group of individuals with conversion. As this assumption holds quite well, we only need to exclude users outside the region of common support in our comparisons according to the minimax criterion (Caliendo and Kopeinig 2008). We report the propensity score matching results in Table 3. Our results indicate that changes in music subscription influence consumption in other distribution channels.
PSM Matching Results (After Matching).
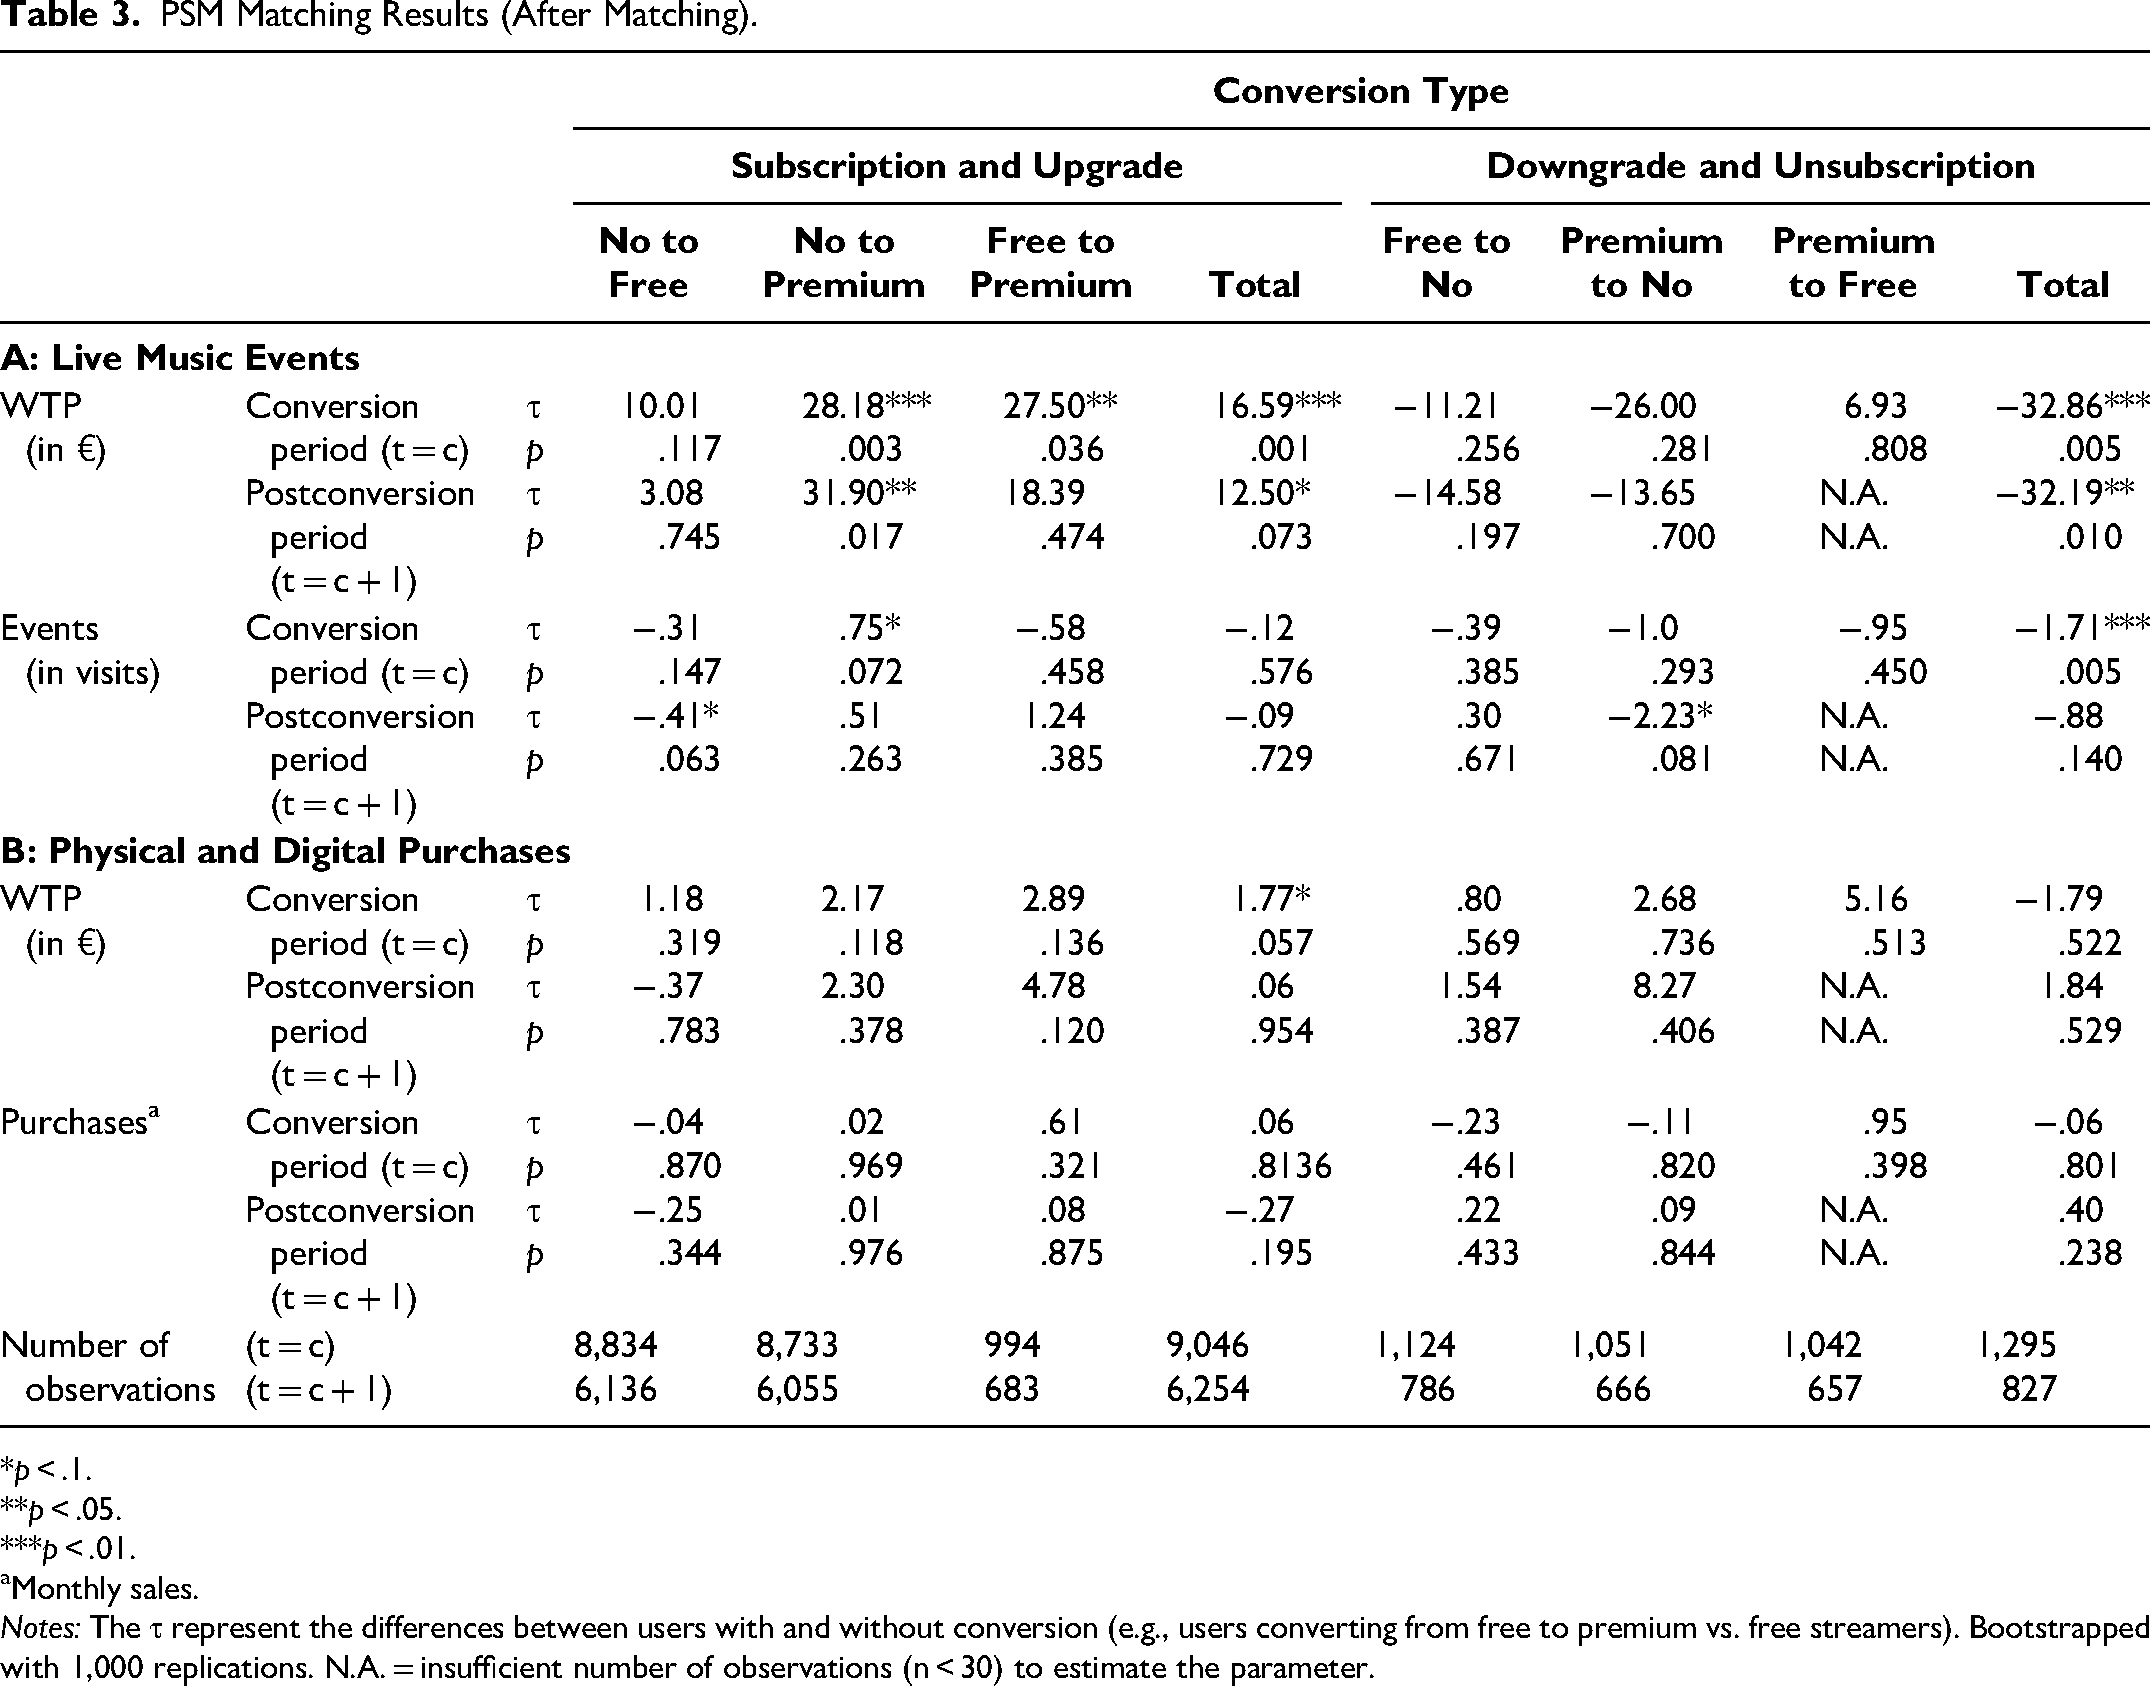
*p < .1. **p < .05. ***p < .01.
Monthly sales.
Notes: The τ represent the differences between users with and without conversion (e.g., users converting from free to premium vs. free streamers). Bootstrapped with 1,000 replications. N.A. = insufficient number of observations (n < 30) to estimate the parameter.
Subscription and Upgrade
For consumers who subscribed or upgraded their music subscription, we estimate an annual surplus per consumer in WTP for live events of +€16.6 (p < .01) in the 0–6 months and +€12.5 (p < .1) in the 6–12 months after conversion. Converting to premium music subscription led to a substantial surplus in WTP for live music in the 0–6 months after conversion (no to premium streaming: +€28.2, p < .01; free to premium streaming: +€27.5, p < .1). The positive spillover of consumers switching from free to premium diminishes over time in WTP for live music events (+€18.4, p = .474), while the demand spillover for consumers converting from no subscription to a premium music subscription increases slightly over time (+€31.9, p < .1). However, we observe no significant demand spillover from a conversion from no streaming to free streaming (+€10.0, p = .117 for t = c; €3.1, p = .745 for t = c + 1), which confirms our initial proposition from the model-free evidence that the free version is not beneficial for the live music channel.
We next investigate the demand spillover to live music attendance. Table 3 shows no significant total conversion effect (−.1, p = .576 for t = c; −.1, p = .729 for t = c + 1), but especially users converting from no subscription to a premium music subscription (+.8, p < .1 for t = c) attend more live events, while users converting from no to free streaming have less demand for live music (−.4, p < .1 for t = c + 1). Again, these results address the critical demand spillover effect of a premium conversion in music subscriptions on other distribution channels, indicating a significant spillover to WTP and demand for live music events.
As depicted in Table 3, we find a significant total effect of a music subscription or upgrade on WTP for digital and physical purchases (+€1.8, p < .1 for t = c); however, this surplus vanishes in the next six months (+€.1, p = .954 for t = c + 1). For the different conversion types, we observe no substantial changes in users’ WTP. We further observe no significant change in physical and digital purchases (all ps > .1). Thus, we conclude that subscribing or upgrading a music subscription does not substantially affect WTP and demand for physical and digital purchases. The different patterns in the two distribution channels may indicate that live music complements music subscription consumption but physical and digital purchases are rather unaffected by music subscriptions and upgrades (serving distinct segments).
Unsubscription and Downgrade
Users who unsubscribe or downgrade music subscriptions show a decrease in annual WTP for live music by €32.9 (p < .01) in the 0–6 months and €32.2 (p < .1) in the 6–12 months after the observed conversion. As Table 3 shows, consumers attend 1.7 (p < .01) fewer live events in the 0–6 months after unsubscribing or downgrading the music subscription. This reduction in live events vanishes after 6–12 months (−€.9, p = .140). However, especially users with a conversion from premium to no streaming attend fewer live music events after 6–12 months (−€2.2, p < .1), which indicates that cutting the inflow of streaming-related consumption capital reduces demand in the complementary distribution channel of live events. Unsubscribing or downgrading has no significant influence on physical and digital purchases.
Overall, a conversion in music subscription spills over to other music distribution channels. Comparing the parameter estimates of different conversion types, we find that unsubscriptions and downgrades harm more than just subscriptions, and upgrades leverage live music consumption. This phenomenon suggests a differentiated consideration of each distribution channel, adds empirical evidence to the discussion on dependency of distribution channels (e.g., Aguiar and Waldfogel 2018), and indicates the critical role of conversions in music subscriptions for labels and artists.
Scenario Analysis: Restricting or Deleting the Free Version
We conduct a scenario analysis to consider whether music streaming services can either stop offering a free version or further restrict the utility of the free version to capitalize on the estimated promotional effect of music streaming on live music and increase live and total revenues. Revenues from music streaming services are divided by periodic subscription fees from premium users (e.g., Spotify Premium for €9.99 per month) and advertising revenues from free users who must listen to advertisements between songs. Prior research (Wlömert and Papies 2016) and industry reports (Spotify 2020a) indicate that the marginal net revenue from premium users is higher than that from free users.
We use a scenario analysis to make inferences about potential revenue effects (Rtotal,r) of either deleting the free version (first scenario; r = 1) or restricting the utility of the free version (second scenario; r = 2). We consider combined revenues (Rtotal) divided into four revenue streams: advertising revenues from free streamers (Radv), subscription fees from premium users (Rfee), physical and digital music revenues (Rpurch), and live music revenues (Rlive). We calculate changes in revenue streams and in total revenues:


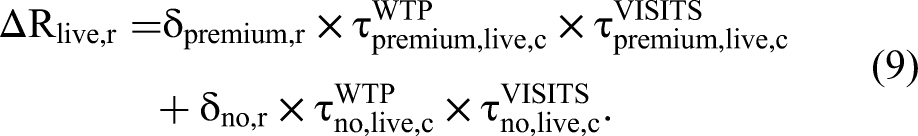
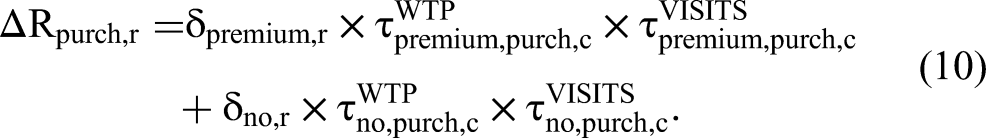
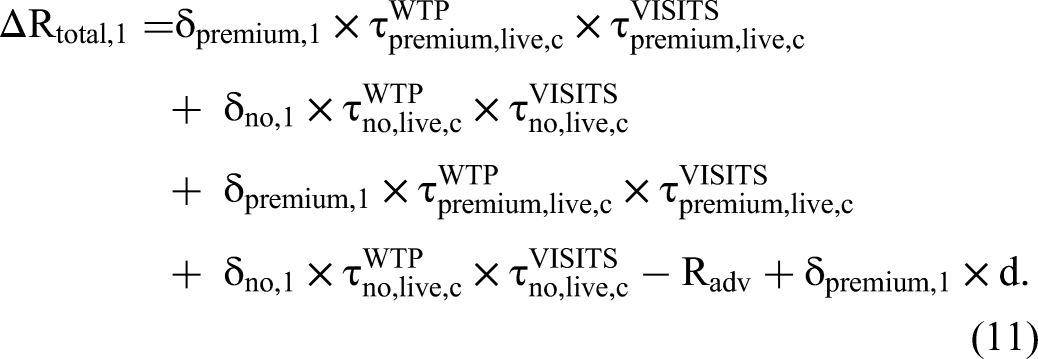
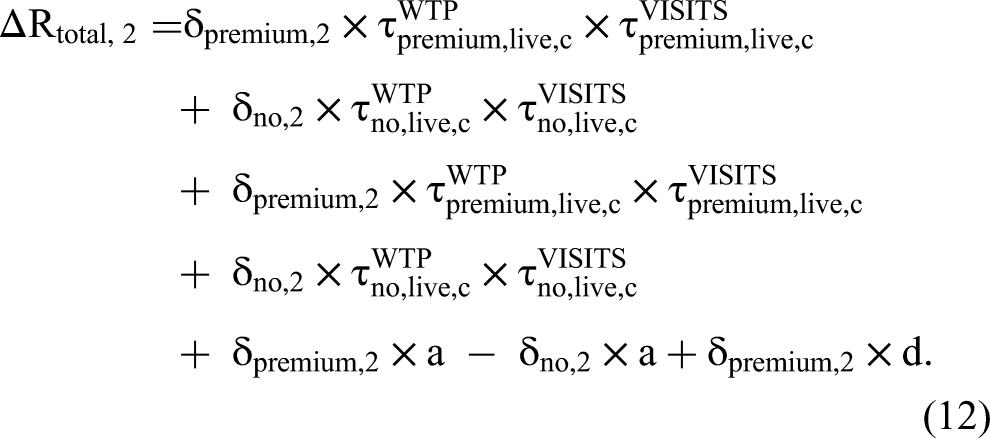
Table 4 reports the scenario analysis results for restricting or deleting the free version. We differentiate both scenarios by the level of the conversion-induced demand spillover (high spillover: +25% mean τ; average spillover: mean τ; low spillover: −25% mean τ) and the type of user who unsubscribes (average user with advertising revenues: a = €4.43; heavy user with advertising revenues: a = €8.86). We note that the stated conversion rates depend on the restrictions of service features and the perceived value of the subscription types. Changing restrictions may influence the stated conversion rates. For example, imposing more service feature restrictions in the free version may increase free to premium conversions. We inspect deviations from the stated free to premium conversion rates (+5%, +10%, and +15% of stated conversion rates; Figure 4) to identify when restricting outperforms deleting the free version.
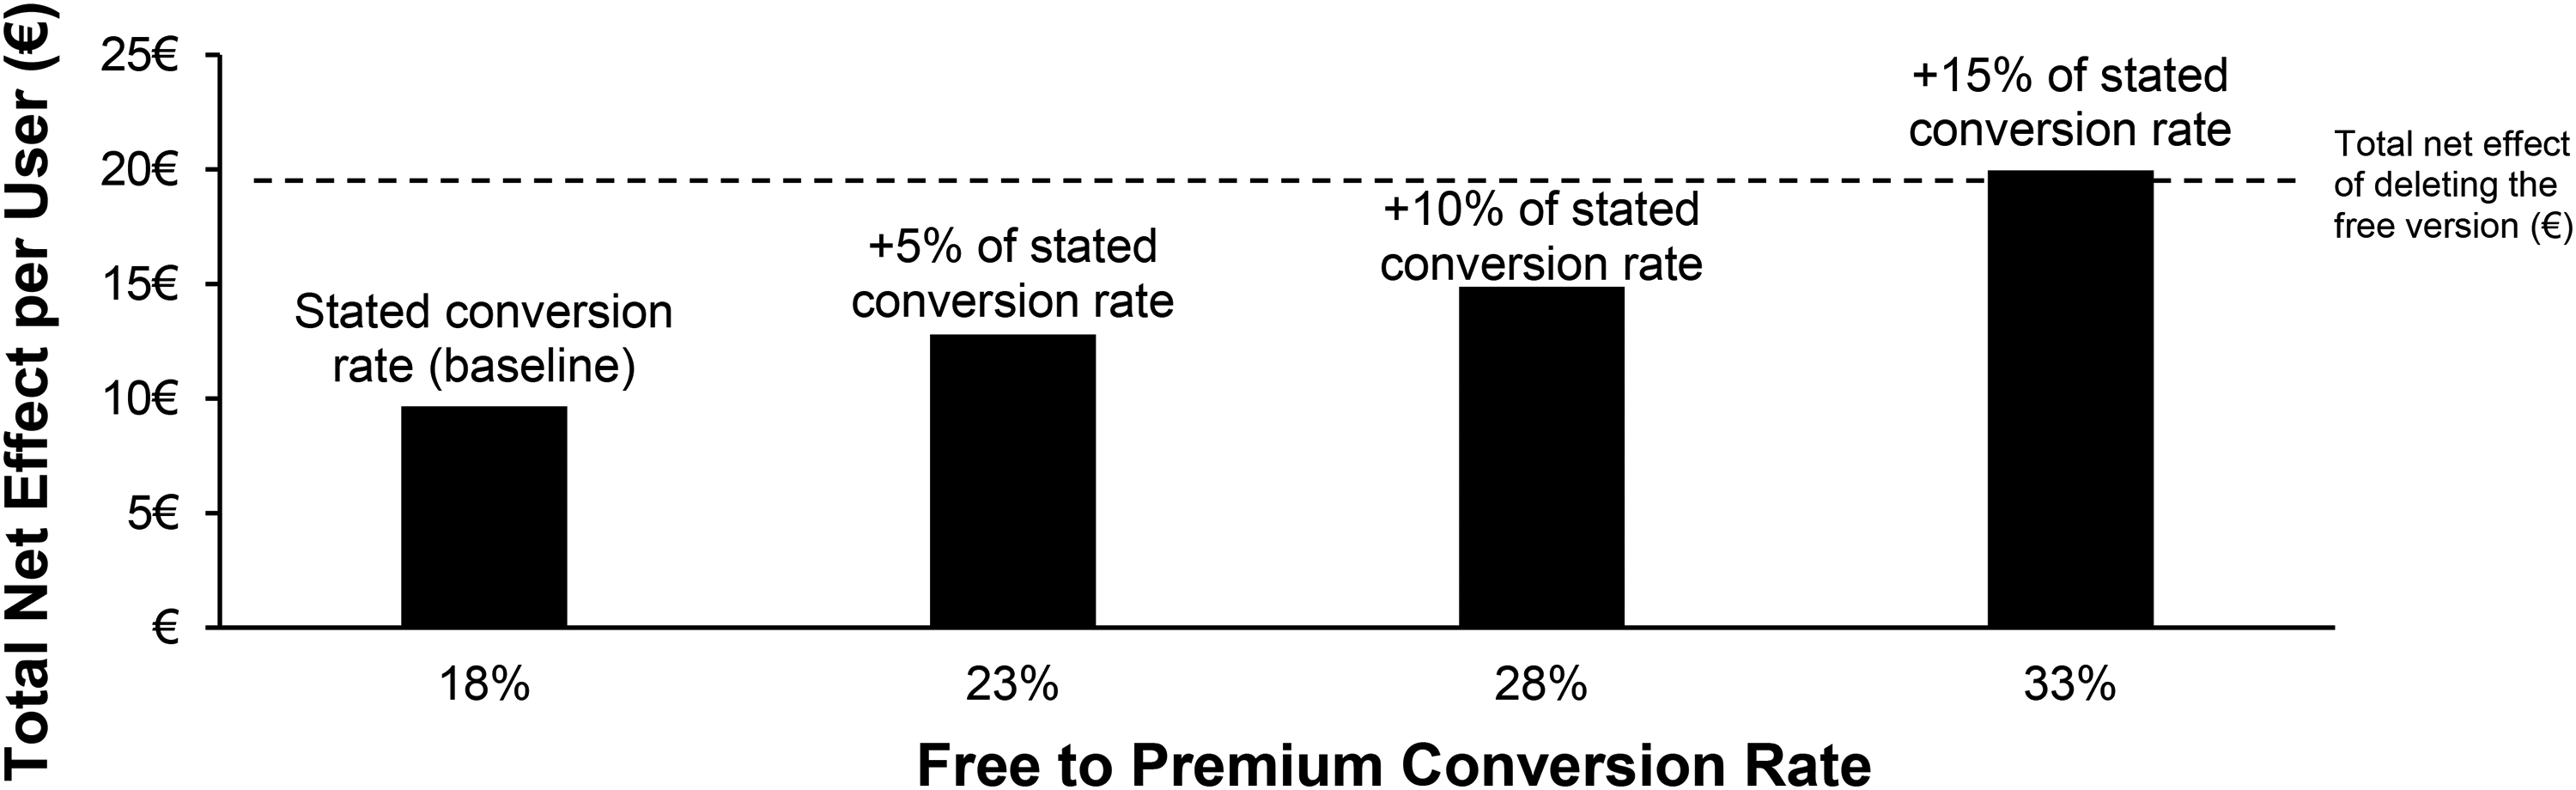
Changes in Revenue Effects for Different Free to Premium Conversion Rates in the Case of Restriction of the Free Version.
Annual Revenue Effects in (€) of Restricting or Deleting Free Streaming.
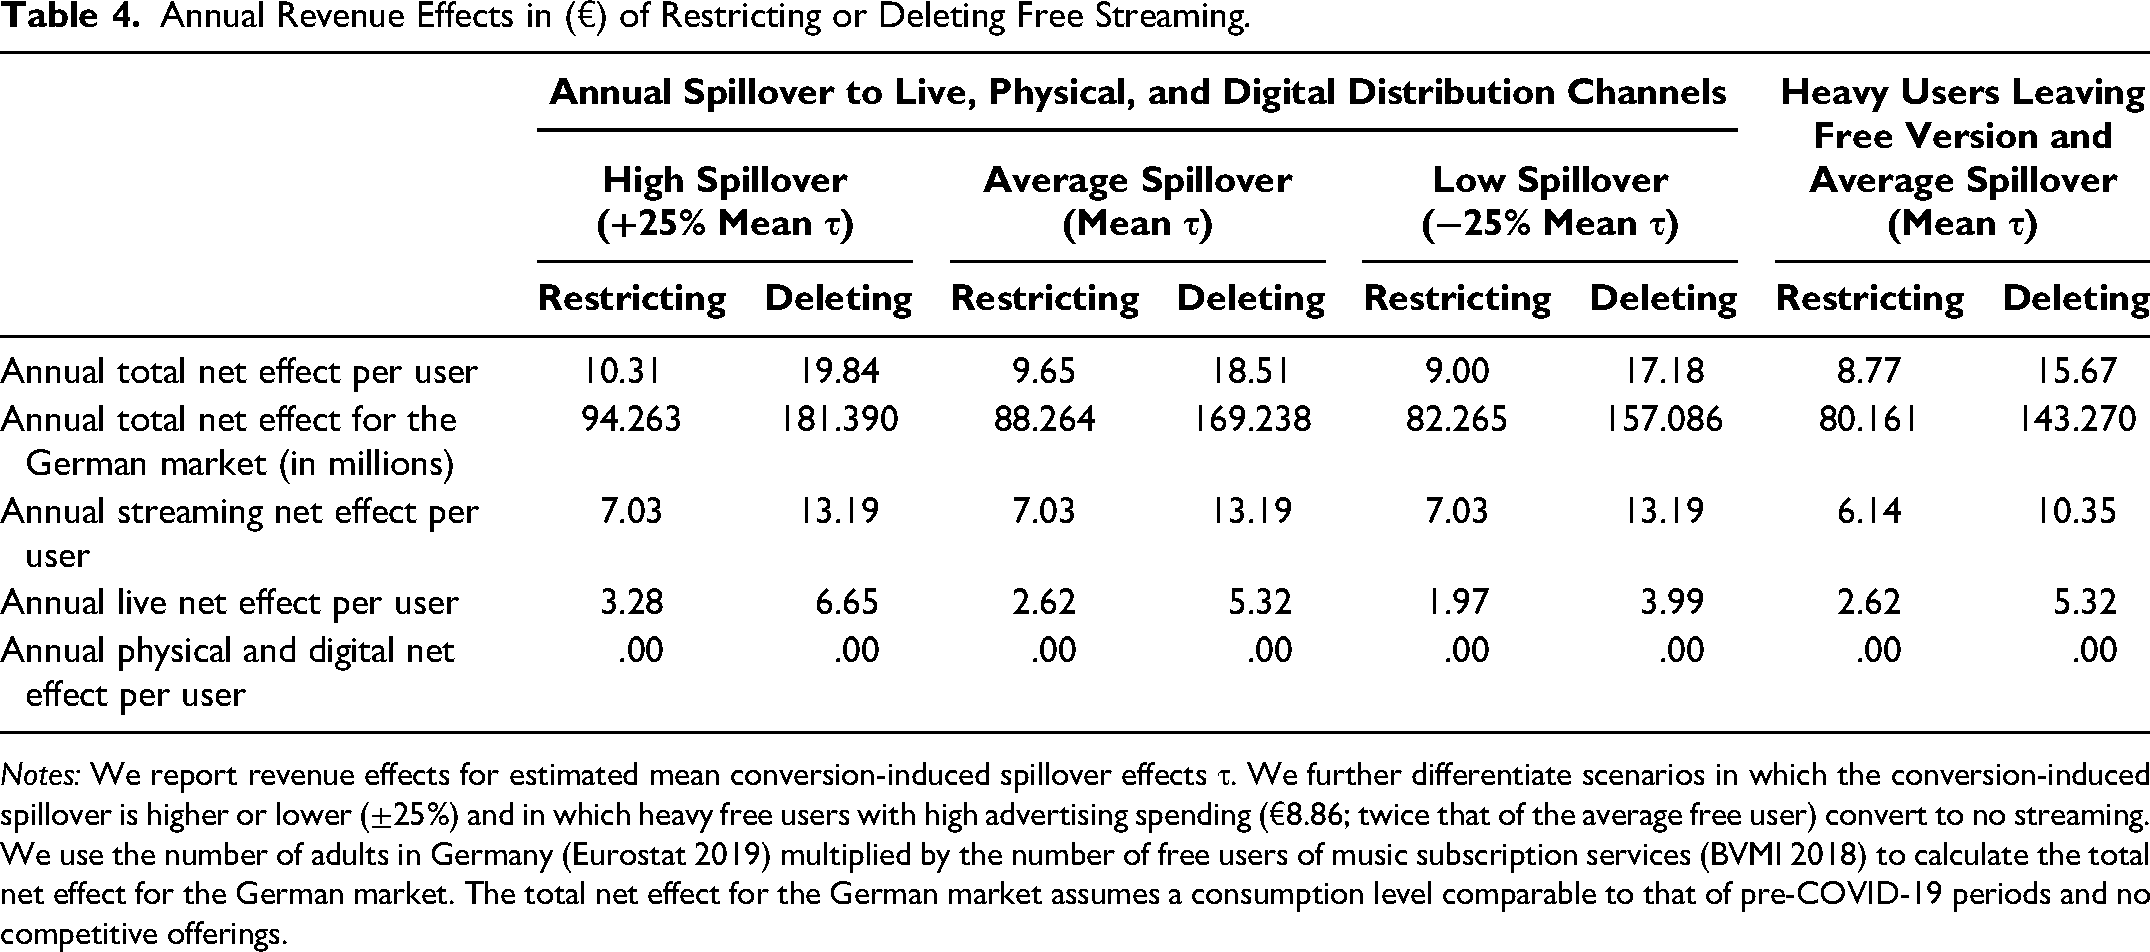
Notes: We report revenue effects for estimated mean conversion-induced spillover effects τ. We further differentiate scenarios in which the conversion-induced spillover is higher or lower (±25%) and in which heavy free users with high advertising spending (€8.86; twice that of the average free user) convert to no streaming. We use the number of adults in Germany (Eurostat 2019) multiplied by the number of free users of music subscription services (BVMI 2018) to calculate the total net effect for the German market. The total net effect for the German market assumes a consumption level comparable to that of pre-COVID-19 periods and no competitive offerings.
We observe significant, positive effects of restricting or deleting the free version on total revenue. Deleting the free version is especially beneficial for total revenues, with a net effect of +€18.5 per user compared with +€9.7 for restricting the free version. If we extrapolate this finding to estimate the net effect on the German music market, total industry revenues would increase by €169.2 million with deletion of the free version or by €88.3 million with restriction of the free version. Although the number of users of the music streaming service would be reduced as a result of users unsubscribing, we observe the highest surplus in revenues from users converting from free to premium streaming, with an increase of €13.2 in revenue for the music streaming service with deletion of the free version and €7.0 with restriction of the free version. Live music revenues would increase by €5.3 for deletion or €2.6 for restriction of the free version. Physical and digital music revenues are not affected by restriction or deletion of the free version. Deviations from the estimated mean conversion-induced spillover by ±25% do not change these implications. Considering that heavy users of the free version (which might generate more advertising revenue; +100%, a = €8.86) typically convert to no streaming, again these findings do not substantially affect the implications, showing a marginally lower music streaming revenue effect per user (deleting: +€10.4; restricting: +€6.1).
The aim of freemium subscription models is to attract customers with the free version and then convert them to premium users, but typically these services do not receive substantial revenues from the free version; rather, companies consider the free version a marketing tool. Our scenario analysis supports deleting the free version given the positive impact of users converting from free to premium streaming, despite the loss of users converting from free to no streaming. Thus, we increase the number of users converting from free to premium music subscriptions if the free version is restricted (leaving all other parameters unchanged) to calculate the free-to-premium-streaming conversion threshold when restricting outperforms deleting. As Figure 4 shows, restricting the free version generates more revenue if 32.7% of free users convert to premium music streaming.
Finally, we consider deviations from the empirical distribution from our consumer survey. Panel A of Figure 5 illustrates different patterns of switching behavior, modeled as combinations of conversion rates of consumers who unsubscribe (10%, 25%, 50%, and 75%) or upgrade (0%, 5%, 10%, 15%, 20%, and 25%) their service. The results indicate that restricting the free version increases the net revenue effect per user until the number of users converting from free to no music streaming is less than 13.4 times higher than the number of users converting from free to premium music subscriptions. For example, if 75% of free users unsubscribe, restricting the free version remains profitable as long as more than 5.6% of free users convert to premium music subscriptions. We further consider different combinations of churn versus upgrade (50% vs. 50%, 60% vs. 40%, 70% vs. 30%, 80% vs. 20%, 90% vs. 10%, and 100% vs. 0%) in case of the deletion of the free version. As Panel B shows, deleting the free version is profitable if more than 7.0% of free users convert to premium music subscriptions.
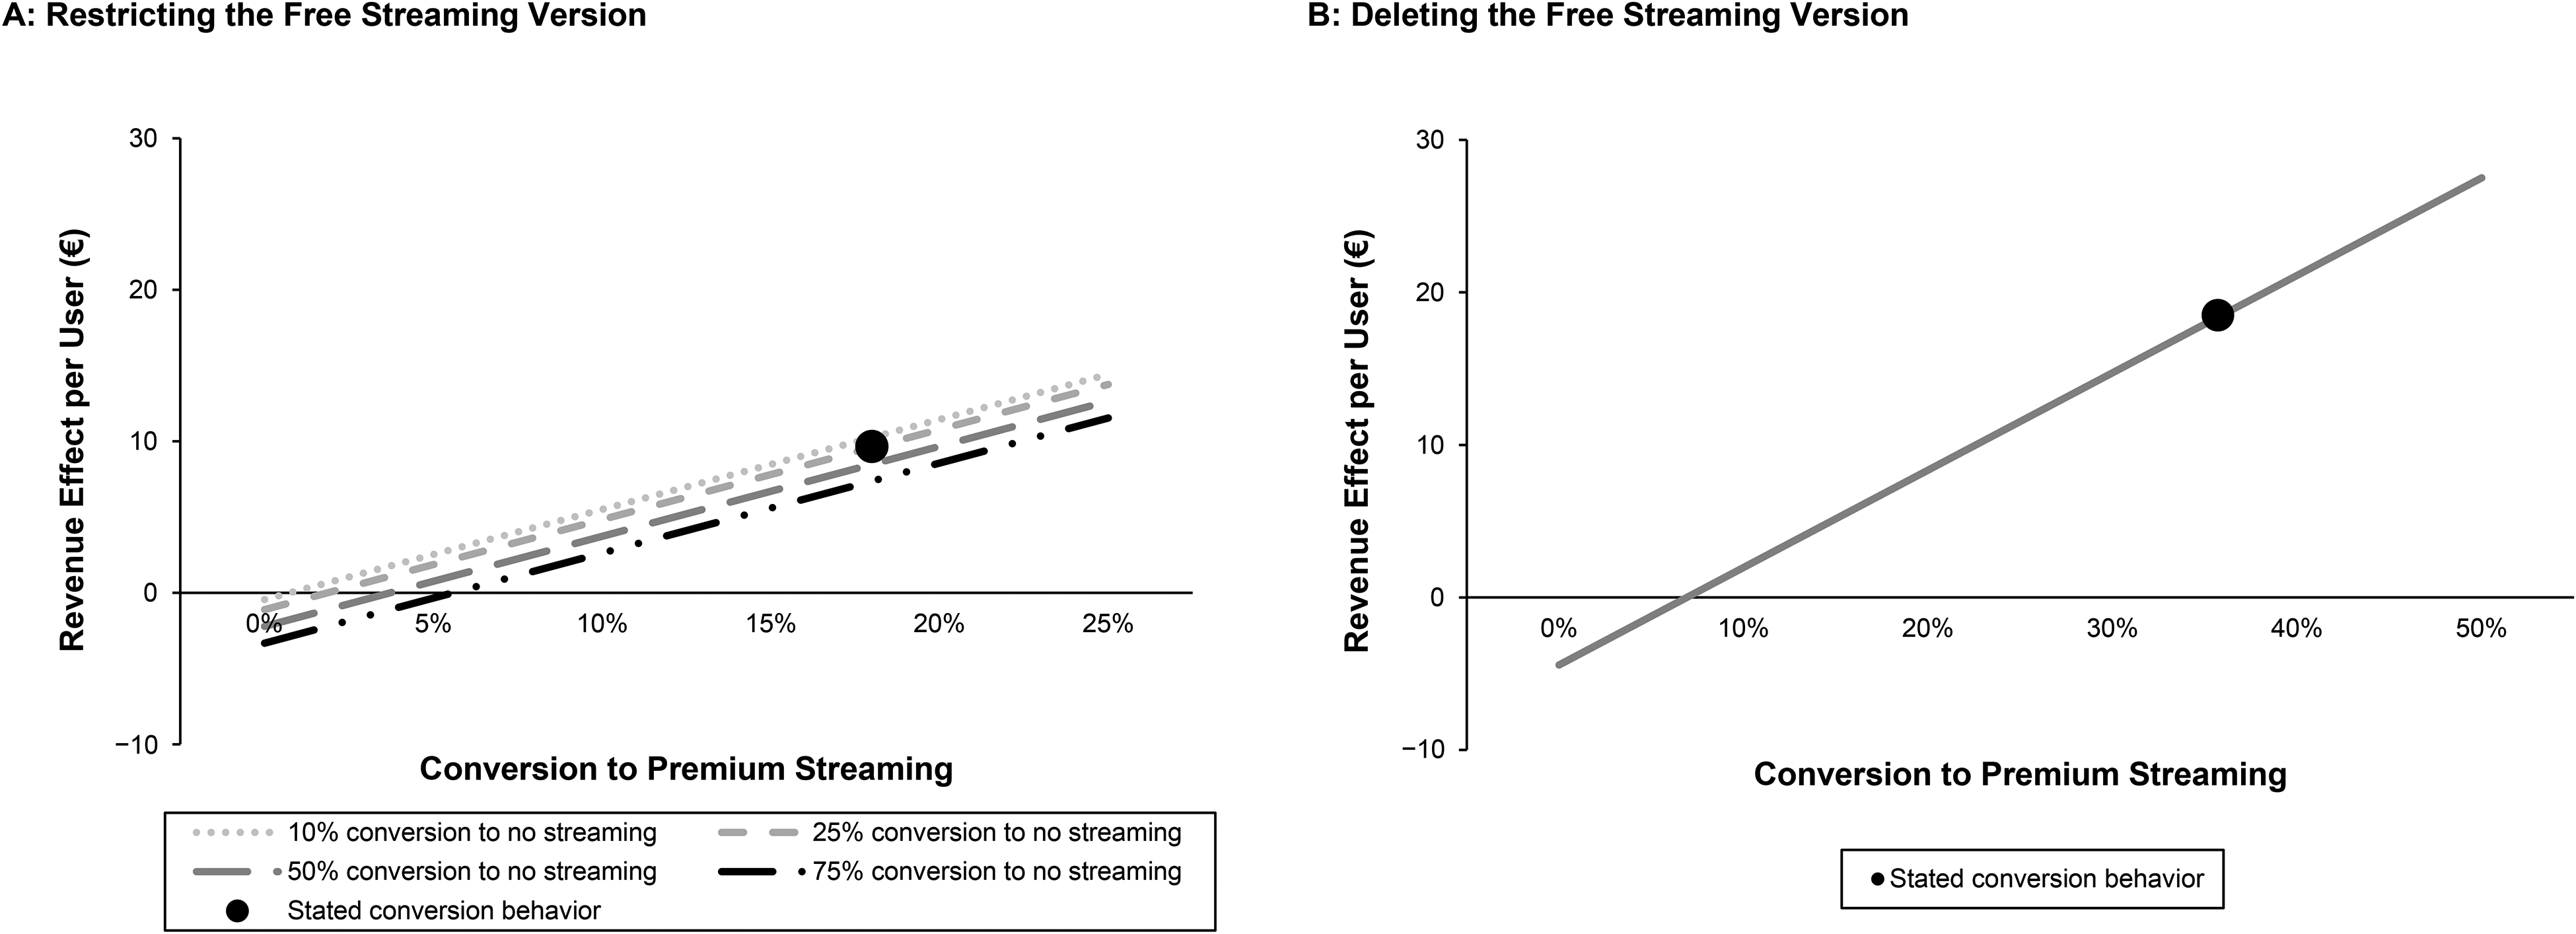
Changes in Revenue Effects for Different Conversion Rate Combinations.
Discussion
Theoretical Contributions and Managerial Implications
This research contributes to the literature on freemium and channel dependencies and provides insights into music subscription conversions that spill over to other distribution channels, employing propensity score matching on an extensive panel data set. We test consumption capital theory in the context of conversion-induced demand spillovers and provide empirical evidence that a conversion-induced change in consumption capital affects demand in other music distribution channels. Our findings shed greater light on the promotional role of music subscriptions (Wlömert and Papies 2016) and reveal how a music subscription or upgrade promotes live music events while unsubscriptions and downgrades lead to negative demand spillovers. This pattern suggests that live music complements the salient attributes of music subscriptions. Contrary, conversion of music subscriptions does not substantially affect WTP and demand for physical and digital purchases, contributing to the discussion on the dependency of distribution channels (e.g., Aguiar and Waldfogel 2018). Comparing the different types of conversions, we find that unsubscriptions and downgrades harm more than subscriptions and upgrades help. Our results further indicate the critical role of service features in triggering the magnitude and temporal pattern of demand spillovers. Comparing conversion and postconversion periods, we observe differences in demand spillovers over time, which may be driven by wear-in and wearout effects in service feature usage. Comparing free and premium subscriptions, our results indicate the importance of the premium version with many service features in generating substantial value for the music streaming service and the artists’ live music events.
In our scenario analysis, we contribute to the freemium literature and find that both deleting the free subscription and imposing further restrictions can increase annual revenues. The results provide support for the premium-only business model, as implemented by music streaming services such as Apple music. The premium effect outperforms the promotional effect of the free version, as Papies, Eggers, and Wlömert (2011) propose. We provide different contingencies of this effect, which indicate how this effect is moderated by heavy users who unsubscribe, conversion rates, and demand spillovers. However, restricting or deleting the free version can decrease perceived fairness of the service and harm attitudes toward the brand (Cziehso, Schaefers and Kukar-Kinney 2019), which makes each adjustment a critical decision with regard to profitability that should be supported with marketing activities (Pauwels and Weiss 2008).
Our findings also have managerial implications. Subscribing and upgrading are critical for total revenues of streaming services and particularly critical to promote live music events, which are the major source of income for most artists. However, the magnitude and temporal pattern of demand spillovers shifts with novel service feature availability and usage. Labels and artists could integrate event-specific playlists (e.g., playlists for a specific festival) in their marketing campaigns to offer free sampling and leverage demand spillovers. Furthermore, music streaming services can provide links to platforms for live music tickets in their services or even integrate the point of sale for live events in their interfaces to create direct touchpoints and decrease transaction costs (e.g., as implemented by Spotify in 2022; Spotify 2022). Taking Bhatia, Richard, and Honey's (2003) suggestion for CD sales, music streaming services could also grant priority access for live music tickets to their users. However, consumer behavior in the music streaming market is independent from physical and digital purchases, indicating that music subscriptions and physical and digital purchases serve distinct consumer preferences. Thus, stakeholders in the music industry should critically evaluate the perceived complementarity between salient attributes of the distribution channels. Finally, our scenario analysis shows that music streaming and live music revenues might benefit from either discontinuing the free version or further restricting its utility. Music streaming services such as Spotify and Amazon Music should consider deleting the free version. However, our sensitivity analysis indicates that free to premium conversion rates are especially critical for profitability.
These implications can be extended to other industries considering the freemium business model and having multiple distribution channels. For example, streaming providers in the motion picture industry, subscription services for video games (e.g., Xbox game pass), and companies providing audio books in a subscription model (e.g., Audible) could use the results to optimize their subscription plans. Subscription plans for live sporting events (e.g., DAZN) and software products (e.g., Adobe Creative Cloud) have become increasingly attractive in their respective industries, such that these industries could benefit from our results. Ultimately, any e-commerce platform that has more than one distribution channel could use our insights to implement a subscription plan (e.g., Amazon Prime).
Limitations and Future Research Directions
Our study has several limitations that may provide avenues for future research. First, we rely on stated intentions and behavior from online surveys, which could be enriched if music streaming services share their data at the user level. However, matching streaming data with data on live music events would still be challenging. We survey conversion rates for restricting or deleting the free version. As actual conversion rates depend on specific restrictions, such as the subscription fee for the premium version, the customer base, and the functionalities of the music streaming service, our conversion rates might not be accurate for the Spotify streaming service; however, they provide a good indication of revenue effects. Future studies could investigate music streaming services by running field experiments and setting up user groups with different restriction levels for the free streaming version to assess the impact of different restrictions on both conversion rates and the demand spillover effect. Furthermore, a combined analysis of conversion rates, underlying reasons to change subscriptions, and associated demand spillovers could provide additional insights on the causality of individual switching behavior and demand spillovers. Considering additional mediators between conversions and demand spillovers may help with understanding the underlying consumption capital accumulation process. Second, despite our large data set, our conversion estimates may be biased by unobservable private information, which is potentially correlated with the conversion and the demand spillover. For example, the presence of unobserved consumption habits may lead to a simultaneity bias. Future research could collect data that include private information or valid instruments to control for the potential endogeneity bias. Third, our data are solely based on Spotify users. Researchers could also investigate demand spillovers for other music streaming services (e.g., Deezer). Another interesting extension is how the estimates of our six conversion types are moderated by different switching behaviors after conversion to specific competitive music streaming services (e.g., to Amazon Music or to Apple Music). We further note that examining nonlinearities in demand spillovers with more detailed data (e.g., music consumption on a weekly basis) would be worthwhile. Fourth, our scenario analysis only involves revenue effects and does not explicitly consider potential network effects. Finally, because our study only estimates the short-term effects, future research could also analyze potential long-term effects of either no longer offering the free version or further restricting its utility.
Footnotes
Editor
Sonja Gensler
Declaration of Conflicting Interests
The authors declared no potential conflicts of interest with respect to the research, authorship, and/or publication of this article.
Funding
The authors disclosed receipt of the following financial support for the research, authorship, and/or publication of this article: This work was supported by the Deutsche Forschungsgemeinschaft (grant number FOR 1452).
Notes
References
Supplementary Material
Please find the following supplemental material available below.
For Open Access articles published under a Creative Commons License, all supplemental material carries the same license as the article it is associated with.
For non-Open Access articles published, all supplemental material carries a non-exclusive license, and permission requests for re-use of supplemental material or any part of supplemental material shall be sent directly to the copyright owner as specified in the copyright notice associated with the article.