
Abstract
Retailers’ efforts to monetize consumer location data remain dominated by inefficient protocols (e.g., geofencing) that customize marketing interactions based solely on app users’ current location. Although extant trajectory mining techniques can remedy these shortcomings, they require high-frequency location data, which poses severe risks to consumers’ privacy. The authors present a novel method to extract marketing value from low-granularity urban mobility data and demonstrate its use in analyzing gas station choice to value customers. The data, also used to infer gas station visits, contain 1.06 million location records on nearly 27,000 devices observed near selected retailers including gas stations during a six-month period in Staten Island, New York. The authors pool consumers’ mobility trajectories from several days to dynamically calculate the distance of stores from consumers’ anticipated trajectories. They then supplement the data with station-level daily fuel prices and estimate a conditional logit model to assess how consumers trade off gas prices versus store distance. In addition to a generally high station loyalty, the authors find that consumers strongly prefer not to deviate far from their common trajectories for fueling trips. Applying their methods in a predictive context, the authors infer the value of newly acquired customers to the studied gas stations to be between $3.00 and $7.59.
Keywords
The close integration of mobile technologies in people's lives has connected retailers with a rich source of data about consumers and their environment and has led firms to incorporate such contextual data into their advertising and marketing strategies (Grewal et al. 2016; Kurtz, Wirtz, and Langer 2021). However, whereas the majority of today's top B2C companies collect location information from their customers’ smartphones (Tong, Luo, and Xu 2020), both marketers’ efforts to monetize mobile location data and the corresponding academic literature have primarily focused on simple protocols such as geofencing, or targeting app users whose current location is near a point of interest. Prior work has argued that such methods are inefficient as they ignore the heterogeneity of consumers at any given location, and instead has proposed to improve mobile targeting by extracting features from consumers’ trajectories (ordered sequences of mobility traces; Ghose, Li, and Liu 2019).
However, the known such approaches require location data at a high temporal resolution, which can easily be exploited to identify and track individuals at sensitive locations, such as reproductive health clinics or places of worship (De Montjoye et al. 2013; Pagani and Malacarne 2017). Therefore, many location data companies choose not to store the second-by-second trajectories of each mobile device but to index only venues of business relevance (e.g., retail stores and advertising billboards), and record only when mobile devices are in the vicinity of indexed nonsensitive locations (Goldfarb and Tucker 2020). To date, however, it remains largely unclear how marketers may extract value from such low-resolution information on consumers’ urban mobility trajectories.
In this article, we study how sparse longitudinal data on the urban mobility of smartphone users, collected only at retail locations in non-privacy-sensitive categories, can improve our understanding of heterogeneous consumer preferences in store choice, a question that is of key importance to both marketing theory and practice. To this end, we use the retail gasoline market as a test bed, and we ask the following questions: How do consumers trade off gas price versus driving distance in their fueling choices? What is the predictive power of urban mobility data regarding (fuel) purchase decisions? How can retailers account for customer heterogeneity in price and distance sensitivities?
To address these research questions, we collaborated with a leading location intelligence media technology company that provided us with comprehensive longitudinal data on consumers’ location choices in the urban market area of Staten Island, New York. We used these unstructured data to (1) infer gas station visits, (2) construct consumer trajectories (ordered sequences of daily location observations), and (3) calculate the distance of each gas station from these trajectories. In addition, we also obtained daily price data (covering the same period) for the observed gas stations from Oil Price Information Service (OPIS; https://www.opisnet.com). To understand how businesses can monetize the information contained in individual location histories, we modeled consumers’ daily fueling choices (i.e., which, if any, of the gas stations in Staten Island they visited for a duration consistent with fueling behavior) over the six months spanned by our data. We employed a two-pronged research strategy combining descriptive analysis and predictive modeling, which allowed us to explore the heterogeneity in consumers’ price and distance sensitivities, as well as to assess the value of a new customer (acquired, e.g., via mobile search advertising or targeted promotions) at each station. To address the challenges presented by the sparsity of privacy-protecting urban mobility data, we introduced a novel method to derive the distance of a gas station from consumers’ anticipated trajectories: we pooled trajectory information for multiple days preceding a given observation, and subsequently averaged the distance of the gas station from each of the daily trajectories.
In the first stage of the analysis, we estimated a conditional logit model to assess how consumers trade off driving distance and gas price in their fueling choices. We found that, on average, a $.01/gallon price advantage is offset by an additional 21-meter distance from one's typical trajectory. This result corroborates Houde's (2012) conclusion that consumers typically do not deviate far from their commuting route; importantly, however, we show this pattern to hold (1) using individual choice data and (2) even after accounting for the strong station loyalty observed in the data. Our results also show that incorporating individual location histories (through the trajectory distance variable) substantially improves model fit even after controlling for gas brand and station loyalty, increasing McFadden's pseudo R2 from .0760 to .1149. Furthermore, by estimating a latent class specification, we uncover considerable consumer heterogeneity in distance sensitivity: while consumers in neither latent class tend to fuel up far away from their common trajectories, we found that approximately 70% of consumers are more station-loyal and somewhat less sensitive to store distance, with the other 30% of consumers substantially more sensitive to store distance—essentially fueling up only alongside their common trajectories—but more likely to switch stations between consecutive fueling events.
In the second analysis stage, we split our data (temporally) into a training and a test set and compared the out-of-sample predictive performance of models with and without the trajectory distance variable derived from the consumer mobility data. The model accounting for location histories substantially increased out-of-sample fit compared with the model including only the price, gas brand, and station loyalty variables. In addition, when predicting which of the gas stations was chosen on those occasions when a consumer fueled up, incorporating trajectory information improved the out-of-sample classification accuracy by 6.25%, despite the strong station loyalty in the market.
Finally, we performed a calculation to assess the value of new customer acquisition. Assuming a 9% gross margin for each brand on the market, we used the model trained on the training data, and analyzed the profit contribution from (1) the gasoline sold in the transaction, (2) complementary sales such as purchases from the convenience store at the station, and (3) the increased likelihood of a return visit by the same customer for each station, respectively, on the test data. We found the station-specific values of a new customer to be between $3.00 and $7.59. These values could be traded off against each station's cost of acquiring new customers, for example, via mobile advertising.
Overall, this research demonstrates how even sparse urban mobility data, collected only near businesses in non-privacy-sensitive categories, can be used to generate important insights about consumer behavior and preferences. Our suggested new approach linking consumers’ future store choices to their recent mobility patterns significantly outperforms models relying only on historic store choices, brand information, and current price. We demonstrate that consumers strongly prefer to fuel up near their trajectories, and we show that this distance sensitivity does not merely stem from the strong station loyalty in the studied market. In addition, our results reveal the presence of customer heterogeneity in both price and distance sensitivities.
Our research contributes to marketing theory on multiple fronts. First, we present a novel approach to quantify consumer heterogeneity in store choice using only mobility data and marketing information, with no transactional or survey data. Importantly, our methods are suitable for sparse data on consumers’ outdoor location patterns and are thus applicable for data collected in full compliance with consumer privacy protection regulations. Second, whereas previous studies that examined how distance affects store choice have relied on static location, we consider dynamic mobility patterns, revealing a more realistic picture of consumer decision making. Finally, the use of intraday mobility data adds an important layer to the gasoline demand literature, enabling us to tease apart consumers’ sensitivity to deviating from their trajectory from their station loyalty.
Our work also offers valuable practical implications. By employing our proposed methods, retailers in the gasoline industry can assess the value of new customer acquisition and trade it off against their acquisition cost, such as via mobile search advertising or targeted promotions. In addition, our main methods linking consumer location histories to offline store choice may also be applicable to other industries (e.g., clothing retail or fast casual dining). Interactive marketing approaches can be further leveraged by targeting customers with real-time or next-day promotions based on their outdoor mobility patterns while ensuring the protection of sensitive consumer data.
Related Literature
The increasing digitization of consumption processes has led retailers to consider a more dynamic view of the consumption journey (Gallino and Moreno 2014; Lemon and Verhoef 2016; Verhoef, Kannan, and Inman 2015). As mobile platforms have become a mainstream vehicle for online consumption, location-based services play an important role in customer conversion in online-to-offline commerce, and mobile targeting using traffic data collected from mobile devices has become a powerful tool for marketers (Ghose 2018; Kurtz, Wirtz, and Langer 2021; Wang et al. 2019). In line with this, retailers have been exploring ways to study consumers’ mobile activities and their effect on purchase decisions (Cui et al. 2021; Kurtz, Wirtz, and Langer 2021; Park, Bang, and Ahn 2020). In this article, we present a novel approach to segment consumers based on their urban mobility patterns. Subsequently, we review the relevant research on location-aware marketing, store distance, and retailer choice and the literature linking prices and gas station locations to gasoline demand.
The traditional approach to using consumer location data was to partition consumers into contiguous geographic regions and customize marketing tactics across the market segments arising from these partitions (Bronnenberg, Dhar, and Dubé 2007; Skiera and Albers 1998), or to consider spatially correlated preferences depending on the proximity of consumers due to either location-specific shocks or the nature of observational word of mouth (e.g., Bell and Song 2007; Yang and Allenby 2003). Early attempts to monetize mobile location data applied the same paradigm: consumers were dynamically mapped into segments based on a static partitioning of geographic locations. The best-known such approach is geofencing, that is, sending consumers promotional offers when they enter a retailer's vicinity (Han et al. 2019; Luo et al. 2014; Tong, Luo, and Xu 2020). This approach typically employs a simple binary indicator of whether consumers (as indicated by their mobile device) are inside or outside the geofence to target them accordingly.
Extant research has demonstrated the efficacy of geofencing methods in both indoor (Danaher et al. 2015; Hui et al. 2013) and outdoor (Fong, Fang, and Luo 2015; Ho, Dewan, and Ho 2020; Molitor et al. 2020) settings. However, recent work has also exposed a weakness of such methods, namely that dynamically assigning prospects’ real-time location to static partitions of the map assumes away the possibility that different consumers at the same location may react differently to the same marketing stimuli (Zubcsek, Katona, and Sarvary 2017). Indeed, such heterogeneous ad response has been documented in the literature. Andrews et al. (2016b) show increased ad click-through rates by commuters traveling on crowded (vs. less crowded) subway trains. Molitor et al. (2019) highlight how visitation frequency may reveal consumers’ familiarity with a given location, and how it informs the observed ad response rates.
Nonetheless, work on how the use of consumer mobility data, dynamically collected at multiple locations during the day, may in fact improve business strategies, remains scant. Ghose, Li, and Liu (2019) demonstrate how pooling customer location histories in ways reminiscent of collaborative filtering may help uncover the heterogeneity of customer mobility patterns, allowing firms to target their mobile ads more precisely. However, such approaches have hitherto been limited to more fine-grained indoor location data. In contrast, we study how the use of sparse urban mobility data can improve our understanding of store choice behavior, using the retail gasoline market as a test bed. In Table 1, we provide a comparison of our work to the extant location-based mobile marketing literature.
An Overview of the Relevant Literature on Location-Based Mobile Marketing.
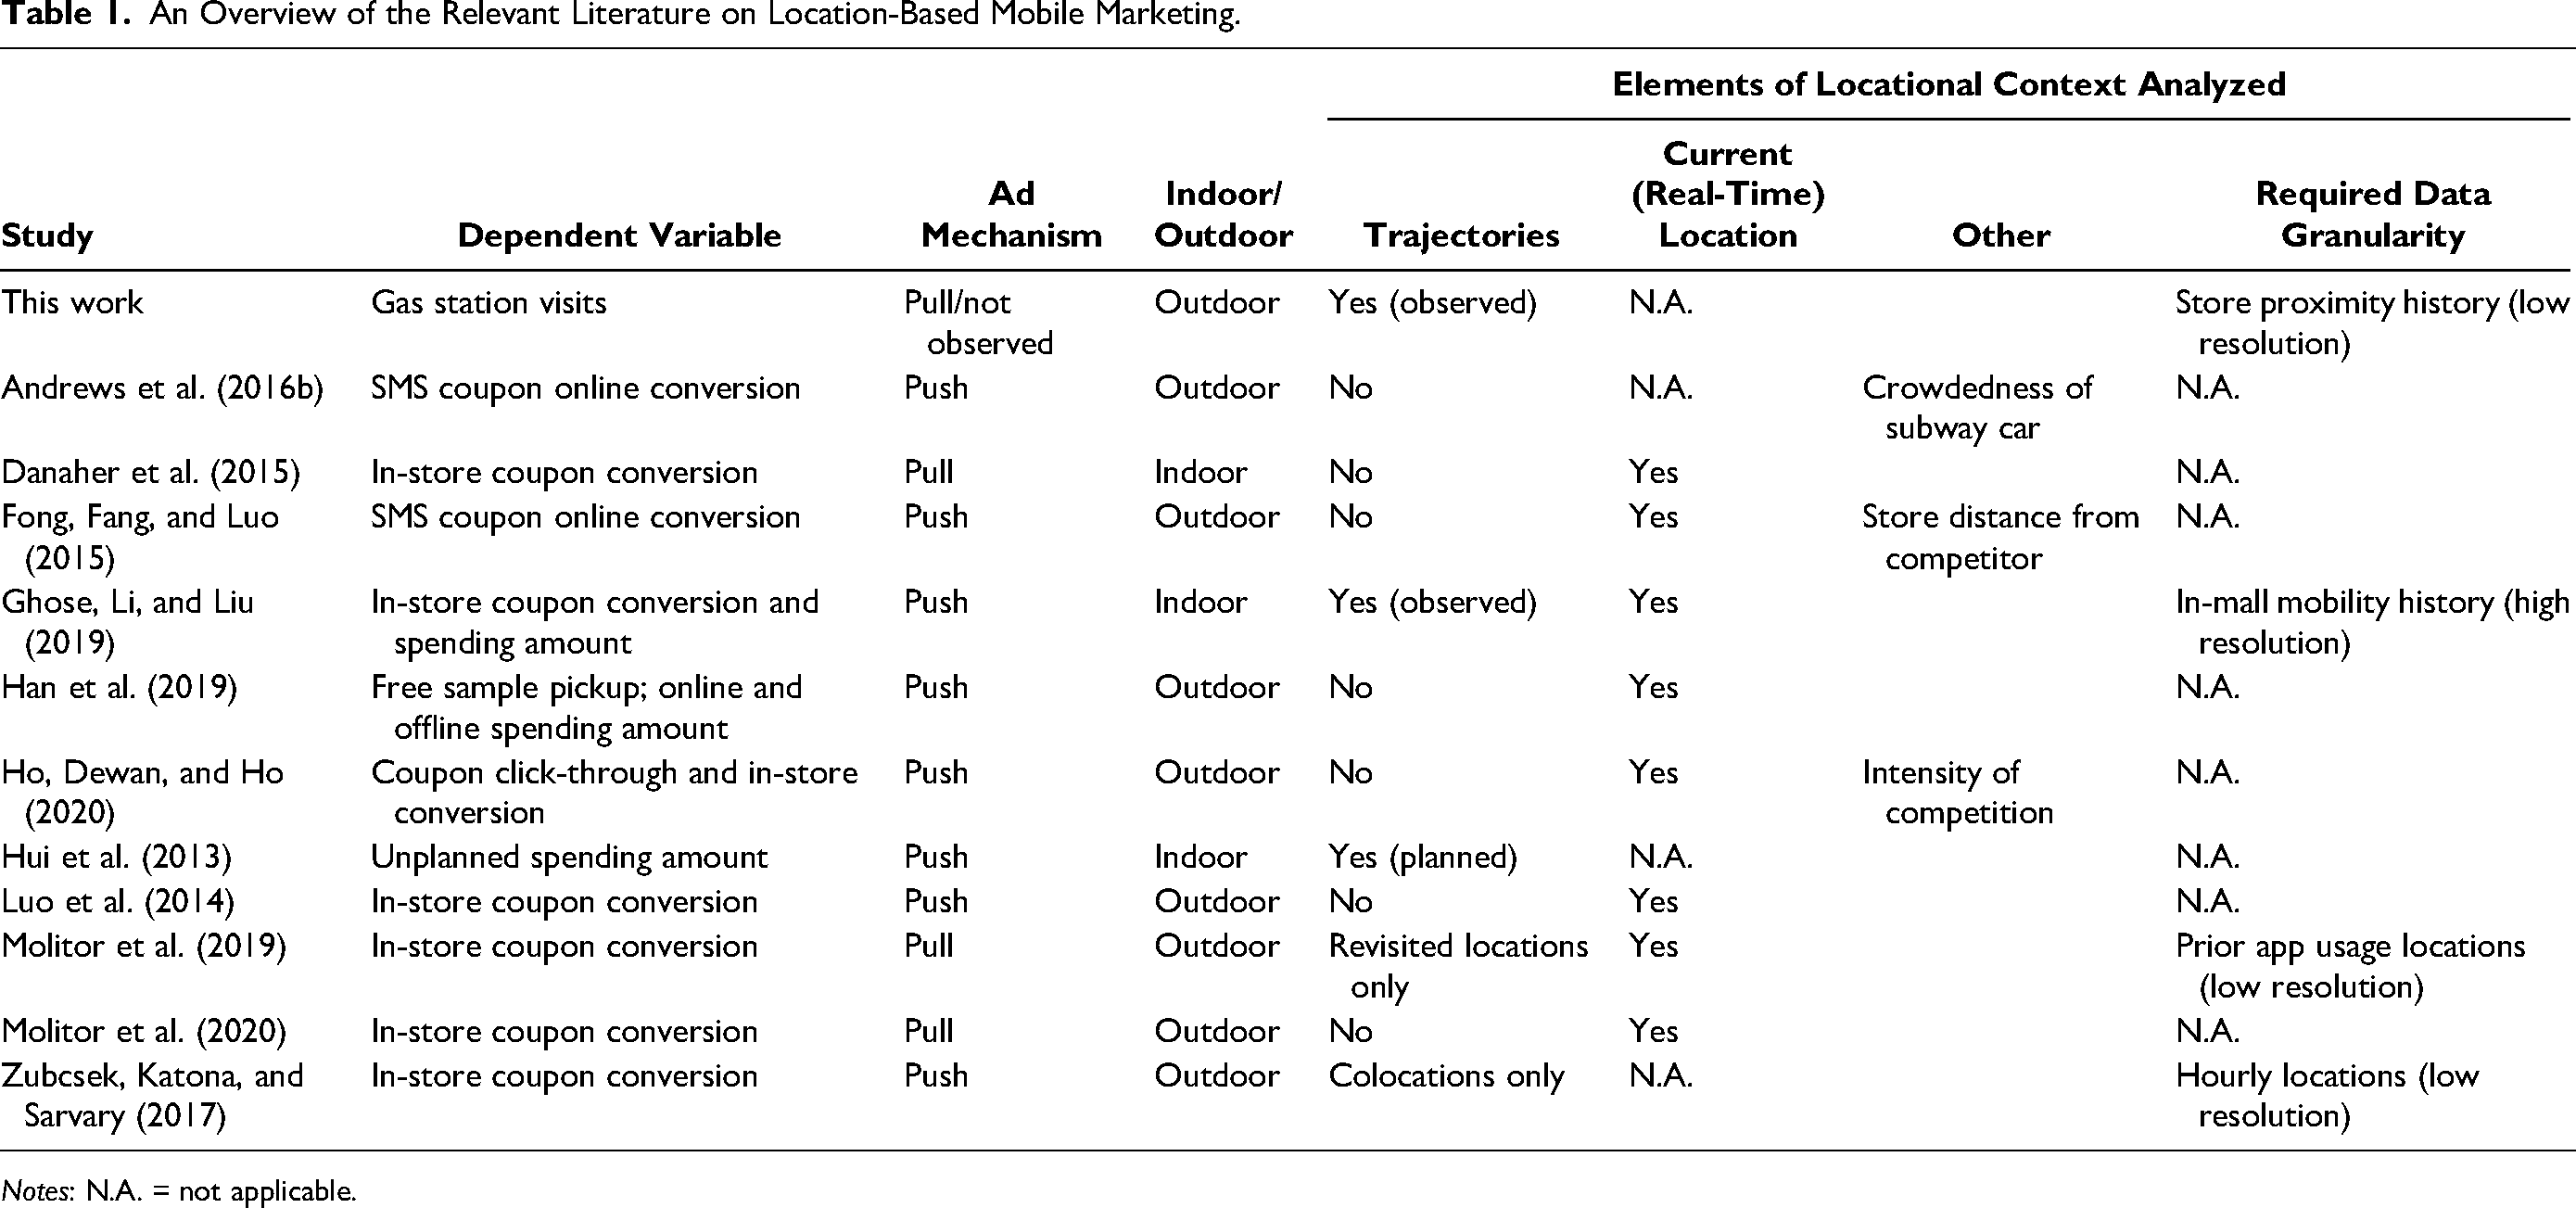
Notes: N.A. = not applicable.
While the use of mobility data offers potential benefits for targeted marketing, it also presents significant privacy issues. The collection, storage, and analysis of continuous, fine-grained location data pose inherent risks to individuals’ privacy, as this information can potentially reveal sensitive and personal details about their daily lives, habits, and preferences (Bengio et al. 2020; Pagani and Malacarne 2017; Wang, Yang, and Zhang 2015). Furthermore, the aggregation and sharing of such data across multiple platforms exacerbate the risk of privacy breaches, unintended data leakage, or unauthorized access by malicious actors (Kurtz, Wirtz, and Langer 2021). This creates a privacy–value trade-off, wherein the commercial interests of advertisers must be balanced against the fundamental right to privacy of consumers (Andrews et al. 2016a). Therefore, researchers, practitioners, and policy makers have been striving to develop techniques that can effectively safeguard individual privacy while harnessing the benefits of location data in marketing initiatives. In this research, we offer a novel method that utilizes sparse longitudinal urban mobility data collected only at retail locations in non-privacy-sensitive categories, thereby reducing the privacy risks that are typically associated with the use of location data.
Our work is also related to the role of distance in store choice, a topic that has long been studied in marketing. Constrained by the availability of data, early work in this stream focused on the economic “transportation cost” between a consumer's residence and the store (Black, Ostlund, and Westbrook 1985; Hortman et al. 1990). In a seminal article, Bell, Ho, and Tang (1998) uncover the heterogeneity in how customers in a given market area trade off basket size with the distance from nearby stores. More recently, Forman, Ghose, and Goldfarb (2009) show that store distance remains relevant even in the age of the internet: they find that when a store opens locally, shoppers substitute away from online purchasing. Similarly, in the online-to-offline domain, Li, Shen, and Bart (2018) show that higher travel cost moderates the otherwise strong substitution effect between deals on Groupon. In summary, the consensus in this literature negatively associates store distance with store choice. However, none of the aforementioned studies consider mobility trajectories combined with dynamic price information to tap into consumers’ price and distance sensitivities in store choice.
Nevertheless, quantifying how distance affects store choice has long enabled scholars to identify the theoretically optimal spatial location of a retail store (Bucklin 1967; Cox 1959; Guy 1994), as well as the theoretically optimal radius of the mobile advertising geofence around it (Wang et al. 2019). The competitive implications of the spatial distribution of store locations have also been extensively studied in the gasoline market (Iyer and Seetharaman 2008; Rossi and Chintagunta 2016). However, research that explicitly models store distance has either focused on the wholesale gasoline market (Pinkse, Slade, and Brett 2002) or estimated customers’ transportation costs based on the distance of each gas station from their home location (Chan, Padmanabhan, and Seetharaman 2007; Nishida and Remer 2018). In a notable exception to these trends, Houde (2012) models consumers’ movement patterns to estimate demand and spatial competition in the gasoline market and finds that accounting for the distance of gas stations from consumers’ commuting trajectories (vs. their home location) better explains the variation in station-level gasoline demand. However, Houde relies mainly on census data to estimate the distribution of commuters over the road network of Quebec City, and does not use individual-level mobility data. Our approach of defining store distance (the detour to each gas station from consumers’ anticipated trajectories) based on intraday mobility patterns allows us to both control for consumers’ station loyalty and account for unobserved heterogeneity in their preferences, thereby making an important contribution to this literature.
In this research, we extend the aforementioned streams of work by developing a novel method that uses dynamic, yet relatively sparse urban mobility data to model consumers’ price and distance sensitivity while accounting for consumer heterogeneity. We test our approach using longitudinal data from the retail gasoline market in Staten Island, New York. Our results highlight the importance of accounting for consumers’ urban mobility trajectories when modeling offline store choices. In addition, we suggest how retailers can use our method to assess the value of acquiring new customers, thereby improving targeted marketing effectiveness. We describe our data and the details of our approach next.
Data and Methods
Data
To study the relationship between consumers’ mobility patterns, the price, brand, and location of gas stations, and consumers’ daily fueling choices, we integrate data from two different sources. We observe consumers’ location choices in an urban mobility data set shared with us by our location data provider, and we track fuel prices using data obtained from OPIS. Both data sets comprise longitudinal data for the same 24-week period (November 13, 2017–April 29, 2018) and the same geographic area (Staten Island, New York).
Records in the urban mobility data set correspond to (anonymized) mobile devices observed near a predetermined set of retail stores. These include all 43 gas stations (out of a total of 69 on Staten Island) indexed by our data source, plus an additional 123 nongas retailers. 1 Each observation indicates the brand and GPS location of the store, the distance of the observed mobile device from the store (up to 100 meters), and the precise time and duration of the observed visit to the given location. Table 2 shows a sample data record, wherein device abc-789 was observed 8 meters from the Walgreens drugstore located at 1551 Richmond Ave., Staten Island, New York, on November 18, 2017, at 2:45 p.m. for about 11 minutes.
An Observation Example in the Mobility Data Set.

Note that mobile devices were not continuously observed in our data. Consistent with the business activities of the data provider, the location of devices was recorded only when they were at most 100 meters away from the observed (gas and nongas) retailers. As a result, our urban mobility data are much sparser than the in-mall mobility data used by Ghose, Li, and Liu (2019). However, as we show in this research, even coarse consumer trajectories reconstructed from such sparse urban mobility data capture important patterns of consumers’ location choices and thus can be of great use to marketers.
The gas price data set contains daily observations on the average fuel price at all gas stations in Staten Island. Each observation includes the brand and GPS location of the gas station, and the station's daily average fuel price for regular unleaded gas. 2 Figure 1 shows the evolution of observed gas prices over the November 2017–April 2018 period.
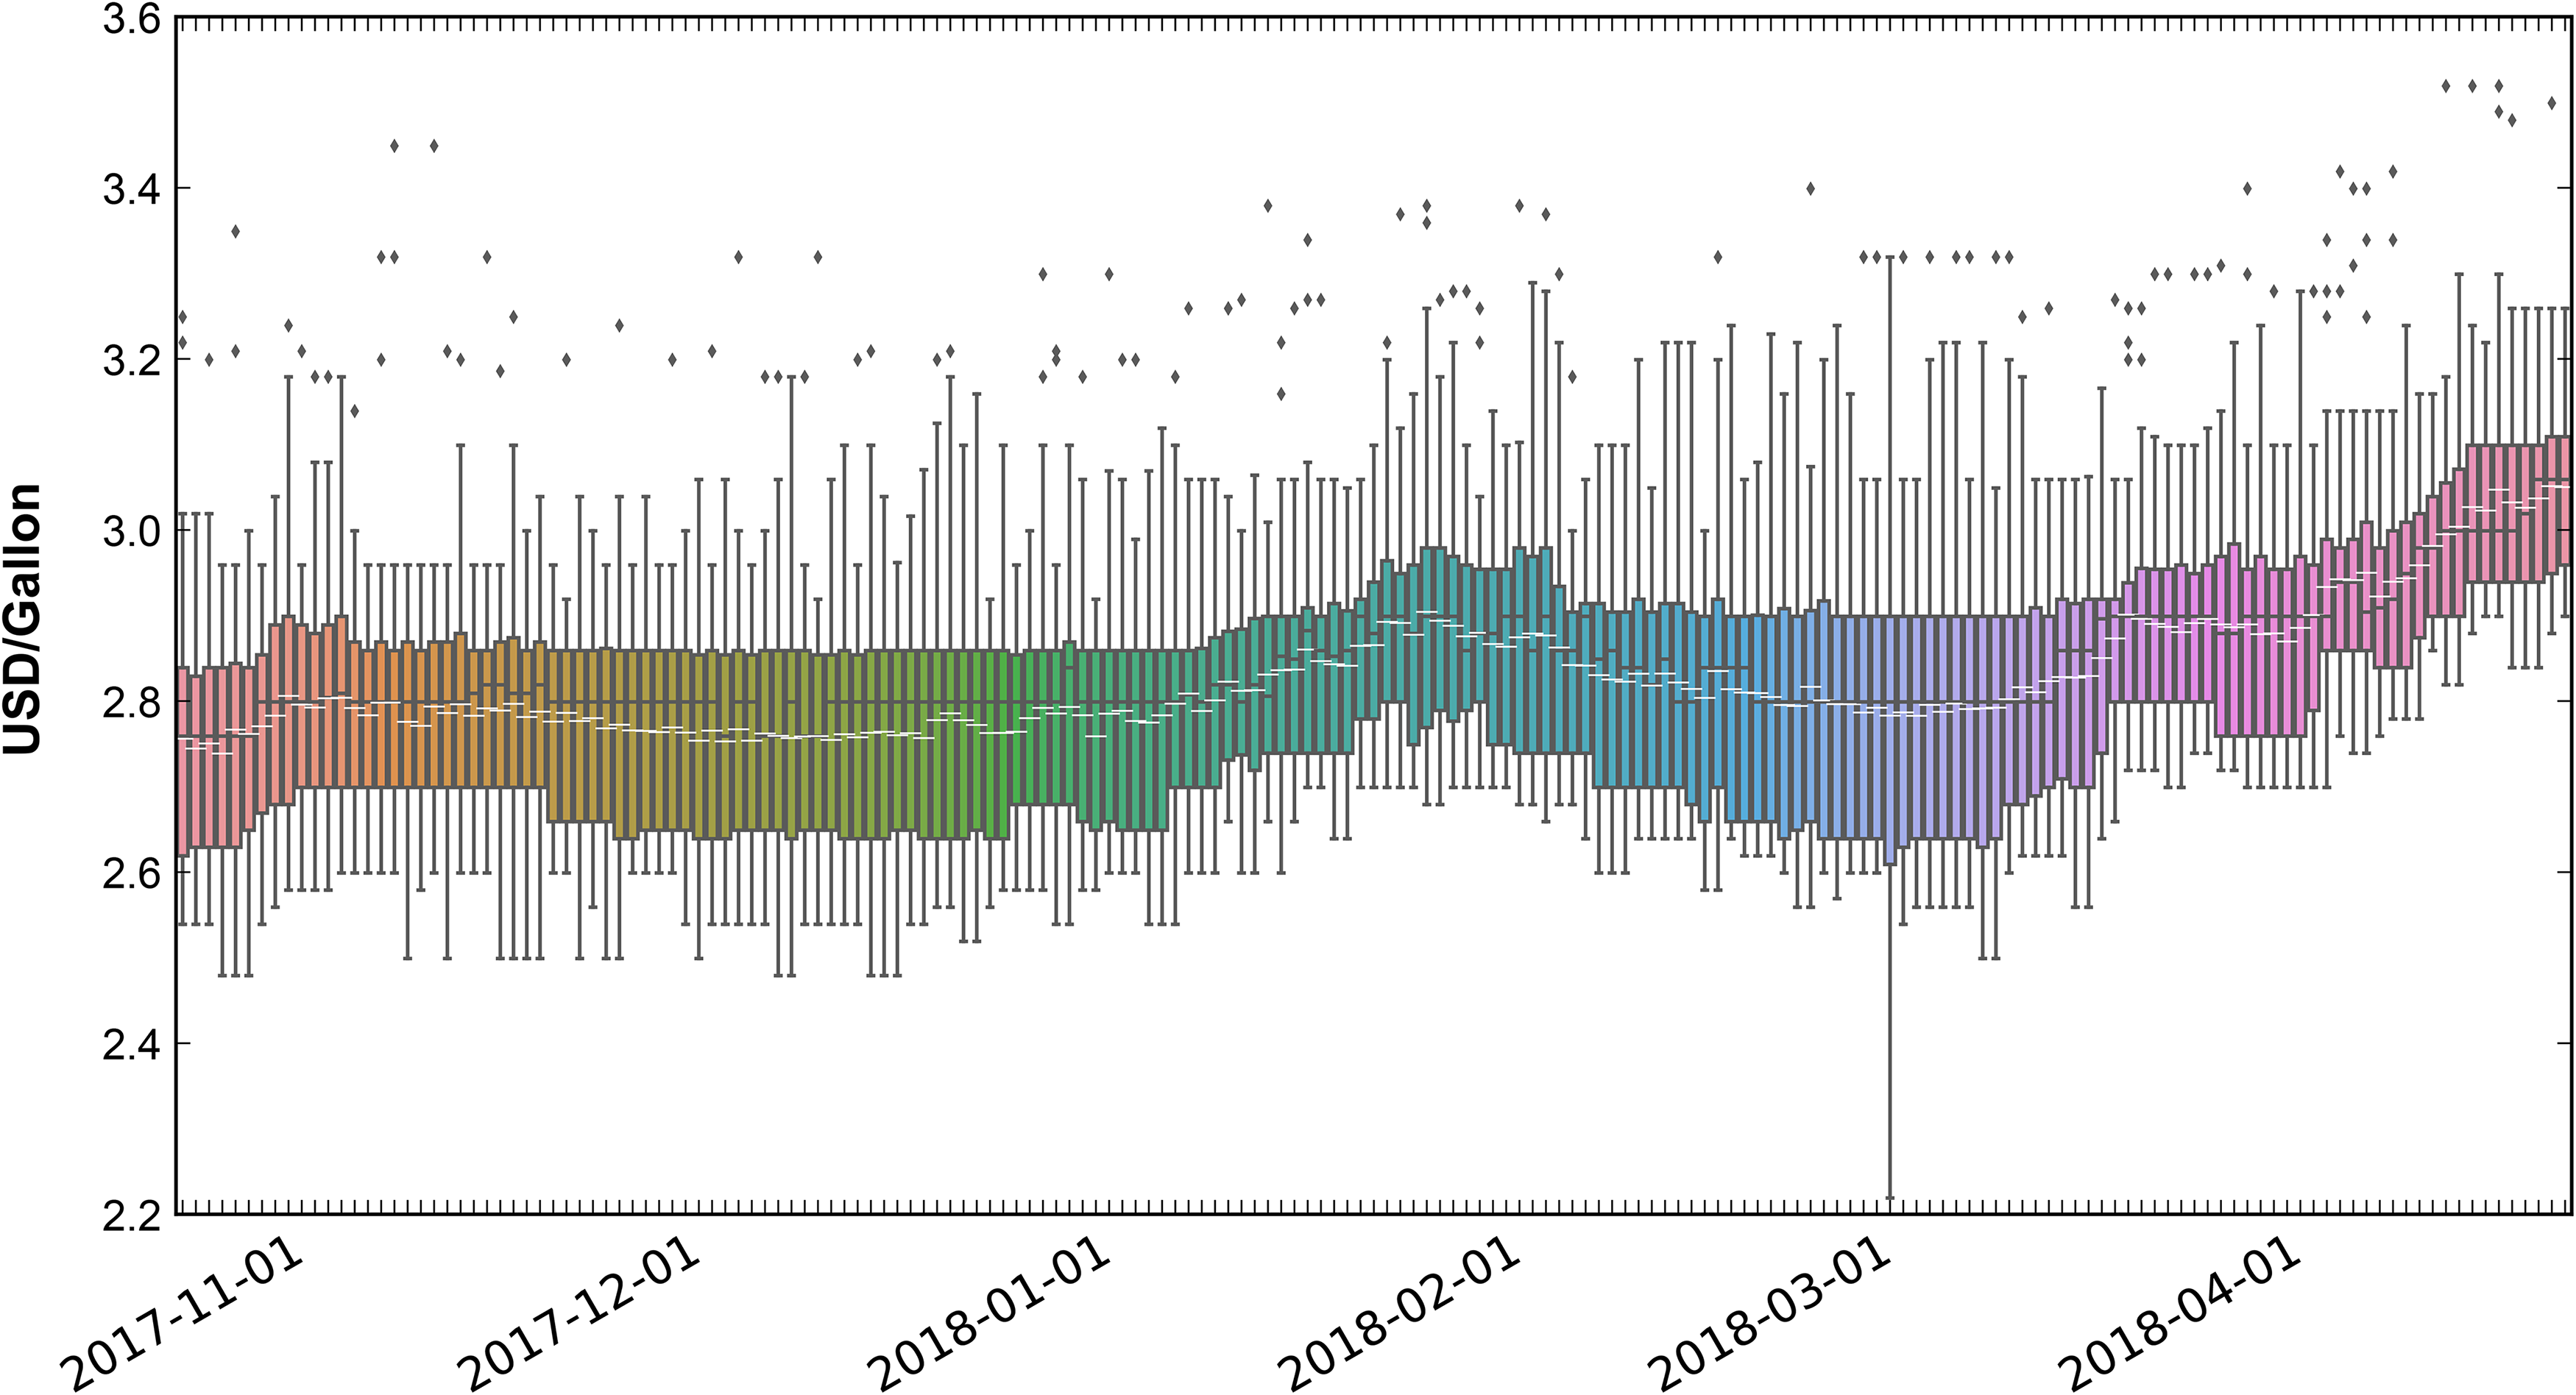
Distribution of the Price of Regular Gas at the Observed Gas Stations During the Period of Analysis.
General Approach
To associate gas prices (from the OPIS data set) with the observed gas stations in the urban mobility data, we matched the gas stations between the two data sets based on (1) the distance between respective store locations and (2) the brand name associated with the gas stations situated at each observed location. We then defined the set of fueling choices for each consumer as the 43 matched gas stations and the outside option (of not fueling up at any of those 43 stations). Importantly, since we could not observe consumers fueling up at any of the gas stations in Staten Island that were not observed in our urban mobility data, we bundled these stations into the outside option as well.
Unfortunately, our data do not include the gas stations’ sales transactions, and thus we do not observe consumers’ fueling behavior directly. Instead, we classify urban mobility data records as “fueling events” based on the context of observations. An observation is classified as a fueling event if (1) it is at one of the matched 43 gas stations, (2) the mobile device is no more than 16 meters away from the station, and (3) the duration of the observed session is between 120 and 1,500 seconds. Our rationale for doing so was as follows. First, since the accuracy of GPS sensors typically ranges between 1 and 10 meters, distances greater than 16 meters (the setting recommended by the data provider) are much more likely to correspond to false positives (i.e., devices actually outside the station). Second, very short sessions are more likely to correspond to devices passing near the station than to completed fueling sequences. Finally, long sessions are also more likely to capture devices near the station not for fueling, for example, employees working at the station or nearby. In our analysis, we test the sensitivity of our results to applying different cutoffs in the definition of fueling events. Our results (reported in Web Appendix A) are largely unchanged, irrespective of the cutoff values selected.
Similar to the approach of Ghose, Li, and Liu (2019), we defined consumers’ daily trajectories as the ordered sequences of all observations of their mobile device during the 24-hour interval starting at 4 a.m. on a given day. However, since urban mobility trajectories—proxied in our data by observations of each device near a specific set of retail chains—tend to exhibit substantial day-to-day variation, we could not simply rely on extracting features from consumers’ prior-day trajectories. To remedy this issue, we pooled trajectory data from several days (denoted by w) to explain and predict each observed “next-day” fueling choice. In particular, we defined the distance of each gas station from a given consumer's anticipated trajectory by averaging its distance from all daily trajectories of the consumer observed during the five days preceding the given day. 3 We illustrate our methodology in Figure 2.
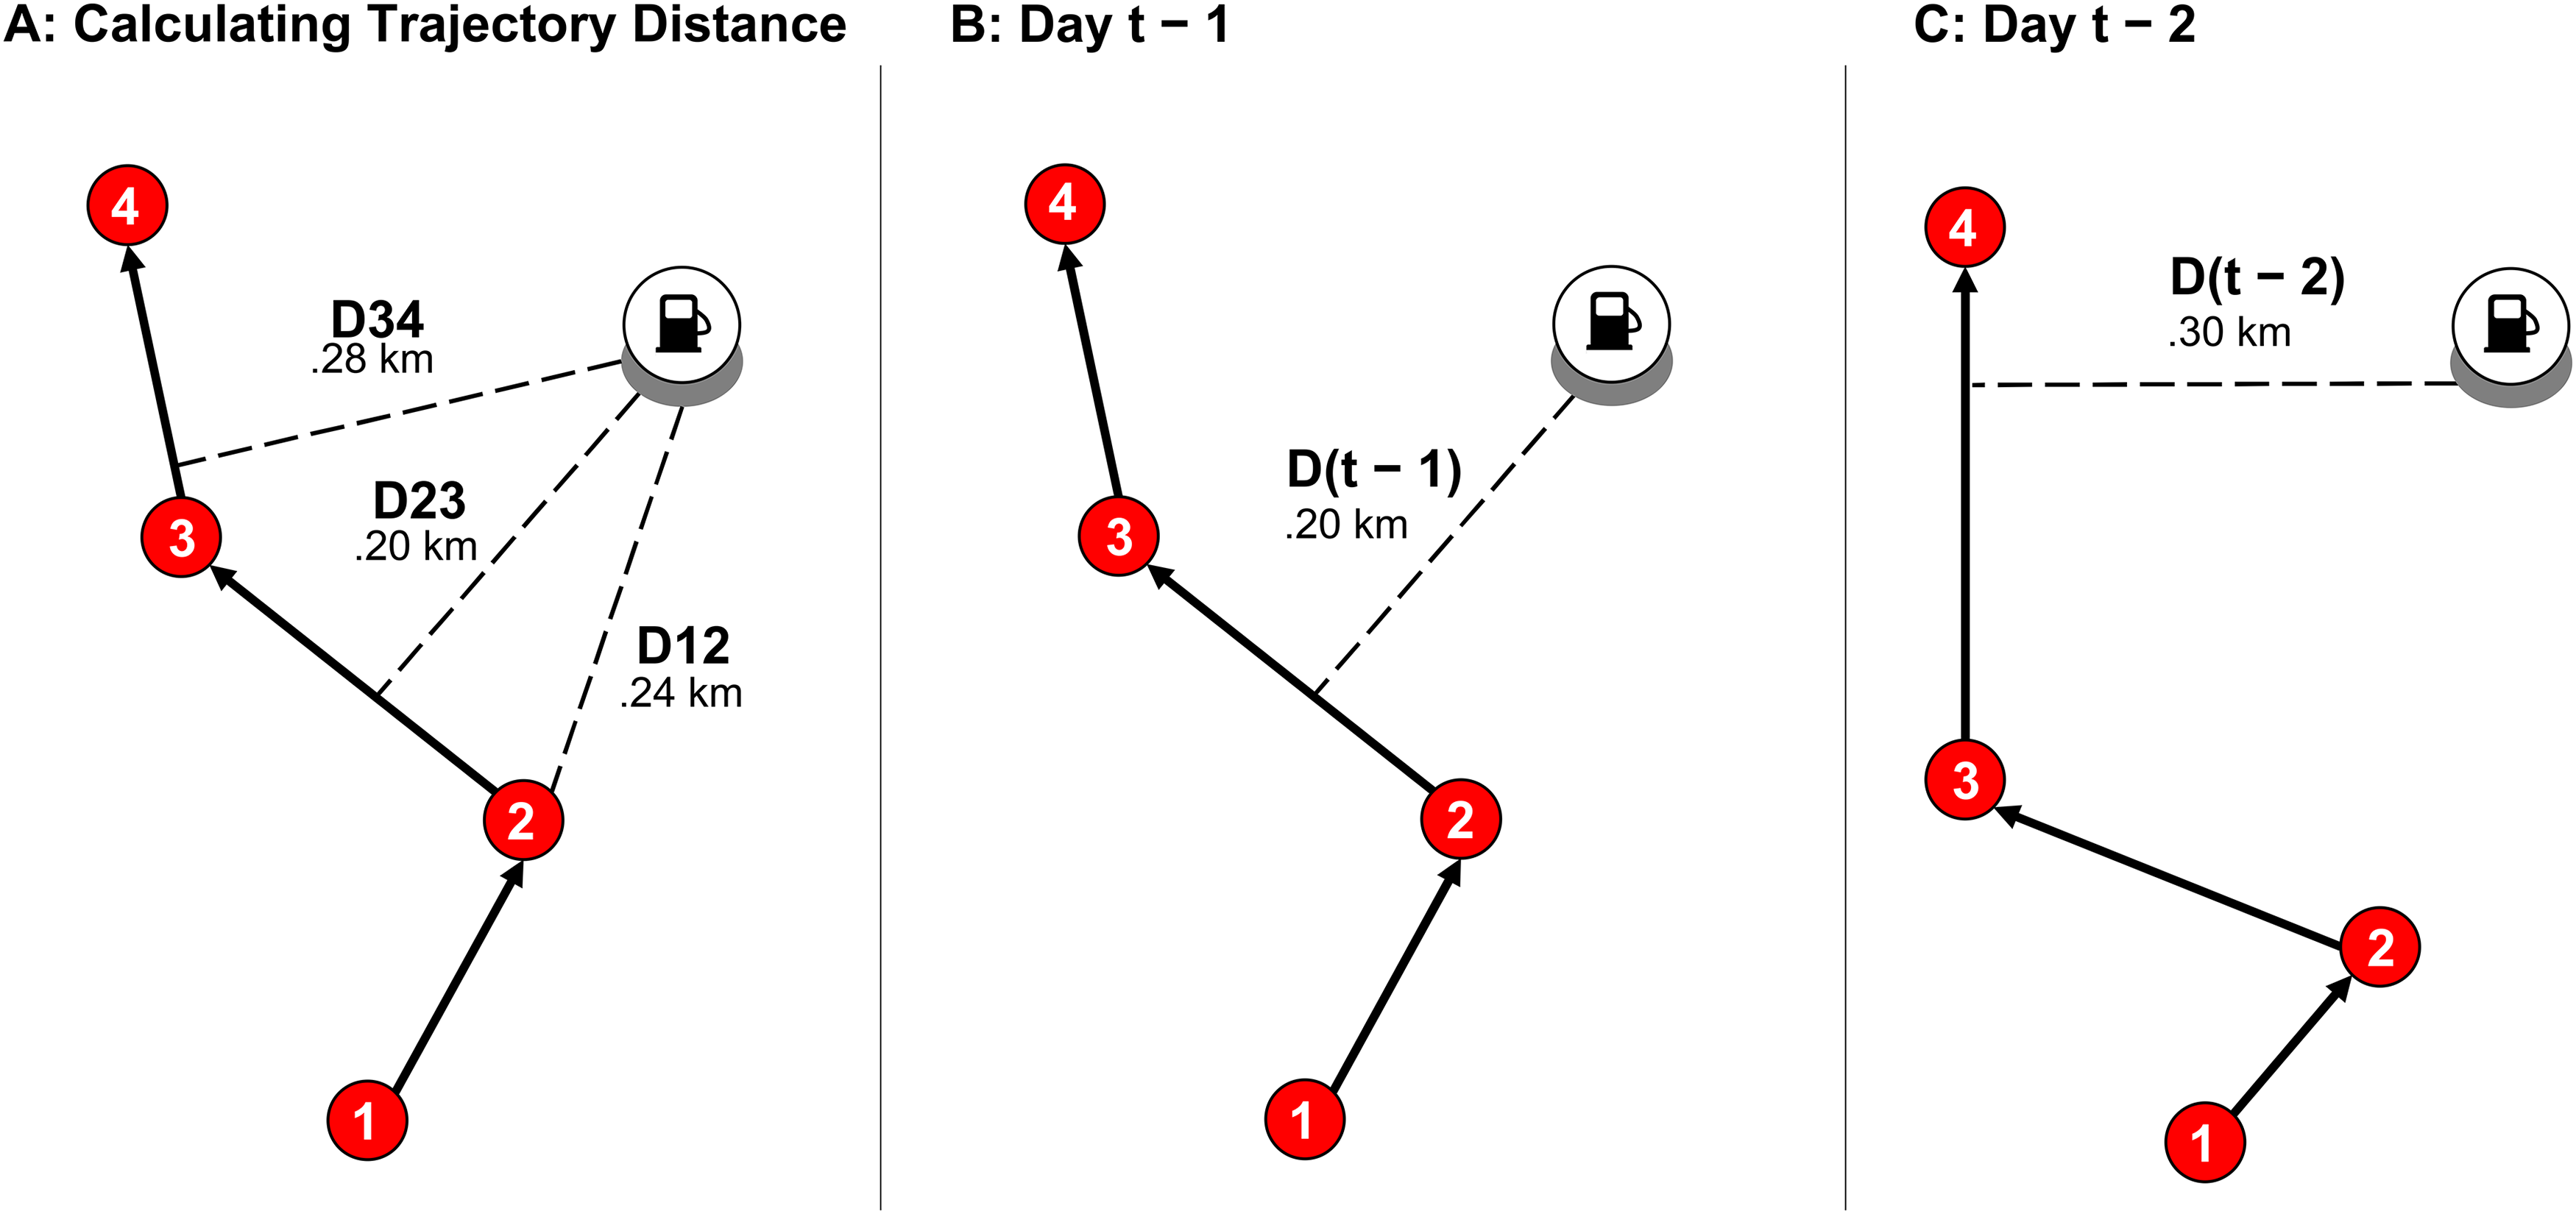
Illustrating the Steps of Our Trajectory-Based Distance Methodology.
Panel A of Figure 2 shows a consumer who was observed in the vicinity of stores 1–4 (in this order) on a given date. Their trajectory corresponding to that date is therefore the shortest driving path connecting the sequence of those four stores. Throughout our analysis, to determine the shortest driving path between any two locations, we used the shortest_path function of the OSMnx 4 Python package (Boeing 2017). Panel A also shows how we determined the driving distance of the gas station shown in the figure from the same consumer's trajectory: we first calculated the minimum (driving) distance of the station from each OpenStreetMap location along the shortest possible driving trajectory connecting the observed locations, and then we took the minimum of these distances to arrive at .2 kilometers. Panels B and C show how we then combined multiple trajectories to arrive at a more robust distance variable. Assuming that we observed the device of a given consumer on days t − 1 and t − 2 but not on days t − 3, t − 4, and t − 5, we would construct the distance of the station from the consumer's anticipated trajectory on day t by calculating the daily trajectory distances (.2 kilometers on day t − 1 and .3 kilometers on day t − 2, shown in Panels B and C of Figure 2, respectively), and averaging these values to arrive at a trajectory distance of .25 kilometers. We calculated this distance measure for each of the 43 gas stations, for each observation (of a given consumer's fueling choice, as inferred from their daily trajectory) in the data.
Finally, to focus on “category buyers” (i.e., consumers with a car, regularly fueling up in the observed market area), we excluded from the analysis consumers with fewer than two fueling events in Staten Island during the six months covered by our urban mobility data. In addition, we also removed consumers who were, using the preceding criteria, identified as having fueled their car on consecutive days; that pattern is not characteristic of refueling behavior, suggesting that at least one of those observations is falsely classified as fueling. Similarly, to ensure that fueling events would not become a direct determinant of the anticipated trajectory for subsequent fueling choices—which could lead to overestimating the impact of the distance of each station from consumers’ trajectories—we excluded all observations corresponding to the five days following each observed fueling event from our analysis. Finally, since some devices were not observed on some days, the distance variable, based on the five-day location history of the given device, contained missing values. We excluded the corresponding observations from our analysis.
Our full data set contains 1.06 million consumer mobility traces, that is, observations detected in the vicinity (i.e., within 100 meters) of the selected retailers, including gas stations, regardless of session duration. These mobility traces correspond to 26,853 devices that were detected near a gas station (for any duration) at least once during the observation period. After performing the aforementioned exclusions, we retained data on 903 consumers and a total of 62,810 (consumer-day) cases (including 1,227 fueling events). Table 3 summarizes the variables included in our analysis.
Summary of Variables.
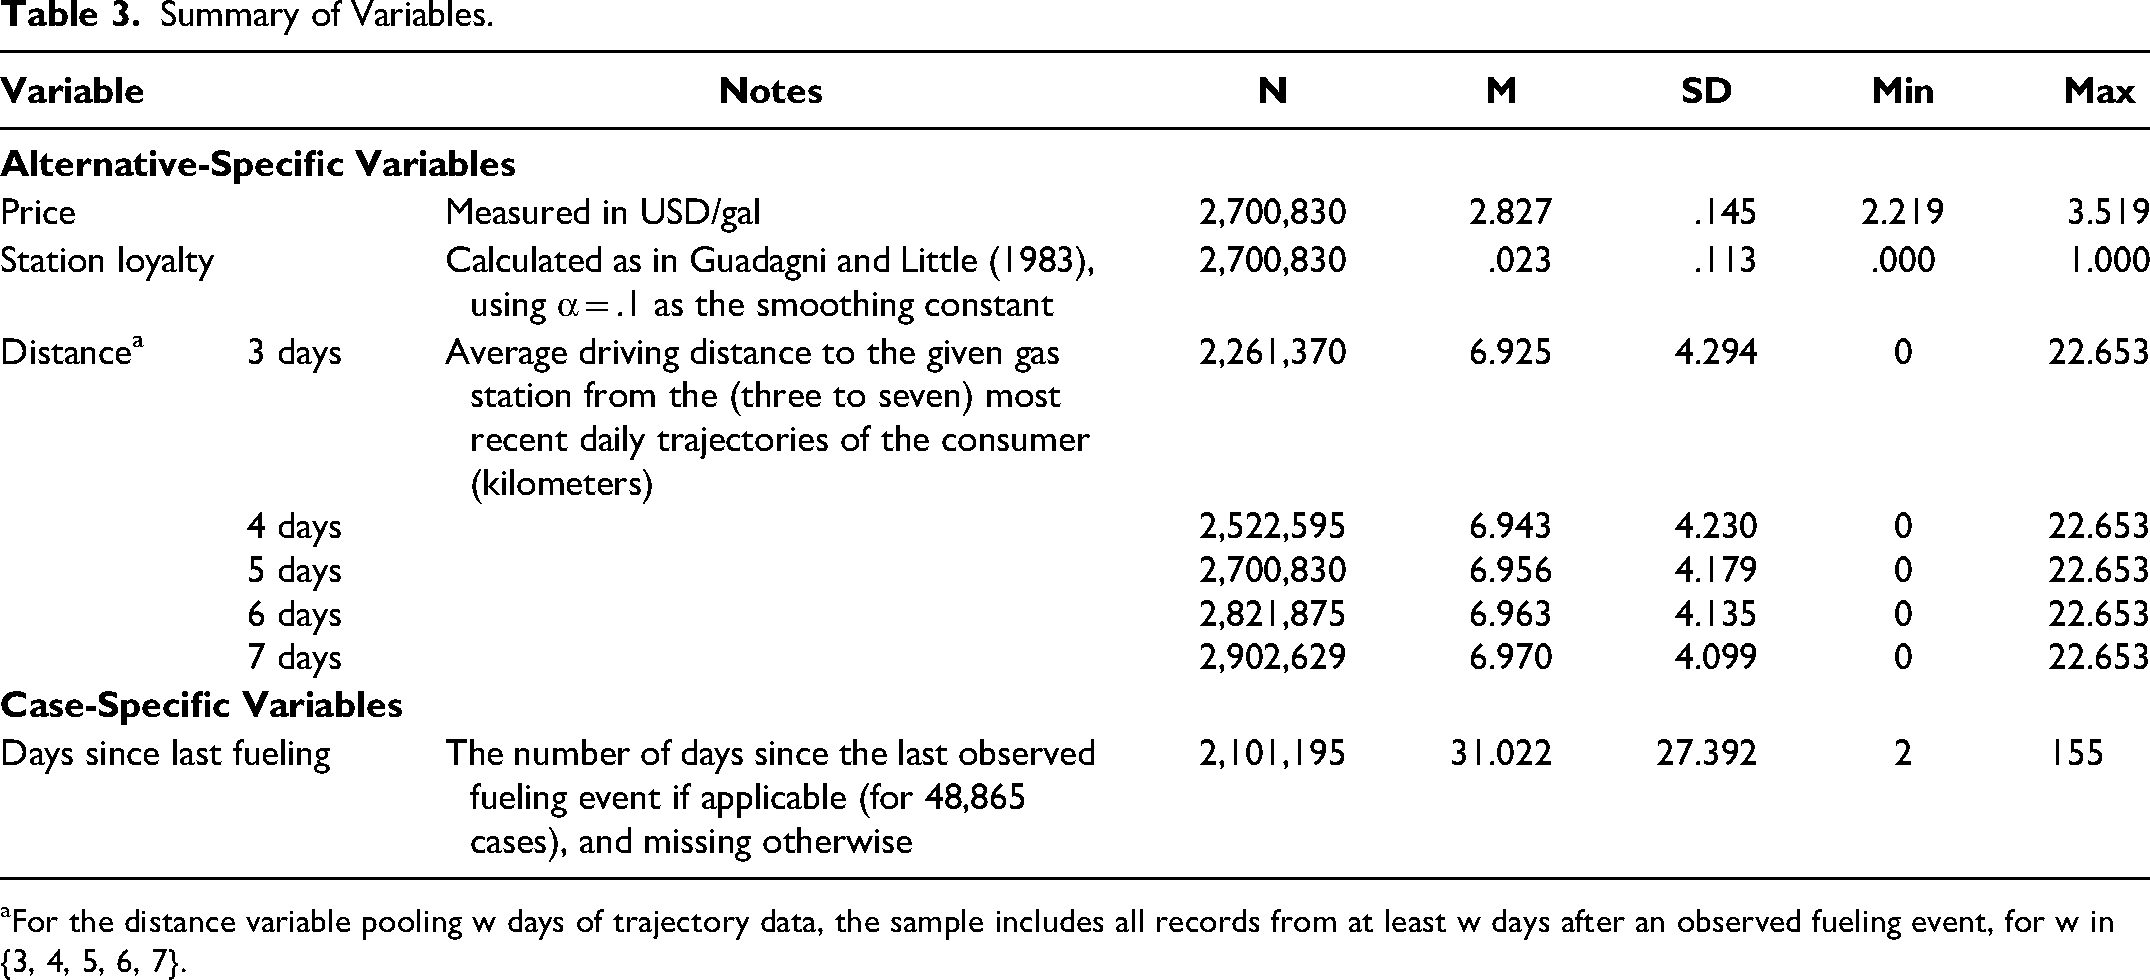
For the distance variable pooling w days of trajectory data, the sample includes all records from at least w days after an observed fueling event, for w in {3, 4, 5, 6, 7}.
Descriptive Analysis and Results
Analysis
To assess how consumers trade off gas price and driving distance, we estimated a conditional logit model of daily gas station choice. This model, introduced by McFadden (1973), assumes that the probability that individual i chooses alternative k from a choice set J at choice situation t is a function of the alternative-specific variables Xijt such that
For each consumer i and gas station j on day t, we included (1) the daily fuel price (Pricej,t) and (2) the aforementioned trajectory-based distance variable (Distancei,j,t). To control for regularities in interpurchase time, we included (3) the number of days passed since the last fueling event (if applicable) in the form of four dummies capturing interpurchase intervals of 6–7 days, 8–10 days, 11–14 days, and 15–19 days, respectively. Finally, to account for the asymmetric preferences between gas stations, we further included (4) brand dummies (Brandj) and (5) a station loyalty variable (Station Loyaltyi,j,t) ranging from 0 to 1, defined as in Guadagni and Little (1983). Specifically, for each consumer, before their first observed fueling event, we assigned the loyalty value of 1/43 to each gas station. After any day without an observed fueling event, we set each Station Loyaltyi,j,t+1 = Station Loyaltyi,j,t, whereas after consumer i was observed to have fueled up at station s on day t, we updated Station Loyaltyi,j,t+1 to (α × Station Loyaltyi,s,t + (1 − α)) for station j = s, and (α × Station Loyaltyi,j,t) for stations j ≠ s, for the smoothing constant α = .1. 5 The loyalty variables thus sum to 1 across all stations, for any given observation. Finally, to account for the possibility that consumers are less sensitive to the distance of stations they previously fueled at, we also included the interaction of Distancei,j,t and Station Loyaltyi,j,t.
Each of the 62,810 choice situations corresponds to the daily fueling behavior of one consumer: they either chose one of the 43 gas stations or decided not to fuel up at any of them. For the outside option that stands for not fueling up at any of the observed gas stations, we set each independent variable to 0, save for its own constant, which takes 1 for the outside option and 0 for every other alternative. We note that accounting for the no-choice option and adding its constant generally leads to better model and predictive fit and reduces bias in the other estimated coefficients (Haaijer, Kamakura, and Wedel 2001).
Results
We estimated a pair of nested models (Models 1 and 2) that differed only in the distance-related variables. The results, reported in Table 4, reveal that the Staten Island gasoline market exhibits very strong station loyalty: compared with any other station, the average consumer is about seven times more likely to choose the station they last fueled up at (Model 2, B = 2.140; p < .01). 6 However, despite this strong inertia in consumer behavior, we could also identify the effect of other covariates. Consistent with expectations, we found that both the fuel price at a given station (B = −.653; p < .01) and the distance of that station from a consumer's anticipated trajectory (B = −.314, p < .01) decrease the probability of fueling up at that station, even after controlling for the brand of the station, interpurchase time, and station loyalty. Nonetheless, consumers are significantly less sensitive to the distance of stations they are more loyal to, as indicated by the positive coefficient of the interaction variable (B = .235, p < .01). Furthermore, whereas incorporating location information through the distance variable only slightly reduced the coefficient of price, it vastly improved model fit, increasing McFadden's pseudo R2 from .0760 to .1149 (LR(Model 2 vs. Model 1) = χ2(1) = 828.48, p < .01). This lift in model fit is a clear indication that past mobility trajectories are useful for explaining future fueling choices. In particular, comparing the effects of price and distance, we learned that consumers are willing to deviate only an additional 21 meters from their anticipated trajectory for each additional $.01/gallon price advantage. Echoing Houde's (2012) findings, this result suggests that consumers are unlikely to drive far from their commuting path; the advantage of our methods over Houde’s simulated results, however, is that we can clearly separate this extreme distance sensitivity from station loyalty thanks to our ability to detect individual fueling events using our urban mobility data.
Estimation Results for Our Main Models (Pooling Five Days of Trajectory Data for Consumers).
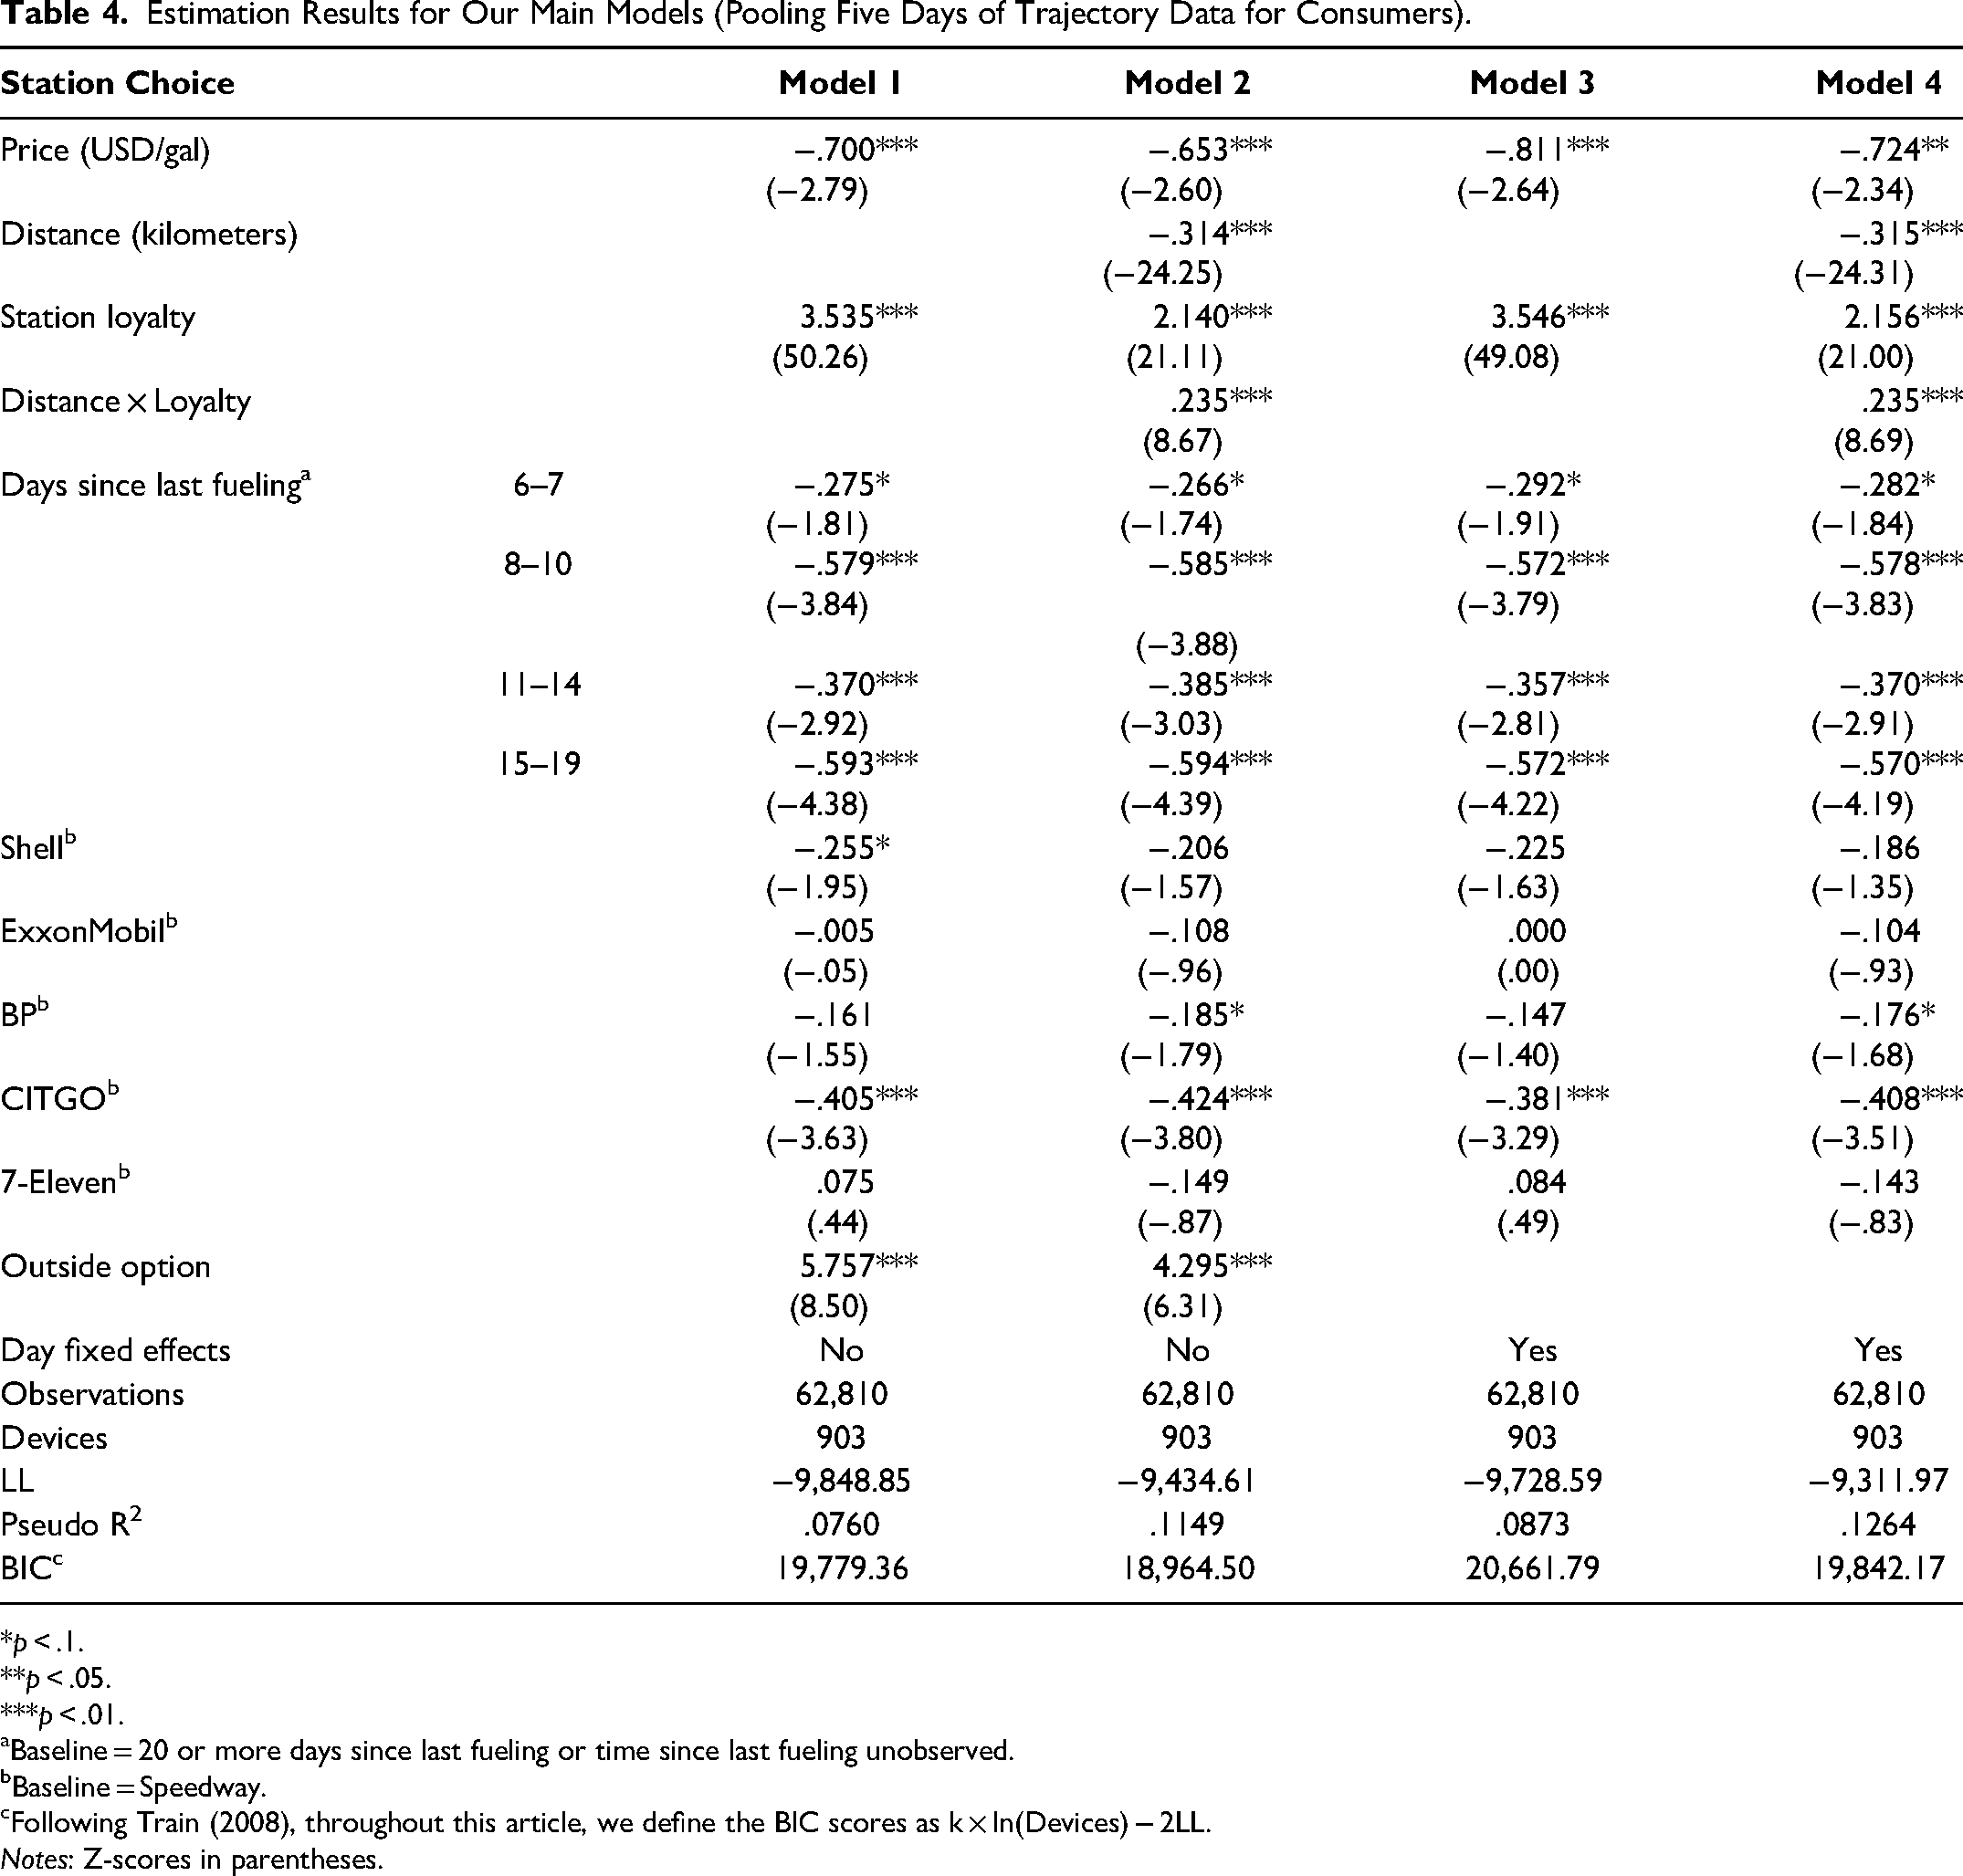
*p < .1. **p < .05. ***p < .01.
Baseline = 20 or more days since last fueling or time since last fueling unobserved.
Baseline = Speedway.
cFollowing Train (2008), throughout this article, we define the BIC scores as k × ln(Devices) − 2LL.
Notes: Z-scores in parentheses.
Validity Tests
To test the robustness of our findings, we ran additional analyses after relaxing several assumptions of our main model (Model 2). First, we explored the possibility that market-level demand shocks or the heterogeneous fueling rates of consumers may affect our result estimates. Second, we explored alternative definitions of trajectory distance; varying both the scope of as well as the method to aggregate consumers’ mobility trajectories. Third, we explored the possibility that the (marginal) effect of both price and distance may vary with the distance from one's anticipated trajectory. Finally, we considered how the session length cutoffs used to classify location observations as fueling events may affect our results.
Controlling for endogenous price variation
A key assumption of our models is that prices are set exogenously to consumer fueling decisions. However, prices may reflect market-level demand shocks, and this could bias the estimates of price (Coglianese et al. 2017; Levin, Lewis, and Wolak 2017). To remedy this issue, we replaced the pooled outside option with day fixed effects in Models 1 and 2. The results of the corresponding estimations (Models 3 and 4) are reported in Table 4. We note that all coefficients of interest remained strongly significant, and largely similar in magnitude to the values reported for Models 1 and 2, respectively. Consistently with our previous findings, Model 4 estimated consumers’ willingness to deviate from their anticipated trajectories for each additional $.01/gallon price advantage at 23 meters.
Controlling for individual differences in the base rates of observable fueling events
In addition to endogeneity concerns, estimating a common baseline for the outside option also raises the issue that pooling consumers with heterogeneous fueling rates may bias our estimates. We note that the heterogeneity of consumers’ observed fueling rates in our data may result from different driving behavior (Houde 2012; Yatchew and No 2001) and/or the varying observability of their devices (potentially affected by the type of their handset, etc.) to our data source. To account for consumer heterogeneity arising from either or both sources, we replaced the pooled outside option with device-level intercepts. To do so, we first removed from our data all devices that had no variation in their observed 0–1 fueling behavior within the 62,810 cases considered in Models 1–4. The remaining sample contains 54,302 cases (including 1,221 fueling events) by 704 consumers. For completeness, we then replicated Models 2 and 4 on this restricted sample, and then estimated two models that also included device-level intercepts of “fueling utility.”
The results of this analysis are reported in Table 5. We first note that the coefficients of Models 5 and 6 are essentially identical to those of Models 2 and 4 (in Table 4), indicating that restricting our sample to fewer devices did not affect our results. For the models with device-level intercepts, we found that although the distance coefficient remained about the same, the estimates of price increased by about 20%, implying that consumers are willing to deviate approximately 27 meters off their anticipated trajectory for each additional $.01 of gas price advantage. Taken together, these results indicate that our findings are not driven by either endogenous price variation in the Staten Island gasoline market, the heterogeneous driving behavior of consumers, or the varying observability of their mobile devices. Thus, the results of Models 5–8 provide additional support for the strong tendency of consumers to not deviate far off their (anticipated) trajectories to fuel up. Finally, we note that the lowest Bayesian information criterion (BIC) scores in Table 4 and Table 5 correspond to Models 2 and 5, respectively, implying that the model without time trends and device-level intercepts best explains our data. For this reason, in the remainder of the article, we continue to treat Model 2 as our main model.
Estimation Results on the Sample Allowing Device-Level Intercepts (Pooling Five Days of Trajectory Data).
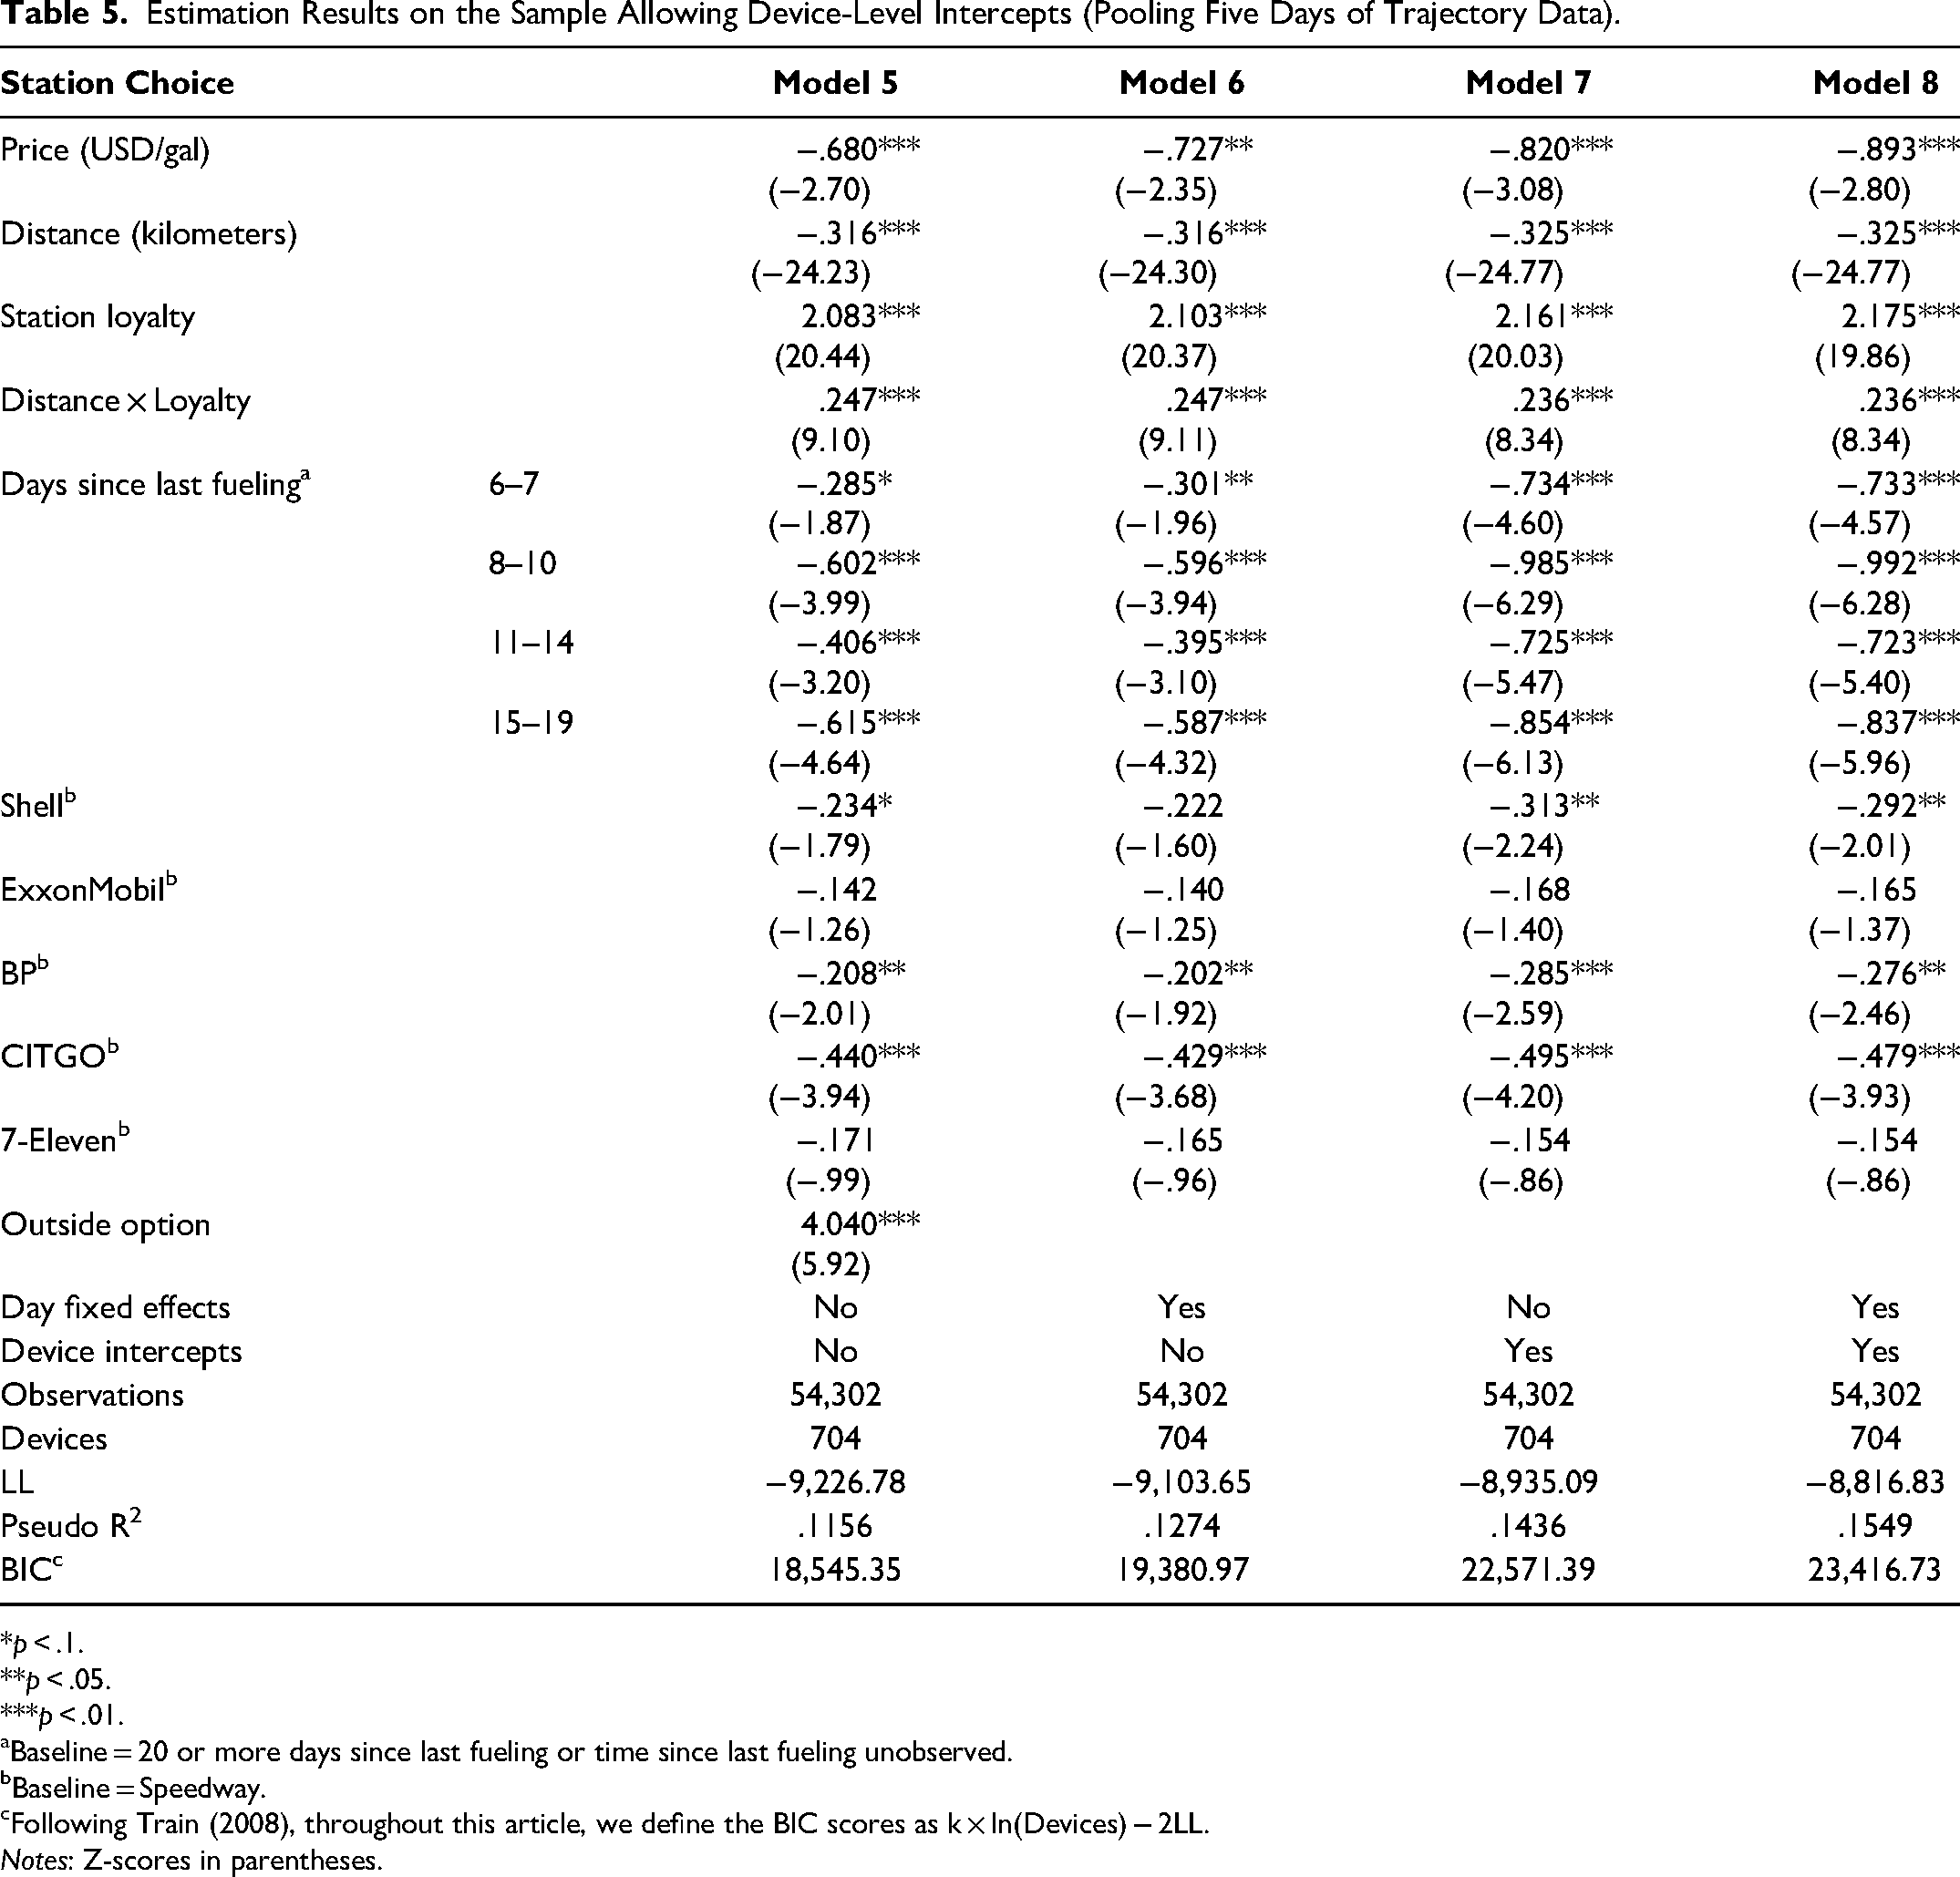
*p < .1. **p < .05. ***p < .01.
Baseline = 20 or more days since last fueling or time since last fueling unobserved.
Baseline = Speedway.
cFollowing Train (2008), throughout this article, we define the BIC scores as k × ln(Devices) − 2LL.
Notes: Z-scores in parentheses.
Alternative definitions of trajectory distance
A key obstacle in using past mobility data to explain the future behavior of consumers is that consumers’ future location choices may affect the context they eventually choose a retailer in. Thus, a useful model needs to deal with the uncertainty arising from both consumers’ future trajectory choices and their trade-off of prices versus distances given those choices. To balance these objectives, we proposed to define trajectory distance by averaging the distance of each gas station from consumers’ mobility trajectories from the five days preceding the given choice situation. To test the robustness of our results to this choice, we tested alternative strategies to infer the distance of each station from consumers’ anticipated trajectories.
First, we considered the possibility that any station near at least one of the typical routes of a consumer may be more likely to be considered when fueling up. To this end, we estimated a series of models looking at minimum distance, defined simply as the minimum distance of each station from the up to five trajectories considered prior to the day in question. The results of this estimation, reported in Web Appendix B, are highly consistent with those of our main model. However, both the overall model fit, indicated by the BIC scores, and the model including both trajectory distance variables in the same model indicate the superiority of the specification averaging trajectory distances. However, in a variant of Model 2 that allowed the slope of price to differ for those stations that were near—within 50 meters of—any of the given consumer's five daily trajectories prior to the day of an observation, we found the estimate for the so-defined price × “recently seen” variable to be significant positive, providing evidence that consumers are slightly less sensitive to prices at stations next to their recent trajectories.
Next, we explored the optimal balance between the representativeness of daily trajectories and missing data. To this end, we tested how pooling more or fewer than five days of trajectory information may affect our results, and we explored the impact of considering separate weekday and weekend trajectories based on trajectory data from the past eight days. While the results, reported in Web Appendix B, show no major improvement over our main model, they also underline the main benefit of pooling data from sparse trajectories. As expected, pooling data from more consecutive days increased the size and significance of the effect of distance. More surprisingly, we also found the impact of trajectory data collected on weekdays to be more informative not only regarding fueling choices on weekdays, but also explaining fueling choices made on weekends.
Assessing the moderating effect of distance, and considering alternative definitions of fueling events
In addition to the preceding sensitivity tests, we estimated a variant of Models 2 and 4 that allowed for a different effect of price and a different marginal effect of distance for four different intervals of trajectory distance, and also checked different cutoffs for the fueling events. In both cases, we found qualitatively similar results (reported in Web Appendix C), with the distance consumers are willing to drive to obtain an additional $.01 price advantage estimated between 4 and 44 meters for gas stations within 10 kilometers of consumers’ anticipated trajectories. In summary, we conclude that our default settings are appropriate to study fueling behavior using urban mobility data. To further validate our findings, we next explored whether our results are robust to heterogeneity in consumer preferences.
Accounting for Consumer Heterogeneity
While the initial evidence for the robustness of our results is promising, it is natural to ask whether it is appropriate to pool data from all consumers together to estimate their sensitivity to trajectory distance. Consumers may be heterogeneous in their price and distance sensitivities for multiple reasons. These include the availability and the pricing strategy of gas stations near their residence, their lifestyles (e.g., whether they commute to work and/or drive children to school each day), and indicators of their socioeconomic status, such as income.
Consumers’ home location could reveal heterogeneity corresponding to any of the preceding factors. However, to protect consumers’ privacy, our data only reveal visits to registered businesses, and we do not possess data revealing consumers’ home addresses. Therefore, we adopted two approaches to account for consumer heterogeneity in our analysis. First, we built a model that allows the estimates of distance sensitivity to vary by zip code, and we inferred consumers’ likely home zip code from their mobility trajectories. Second, we estimated a latent class model to account for unobserved patterns of consumer heterogeneity.
Mapping devices to zip codes
The standard method for identifying consumers’ home location is to observe their 30-day location history and pick the location they are most frequently observed at in the middle of the night, for example, at 4 a.m. (Alessandretti et al. 2018). However, as we noted previously, our data do not contain consumers’ home location, only the locations of select retail stores that they were observed in the vicinity of. To circumvent this problem, we developed a method for clustering consumers based on observations near retailers, and assigned a “home” zip code to each consumer based on their overall trajectory patterns (throughout the entire study period). First, from each {consumer, day} tuple, we took the store that the consumer was last observed at on the given day (between 4 a.m. that day and 4 a.m. the next day). Second, for each consumer, we took the most frequent store in that series of stores as their “home” store. Finally, we assigned to each consumer the zip code of the “home” store selected for them.
Although this process is bound to produce a noisy mapping, we note that the number of devices mapped to zip codes is highly correlated with the population of the same areas (based on 2019 census data estimates: r = .70, p < .01), evidencing the representativeness of our data. In addition, a chi-square test revealed no significant differences between the distribution of devices assigned to different zip codes and the distribution of observations corresponding to those devices (χ2(11) = 11.93, p = .37). This means that devices assigned to different zip codes were “equally observable,” and thus estimating separate distance sensitivities for each zip code does not introduce a selection bias. Therefore, we proceeded by estimating a variant of Model 2 that allowed distance sensitivities to vary between zip codes.
The results of this estimation (Model 9) are reported in Table 6. We note that, while distance sensitivity indeed seems to exhibit considerable geographic heterogeneity, the effect of distance was consistently negative and significant (−.383 ≤ Bs ≤ −.269; all ps < .01) for each of the 12 zip codes in Staten Island. In addition, the effect of price remained about the same as in our main model (B = −.674; p < .01). We thus estimated consumers’ willingness to deviate from their anticipated trajectories for each additional $.01/gallon price advantage to be between 17.6 meters (zip code 10302) and 25.1 meters (zip code 10309). On the one hand, these results show that the results of Model 2 are robust to modeling the geographic heterogeneity of consumers’ preferences. On the other hand, we note that the BIC score corresponding to Model 9 is higher than that of Model 2, suggesting that little additional value is gained from allowing distance sensitivities to vary between zip codes.
Estimation Results with Separate Distance Sensitivities by “Home” Zip Code.
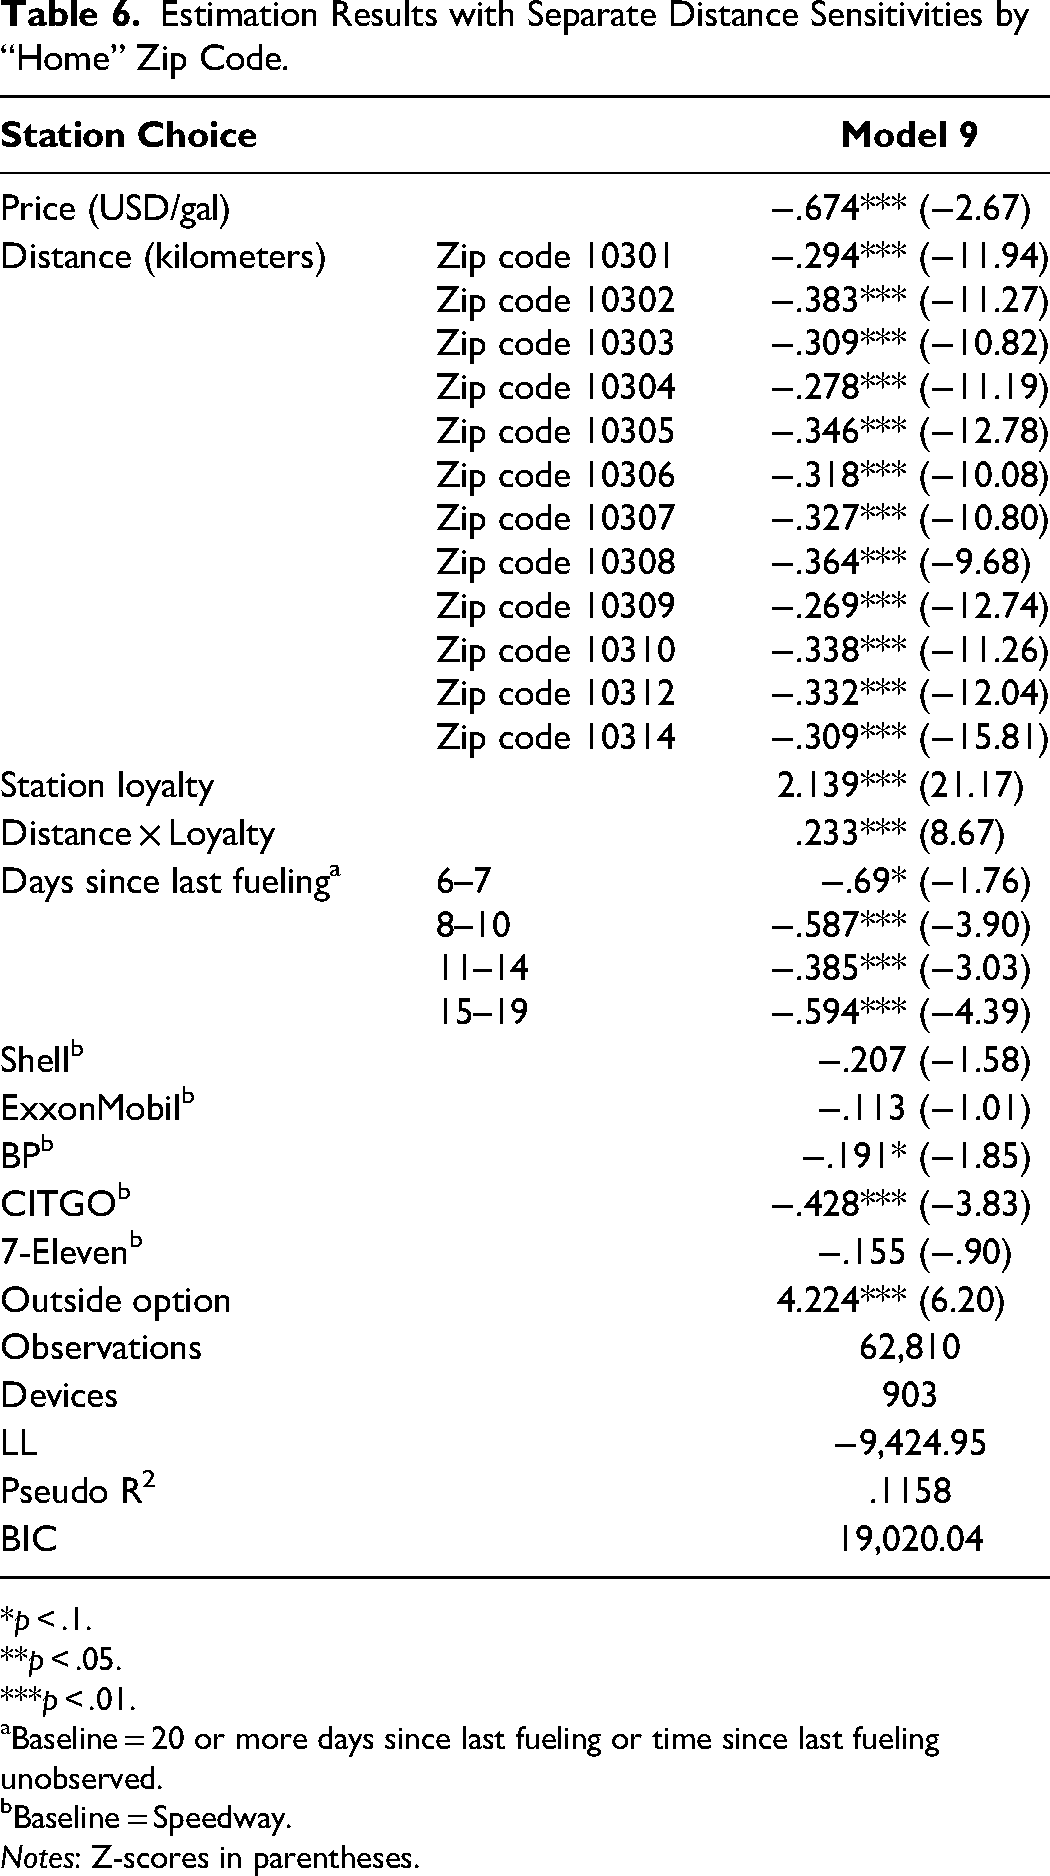
*p < .1. **p < .05. ***p < .01.
Baseline = 20 or more days since last fueling or time since last fueling unobserved.
Baseline = Speedway.
Notes: Z-scores in parentheses.
Modeling heterogeneity via latent classes
To account for the possibility that consumers in Staten Island exhibit heterogeneity in ways that are not reflected in their “home” zip codes, we also estimated a latent class conditional logit (LCL) model. In contrast to the conditional logit model, our LCL model allowed all regression coefficients to vary across classes, and the likelihood of the individuals belonging to a class was also modeled as a probabilistic function. Specifically, for a LCL model with C classes, the probability that individual i chooses alternative k from the choice set J (containing the 43 observed gas stations and the outside option) at choice situation (day) t conditional on belonging to class 1 ≤ c ≤ C was estimated as

Estimation Results for the Model with Two Latent Consumer Classes.
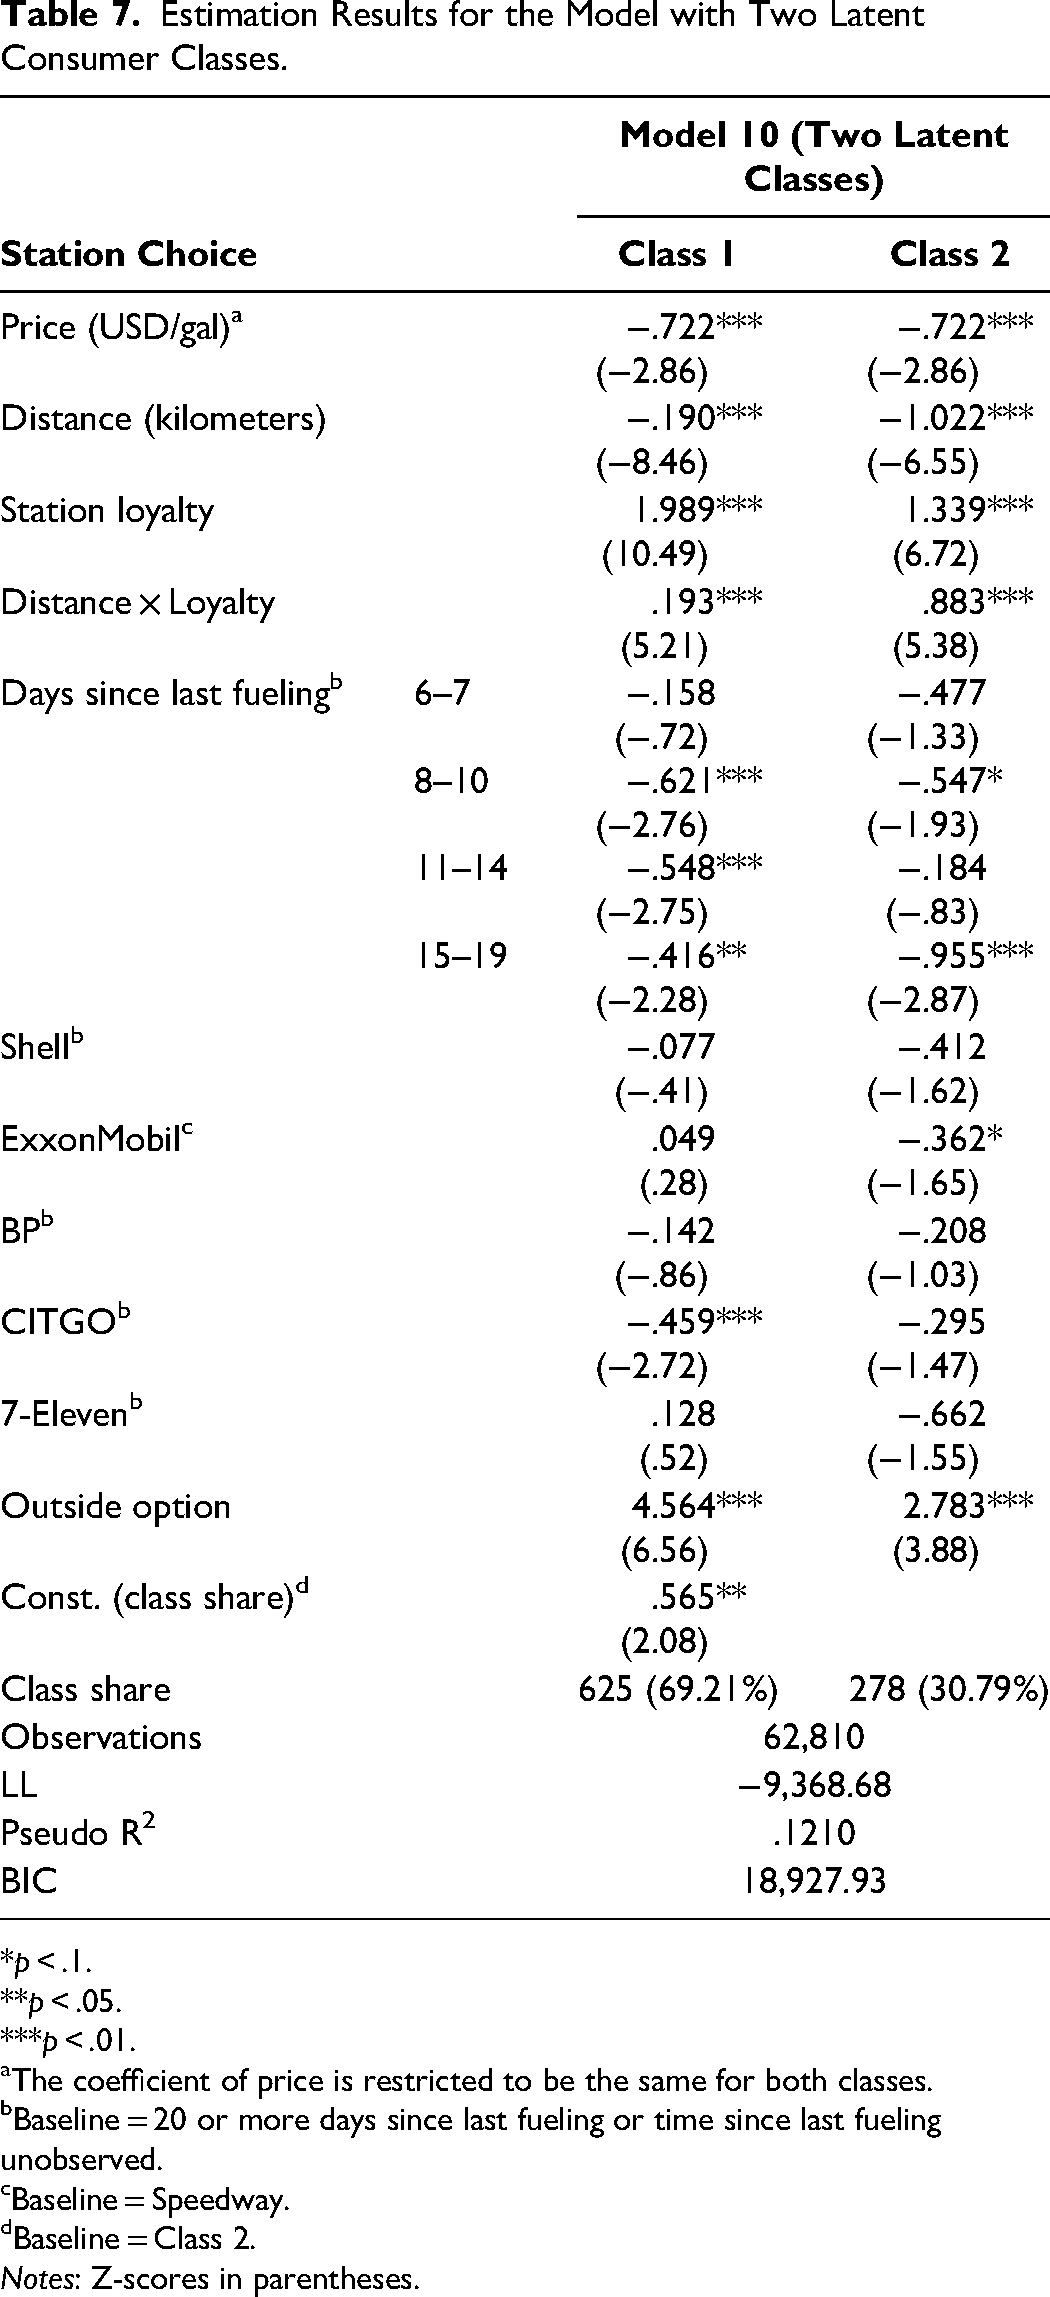
*p < .1. **p < .05. ***p < .01.
The coefficient of price is restricted to be the same for both classes.
Baseline = 20 or more days since last fueling or time since last fueling unobserved.
cBaseline = Speedway.
Baseline = Class 2.
Notes: Z-scores in parentheses.
Concerning the results of our main interest, we found that while distance is a significant driver of choice for both classes, its effect is over five times as strong for Class 2 as for Class 1 (B = −.190; p < .01 in Class 1, and B = −1.022; p < .01 in Class 2). Furthermore, we found that the coefficient of price, constrained to be the same for both classes, is consistent with that in Model 4 (B = −.722; p < .01). Consistently with our previous results, the estimates for both classes suggest that consumers are not willing to drive far off their common trajectories for better gas prices: consumers in Class 1 are willing to drive the most, 38 meters, for each additional $.01 price advantage, whereas for consumers in Class 2, the trade-off is only about 7 meters per $.01. Related to these findings, we also found considerable heterogeneity in station loyalty (B = 1.989 in Class 1, and B = 1.339 in Class 2; both ps < .01). Compared with any other station, a consumer in Class 2 (Class 1)—estimated to comprise approximately 30% (70%) of the observed population—is only about 3.3 (6) times more likely to choose the station they last fueled up at. This leaves ample room for gasoline retailers to potentially benefit from the analysis of consumer location trajectories. We attempt to quantify these potential gains next.
Predictive Analysis and Results
The results of our descriptive analysis show a strong link between location histories and store choice. In particular, we found that including trajectory-distance data is crucial for improving the in-sample assessment of retailer choice. However, we expect that a model will be useful for gasoline retailers if it is also able to predict the fueling choices of consumers. For this purpose, we assessed the value of including trajectory data in our main model and compared the out-of-sample predictive performance of Models 1 and 2. For ease of exposition, we split our data into a training set, comprising all observations collected during the first 16 weeks of our data (on or before March 4, 2018), and a test set, containing all records from the last eight weeks (from March 5, 2018). In the resulting split, the test set contained 20,196 observations (32.15% of all data).
To assess the impact of incorporating the distance variable on the predictive accuracy of our main model, we performed two tests. In each of these, we estimated both Models 1 and 2 on the training data and used the trained models, respectively, to predict the fueling choice for each case in the test data. In our first test, we then calculated the LL (cross-entropy) of each model on the test data, and performed a likelihood ratio test. This method has the advantage that it puts the outside option of not fueling up at any of the observed gas stations, chosen in about 98% of cases, on even footing with each of the 43 gas stations that share the remaining 2% of observed choices. We found that incorporating location data substantially increased the out-of-sample fit of our model (in particular, LR(Model 2 vs. Model 1) = χ2(1) = 214.38, p < .01).
In addition, we also performed a test of out-of-sample classification on those 447 out-of-sample observations that correspond to fueling events. In this test, we simply compared the rates at which each model correctly predicted which of the 43 gas stations was chosen on those occasions when a consumer fueled up. We note that, due to the strong station loyalty in the market, even the model without trajectory data performed well at this task: while the most popular gas station in our test data (the Exxon station at the intersection of Arthur Kill Road and Richmond Road) was chosen in only 8.05% of the observed fueling events, Model 1 classified 39.37% of cases correctly. Nevertheless, incorporating trajectory information improved classification accuracy even further, with Model 2 correctly predicting the chosen gas station in 41.83% of the cases (a 6.25% lift over Model 1).
Taken together, these results provide strong evidence that incorporating trajectory data produces more useful models of gas station choice: considering consumers’ tendency to choose gas stations very close to their anticipated trajectories is essential even after accounting for the strong station loyalty in the market. Next, we present an example to illustrate how retailers could use our main model to optimize their customer acquisition efforts.
Application: Estimating the Value of New Customers
An important benefit of our model is that we can simultaneously estimate station loyalty with how consumers trade off gas prices and store distance. Doing so allows us to calculate both the direct and indirect value from acquiring a new customer. In the subsequent example, we consider the highest amount a gas station should be willing to pay to acquire a customer, for example, via mobile search advertising. We argue that the profit resulting from a conversion (a transaction at the gas station) could be as high as Π = Qavg × (P − C) + Πstore + Δ × Π, where Qavg = 11.7 gallons is the average amount of gasoline purchased per fueling event (Statista 2021a), P is the price of gasoline at the station, taken as given in our test data, and C stands for the variable cost of gasoline. 7 Then, Πstore denotes the expected profit contribution on one fueling visit by the customer—coming from complementary sources such as convenience store sales—and Δ denotes the increase in the probability of a repeat visit by the customer given the estimated station loyalty in the market. 8
To estimate C, we assumed an average gross profit margin of 9% for each gasoline brand, 9 and averaged daily prices within brands to determine the daily cost of regular unleaded gas for stations of each brand. The resulting estimates of gross profit margin on gasoline ranged from $.12 to $.46 per gallon. To obtain Πstore, we consulted industry research arguing that only 29% of fueling customers purchase anything in the convenience store (Oller 2015). At an $8.83 average bill per customer (Statista 2021b) and a 40% average gross margin on convenience store items, that figure translates to $1.02. Finally, for each station, we derived the “postfueling lift” in each consumer's station choice probabilities using the coefficients of the model estimated on the training data, while also accounting for the trajectory distance of the given gas station from the consumer's anticipated trajectory, and averaged these values to obtain the postfueling lift Δ for each given gas station. The resulting estimates range between .12 and .35 (M = .22).
We can rewrite the preceding equation for the profit lift from each customer conversion as Π = (Qavg × (P − C) + Πstore)/(1 − Δ). Substituting the estimated values into the preceding equation, we obtain that a successful conversion could contribute $3.00–$7.59 to the bottom line of the observed gas stations. To incorporate our model into gas stations’ interactive marketing strategies, these values could simply be traded off against the cost of acquiring a customer (e.g., via search advertising or targeted mobile promotions).
Discussion
The rapid proliferation of mobile technologies has connected retailers with abundant information about consumers and their environment. At the same time, smartphones are also transforming the shopper journey faster than ever in history. As a result, retailers cannot rely solely on improving their traditional decision-making processes with enhanced data. They must also consistently embrace new techniques to capitalize on opportunities within the increasingly digitized path to purchase.
Retailers have responded to this trend by developing capabilities to collect and analyze data on consumers’ mobile activities, including their location choices (Athey et al. 2018; Ho, Dewan, and Ho 2020), and integrating it as part as their omnichannel and online-to-offline strategies (Bar-Gill and Reichman 2021; Kumar, Mehra, and Kumar 2019). However, traditional marketing methods, such as geofencing, have proven to be inadequate for capturing potential revenue as they are incapable of considering the diversity among consumers in particular locations (Zubcsek, Katona, and Sarvary 2017).
State-of-the-art approaches to tackle this inefficiency require location data collected at a high temporal resolution, making them best suited for indoor applications, such as sending mobile promotions to consumers inside a shopping mall (Ghose, Li, and Liu 2019). In contrast, mobility data collected in the urban setting tend to be sparser due to the greater variation in consumers’ environmental conditions as well as location data processors’ typical data retention decisions both reducing the granularity of such data. As a consequence, whether and how consumers’ dynamic urban mobility trajectories can be used to explain their heterogeneous preferences in store choice has remained an important open question facing academics and practitioners alike.
Addressing this question, in this article we introduced a new approach to dynamically segment customers using their past location choices observed in sparse urban mobility data. By conceptualizing consumer mobility patterns as trajectories, our work extends the approach pioneered by Ghose, Li, and Liu (2019). In particular, we provide a novel method to operationalize consumer mobility trajectories using low-granularity urban mobility data by pooling data on several days for each consumer. Applying our method, we estimated a conditional logit model to assess the price–distance trade-off in consumers’ fueling decisions using urban mobility data from Staten Island, New York.
Our results provide strong evidence that accounting for location trajectories significantly improves the accuracy of models relying only on historic store choices, brand information, and current price, both in and out of sample. Even after accounting for consumer heterogeneity—both via mapping devices to zip codes based on their overall mobility patterns, and by estimating a latent class specification of our main model—the effect of trajectory distance remained strongly significant, and we found that the distance consumers were willing to deviate from their anticipated trajectories for a $.01/gallon price advantage remained consistently between 4 and 44 meters. This result echoes Houde’s (2012) conclusion that consumers typically do not deviate far from their commuting route. However, our work is the first to show this pattern using individual choice data, and we do so after accounting for the strong station loyalty observed in the retail gasoline market. In addition—demonstrating the validity of our results—although we found a strong effect of station loyalty, including our trajectory distance variable nevertheless provided a 6.25% improvement to the out-of-sample classification accuracy of the conditional logit model predicting which gas station was chosen on those occasions when a consumer was observed to have fueled up.
Importantly, we expect that location data commonly available to retailers will get sparser over time, underscoring the need for methods that deal with such data. Recent academic work has demonstrated that high-frequency data collected in outdoor, urban mobility settings may pose significant risks to consumer privacy, such as exposing consumers’ home address or their visits to sensitive locations such as health care facilities or places of worship (Bengio et al. 2020; De Montjoye et al. 2013). Location data companies therefore increasingly discard sensitive location data to improve the computational performance of their B2B services while also curbing the risk to the tracked consumers (Goldfarb and Tucker 2020). For instance, shortly after getting sued by the Federal Trade Commission for the risks it posed to consumers by indiscriminately collecting and selling location data, Idaho-based location intelligence provider Kochava rolled out its “Privacy Block” feature, which blocks the sales of location data collected at sensitive locations such as health and wellness service centers and clinics, religious institutions, schools, financial credit institutions, federal buildings, correctional institutions, dependency and addiction treatment centers, homeless shelters, halfway houses, and more. 10 A key advantage of the methods introduced in our work is that they utilize sparse urban mobility data collected at retail locations within nonsensitive categories. Thus, our approach mitigates the privacy risks typically associated with the use of location data.
Contribution
This work contributes to multiple research streams in the marketing literature. First, we present a novel approach to quantify consumer heterogeneity in offline store choice using only mobility data and marketing information, with no transactional or survey data. Thus, our research sheds new light on the potential of leveraging consumer location data to inform interactive marketing strategies. We demonstrate that our methods can improve marketers’ understanding of the relationship between consumer location dynamics and retailer choice using only sparse data on consumers’ outdoor location patterns. Insights about this relationship can in turn enable marketers to develop personalized marketing campaigns, improving customer experience and ultimately increasing customer loyalty and retention. Importantly, our trajectory-based approach does not require continuous tracking of devices’ location and can therefore generate insights about consumption decisions without the need to rely on personally identifying and/or sensitive data about consumers.
Second, whereas prior work examining how distance affects store choice has relied on static mappings of consumer locations, we consider dynamic mobility patterns, generating a more realistic picture of consumer decision making. We thereby also contribute to the emerging body of work on location-aware marketing. Finally, our use of intraday mobility data adds an important layer to the gasoline demand literature, as it allows us to tease apart consumers’ sensitivity to deviating from their trajectory from their station loyalty.
Our work also offers several important practical implications. First, our methods will allow retailers in the gasoline industry to assess the value of new customers and weigh it against their acquisition cost through, for example, mobile search advertising or targeted promotions. In the “Predictive Analysis and Results” section, we laid out the blueprint for this approach. Using the distribution of consumer location choices in the test sample of our data, and accounting for the strong inertia of store choice that our model identified in the retail gasoline market, we assessed the value of a new customer to be in the range of $3.00–$7.59.
Second, our main methods linking consumer mobility trajectories to offline retailer choice may also be applicable to other industries where (promoted) prices are salient to consumers (e.g., clothing retail or fast casual dining). Overall, we anticipate that deriving customers’ typical trajectories may improve retailers’ interactive marketing capabilities: it will not only help retailers price their offerings appropriately, but also allow them to target the right prospects—that is, consumers whose anticipated trajectory indicates a low “transportation cost” corresponding to redeeming an offer—with either real-time or next-day offers.
Importantly, we note that location data providers may become important intermediaries to allow our methods to be carried out in a privacy-preserving way. Our analysis illustrates this perfectly: to predict consumers’ offline interactions with retailers, we did not need to continuously observe their mobile devices or even use their home location; in our models, we merely used the trajectory distance variable alongside information on past fueling events. This finding has important implications for interactive marketing, as it suggests that retailers can effectively engage with consumers even without invasive tracking.
Limitations and Directions for Future Work
Considering potential limitations of this work, we first note that our empirical analysis focused on the gasoline market as an example of online-to-offline commerce. It is possible that our findings and, especially, the heterogeneity of consumers’ preferences may be unique to this specific product category. It would therefore be important to study the generalizability of our findings to other markets.
Second, we acknowledge the limitations of our observational data. In particular, whereas we modeled the relationship between price and store choice, gasoline retailers should also be interested in how much fuel is purchased on the average visit given a specific price level. Additionally, our observation of fueling events may be biased toward highly station-loyal customers and those who frequently visited areas surrounding the observed retailers. Notwithstanding these limitations, our empirical package outlines a clear road map for using low-granularity urban mobility data to explain offline purchases. Retailers collecting data on consumer locations, as well as location data companies, should easily be able to perform the steps provided in this article to connect past consumer trajectories to future store visits.
Furthermore, we suggest future research to explore the integration of our models into interactive mobile marketing strategies. Following Cooke and Zubcsek (2017), mobile experiments may provide more accurate measurement and better control for differences in participants’ locations, purchase context, and response to marketing activities. Specifically, in the context we considered, insights from such experiments will also inform how gasoline retailers can incorporate consumer mobility data to design effective targeting strategies. We leave the exploration of these interesting avenues for future work.
Supplemental Material
sj-pdf-1-jnm-10.1177_10949968231179148 - Supplemental material for Analyzing Purchase Decisions Using Dynamic Location Data
Supplemental material, sj-pdf-1-jnm-10.1177_10949968231179148 for Analyzing Purchase Decisions Using Dynamic Location Data by Tal Shoshani, Peter Pal Zubcsek, and Shachar Reichman in Journal of Interactive Marketing
Footnotes
Acknowledgments
The authors wish to thank the Journal of Interactive Marketing review team for their feedback and an anonymous location intelligence media technology company for providing the urban mobility data used in this research. The authors would like to further thank Gabor Benedek, Danah Lapidot, Ignacio Riveros, Marton Szel, Yves Van Vaerenbergh, seminar participants at UC Berkeley and Tel Aviv University, and participants at the 2nd Digital Economy Workshop, SCECR 2020, Marketing Science 2021, IMRC 2021, and EMAC 2022 conferences.
Editor
Sonja Gensler
Associate Editor
Sertan Kabadayi
Declaration of Conflicting Interests
The author(s) declared no potential conflicts of interest with respect to the research, authorship, and/or publication of this article.
Funding
The author(s) disclosed receipt of the following financial support for the research, authorship, and/or publication of this article: This work was supported by the Israel Science Foundation, (grant number 2160/21). Peter Pal Zubcsek also acknowledges the generous support of the Henry Crown Institute of Business Research in Israel at Tel Aviv University.
Notes
References
Supplementary Material
Please find the following supplemental material available below.
For Open Access articles published under a Creative Commons License, all supplemental material carries the same license as the article it is associated with.
For non-Open Access articles published, all supplemental material carries a non-exclusive license, and permission requests for re-use of supplemental material or any part of supplemental material shall be sent directly to the copyright owner as specified in the copyright notice associated with the article.