
Abstract
Marketers and researchers recognize the importance and impact on consumer behavior of marketer-generated content (MGC) in social media channels. In this study, the authors present a method to classify MGC using a combination of unsupervised and supervised machine learning. They gather a large data set of posts from Facebook, Instagram, and Twitter and use a time-series model (panel-data vector autoregression) to demonstrate how MGC can be used to explain average toxicity on the part of users. They contribute to the field by examining what types of MGC lead to toxic comments and how these toxic comments impact product usage. The authors find that MGC that demonstrates the quality of products and MGC that is aimed at creating a sense of belonging to a group are more likely to increase average toxicity. Furthermore, the authors find that higher average toxicity in social media communities leads to an increase in usage of the focal product. Finally, the results contribute to the literature by providing insights on the impact of MGC on product usage.
Keywords
Researchers have investigated how marketer-generated content (MGC) impacts consumers. MGC is defined as any marketing communication (e.g., text, post, image) initiated by firms on their official social media websites (Colicev, Kumar, and O’Connor 2018; Goh, Heng, and Lin 2013; Kumar et al. 2016). In social media communities, MGC is a key instrument of communication with consumers (Humphreys and Wang 2018) because this content is a reflection of its producer and what it stands for (Berger et al. 2020). Although this is intuitively true, the challenge for marketers is to understand the impact of MGC on consumers.
Research investigating the impact of MGC has shown that informational content negatively affects sharing, whereas positive emotions positively impact sharing in risky contexts (Tellis et al. 2019). Also, interestingly, authors have found that the use of rhetorical figures and their impact on sharing of posts might depend on the platform and the message's intention (Ordenes et al. 2019). Kumar et al. (2016) find that posts created by firms have a positive, significant effect on customer spending, cross-buying, and customer profitability. To date, to measure the impact of posts created by firms, authors have considered the use of emoticons (Lee, Hosanagar, and Nair 2018), the role of post valence (Berger and Milkman 2012; Colicev, Kumar, and O’Connor 2019), the use of emotional tone (Lee, Hosanagar, and Nair 2018), and speech acts (Ordenes et al. 2019). Others have looked at whether the post was informative (Lee, Hosanagar, and Nair 2018; Meire et al. 2019; Petrova, Sen, and Yildirim 2021) or persuasive (Goh, Heng, and Lin 2013). These studies provide mounting evidence that MGC impacts consumer behavior (see Table 1).
Selected Studies Investigating the Effect of MGC.
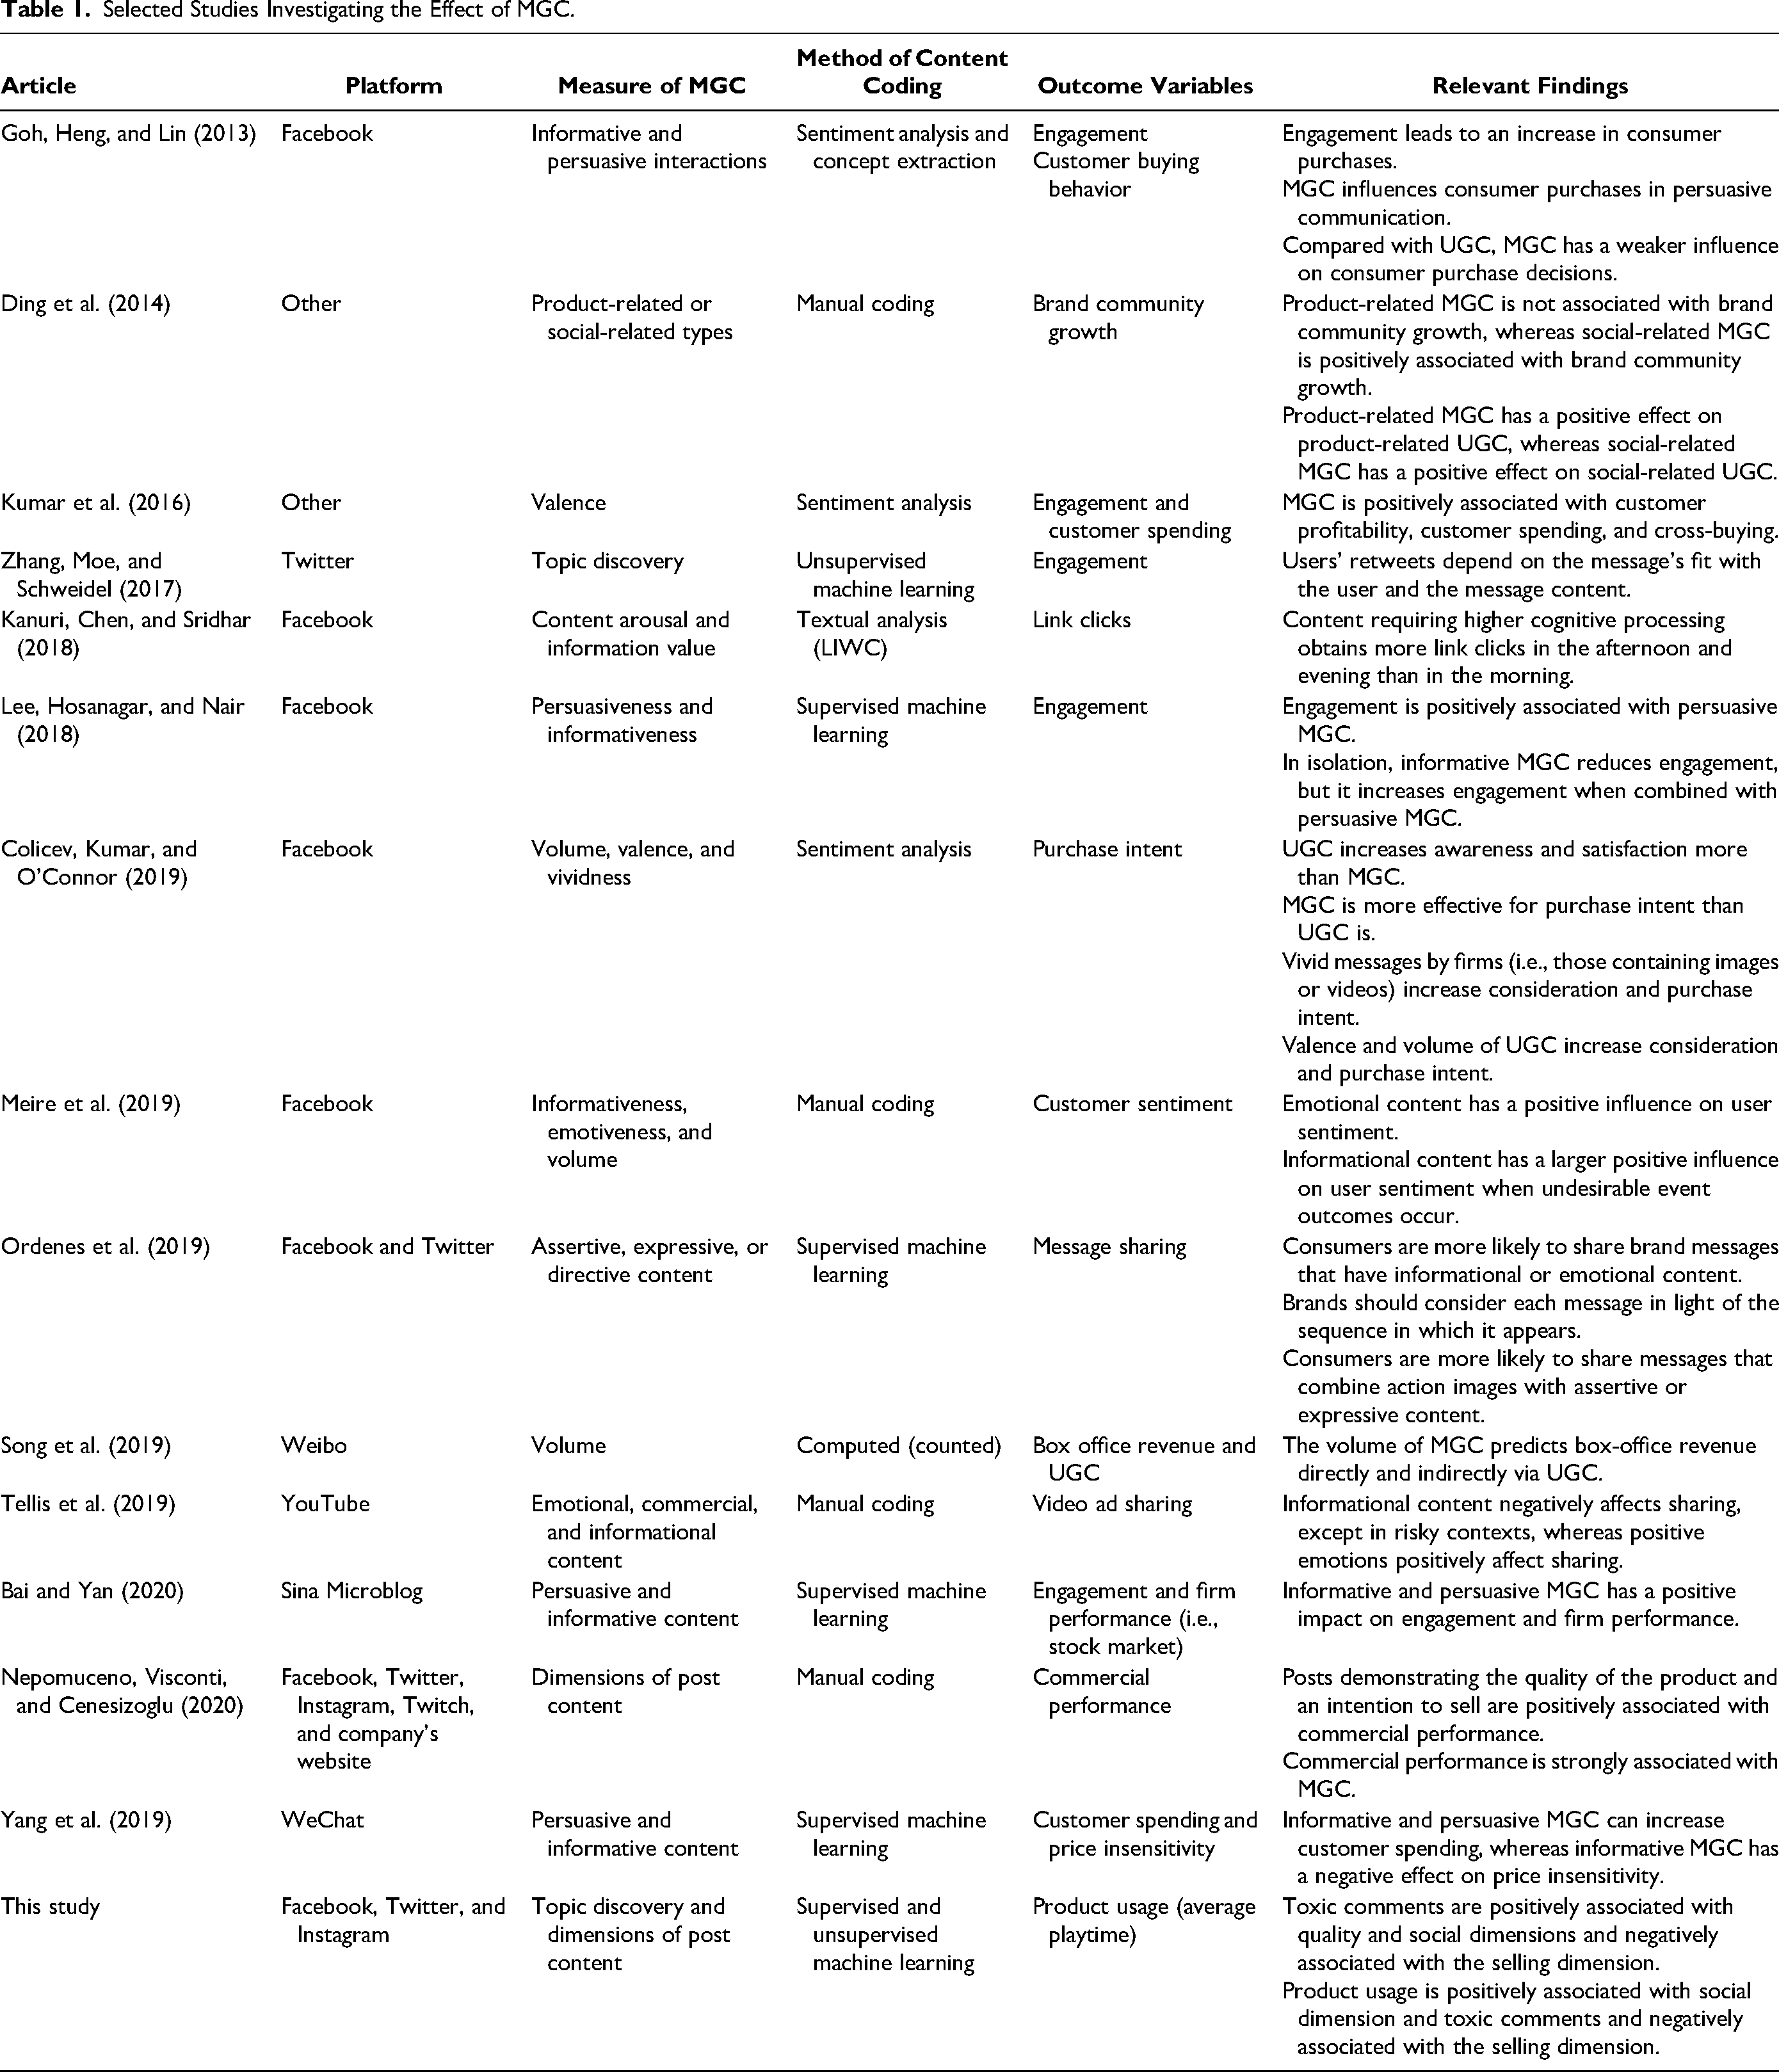
To date, just a scant number of studies have used a more exploratory approach to measure MGC (Nepomuceno, Visconti, and Cenesizoglu 2020; Zhang, Moe, and Schweidel 2017). These studies have used qualitative or quantitative methods to explore the impact of MGC. For example, using unsupervised machine learning and text data, authors have discovered topics in MGC, which were then used to predict retweets (Zhang, Moe, and Schweidel 2017). Other authors have used a phenomenon-driven approach and qualitative methods to uncover content dimensions of MGC and associate them with commercial performance (Nepomuceno, Visconti, and Cenesizoglu 2020). The advantage of such exploratory approaches is that they may uncover relationships overlooked by previous research.
In the current research, we adapt a phenomenon-driven approach to MGC to be applied with larger data sets by using machine learning techniques. We selected the content dimensions of MGC developed by Nepomuceno, Visconti, and Cenesizoglu (2020). These dimensions were developed after an exploratory content analysis using Thompson's (1997) hermeneutic procedure on a corpus of posts in the music and gaming industries. Because these content dimensions were tested in the gaming industry, they are highly appropriate to the context of our study (also conducted in the video game industry). Nonetheless, these content dimensions are not idiosyncratic to the gaming industry, as they are also used in the music industry. Four broad dimensions of post content were identified in that study: namely, the selling dimension, containing MGC that motivates sales (Ding et al. 2014); the social dimension, containing MGC intended to create and nurture relationships with users (McAlexander, Schouten, and Koenig 2002); the quality dimension, consisting of posts celebrating the superior properties of the product; and the structural dimension, composed of the features of the posts themselves, such as the number of words. This empirically grounded taxonomy of types of posts was adapted for our current research (see Web Appendix A). We first manually coded some posts, and then we trained a neural network to classify text into those predefined features, facilitating the use of the content dimensions with substantially larger data sets. By adapting this taxonomy of types of posts, we provide a methodological contribution to the field.
An important contribution of our research is to combine the taxonomy of content dimensions with a popular topic discovery method, latent Dirichlet allocation (LDA; Blei, Ng, and Jordan 2003) to uncover key underlying themes. LDA assumes that text contains latent topics, and that word occurrences can be used to identify such topics (Tirunillai and Tellis 2014). Since our data set is related to the gaming industry, most of the classified topics are relevant to gaming (e.g., watch streams on Twitch, or Xbox and PlayStation). Arguably, by combining this taxonomy with a topic discovery approach, our study considers MGC more comprehensively than prior research. That is, we consider content identified by both humans and a machine learning approach, tapping into the strengths of both methods, and we obtain some interesting insights through the inclusion of LDA.
A final contribution of the current research is to use MGC to explain toxic comments by users. A toxic comment is defined as an aggressive post that forces the offended participant to abandon the discussion (e.g., personal attacks, verbal bullying; Maslej-Krešňáková et al. 2020). Often, toxic comments are posted by internet trolls, who polarize internet communities by creating negative content and deliberately upsetting, provoking, and disrupting others (Binns 2012). Toxic comments have received limited attention in marketing, despite their implications for brands and social media communities. Marketers should care about average toxicity because it impacts consumers’ experiences around brands and services. Furthermore, toxicity can become an important source of negative word of mouth. We expect that certain content dimensions might be more associated with higher average toxicity by users. We argue that toxic comments should be more common after content that might generate a response from the audience. Interestingly, posts with a social dimension cultivate a sense of belonging to the group (see Web Appendix A). Given that toxic comments are often made by internet trolls (Binns 2012; Craker and March 2016) and internet trolls take pleasure in causing pain in others (Van Geel et al. 2017) and enjoy antisocial interactions (Foulkes et al. 2014), posts with the social dimension might lead to more toxic comments by internet trolls, as they seek to disrupt users’ sense of belonging. Likewise, we expect that posts with the quality dimension might be positively associated with average toxicity because internet trolls might see posts declaring the quality of the product as a great way to create discord and antisocial interactions.
In addition to exploring what content dimensions increase average toxicity, we explore the impact of average toxicity on consumer behavior. Our research uses quantitative time-series modeling (vector autoregression [VAR] model) to explore how MGC leads to more toxic comments by users, which in turn may influence product usage (i.e., average playtime). We explore two competing hypotheses. The first is that average toxicity reduces product usage because negative comments might motivate users to disengage from the community and game, ultimately leading to a reduction in playtime. This hypothesis is in line with the evidence that negative word of mouth has a negative impact on brands (East, Hammond, and Lomax 2008; Rosario et al. 2016). The second, competing hypothesis is that average toxicity motivates increased playtime among players in these communities. It is possible that rivalry and provocations between groups of consumers may be beneficial for companies (Ilhan, Kübler, and Pauwels 2018). Players who are members of an online community are very loyal to the game and would see a toxic comment as an attack on their identity. Such players would be more motivated to play as a way to defend their identity and recover self-esteem. High average toxicity may also be beneficial for companies, as research has shown that negative word of mouth can increase sales due to greater product awareness (Berger, Sorensen, and Rasmussen 2010). In sum, an additional contribution is to examine how MGC impacts average toxicity, and how trolling behavior impacts product usage. Figure 1 summarizes the model tested and the expected relationships between the constructs measured in the current research.
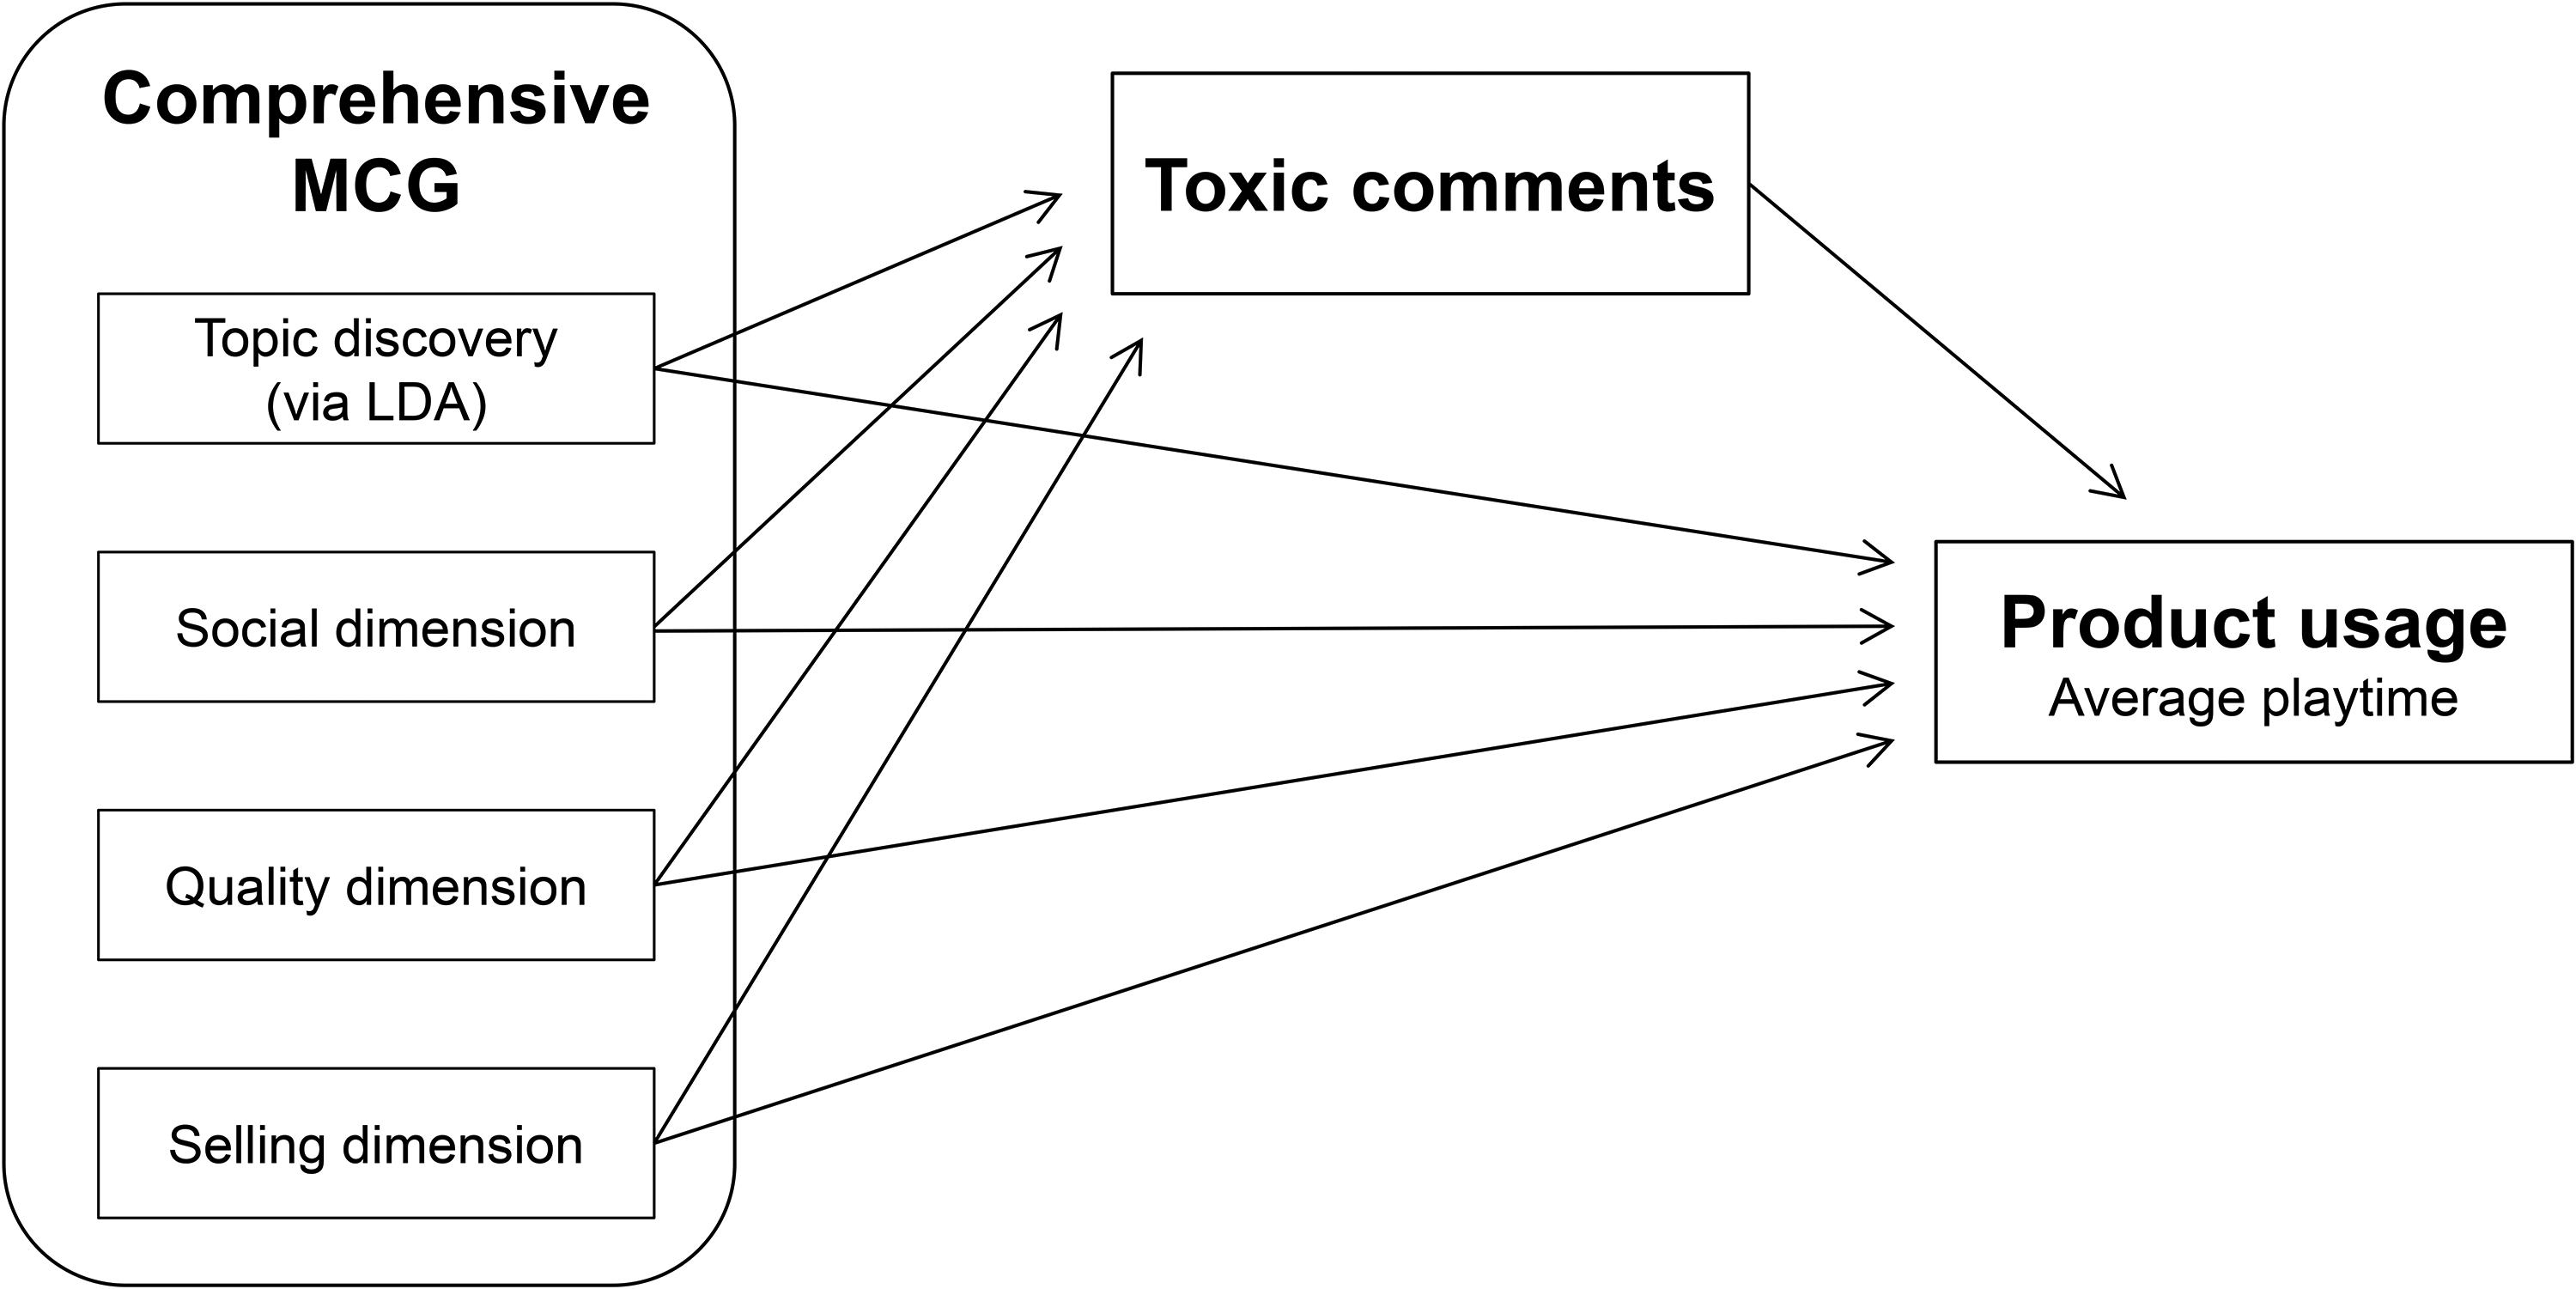
Relationships Between MGC, Comments’ Toxicity, and Product Usage.
Our contributions are pragmatically and economically relevant. Pragmatically, the comprehensive conceptualization of MGC used in this research can be useful for marketers, who can replicate the method proposed in this research to optimize engagement and product usage. Economically, our study focuses on the video game industry, which was estimated to be worth over $230 billion by 2022 in the United States alone (Merel 2018). Given that the video game industry has a very active internet presence and considering that consumers can purchase and use games while also being exposed to MGC, the impact of MGC should be measurable in this industry, making it an appropriate context for our research.
Our article is organized as follows. First, we review the relevant literature and present the method of data collection. Then, we introduce our measures, paying special attention to how we measure MGC by adapting the taxonomy of content dimensions to be used with machine learning techniques. In addition, in this section we demonstrate how we used LDA to complement the aforementioned taxonomies. In the following section, we use time-series modeling (VAR model) to demonstrate how our measure of MGC can be used to explain average toxicity and how average toxicity impacts product usage. We conclude the article with a general discussion of the findings, research limitations, and avenues of future research.
Related Literature
Marketer-Generated Content
MGC is any marketing communication initiated by companies on their official social media pages. There is mounting evidence that MGC impacts the behavior of social media users. In particular, research has shown that MGC influences consumer purchases through persuasive communication (Goh, Heng, and Lin 2013), whereas other authors have found that MGC has a positive, significant effect on customer spending, cross-buying and customer profitability (Kumar et al. 2016) as well as on demand for TV show viewings (Gong et al. 2017) and political donations (Petrova, Sen, and Yildirim 2021). Also demonstrating the impact of MGC, authors have found that messages from firms are more effective for consideration and purchase intent than messages by users, and that vivid messages by firms (i.e., those containing images or videos) increase consideration and purchase intent (Colicev, Kumar, and O’Connor 2019) and number of likes (De Vries, Gensler, and Leeflang 2012). Recently, research has indicated that video game sales have a strong positive association with MGC, in particular with posts demonstrating the quality of a game and with posts with an intention to sell (Nepomuceno, Visconti, and Cenesizoglu 2020). Overall, the literature suggests that MGC impacts consumer purchase and spending as well as sales.
Social media communities are often used to promote brands and products and to build and nurture relationships with fans (McAlexander, Schouten, and Koenig 2002). Thus, the MGC in such communities should have a strong impact on followers’ reactions. For example, MGC leads to higher engagement when it has persuasive content (Lee, Hosanagar, and Nair 2018), has emotional content (Meire et al. 2019), or is about events, fundraising, and donations (Sorensen, Andrews, and Drennan 2017). Furthermore, MGC that fits with users is more likely to be retweeted (Zhang, Moe, and Schweidel 2017). Posts that have better readability, are more controversial, or come from a high-status author are more likely to generate comments (Rooderkerk and Pauwels 2016). Overall, the literature strongly suggests an association between MGC and engagement.
In this research, we integrated two methods to measure MGC. That is, we combined taxonomies of MGC with machine learning techniques. First, we used LDA to uncover latent topics present in MGC. This technique uses unsupervised machine learning; thus, it examines the data to uncover topics by analyzing the association between words. It is valuable because it is capable of identifying topics that may be overlooked by humans, and it does not make assumptions about the structure of the text (Tirunillai and Tellis 2014), guaranteeing that our MGC measure is unique to the analyzed sample.
Second, we adapted the taxonomies of MGC developed by Nepomuceno, Visconti, and Cenesizoglu (2020). These authors used a phenomenon-driven approach and a qualitative method to identify content dimensions that were successfully used to predict sales. These taxonomies of MGC were developed for the music and gaming industries. In particular, we adopted three dimensions of content. The first is the selling dimension, which is assigned to posts that have the intention to sell a game or its services to followers. The second is the social dimension, which is assigned to posts that have the goal of creating a relationship with users by treating them as friends or by calling them to act in favor of the game. The third is the quality dimension, which occurs in posts that demonstrate the qualities of the game (e.g., gallery, game play, immersion). As in previous research, these dimensions are composed of subdimensions that are aggregated according to their content. Because some dimensions have more subdimensions than others, the subdimensions are averaged per content dimension, and this average score is used in the analyses. The subdimensions are simple units of analysis that were originally assimilated using open coding procedures (Mayan 2016) or adapted from prior research (Nepomuceno, Visconti, and Cenesizoglu 2020). The three aforementioned dimensions were formed via semantic analysis in which coders and the researchers attributed a theme to a post or a portion of it. Please see Web Appendix A for the codification used in the current research and further details regarding the definition of the three content dimensions and their subdimensions.
We believe that by combining the taxonomies of MGC with machine learning techniques, we provide a comprehensive measure of MGC, which is used in our research to investigate how MGC may explain the occurrence of toxic comments.
Toxic Comments and Trolling Behavior
Toxic comments in social media often aim at disrupting a community and creating discord. Often, toxic comments are created by internet trolls, who use personal insults and abusive language to disrupt and polarize (Binns 2012). Nonetheless, not all negative content is made by internet trolls. For example, someone posting a complaint about the performance of a product or service is not engaging in trolling behavior. What makes trolling distinctive is its toxic nature and its intention to disrupt the audience and its cohesion. Given that toxic comments are often created by internet trolls, in this section we review the literature on trolling behavior and its effect on audiences.
Research has examined the characteristics of the internet troll. Previous work in psychology has focused on what motivates trolling behavior. Researchers have found that trolling behavior is associated with narcissism, Machiavellianism, sadism, and psychopathology (Buckels, Trapnell, and Paulhus 2014; Lopes and Yu 2017; Sest and March 2017; Van Geel et al. 2017). Furthermore, internet trolls are motivated by enjoyment of antisocial interactions (e.g., cruelty; Foulkes et al. 2014) and by attention seeking (Binns 2012; Shachaf and Hara 2010). Other studies have focused on the effects of trolling behavior, finding that trolling behavior causes serious negative impacts, such as depression, anxiety, low self-esteem, and suicidal thoughts in victims (Craker and March 2016; Hinduja and Patchin 2010). In short, internet trolls take pleasure in laughing at others (Navarro-Carrilo, Torres-Marin, and Carretero-Dios 2021), and trolling behavior can have negative impacts on the audience and community. Since trolling behavior often takes the form of toxic comments on social media, understanding how companies can reduce toxic comments has the potential of improving the well-being of online community users.
The creation of toxic comments is a pervasive issue in social media communities. It occurs in part because of the anonymity offered by the internet (Binns 2012; Griffiths 2014). Interestingly, research has found that most people could engage in the creation of toxic comments under the right conditions (Cheng et al. 2017), further reinforcing its pervasiveness. Therefore, it is important to study not only what drives the creation of toxic comments, but also under what conditions it is likely to occur (Golf-Papez and Veer 2022). Considering this, we focus our research on identifying what characteristics of MGC might be associated with average toxicity.
It is reasonable to imagine that certain types of MGC may motivate toxic comments. From the three dimensions of content considered in this study (social, selling, and quality), we believe that posts with the social dimension are those that might increase average toxicity. Posts with such content aim at cultivating a sense of belonging to a group. Such posts would be particularly tempting for internet trolls, who enjoy antisocial interactions (Foulkes et al. 2014) and take pleasure in causing pain to others (Van Geel et al. 2017). In other words, as marketers attempt to create social connections between brands and their audience, internet trolls would see such initiatives as ideal moments to disrupt the community, incite antisocial behaviors, and obtain the negative attention they seek. Therefore, we predict:
Product Usage
We consider average playtime in our study as a measure of product usage. This accounts for how many minutes a game has been played on average on a given day, thus representing a behavioral measure of product usage. Although research has demonstrated that MGC is associated with sales, purchase intention, and other metrics of commercial performance (Colicev, Kumar, and O’Connor 2019; Goh, Heng, and Lin 2013; Kumar et al. 2016; Nepomuceno, Visconti, and Cenesizoglu 2020), little attention has been given to the impact of MGC on product usage. Previous research has shown that the social, selling, and quality dimensions are positively associated with sales of video games (Nepomuceno, Visconti, and Cenesizoglu 2020). Given this result, one would expect that these contents would also increase product usage because video game sales should be positively associated with average playtime. Therefore, we predict:
Although we can hypothesize the impact of content dimensions on average playtime, it is more difficult to foresee how average toxicity will impact average playtime. There is limited research investigating the impact of toxic comments on social media communities and consumers. We believe that toxic comments in social media settings ought to impact product usage. That is because such social media communities are populated by consumers who are highly engaged with the games, and toxic comments may impact how often consumers play games. Nonetheless, it is unclear how this impact might occur, and two competing hypotheses may be proposed. On the one hand, research suggests that toxic comments might reduce product usage. Prior research shows that negative content in social media communities (i.e., negative word of mouth) has a negative impact on brands (East, Hammond, and Lomax 2008; Rosario et al. 2016). Therefore, toxic comments would reduce product usage since they are closely related to negative word of mouth.
On the other hand, toxic comments might increase product usage, as gamers would react to them by defending the game and community. According to the social identity theory, individuals’ behavior within a community is influenced by their desire to maintain a positive social identity. Arguably, consumers in gaming communities are more committed to the game than the average person, and thus toxic attacks against the game might be seen as an attack on the gamers’ own identity. To maintain a positive social identity, these consumers may not only be motivated to respond to provocations (Sun and Shen 2021) but also be motivated to further play the game, as playing becomes a way to defend their own identity and recover self-esteem (i.e., playing becomes an ego-defense mechanism). This is in line with research showing that negative word of mouth can increase behavioral intentions of consumers with a high self–brand connection (Wilson, Giebelhausen, and Brady 2017). Also interestingly, research has found that negative word of mouth can increase sales as a result of greater product awareness (Berger, Sorensen, and Rasmussen 2010). Therefore, toxic comments may also have the effect of increasing product awareness in social media, which may ultimately lead to more consumers buying and playing the game.
In addition to testing the preceding hypotheses, the current study investigates whether these dimensions and the topics uncovered by LDA are associated with playing the game more frequently. This is particularly important in the gaming industry, as game developers should be keen to know how to best keep players engaged with a game.
Method
Data Collection
We used Selenium Python bindings to fetch data from websites. We collected all posts made for 134 computer games from March 31, 2016, to March 20, 2018, on Facebook, Twitter, and Instagram. From Facebook, Instagram, and Twitter, we obtained data on the posts made by the companies on the official page of each game. In addition, we obtained the comments made by users as a reaction to each post. For all three platforms we did not obtain data of posts made by users in a given social media community, but rather just the reactions (i.e., the aforementioned comments) to a given post initiated by the company. This resulted in 88,943 posts made by the game companies (50,580 on Facebook, 28,574 on Twitter, and 9,788 on Instagram) and 10,991,253 comments made by users (9,286,691 on Facebook, 1,044,875 on Twitter, and 659,687 on Instagram). We could not obtain product usage data for all these posts because some posts were made before the games were launched. By removing these cases, the final number of posts was 54,953 (32,351 on Facebook, 17,689 on Twitter, and 4,913 on Instagram) and 5,440,977 comments made by users (4,525,320 on Facebook, 637,085 on Twitter, and 278,572 on Instagram).
Given that thousands of game titles are launched yearly in the computer gaming market (e.g., in 2019 alone, 8,234 titles were launched; PC GameBenchmark 2020), we selected a sample of games that represented diverse market shares. This enabled us to develop a framework that is more generalizable to the industry. With this goal in mind, we used the Metacritic website (metacritic.com) to identify games that were successfully acclaimed by players and experts. This website provides tools like “most discussed computer games” and “current computer games by Userscore and Metascore,” which were used to create a list of 500 games. By using these tools, we identified numerous popular niche games and avoided having a list composed largely of games launched by dominant game developers. We randomly selected 134 games from this list (see table in Web Appendix B). Afterward, we identified the number of Facebook followers each of these games had at the time of data collection. We then separated these games into three groups of comparable size. The first consisted of games that had fewer than 30,000 followers on Facebook at the time of the data collection (n = 45). Games in the second group had between 30,000 and 400,000 followers on Facebook (n = 48), and those in the third had more than 400,000 followers on Facebook (n = 41). Facebook was used as a benchmark because it is the prioritized platform in our sample. Although we fetched data from three platforms, Facebook accounts for 58.9% of all posts made in the period, Twitter for 32.2%, and Instagram for 8.9%.
MGC Dimensions
Using a grounded method to develop and validate measurements (Balducci and Marinova 2018; Humphrey and Wang 2018), we randomly selected a separate sample of 5,086 posts of gaming companies to identify the content dimensions. Three formerly trained coders analyzed the content of these posts individually and manually using the subdimensions described in Web Appendix 1. These subdimensions were grouped into the three dimensions of post content previously described (see Web Appendix A for the definitions and grouping of the subdimensions). In short, the subdimensions measure different ways in which post creators expressed the quality of the game, attempted to create a social connection with the users, or tried to motivate further sales.
We replicated Nepomuceno, Visconti, and Cenesizoglu's (2020) work to assess the validity of the content dimensions. First, we used vertical analysis to articulate (i.e., “dimensionalize”; Spiggle 1994) these dimensions. In particular, with the help of experts in the gaming industry, we were able to contextualize the subdimensions to the specific industry settings. In this process we removed subdimensions that appeared in the original study but were not present in the current data, and we identified subdimensions that were not present in the original study. For example, the subdimension Ship Upgrades was unique to the original study, whereas we identified the subdimension Small Talk in the current study with a large sample of games. This adaptation was necessary because the original study by Nepomuceno, Visconti, and Cenesizoglu (2020) analyzed only one game, whereas the current study considers a considerably larger number of games from different game genres. The adaptation was made by coders, gaming experts, and researchers who read a random subsample of 100 posts and identified contents by extracting meaning from the posts or portions of them. This step occurred before the coders were trained in using the coding scheme (presented in Web Appendix A). Such adaptation is in line with hermeneutic research that provides evidence of a need for adaptation as well as context-dependent, polyphonic interpretations (Sherry 1990). Although some changes occurred in the subdimensions, no changes were needed at the dimension level (i.e., the social, quality, and selling dimensions remained).
The coders indicated the presence or absence of each subdimension, allowing more than one per post because text can be polysemous. The coders were trained in stages. First, they were presented with a dozen posts with the explanation of the existing subdimensions in each post. This was done in a group, with the supervision of one of the coauthors. Afterward, the coders had to individually analyze a random sample of 100 posts. Later, they met in a group with one of the coauthors to discuss disagreements and improve the understanding of the subdimensions. This process was repeated with increments of ten posts, until coder agreement became high and no further issues appeared during the discussions. Finally, the coders were given the sample of 5,086 posts to content analyze. The analyses reached high interrater reliability (Cohen's k = .8792; PRL = .99 for all dimensions; Rust and Cooil 1994). Given that the number of words used in a post (i.e., word count) is a nondichotomous variable, its score was simply calculated and not included in the calculation of interrater reliability.
The coders’ content analysis was used as training data for a supervised learning algorithm in a machine learning context. The output of this process was used in the model to automatically identify MGC dimensions from each of the 54,953 posts considered. This process enabled us to automate the content analysis of posts made by gaming companies. We used the content dimensions identified by Nepomuceno, Visconti, and Cenesizoglu (2020): namely, social dimension, quality dimension, and selling dimension.
For the content classification task, we used a bag-of-words model to represent the text by integers using the Gensim library (Rehurek and Sojka 2010) in Python. We then trained a neural network in the form of a multilayer perceptron composed of two hidden layers, each one with 128 neurons. The first layer of the network is a word embedding layer. Using the manually coded content as the training set, the network is trained to classify the corpus into the 21 predefined subdimensions, which fall into three dimensions (i.e., social dimension, quality dimension, and selling dimension). These dimensions are formed by adding the presence (presence = 1; absence = 0) of each subdimension composing each dimension (see Web Appendix 1). Using a neural network for multilabel content classification tasks is recommended in the literature. We obtained an acceptable accuracy of 86% (area under the curve = .73, precision = .74, recall = .71) on the test set (20% of the data) and 98% accuracy for the training set. Please refer to Web Appendix C for a breakdown of accuracy per content subdimension.
The preceding steps enabled us to accurately automate the content analysis of posts using taxonomies of MGC. Thus, we adapted the framework to be used with larger data sets in a timely manner. This step was a fundamental building block for this research.
MGC Topic Discovery via LDA
An important goal of the current research is to complement the taxonomy of content dimensions with an established topic discovery approach (i.e., LDA). Despite numerous advances in the field, MGC has been measured in diverse ways in the field, and a more comprehensive measure of MGC would be beneficial. Therefore, we combined the two methods to explain average toxicity and product usage. LDA enables topics to be extracted from the data, and it has the advantage of identifying topics overlooked by humans (Tirunillai and Tellis 2014), guaranteeing that we can measure MGC as comprehensively as possible. What follows describes how we used LDA to extract topics from MGC.
LDA is one of the most commonly used topic discovery models, and it uses an unsupervised machine learning model (Blei, Ng, and Jordan 2003; Puranam, Narayan, and Kadiyali 2017). Studies in marketing have used LDA and its extensions for different purposes. For example, Tirunillai and Tellis (2014) used LDA to extract dimensions of quality and valence expressed in user-generated content (UGC). LDA has also been used to detect temporal changes in topics of UGC around different events (Zhong and Schweidel 2020), to link search query topics to web page topics and explain click-through rates (Liu and Toubia 2018), and to predict consumer rating (Büschken and Allenby 2016). In this study, we used LDA with text encoded as a bag of words to capture the general themes in the MGC text.
To determine the number of topics, we varied the number of topics between 5 and 100. As recommended by Berger et al. (2020), we used a perplexity measure, and we found that the best number of topics for our corpora was 20. Interestingly, this unsupervised method helped us extract latent topics that were not accounted for in our 21 predefined topics to be used in supervised classification. For example, one topic extracted posts regarding live streaming on Twitch including words like “twitch,” “stream,” “join,” and “tune.” While some of the topics were easily understandable, others were too abstract for us to label them. However, we decided to keep all 20 topics for the upcoming forecasting tasks, as our method did not require high levels of feature engineering. Please refer to Web Appendix D for the preprocessing of the data.
Product Usage Measure
To measure product usage, we subscribed to Steam Spy (steamspy.com). Steam Spy is a third-party project that continuously monitors the Steam platform. Steam is the largest digital distribution platform for video games in the computer market, with an estimated 75% of the computer market in the United States (Zuckerman 2020). Steam had around 67 million registered users worldwide in 2017 and 90 million users in 2018 (Statista 2021). Steam is available for Windows, macOS, iOS, Android, and Linux. Until April 2018, the user profile of every Steam user was publicly available. Thus, one could easily access the games installed and the playtime of each user (i.e., player) in the platform. At that time, Steam Spy randomly sampled 80,000 to 90,000 valid user pages every day. With this daily sampling, Steam Spy estimated the percentage of Steam users who owned and played any game on the platform. Additionally, this sampling enabled Steam Spy to estimate how many minutes a given game was played in its lifetime. Average playtime is based on how many minutes a given game is played until a given date. By calculating the daily average difference, Steam Spy was able to estimate how many minutes on average the game was played in a given day. In our study, product usage was measured by obtaining the daily average change in playtime from March 31, 2016, to March 20, 2018, for all games that had at least one sequence of seven consecutive days. For both MGC measures described previously (LDA and content dimensions), the data were aggregated daily. For days on which there was more than one post, the data were averaged per day. The number of posts per day per platform was included as a control variable.
Toxic Comments
To measure toxic comments, we used Perspective API, an antitrolling software that uses machine learning to spot abuse and harassment online (Noever 2018). Perspective API was trained on millions of comments from online forums such as Wikipedia and the New York Times (Rieder and Skop 2021). For each comment, three to ten raters annotated it following the instructions in Web Appendix E. Afterward, the developers calculated the ratio of raters who tagged each comment according to each attribute. If, for example, 50% of raters tagged a comment as toxic, it would receive a .5 toxicity rate (please refer to https://developers.perspectiveapi.com for further details). For examples of toxic posts identified in the current research, please see Web Appendix F. Previous research has indicated that Perspective API outperforms VADER for detecting toxic comments and achieved a precision of 90% and a recall of 61% (F1 = .73) when the toxicity rate was set as .7 as a threshold (Hua, Ristenpart, and Naaman 2020). In our study, this application programming interface was applied to the 10,991,253 comments made by users and then averaged by post. Thus, each post made by a company had an associated average toxicity (i.e., based on toxicity element) that reflected the text posted in the comment section. For days with multiple posts, we then averaged toxic comments variable over all posts for a given game/day pair. We also computed for a given post the percentage of comments with a toxicity higher than .7. We then averaged this percentage over all posts for days with multiple posts to obtain an alternative measure of toxic comments. The results based on this definition of toxic comments were similar to our main set of results and are presented in Web Appendix G. We found that when toxicity is higher than .7, higher average toxicity leads to greater average playtime for at least ten days, with a maximum positive impact on the second day.
Tables 2 and 3 present the descriptive statistics and correlations between the key variables of this research. Specifically, the columns titled “LLC” and “ADF” in Table 2 present, respectively, the Levin–Lin–Chu (Levin, Lin, and Chu 2002) and augmented Dickey–Fuller (Dickey and Fuller 1979) panel unit root tests. The LLC test statistic assumes that there is a common unit root process across cross sections (i.e., games). The LLC is a modified t-statistic that has an asymptotic normal distribution. The ADF test, in contrast, allows the processes to vary freely across cross sections and combines individual unit root tests to derive a panel-specific result. The ADF test statistic presented has an asymptotic chi-square distribution. We used the Bartlett kernel with a bandwidth selected by using Newey–West and Schwarz information criteria to choose the number of lags. The null hypothesis for both tests is that there is a unit root in the panel data set. Regardless of the test considered, we reject the null hypothesis of a unit root for all endogenous variables in our panel VAR system. This in turn suggests that there is no need to consider a panel cointegration structure, and a simple panel VAR model suffices to capture the dynamic relations between the variables. Finally, the correlation between the content dimensions and LDA topics is below .20 for all possible correlations (see Table 3), suggesting that the contents captured are different.
Descriptive Statistics.
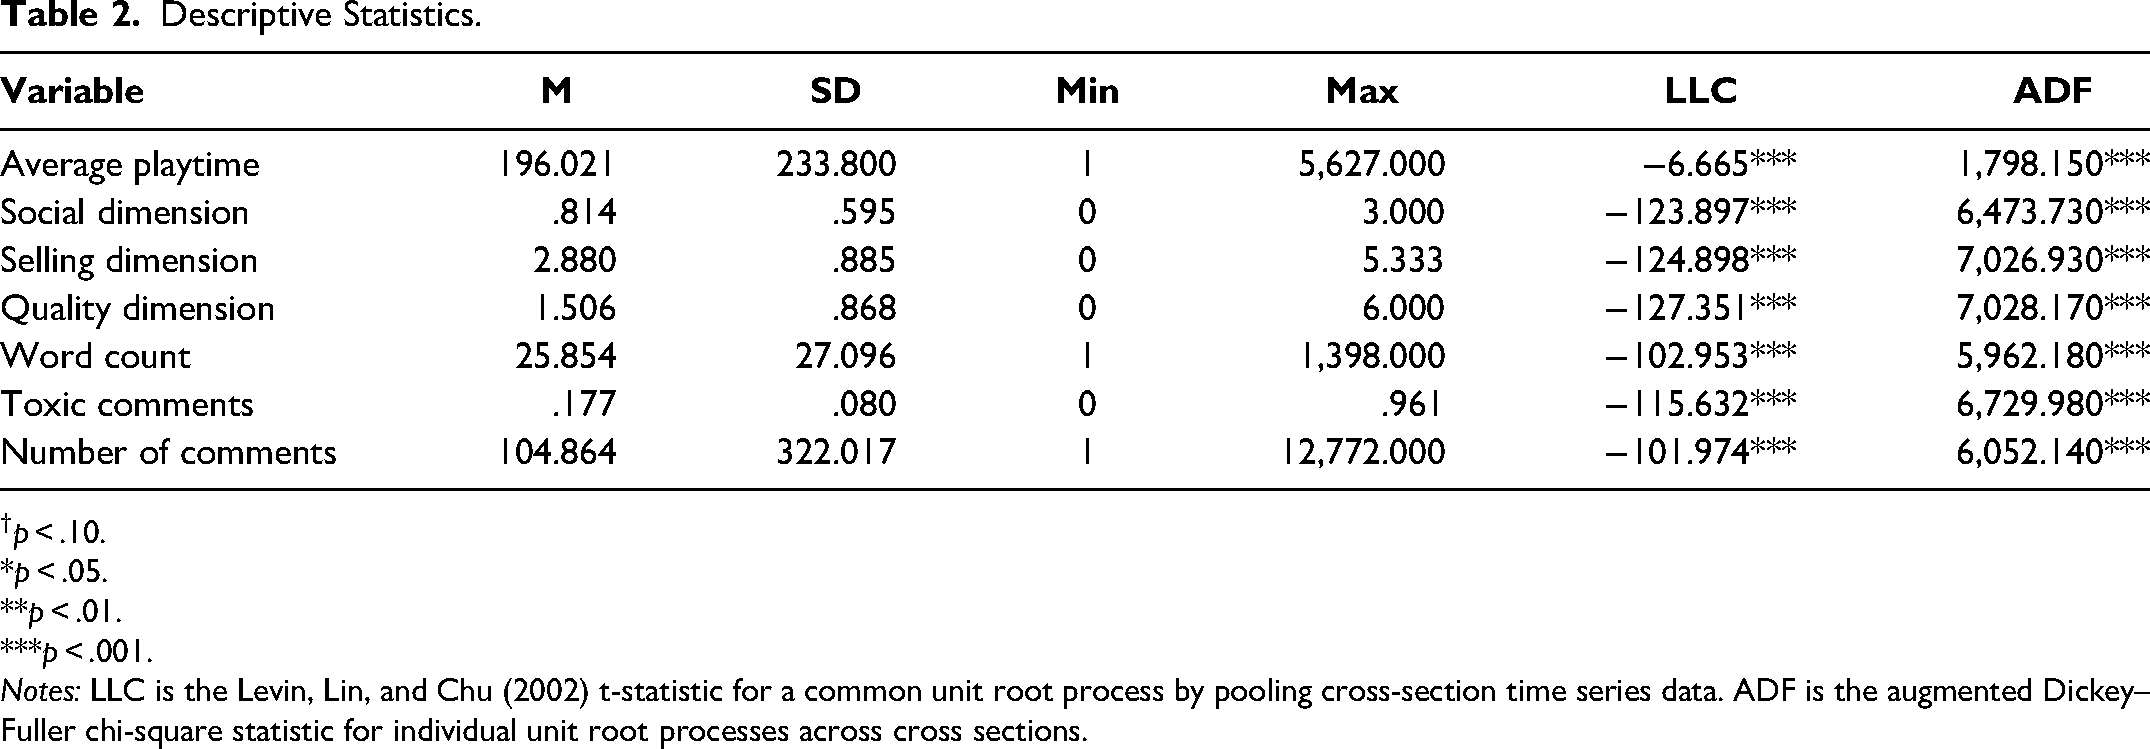
p < .10. *p < .05. **p < .01. ***p < .001.
Notes: LLC is the Levin, Lin, and Chu (2002) t-statistic for a common unit root process by pooling cross-section time series data. ADF is the augmented Dickey–Fuller chi-square statistic for individual unit root processes across cross sections.
Bivariate Correlation Coefficients (N = 21,252).
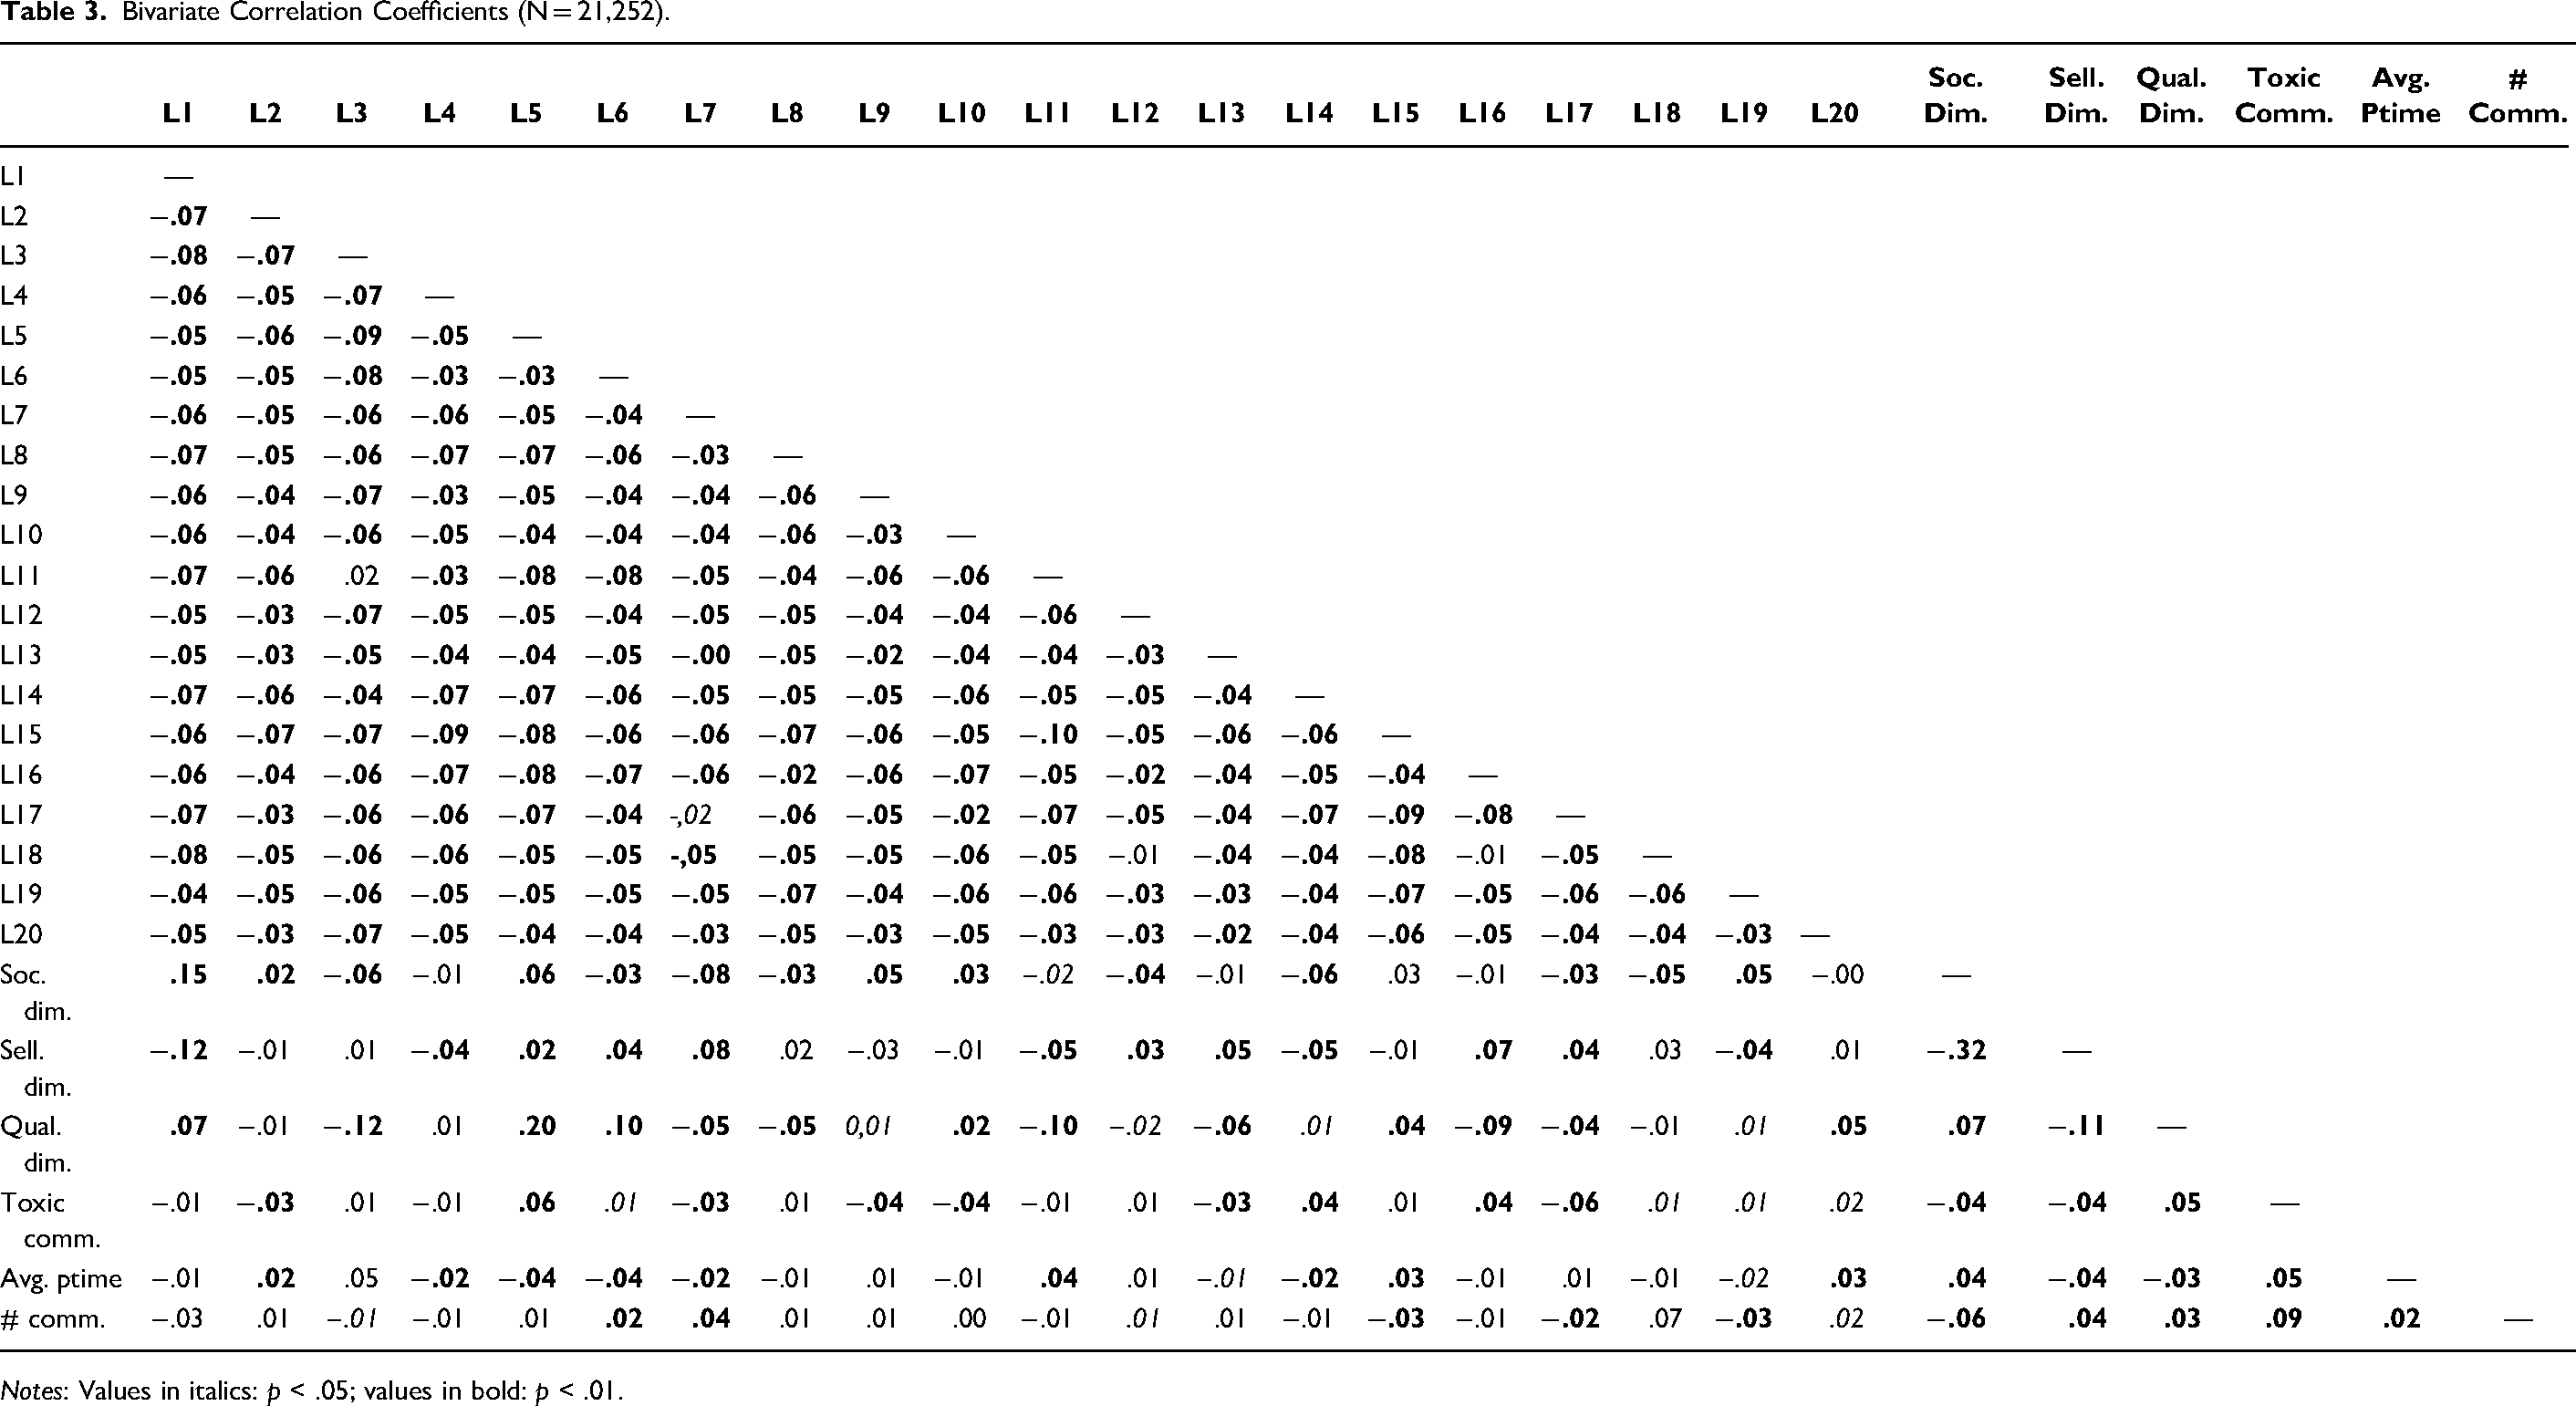
Notes: Values in italics: p < .05; values in bold: p < .01.
Toxic comments cannot be identified before they are made in response to a post. Therefore, measuring toxic comments in this context can be done only after a post has been made. By analyzing the content of the posts with Perspective API, we identified toxic comments after they occurred. Importantly, posts that might have been excluded by community moderators are not taken into account in this study, for we could not obtain them. Nonetheless, given that toxic comments lead others to behave similarly, increasing the toxicity in a community (Cheng et al. 2017), we believe that our method still captures the presence of toxic comments following a given MGC because the aggressive responses following the toxic posts are often not removed and are captured by the average toxicity of the comments that follow the original toxic post.
VAR Model Specification
We employed a panel-data VAR model of order one with homogeneous response parameters across games. This empirical specific action assumes homogeneous effects of one variable on another variable between games. Specifically, our VAR system can be expressed as follows: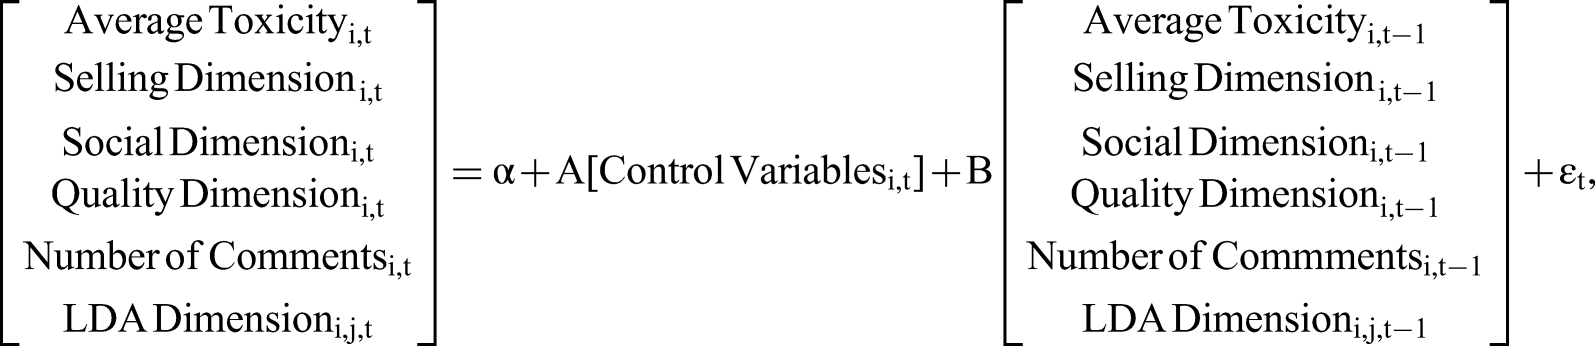
We first estimated this VAR including all but one LDA topic because of the perfect multicollinearity issue, since the LDA topics sum to one by definition. We chose to exclude the 20th topic from our initial analysis. Having estimated this VAR model, we then analyzed the impulse response functions (IRFs) of average toxicity for 19 LDA topics. We identified significant LDA topics according to whether the generalized IRFs of average toxicity (as measured by Perspective API) to a given LDA topic were statistically different from zero after any number of periods following the initial shock. We then reestimated the model using the significant LDA topics identified by our initial analysis along with the 20th topic that was excluded from our initial analysis. We again identified in a similar fashion the significant LDA topics based on the generalized IRFs of average toxicity to LDA topics from this second estimation. We used this two-step selection approach to reduce the total number of parameters to be estimated. This approach resulted in the final model for average toxicity with 11 LDA topics (L01, L05, L07, L08, L09, L10, L11, L15, L16, L17, L19) and 544 parameters to be estimated. We used the generalized IRFs from this final estimation to measure the dynamic relationship between MGC and average toxicity.
We used the VAR to analyze the dynamic effect of one variable on another variable. The VAR enables us to treat all variables as endogenous, with the exception of the control variables. However, that does not completely address the problem of endogeneity since “treating variables as endogenous variables” is not the same as “correcting for endogeneity,” as noted by Papies, Ebbes, and Van Heerde (2017, p. 585). To alleviate the problem of endogeneity, we focus on IRFs rather than coefficient estimates. This allows us to analyze the dynamic response of one variable to a shock of one standard deviation for another variable in the system without having to worry about possible endogenous contemporaneous relations between these two variables. In addition, we consider the generalized IRFs (Pesaran and Shin 1998) instead of the standard “orthogonalized” IRFs. The generalized IRFs are computed using an orthogonal set of innovations that do not depend on variable order in the VAR system, unlike the “orthogonalized” IRFs. This adds another layer of robustness to our results.
To analyze the dynamic relationship between MGC, average toxicity, and product usage, we then included product usage as another endogenous variable in the previously described VAR system and followed the same steps listed previously to identify the final model for product usage, which includes four LDA topics (L11, L13, L15, L17) and has 250 parameters. We used this final model to obtain the generalized IRFs of product usage to a shock in MGC or average toxicity.
Finally, we also considered choosing the optimal number of lags using Akaike information criteria (AIC) and Schwarz Bayesian information criteria (SBIC). We estimated the models identified previously with up to and including ten lags for both average playtime and average toxicity. We found that the AIC and SBIC for average playtime decrease monotonically as we increase the number of lags, suggesting that the optimal number of lags is not necessarily one. Similarly, the AIC for average toxicity also decreases monotonically with the number of lags, while the SBIC for average toxicity suggests four as the optimal number of lags. We adopted a model with four lags for both variables, and our results were quantitatively and qualitatively similar to those presented. We opted for a model with a one lag to limit the number of parameters to estimate. Specifically, the models for average playtime and average toxicity already had 250 and 544 parameters to estimate, respectively, making them relatively large models to estimate. Any higher number of lags would make them even bigger and might make the estimation results less reliable. Finally, we also included the averages of each endogenous variable across games for a given day as a control variable in the panel VAR. This average for a given endogenous variable is the same for each game on any given day. We included these average variables to control for the potential cross-game effect of a given endogenous variable for all games on all endogenous variables for a specific game. Our results based on the model including these averages as control variables are quantitatively and qualitatively similar to our benchmark results. Once again, we present results based on our parsimonious model with fewer parameters than a larger model with many parameters. Please refer to Web Appendix H for details on model fit, additional analyses, and robustness checks.
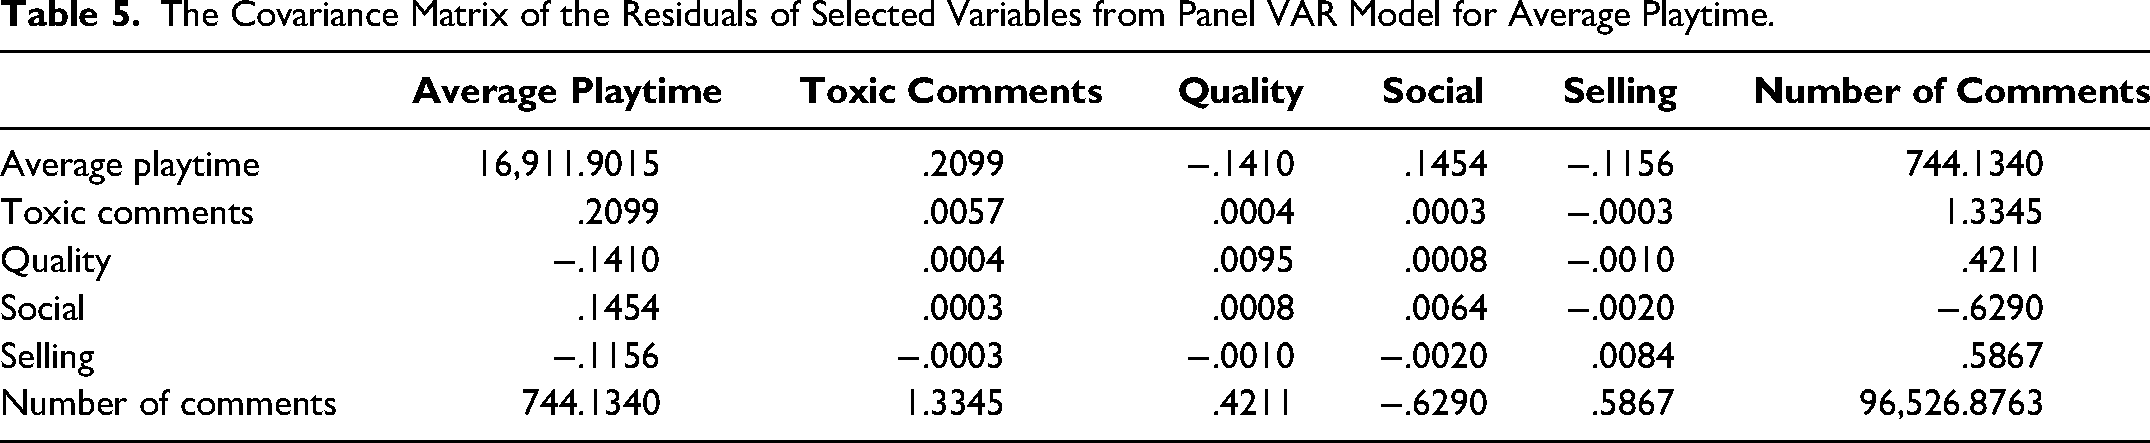
Tables 4 and 5 present the covariance matrices of the residuals of selected endogenous variables in the panel VARs for average toxicity and product usage, respectively. These covariance matrices provide information on the correlation between the residuals of the endogenous variables and, more importantly, are used to compute the IRFs on which we base our conclusions. We provide further details on model fit, additional analyses and robustness checks in Web Appendices H, I, J, and K.
The Covariance Matrix of the Residuals of Selected Variables from Panel VAR Model for Toxic Comments.
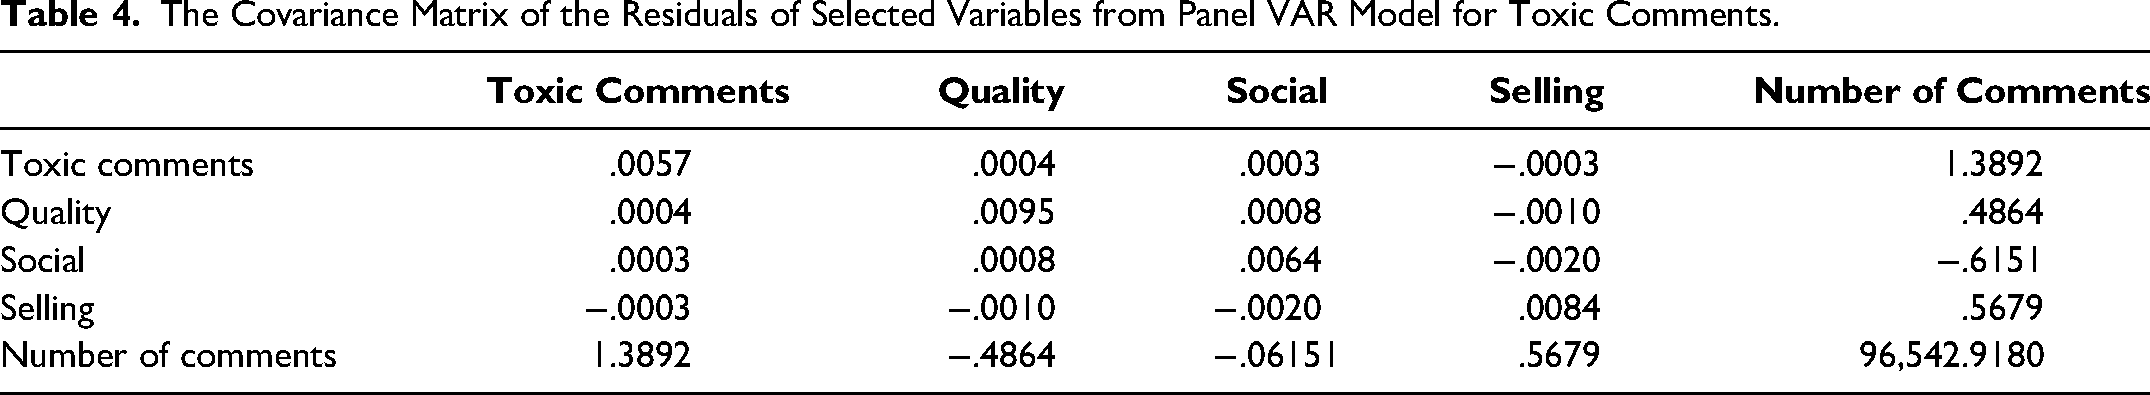
The Covariance Matrix of the Residuals of Selected Variables from Panel VAR Model for Average Playtime.
The Impact of MGC on Average Toxicity
In the figures, the two standard deviation confidence bands are represented by the dashed lines, whereas the solid lines represent the IRFs. Note that an IRF should be interpreted as the dynamic response of the response variable (in this case Perspective API) after a certain number of periods following a positive shock of one standard deviation in another variable (i.e., an impulse variable) in period zero. IRFs capture not only the direct effect of an impulse variable on the response variable but also its indirect effect through its effect on other variables in the system. When the confidence bands for a given period following the initial shock do not include zero, the impulse variable is considered to have a statistically significant impact on the response variable in that period. See Figure 2 for the key results.
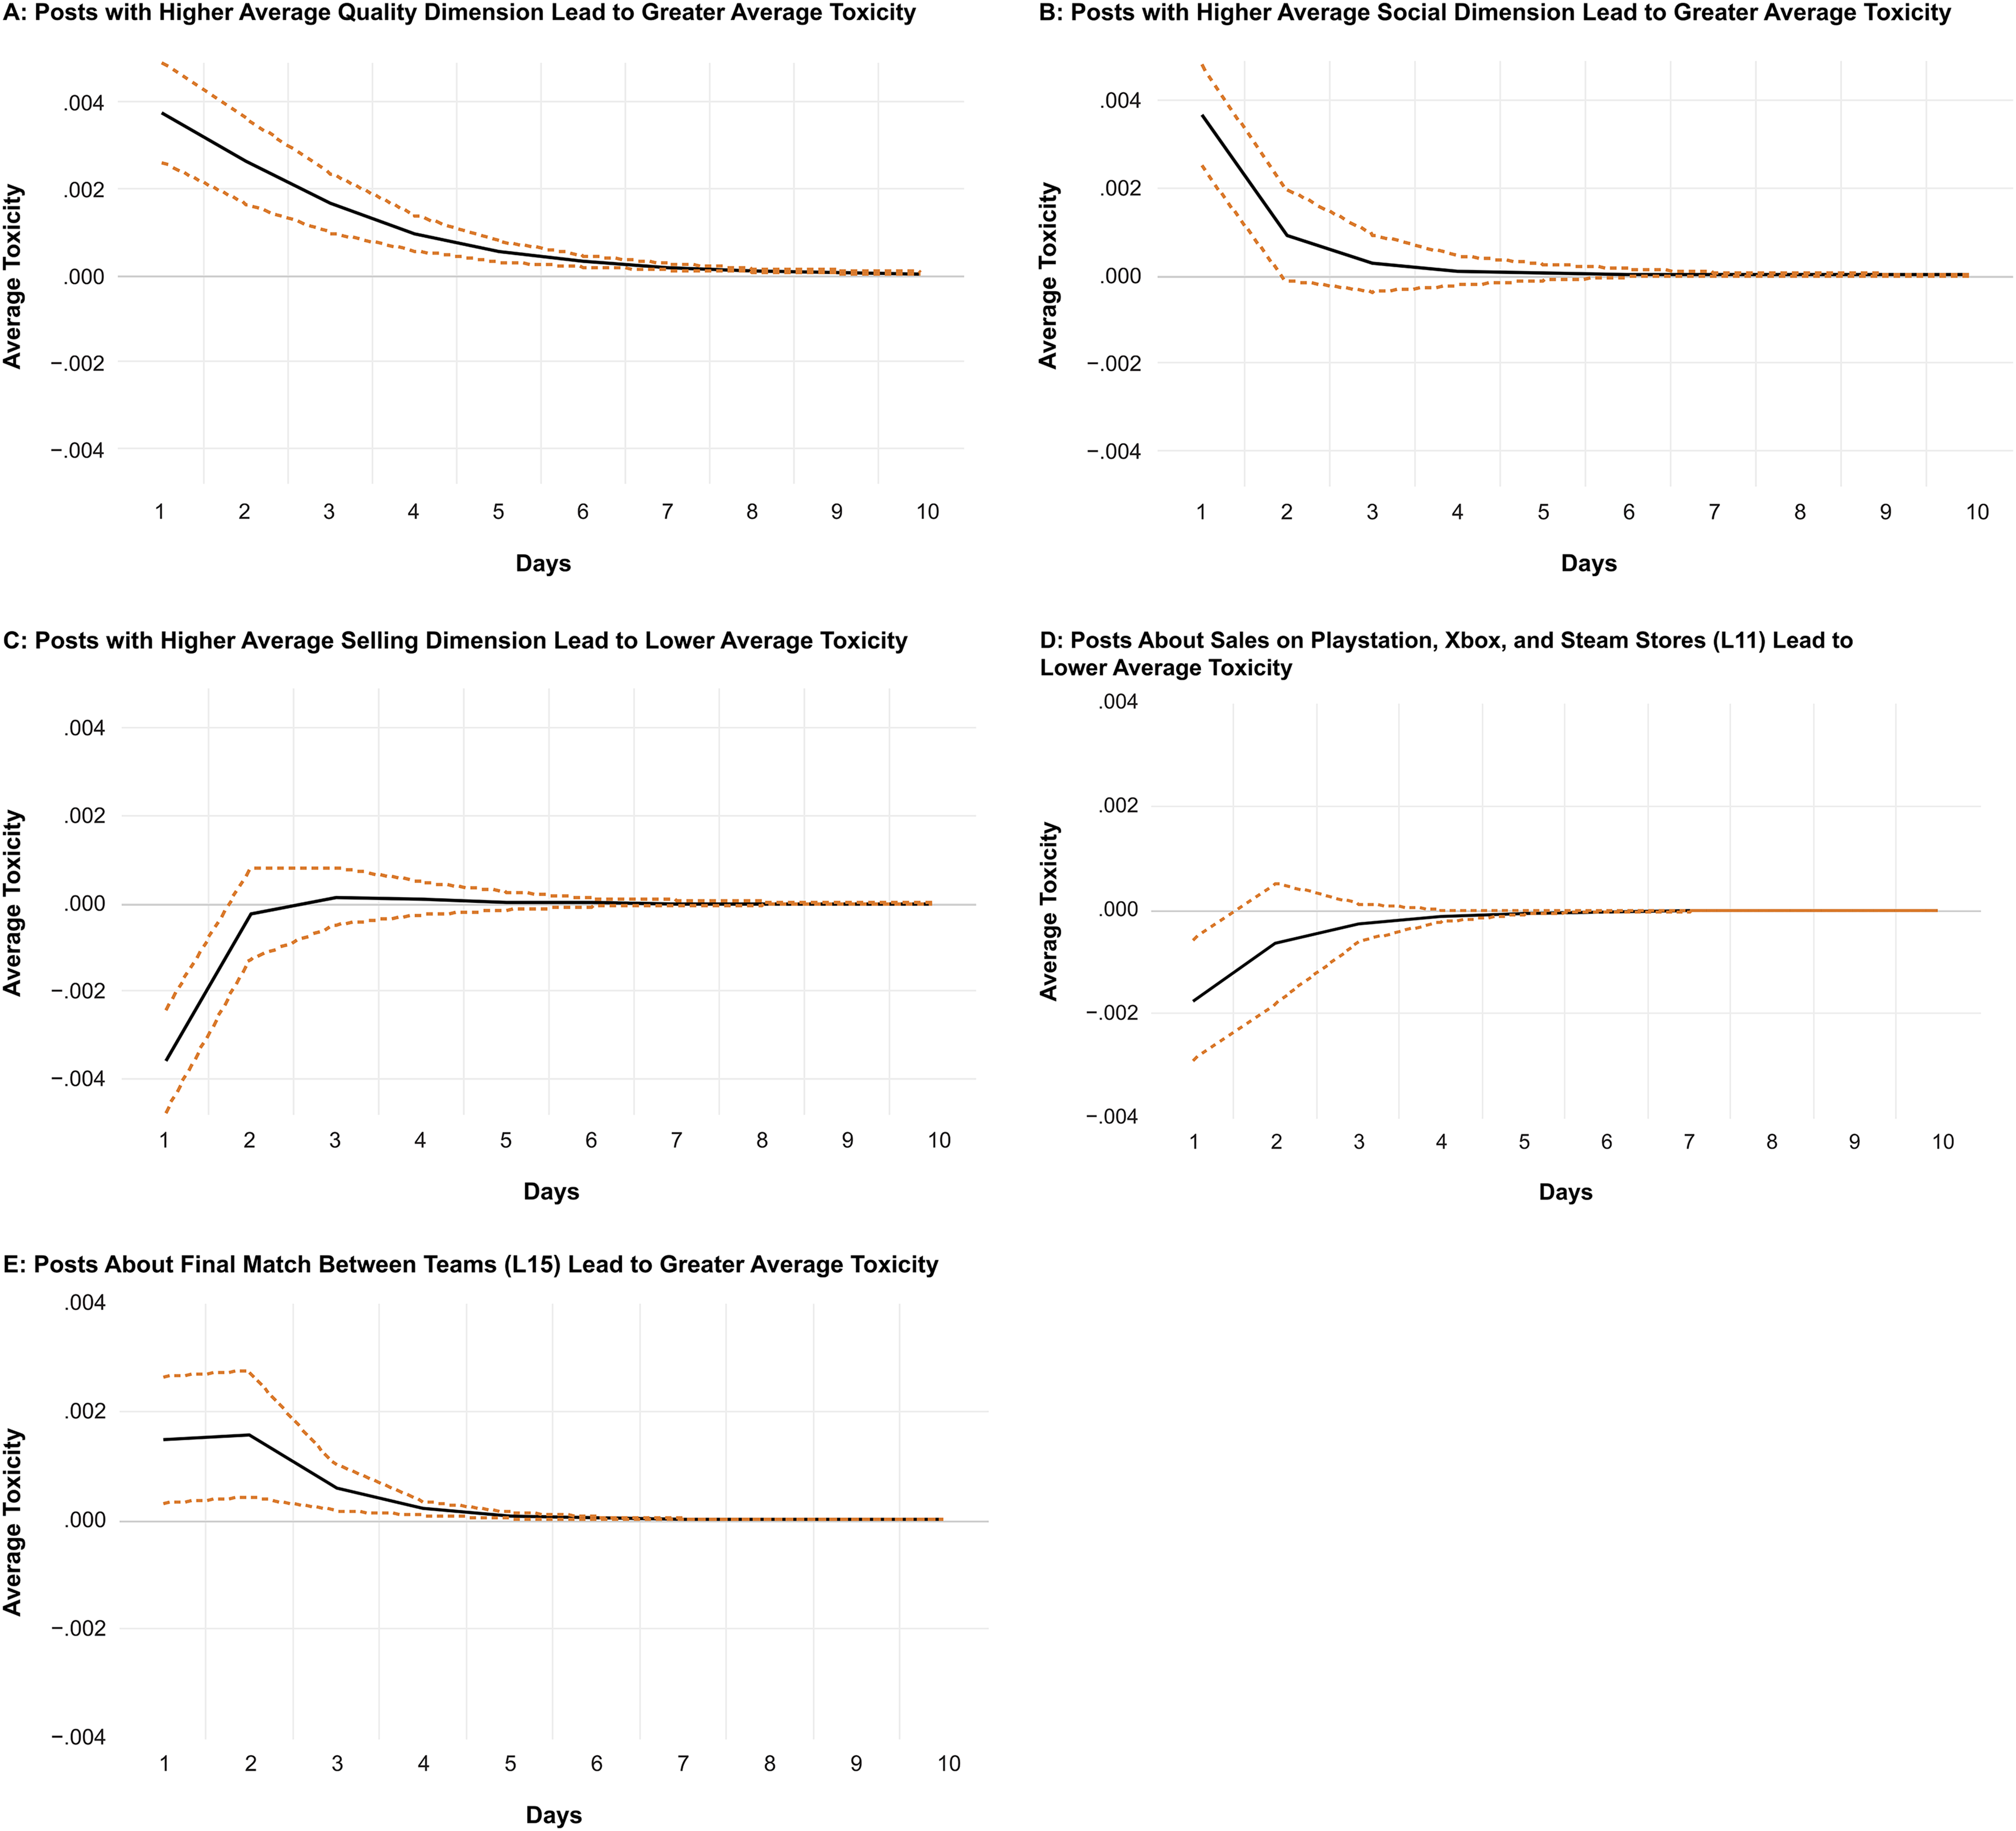
IRFs for MGC Measures to Average Toxicity.
We found that average toxicity is impacted by all content dimensions. First, in support of H1, we found that higher social dimension in a post leads to greater average toxicity in the first two days after the post is made. This probably occurs because internet trolls react to posts attempting to cultivate a sense of belonging and fostering interaction between marketers and users. Given that internet trolls enjoy antisocial interactions (Foulkes et al. 2014) and take pleasure in causing pain to others (Van Geel et al. 2017), posts aimed at creating social connections are particularly attractive to internet trolls, who react by posting toxic comments. Second, we found that the quality dimension has a positive impact on average toxicity for six days. This finding probably occurs because when a company introduces posts with quality claims, internet trolls react by creating toxic posts that provoke the community. Third, we found that the selling dimension is negatively associated with average toxicity. This might occur because posts with the selling dimension do not motivate user engagement, as they may be less persuasive when the commercial intent is overt. Therefore, trolls might learn that such posts are often ignored by users and simply react when other content dimensions are used, since the other content dimensions generate stronger responses in community users.
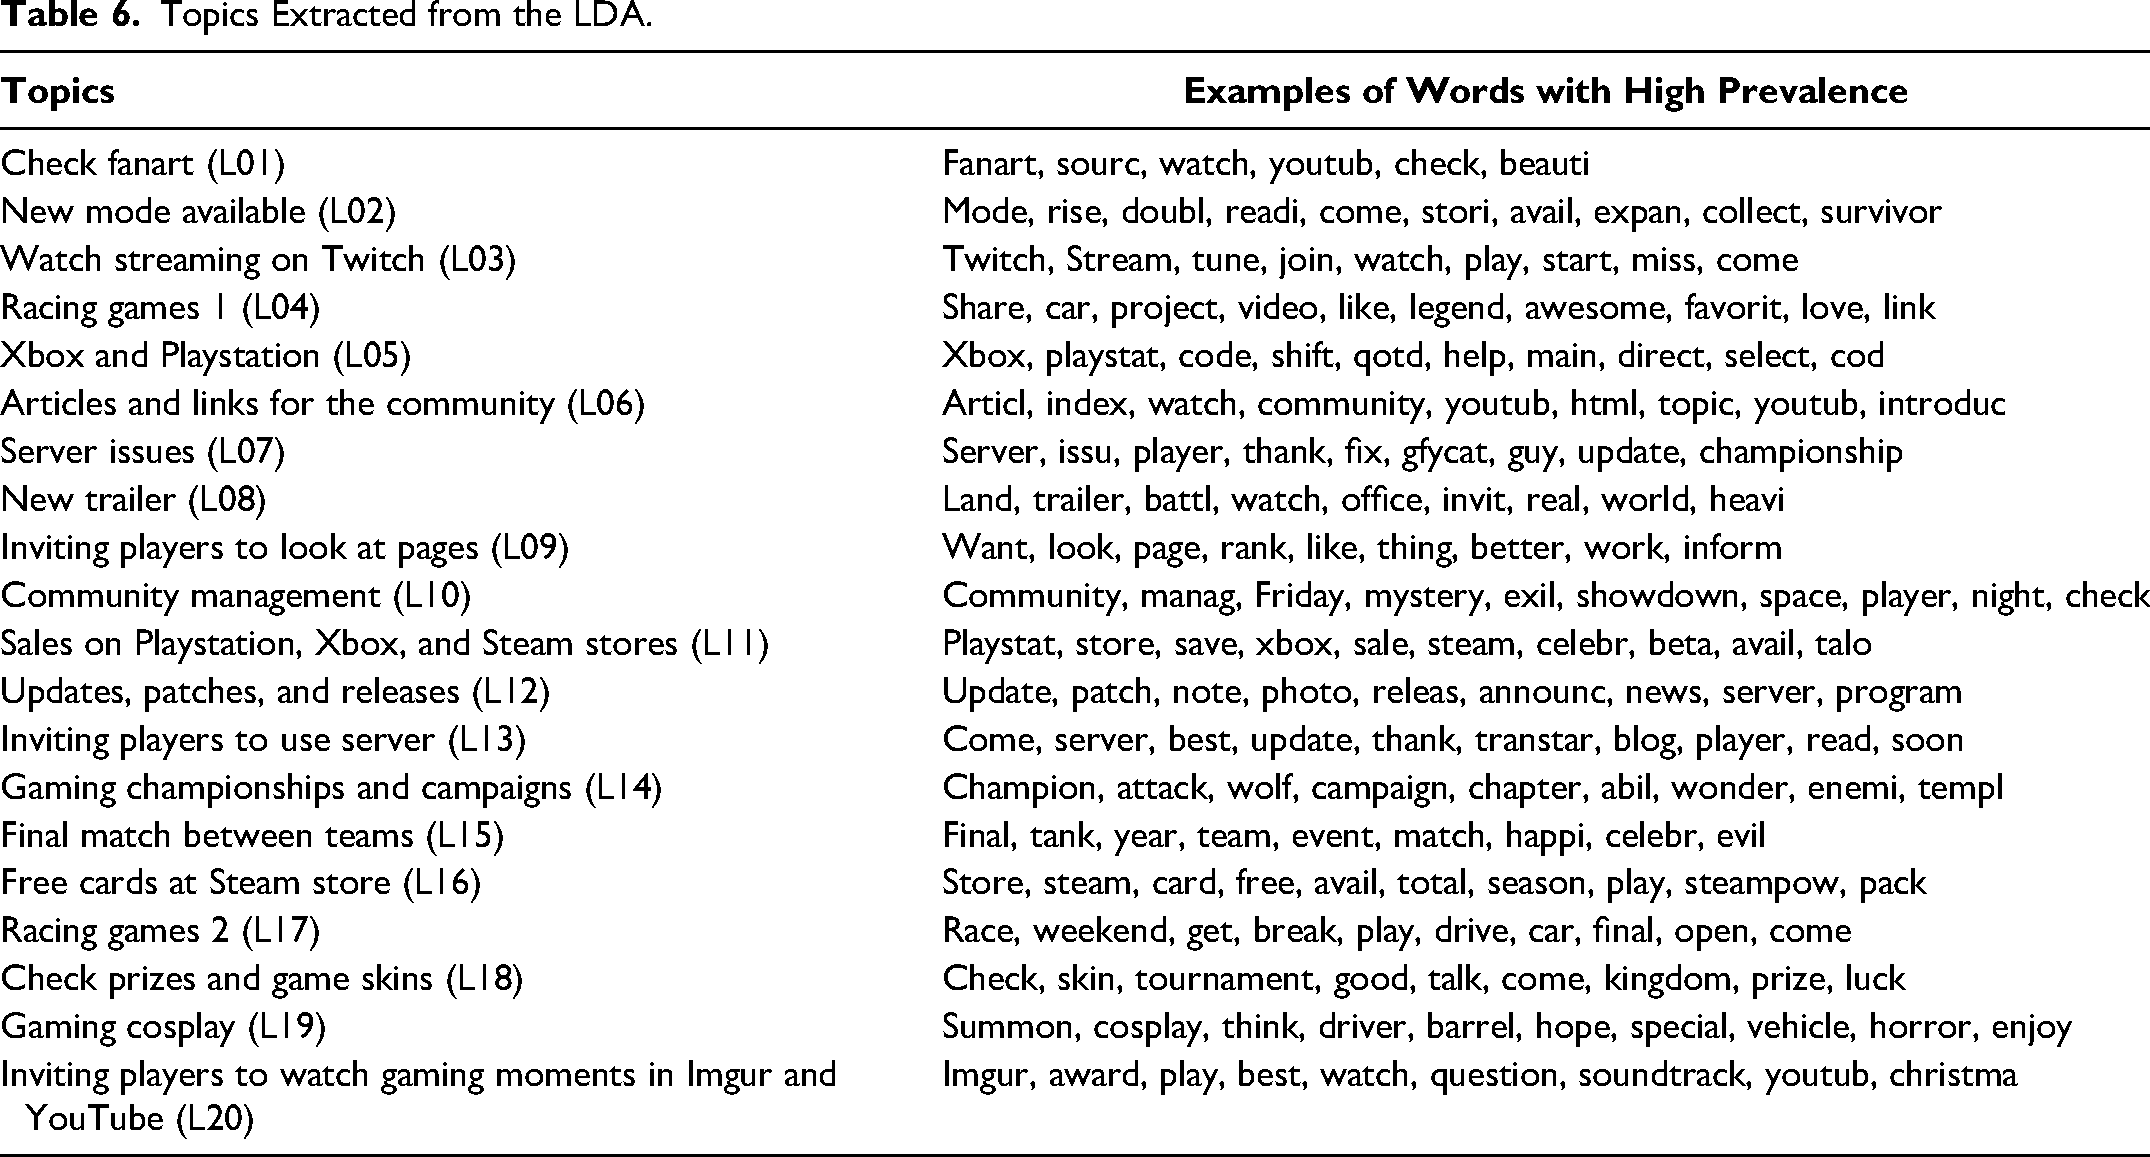
Regarding the topics extracted through the LDA, most had a strong impact on average toxicity (see Table 6 for a list of words composing these topics). When we looked at the impact of these topics, we found some interesting patterns. First, topics related to sales (L11) and those related to launch of new trailers (L08) lead to lower average toxicity. This indicates that posts with a commercial intent are less likely to generate toxic comments. Second, we found that the topics of fanart (L01) and gaming cosplay (L19) are positively associated with average toxicity. This again reinforces that posts that promote social interactions are more likely to generate toxic comments. Third, we found that the topic of final match between teams (L15) is positively associated with average toxicity. An important word in this topic is “tank,” which is in the title of the game World of Tanks, sampled for this study. This game hosted popular tournaments in the e-sports community during the period analyzed. The positive effect observed here probably occurs because supporters of different e-sports teams engage in toxic discussions when defending their favorite teams in the community. This is akin to online provocations between supporters of the Boston Celtics and Los Angeles Lakers in advance of a match. Finally, a topic that indicates service failure (L07, server issues) is negatively associated with average toxicity. This is interesting because it could be argued that frustrated consumers would make toxic comments after companies post about server issues. Nonetheless, it seems that the toxicity is not substantially elevated in such cases, reinforcing the argument that toxic comments are generated by internet trolls. Please refer to Figure 2 and Web Appendix 8 for the full results with the LDA topics.
Topics Extracted from the LDA.
To get a sense of the economic magnitudes of these effects, one can compare the IRFs to the standard deviation of the response variable (i.e., toxic comments). The standard deviation of average toxicity presented in Table 2 is around .080. The impulse of average toxicity in response to a shock of one standard deviation in most variables after one period starts around .004. This corresponds to an impulse of around .05 standard deviations. For example, one can interpret the IRF of average toxicity to posts with quality dimension as follows: average toxicity increases by .05 standard deviation following a positive shock of one standard deviation in the quality dimension. The economic magnitude of this effect is small mostly because most of the variation in average toxicity is driven by its lagged values. For example, a positive shock of one standard deviation in the innovation of average toxicity (not presented) results in an increase of one standard deviation in average toxicity one period later. That said, these IRFs nevertheless enable us to compare the economic magnitudes of different variables’ effect on average toxicity since they all correspond to a shock of one standard deviation in the innovation of the impulse variable.
As shown in Table 6, using LDA, we extracted interesting topics that are specific to the theme and industry. However, we acknowledge that a few topics have lower semantic coherence. This issue has been discussed in the literature by various researchers as a weakness of LDA (Griffiths, Steyvers, and Tenenbaum 2007; Jalali and Papatla 2019). Nonetheless, we demonstrated that using LDA topics provides some interesting insights into toxic comments, and thus LDA is an appropriate method for our study.
The Impact of MGC on Product Usage (Average Playtime)
In support of H2a, we found that the quality dimension has a positive impact on average playtime after the fourth day (see Figure 3). That is, MGC that brings to light that the games’ quality increases product usage. In support of H2b, we found a strong positive association between the social dimension and average playtime. This suggests that posts aiming at creating a social connection between the game developers and consumers have a strong positive impact on product usage. Note that these two associations are not explained by the games’ quality, as we used users’ reviews as a control variable in our model. Interestingly, rejecting H2c, we found that the selling dimension is negatively associated with product usage. Therefore, posts attempting to convince the audience to purchase the games result in decreased playtime. Past research suggests that excessive advertising repetition creates a fatigue effect that may reduce advertising value (Haghirian, Madlberger, and Tanuskova 2005), and communication with commercial intentions may reduce the persuasion effects of narrative content (Wentzel, Tomczak, and Herrmann 2010). In support of this rationale, we found that the selling dimension occurs 2.85 times per post on average. Previous research also found that the selling dimension is negatively associated with sales when used excessively (i.e., 2.36 times per post; Nepomuceno, Visconti, and Cenesizoglu 2020). Since in the gaming context sales are correlated with product usage (i.e., after buying a game, players are likely to play it) and in the current study the selling dimension occurs with higher frequency than in prior research, we believe that the negative correlation between the selling dimension and product usage demonstrates the same phenomenon: too much selling content decreases sales through fatigue, which in turn reduces product usage.
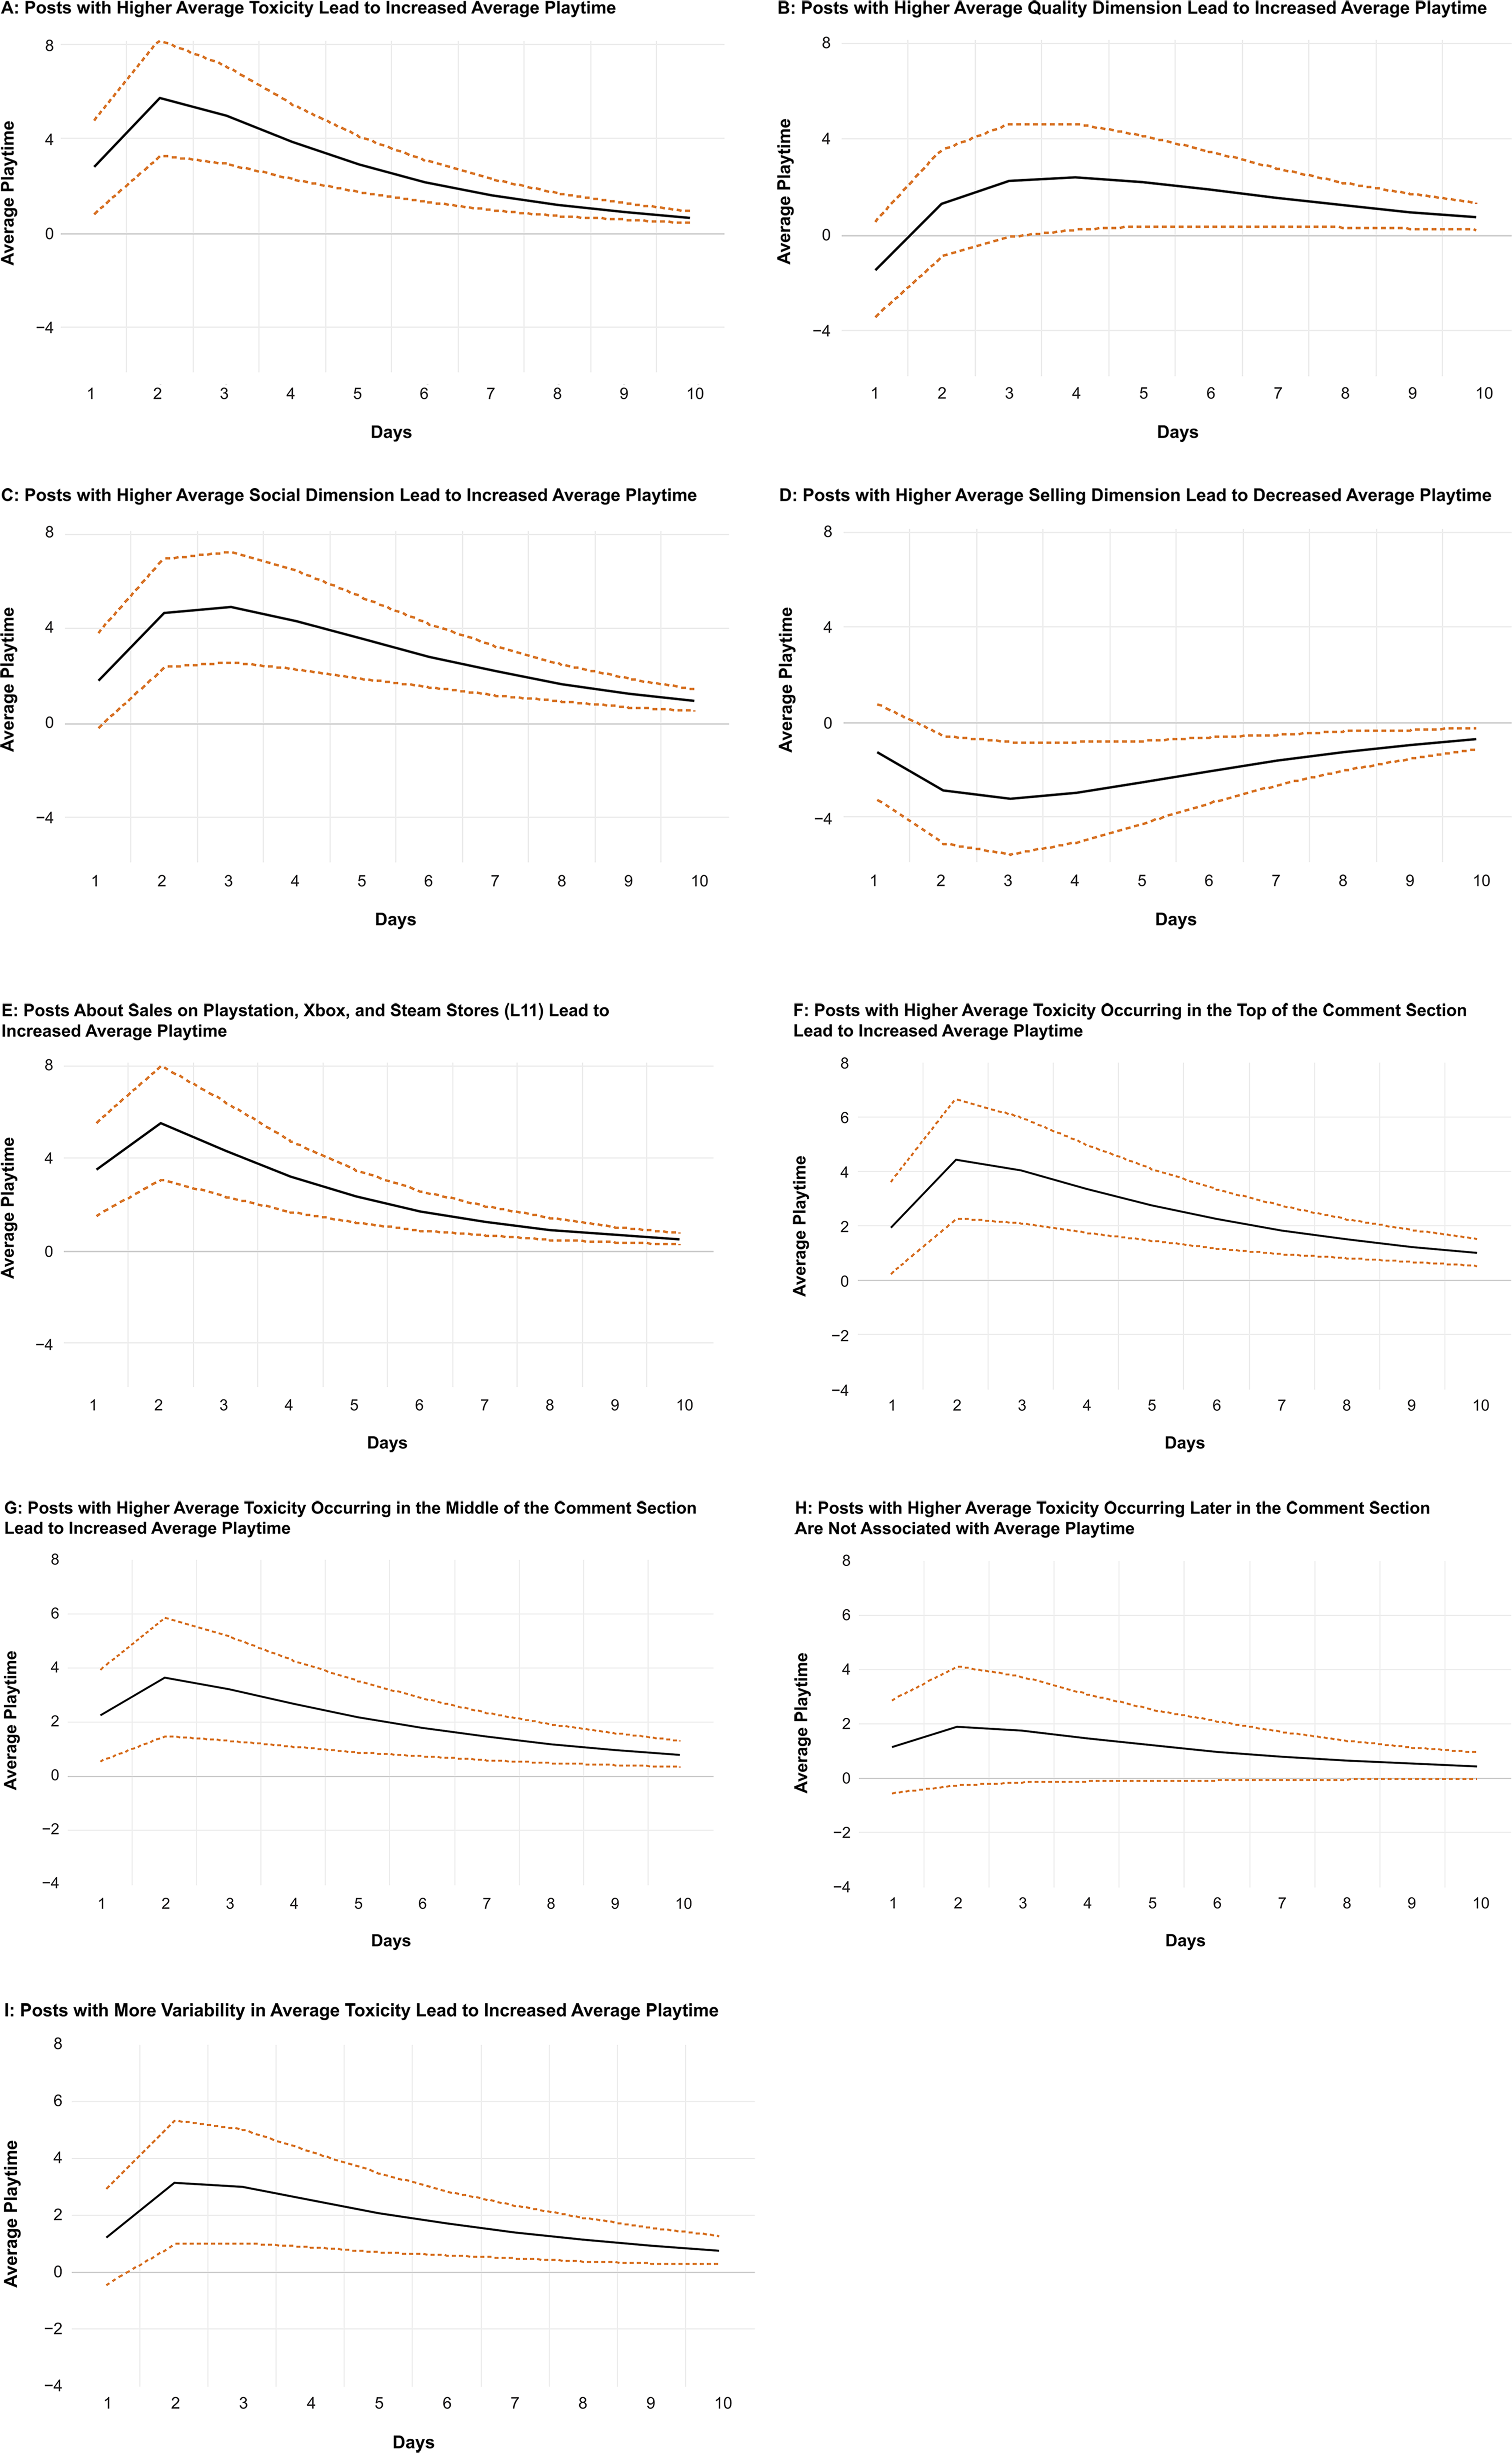
IRFs for MGC Measures and Average Toxicity to Average Playtime.
Regarding the topics extracted through LDA, we found that the topic of sales on Playstation, Xbox, and Steam stores (L11) is positively associated with average playtime. Therefore, although the selling dimension has a negative impact on playtime, posts that are specifically about sales and promotions on popular platforms lead to an increase in product usage, likely because consumers start playing the game after purchasing it during a promotional period. In other words, not all posts about selling reduce product usage. Those related to price promotions may drive sales and increase product usage. The remaining topics are not associated with average playtime.
Finally, as mentioned previously, we used the number of comments by platform as control variables in our analysis. The coefficient estimates on these control variables in models for user engagement and average toxicity enable us to provide some initial insights into the relations between platform and user engagement and comments’ toxicity. Specifically, the number of posts on Facebook is negatively correlated with both average toxicity and average playtime, whereas the opposite holds true for the number of posts on Instagram and Twitter, which both correlate positively with average toxicity and average playtime. All these relations are statistically significant at the 1% level.
The Impact of Average Toxicity on Average Playtime
We explored two competing hypotheses regarding the association between toxic comments and average playtime. We found that average toxicity is positively associated with greater average playtime. That is, we found that toxic comments, likely posted by internet trolls, increase product usage. Of note, this positive impact lasts for over ten days.
This finding supports past work that consumers with high self–brand connection increase behavioral intentions if presented with negative word of mouth (Wilson, Giebelhausen, and Brady 2017). It also supports the notion that negative word of mouth may lead to greater product awareness, ultimately increasing sales (Berger, Sorensen, and Rasmussen 2010). Possibly, posts with greater average toxicity may lead to fervid debates between internet trolls and consumers. This activity increases the number of comments a post will get, which in turn may increase the likelihood that the post will be exposed to other potential consumers, who may then become aware of the game and purchase it to play it. To test this possibility, we explored the association between average toxicity and number of comments and whether the number of comments is associated with average playtime.
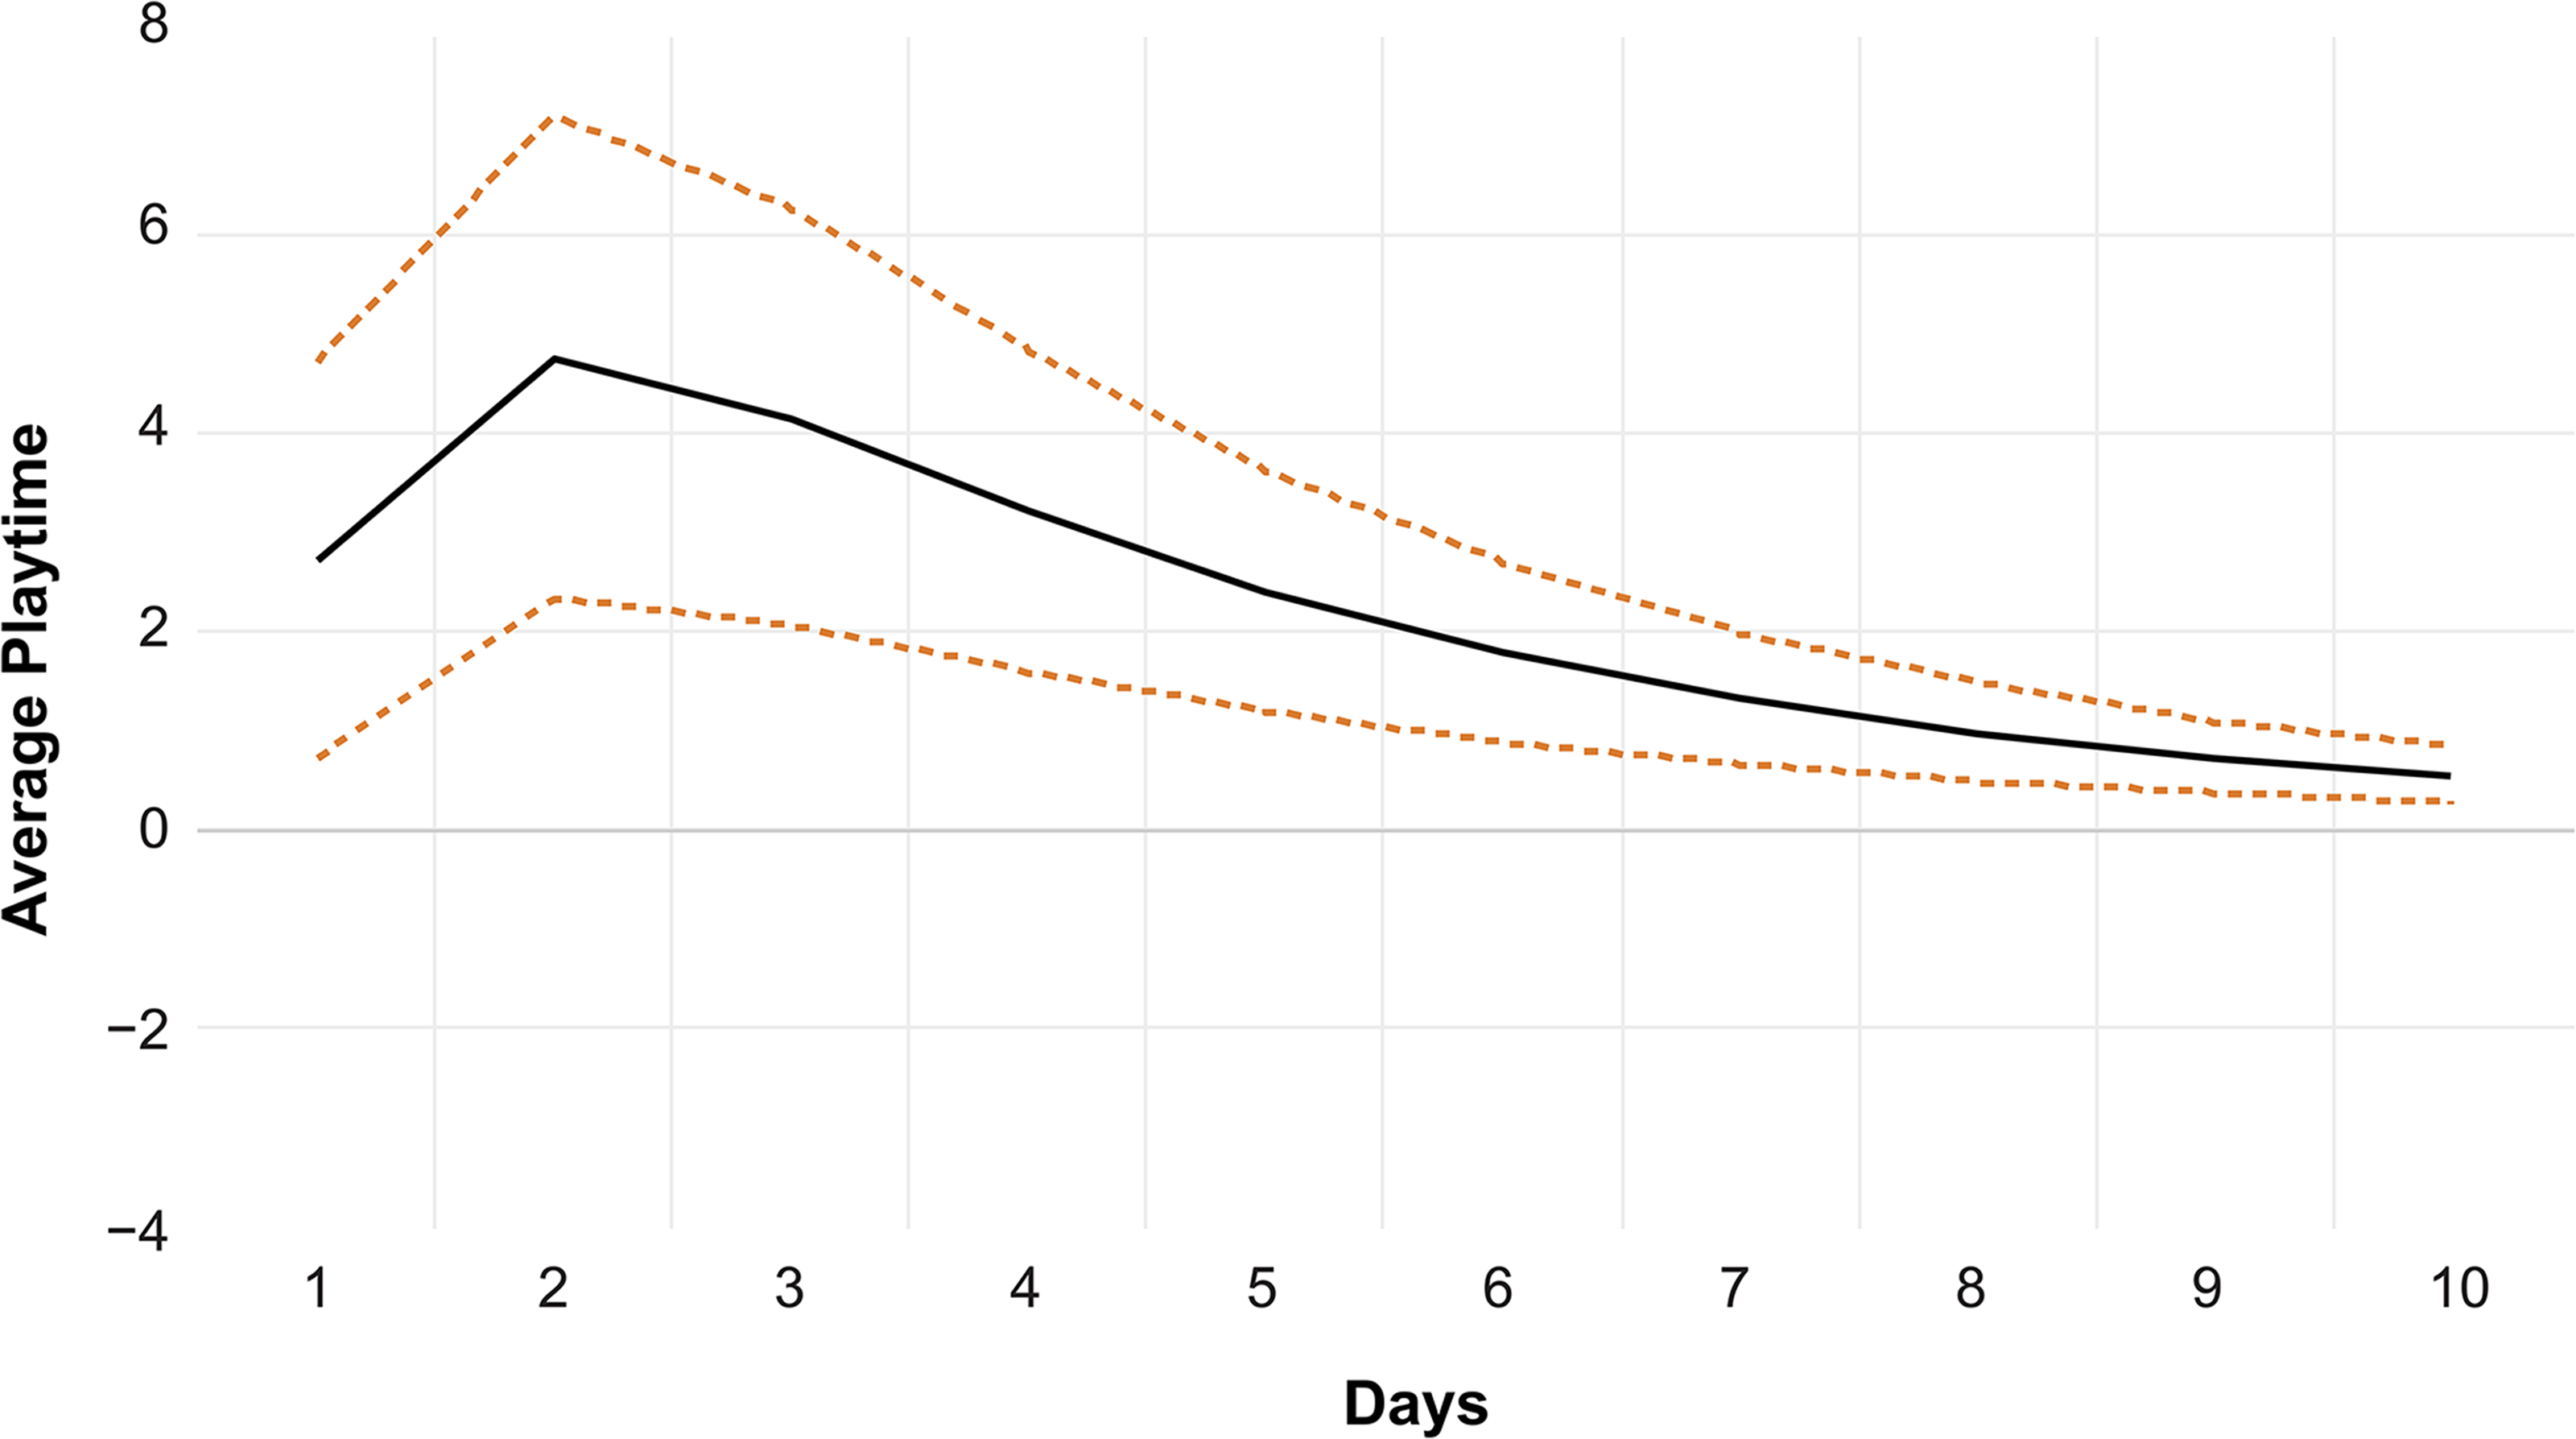
As illustrated in Figure 4, the association between average toxicity and number of comments is positive, so more toxic posts increase the number of subsequent comments on all posts for four days. Furthermore, Figure 5 shows that the number of comments increases average playtime for over nine days. Overall, these results support the notion that toxic comments lead to more comments (i.e., debates in the community); and when comments increase, the game is played more often. Interestingly, we also explored which dimensions of content and LDA dimensions generate an increase in number of comments (regardless of comment toxicity). We found that none of the topics extracted via LDA are associated with the number of comments. In addition, posts with the quality dimension are not associated with the number of comments. However, we found that posts with the social dimension lead to fewer comments, whereas posts with the selling dimension lead to more comments. Interestingly, these two significant associations are the reverse of what was found for average toxicity. That is, while posts intended to create a social connection with the audience (i.e., social dimension) are positively associated with average toxicity, the social dimension is negatively associated with the number of comments. Furthermore, posts intended to sell the products (i.e., selling dimension) are negatively associated with average toxicity but positively associated with the number of comments. See Figure 6 for the results. Interestingly, these findings suggest a compensatory effect. That is, the social dimension increases playtime via an increase in toxic comments, but concomitantly, it decreases average playtime via a decreased number of comments. In addition, the selling dimension decreases playtime via a decreased number of toxic comments; however, it increases playtime via an increased number of comments.
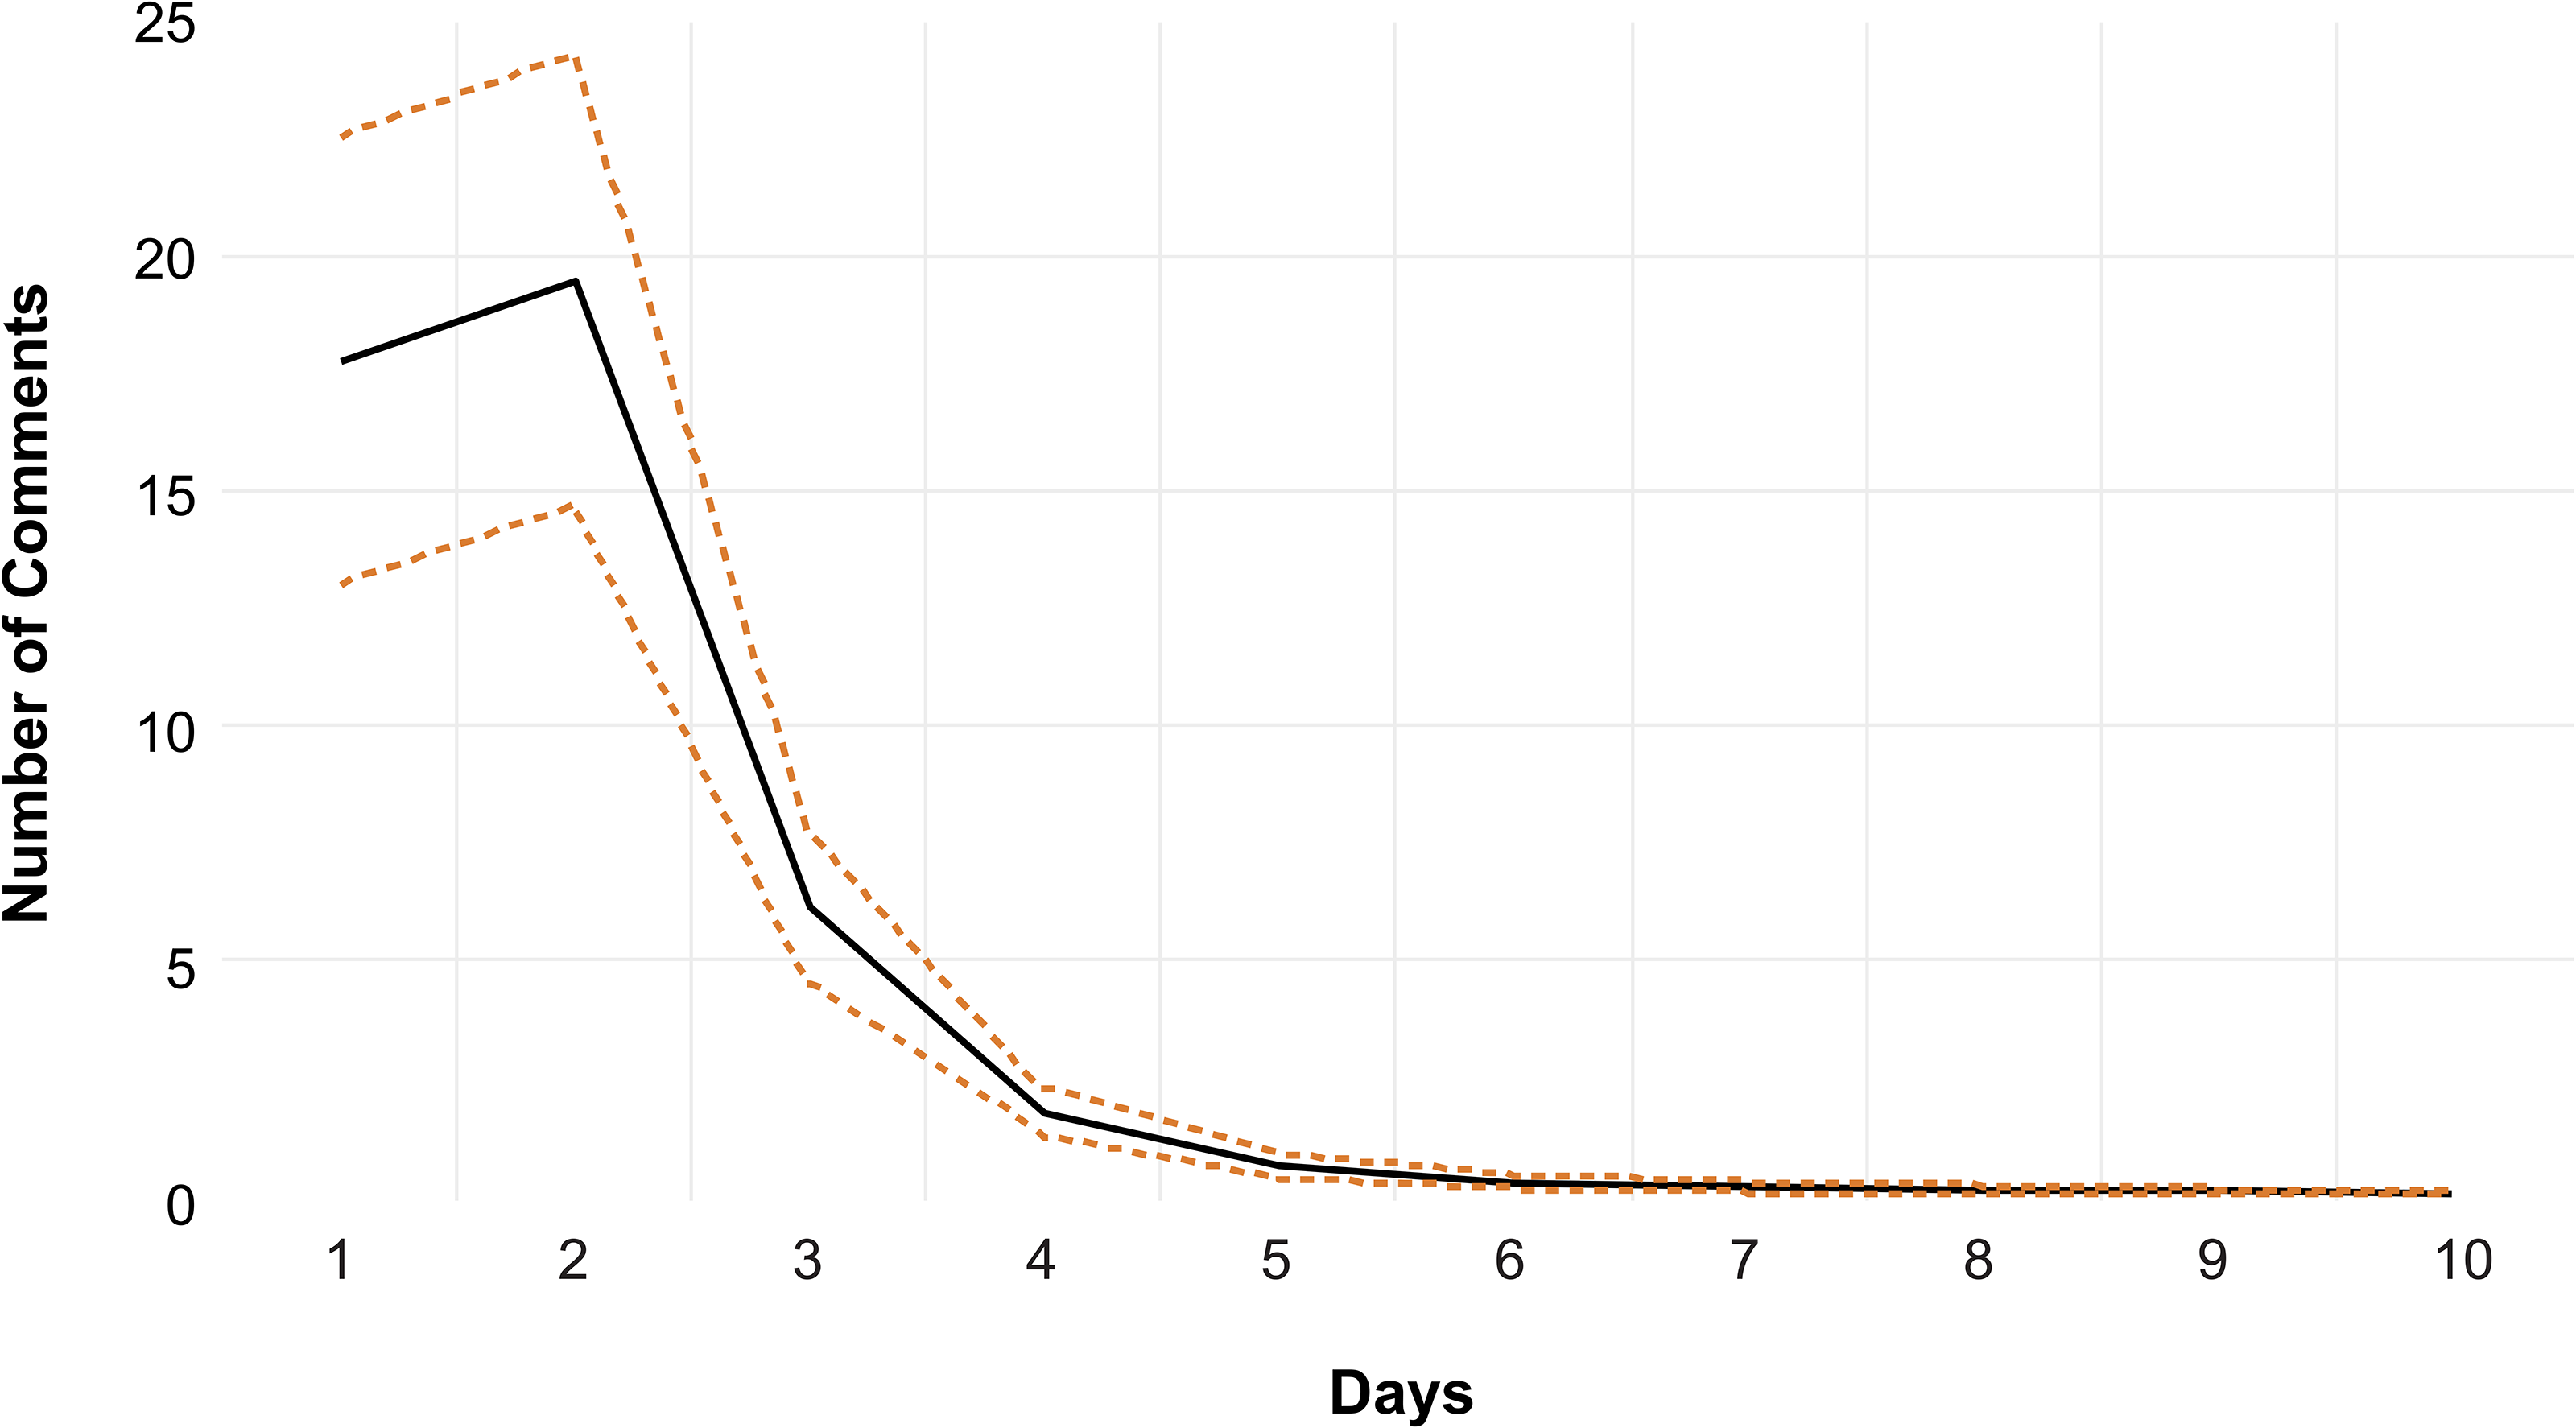
Posts with Greater Average Toxicity Lead to Increased Number of Comments.
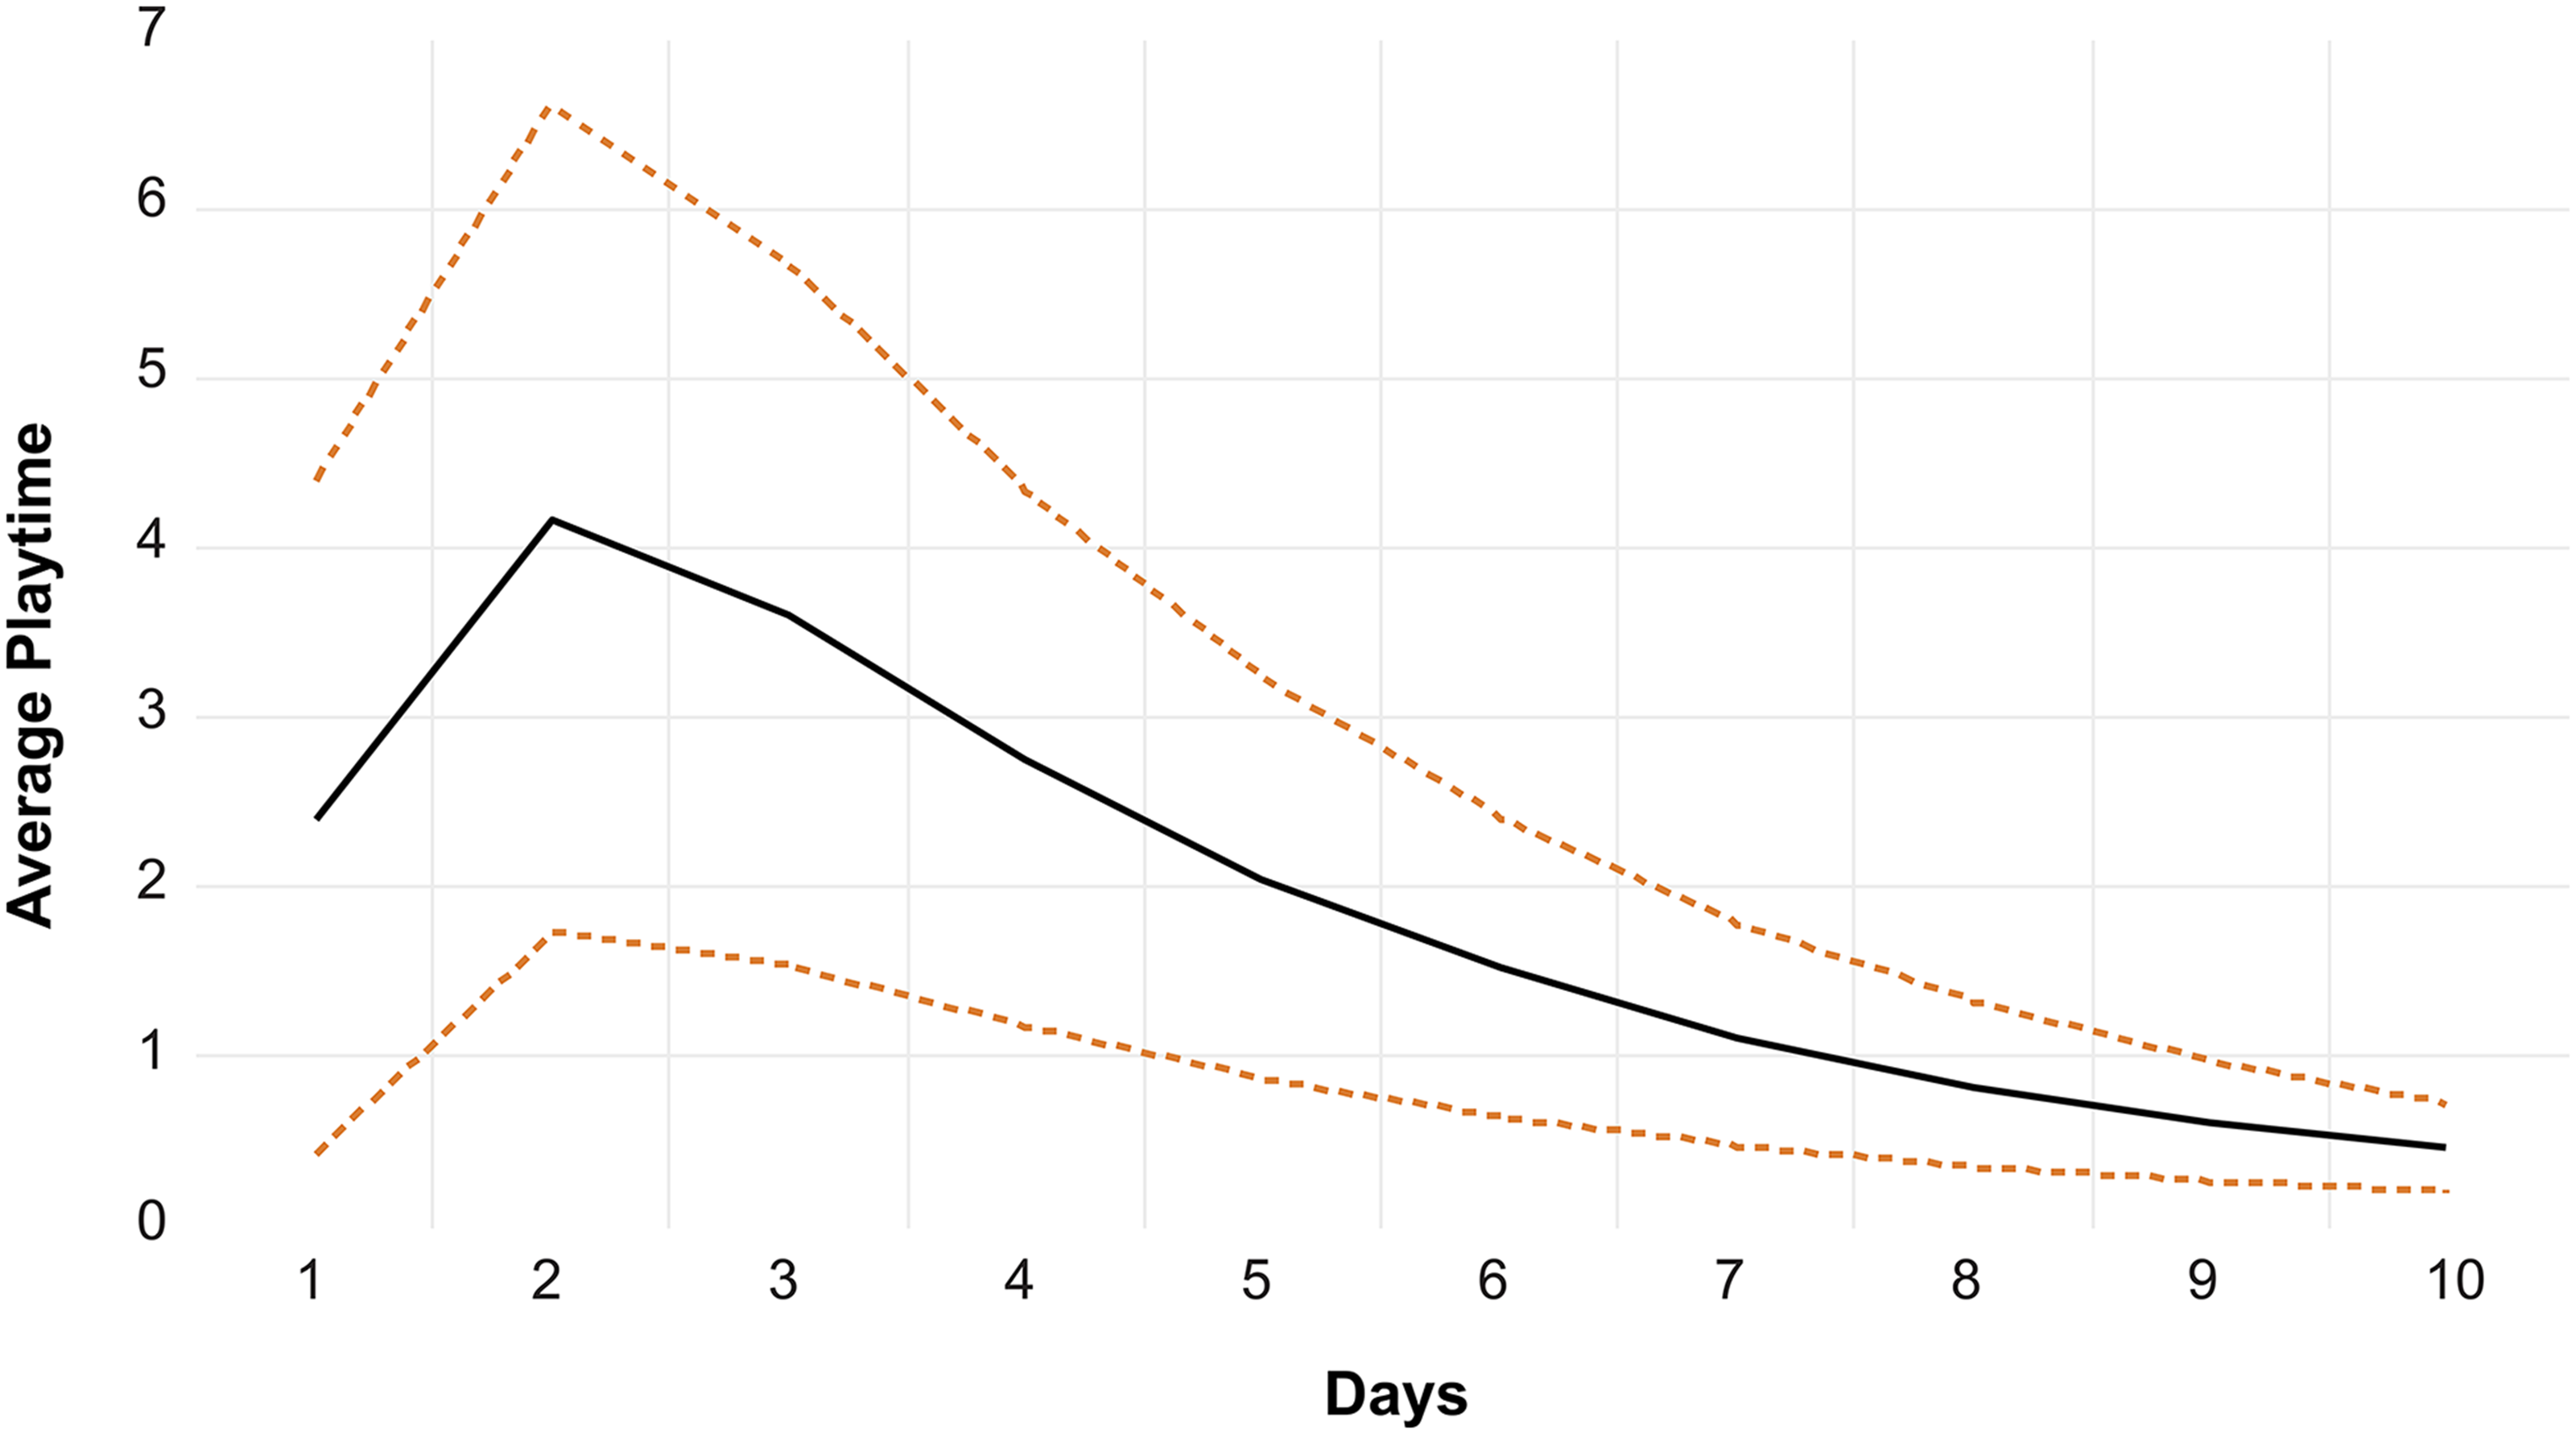
Posts with More Comments Lead to Increased Average Playtime.
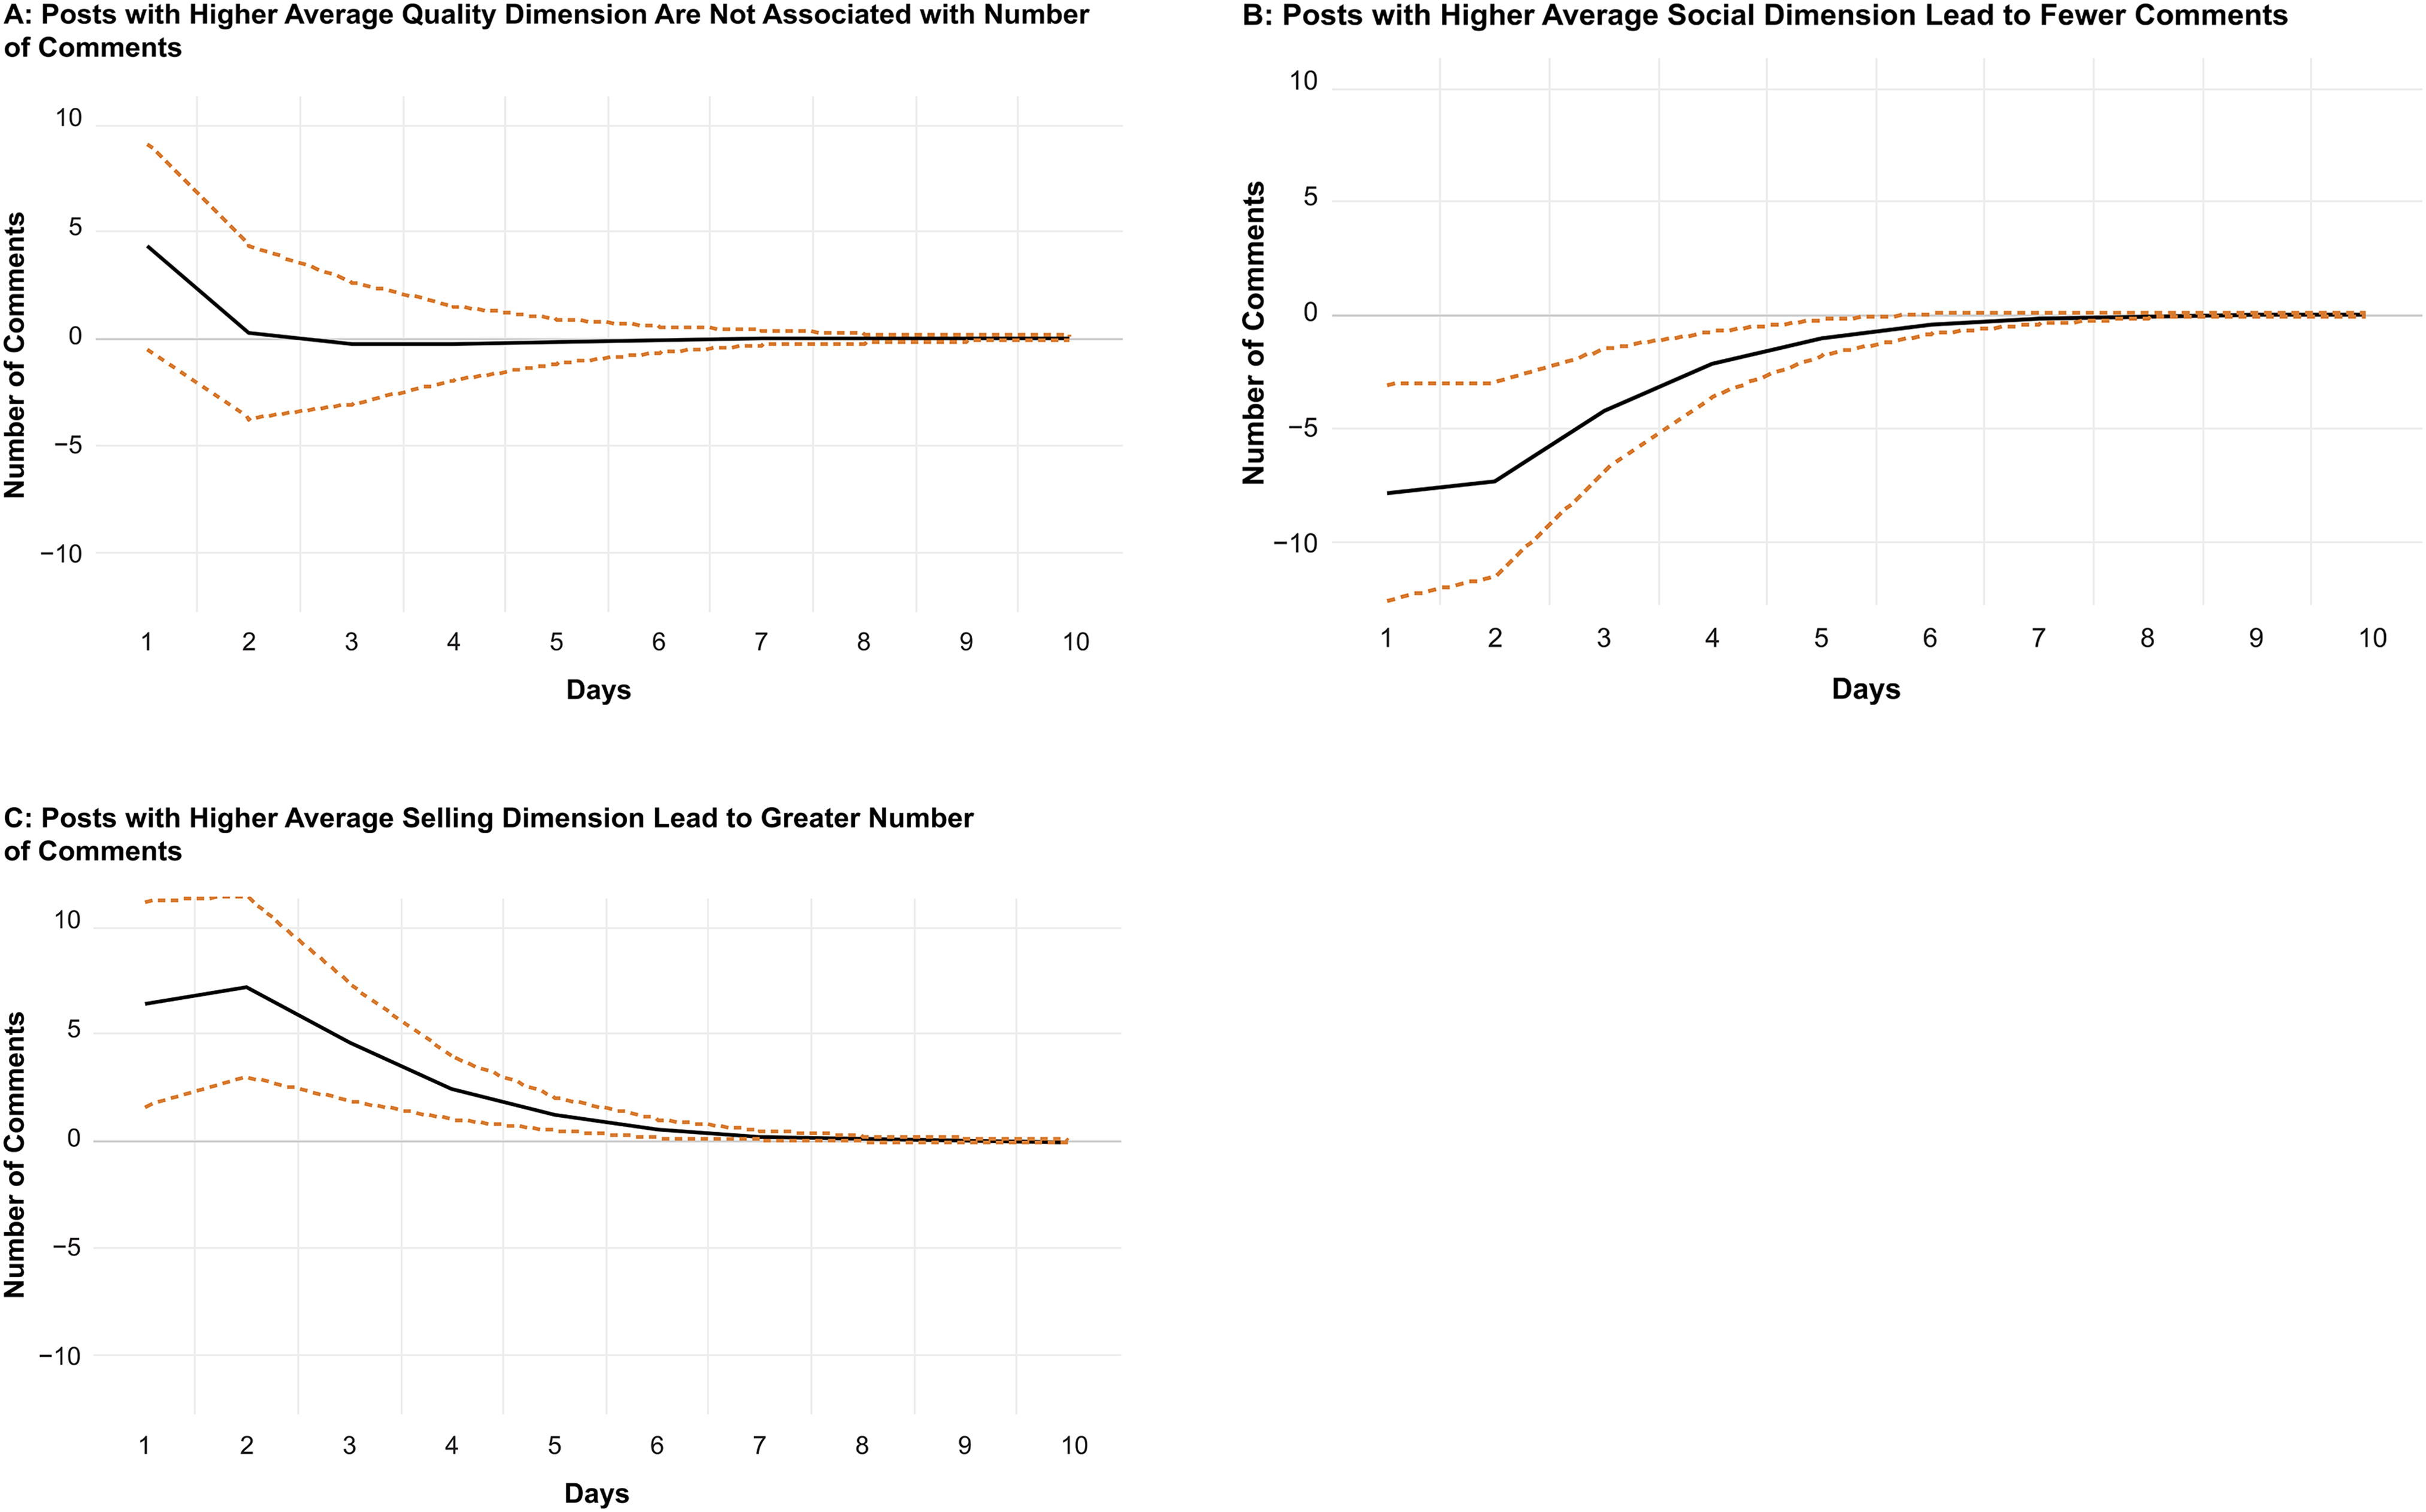
IRFs for MGC Measures to Number of Comments.
Once again, to get a sense of the economic magnitudes of these effects, one can compare the IRFs to the standard deviation of the response variable (i.e., average playtime). The standard deviation of average playtime presented in Table 2 is around 233. The impulse response of average playtime to a positive shock of one standard deviation in the innovation of quality dimension after one period is 2.7. This can be interpreted as follows: Average playtime increases by .012 (2.7/233) standard deviations following a positive shock of one standard deviation in the quality dimension. Once again, the economic magnitude of this effect is small, mostly because most of the variation in average playtime is driven by its lagged values. As mentioned previously, these IRFs nevertheless enable us to compare the economic magnitudes of different variables’ effects since they all correspond to a shock of one standard deviation in the innovation of the impulse variable.
The aforementioned analyses do not enable us to conclude whether the impact of average toxicity on average playtime is the same regardless of where it occurs in the comment. To explore this question, we split the comments made by followers into terciles. The first tercile contained the first third of all comments made by followers, the second tercile contained the second third, and the third tercile contained the final third. We then calculated the average toxicity for each tercile and substituted the three toxicity scores in place of the toxicity score used in the preceding analyses. We removed posts that obtained fewer than three comments from the analyses. Interestingly, we found that the toxicity score is positively associated with greater average playtime only for the first two terciles. This shows that when a toxic comment occurs late, it has no significant impact on average playtime, possibly because other users are less likely to notice late comments.
Also interestingly, it could be argued that variability of user sentiment may lead to greater engagement, as this variability is a sign of users vigorously debating a topic. Given that sentiment is correlated with perspective in our study (r = −.427, p < .001; VADER used to measure sentiment), we explored the possibility that the variability of average toxicity might explain average playtime. We found a positive association between variation in toxicity scores and average playtime. Nonetheless, this association is less significant than the association between toxicity and average playtime (see Figure 3). Whereas the association between toxicity and average playtime is positive through ten days, posts with greater variability of toxicity are associated with average playtime only after the second day, and in smaller magnitude. In any case, these results show that posts that generate either toxic or nontoxic comments will lead to greater product usage, supporting the notion that vigorous online debates impact product usage.
Finally, given that we used average toxicity in our model, it is important to consider whether this average is based on only a few or hundreds of comments. Arguably, posts by gaming companies followed by 100 toxic comments should have a different impact than those with the same average comment toxicity but based on very few comments. To explore this issue, we created an interaction term in our analysis by multiplying two variables: comment toxicity and number of comments. This enabled us to test the combined effect of high average toxicity and high number of comments. We found that when the number of comments and the average toxicity are high, average playtime is even higher (see Figure 7).
Posts with More Comments and Greater Average Toxicity Lead to Increased Average Playtime.
General Discussion
Theoretical and Managerial Implications
Our study aligns with a broader research stream investigating the impact of MGC on engagement. Previous research has found that informative MGC has a positive impact on engagement (Bai and Yan 2020), sharing (Ordenes et al. 2019), user sentiment when undesirable event outcomes occur (Meire et al. 2019) and higher political contribution for politicians who recently joined Twitter (Petrova, Sen, and Yildirim 2021). Furthermore, emotional MGC has a positive impact on user sentiment (Meire et al. 2019), and MGC with positive emotions has a positive impact on sharing (Tellis et al. 2019). Our research builds on the past research and provides further support for the impact of MGC. In particular, we tested the impact of MGC measures on average toxicity and average playtime in game videos and user comments on them, and the impact of average toxicity on average playtime. We found that the social and quality dimensions increase average toxicity and average playtime, whereas the selling dimension decreases average toxicity and average playtime. Thus, posts aiming to demonstrate the quality of a product or to cultivate a sense of belonging to a group are more likely to lead to toxic comments. Given that prior research found that internet trolls’ motivations are to cause pain to others (Van Geel et al. 2017) and disrupt group cohesion (Binns 2012), it is likely that these associations occur because trolls see such posts as a way to achieve these goals.
Previous research has found that negative word of mouth decreases sales (Rosario et al. 2016). Nonetheless, we found that toxic comments increase product usage, and we provide evidence that this occurs, at least in part, because toxic comments generate more comments, which in turn lead to greater playtime.
Our research is also in line with a large research stream investigating the impact of MGC on consumer behavior. Past studies have found that MGC drives consumer spending, cross-buying, and customer profitability (Kumar et al. 2016) and that MGC with persuasive content drives consumer purchases (Goh, Heng, and Lin 2013). In addition, researchers have found that MGC is more effective than UGC at driving consideration and purchase intent, and that MGC with images or videos increases consideration and purchase intent (Colicev, Kumar, and O’Connor 2019). Finally, recent research has shown that the volume of MGC predicts box office revenues (Song et al. 2019) and that customer spending is increased by informative and persuasive MGC (Yang et al. 2019). Overall, these studies demonstrate that MGC has an impact on commercial performance and consumer behavior. Our research provides further support for this idea. We find that average playtime is negatively associated with the selling dimension and positively associated with average toxicity as well as the social and quality dimensions.
The current research provides insights regarding how MGC drives toxic comments and the impacts of toxic comments on product usage. This has some interesting managerial implications. First, since the current research shows that posts with social and quality content are more likely to generate toxic comments, marketers, when posting such content, should be more attentive and reactive to toxicity, as internet trolls are more likely to react following such posts. Second, previous research has strongly advocated that toxicity should be removed or dealt with quickly (Golf-Papez and Veer 2022). Nonetheless, our research shows that toxic comments can increase product usage. This puts marketers in a difficult position. Whereas there is evidence that toxic comments create problems for online communities and their users (Craker and March 2016; Hinduja and Patchin 2010), the current research suggests that toxic comments may improve users’ engagement and product usage, which would suggest that toxicity should not be restrained. Therefore, marketers have to weigh carefully the costs and benefits of toxicity in the comments section before deciding whether to use tools to identify toxicity and cope with it. Despite these potential benefits, marketers should carefully monitor toxic comments, as they risk disrupting group cohesion and can create an environment that is negative for the company's core audience.
Limitations and Future Research
Despite the contributions and insights provided, some limitations should be taken into account when the findings of this research are evaluated. First, although our data set is substantially large, it represents only a segment of the gaming industry. We considered only computer games and overlooked other gaming platforms (e.g., Playstation, Xbox, and Nintendo). Furthermore, it remains to be seen whether these findings and developed models are generalizable to other industries. Future research would benefit from testing our model and its generalizability in other industries. We believe that users are more likely to defend products and services that play a role in defining their self-image and identity, such as car preferences (Belk 1988) and dietary preferences (e.g., vegetarianism; Fox and Ward 2008). In this case, an attack on such preferences would be viewed by consumers as an attack on themselves, thus creating strong reactions. From this perspective, we believe that our findings can be replicated in other entertainment industries, like music, and for products that have strong self-identity roles, like cars and clothing. Finally, it is important to keep in mind that Nvidia and Stadia did not exist in the sampling period, whereas the Epic Games platform was launched in July 2017. Therefore, while Steam was a major platform in the period studied, future research should consider additional computer platforms, as the market is increasingly competitive.
Second, although we used video games as a control variable, it is possible that interesting insights might be uncovered by considering the impact of MGC within each game genre. For example, does the quality dimension impact average playtime equally for all game genres? Are all the subdimensions of quality used similarly in all genres, or are there preferences in different game genres? These interesting research questions remain unanswered and open for investigation.
Third, our research is based on two years of data. It is possible that our findings might not be generalizable beyond this time frame. In addition, our data set did not enable us to determine whether a toxic comment was made by community members or by outsiders because we did not collect users’ names, nor did we have the names of the members in each game community. Thus, we cannot evaluate whether toxic comments made by members of the group have greater impact than those made by outsiders. Likewise, we cannot identify whether toxic comments created by users generate more interest or discussion than those created by outsiders. Furthermore, unfortunately, our data set does not have information on whether a post is free or paid. Therefore, we cannot investigate the impact of paid posts. Additionally, we cannot explore whether certain content dimensions or topics would lead to higher (lower) UGC and product usage when combined with paid (or free) posts. This interesting and managerially relevant question should be investigated in future research. Finally, our data set did not enable us to identify whether a given comment was made in response to a post made by a company or a comment made by another user. Therefore, we are unable to test whether toxicity's impact on average playtime is different when it targets the game or when it targets other users. We invite future research to investigate this interesting question.
Another important limitation is that the results might be dependent on the number of followers of each game. We could not conclusively explore this possibility because of important methodological limitations. First, unsurprisingly, the number of observations differs according to the number of followers. For games with small community sizes, the number of posts and the number of comments are smaller, making comparisons by size difficult. Second, we also lose important control variables when we segment via community size. For example, action and adventure games are considerably more popular than other game genres. Therefore, comparisons between community sizes inadvertently become comparisons between game genres. Likewise, games with smaller communities are often not present on more than one social media platform, which would make our findings a comparison between platforms and create difficulties in generalizing the results. In short, because of these limitations, we were unable to reliably explore the role of the number of followers, which prior research has indicated plays an important role (Nepomuceno, Visconti, and Cenesizoglu 2020).
One could argue that the content dimensions used in this research are idiosyncratic to the gaming industry. Certainly, the typologies of content dimensions were developed in the gaming and music industries (Nepomuceno, Visconti, and Cenesizoglu 2020). But there is evidence that the content dimensions (quality, social, selling, and structural) are applicable beyond the gaming industry. Nonetheless, the subdimensions of content are indeed adapted to reflect how each type of content is expressed in each industry. Because quality is expressed differently in the gaming industry from how it is expressed in the music industry, the subdimensions have to be adapted. This adaptation is in fact a strength of this typology, making it more tailored to an industry's reality. Future research would profit by adapting these four content dimensions beyond the current two industries already tested.
Of note, our results shed some light on a recent scandal involving Facebook and Instagram (two of the platforms considered in this research). Frances Haugen, a former Facebook employee turned whistleblower, declared in an interview with CBS News that Facebook is “optimizing for content that gets engagement, or reaction. But its own research is showing that content that is hateful, that is divisive, that is polarizing, it's easier to inspire people to anger than it is to other emotions” (Pelley 2021). Interestingly, our results provide support for this assertion, as average toxicity is positively associated with number of comments. However, it remains to be seen whether this positive association is embedded within Facebook's and Instagram's algorithms, which would expose negative content to a greater number of users, thus increasing the number of comments.
The interesting results with toxic comments call for more research on this topic. Is the positive impact of trolling behavior on average playtime particular to the gaming industry? What are the psychological underpinnings that might motivate higher product usage? And under what conditions would the negative impact of toxic comments lead to a reduction in product usage? Research findings would benefit from further exploration of the impact of toxic comments on consumers.
Footnotes
Editor
Sonja Gensler
Declaration of Conflicting Interests
The author(s) declared no potential conflicts of interest with respect to the research, authorship, and/or publication of this article.
Funding
The author(s) disclosed receipt of the following financial support for the research, authorship, and/or publication of this article: The studies were supported with funding given to Marcelo Vinhal Nepomuceno by IVADO (Institut de Valorisation des Données).
References
Supplementary Material
Please find the following supplemental material available below.
For Open Access articles published under a Creative Commons License, all supplemental material carries the same license as the article it is associated with.
For non-Open Access articles published, all supplemental material carries a non-exclusive license, and permission requests for re-use of supplemental material or any part of supplemental material shall be sent directly to the copyright owner as specified in the copyright notice associated with the article.