
Abstract
This article highlights how social media data and language analysis can help managers understand brand positioning and brand competitive spaces to enable them to make various strategic and tactical decisions about brands. The authors use the output of topic models at the brand level to evaluate similarities between brands and to identify potential cobrand partners. In addition to using average topic probabilities to assess brands’ relationships to each other, they incorporate a differential language analysis framework, which implements scientific inference with multi-test-corrected hypothesis testing, to evaluate positive and negative topic correlates of brand names. The authors highlight the various applications of these approaches in decision making for brand management, including the assessment of brand positioning and future cobranding partnerships, design of marketing communication, identification of new product introductions, and identification of potential negative brand associations that can pose a threat to a brand's image. Moreover, they introduce a new metric, “temporal topic variability,” that can serve as an early warning of future changes in consumer preference. The authors evaluate social media analytic contributions against offline survey data. They demonstrate their approach with a sample of 193 brands, representing a broad set of categories, and discuss its implications.
Keywords
With the advent of digital marketing and social media, brand management has undergone a dramatic shift. The growth and proliferation of large social media platforms such as Facebook, Twitter, and Instagram have ushered in an era in which dynamic and real-time conversations are taking place among consumers on a massive scale. Brands have become a part of consumers’ everyday conversations on social media to a greater or lesser extent and can be the key to understanding the relevance of brand names in consumers’ lives. By examining the extent to which brands are embedded in daily topics of conversations, marketers can determine how brands are positioned relative to each other and use this as a basis to understand changes in brand positioning over time.
Prior research has examined how to extract brand evaluations in different dimensions from reviews posted on social media (e.g., Netzer et al. 2012; Tirunillai and Tellis 2014). The current research builds on recent works in marketing that evaluate brand perceptions from user-generated content (UGC) (e.g., Culotta and Cutler 2016; Lee and Bradlow 2011; Nam, Joshi, and Kannan 2017; Nam and Kannan 2014; Netzer et al. 2012; Tirunillai and Tellis 2012). Prior efforts provide important tools for uncovering associations using methods such as social tagging (Nam and Kannan 2014) and for examining specific adjectives that co-occur with brand names (Netzer et al. 2012). Berger et al. (2020) provide an overview of how text mining can be useful in generating important marketing insights.
Our work is distinct from previous work in three important ways. First, our proposed approach leverages language models and topic modeling to help identify brand positioning. We demonstrate that this information about the brand–topic relationship can help construct brand positioning maps. Thus, our study builds on marketing research that identifies brand image and positioning using social media data and unsupervised techniques such as latent Dirichlet allocation (LDA) (Netzer et al. 2012; Tirunillai and Tellis 2014). Second, our approach, which derives topics using social media conversations across a range of categories, can help managers identify similarities among brands both within and across categories. This identification can be helpful in identifying potential partners for a range of strategic decisions, such as cobranding, or for event sponsorships and partnering with brands in other categories for joint advertising initiatives. Third, we introduce a new metric, “temporal topic variability (TTV),” which is defined as the shift in topic occurrences of key topics over time as it pertains to a given brand. We argue that this metric can help accurately “predict” brand preference shifts that occur in the future.
By highlighting the various applications of the language analysis approach from the perspective of identifying competitors, mapping positioning, finding potential brand partners, and predicting future shifts in brand preferences, we provide a tool that managers can use to help manage their brands. The proposed framework presents various advantages over traditional survey-based approaches to assessing a brand's positioning and image, which are inconvenient, costly, time-consuming, and subject to various response biases. More important, questionnaire-based surveys have a rigid structure, as they pose predetermined questions and lack the ability to uncover new associations/attributes. An alternative to survey-based approaches is the use of qualitative techniques—such as Kelly’s (1955) repertory grid, pairwise similarity judgments for perceptual mapping (Hauser and Koppelman 1979), and laddering (Reynolds and Gutman 1988)—to gain insights into key aspects of a brand’s positioning. However, these methods impose various constraints (e.g., cumbersome data collection steps) and are also limited to small sets of respondents. The language analysis approach can be implemented by accessing widely available, vast, and relatively inexpensive social media data. Because social media posts are voluntary and continuous in nature, our approach also overcomes the limitations associated with recall bias and demand effects that typically plague survey approaches.
We highlight the various applications stemming from this approach using an empirical analysis of Twitter data, which consists of a random sample of 134,953 messages (drawn from a larger data set of 1.2 million tweets that reference 193 brands). The brands featured in these conversations come from a range of categories, including electronics, soft drinks, cars, and clothing. We explain our rationale for choosing this sample subsequently, though the methodology can accommodate larger data sets as well. We next provide an overview of prior research and the proposed framework for deriving a deeper understanding of brand image and its associated dimensions.
Review of Prior Research on Text Mining and Language Models
Research in computer science has long focused on text-mining approaches involving extracting meaningful information from unstructured data (Akiva et al. 2008; Blei, Ng, and Jordan 2003; Dave, Lawrence, and Pennock 2003; Feldman and Sanger 2007; Feldman Barrett and Russell 1998; Glance et al. 2005; Puranam, Narayan, and Kadiyali 2017; Schwartz et al. 2013a, b). Methods have ranged from closed-vocabulary approaches, such as Linguistic Inquiry and Word Count (Chung and Pennebaker 2007), to open-vocabulary approaches (Schwartz et al. 2013).
The increased availability of large quantities of user-generated data from digital and online channels has spurred considerable interest in applying text-mining methods to generate insights relevant to marketing. During the last few years, the research stream using text mining has evolved from uncovering data on product attributes (e.g., Archak, Ghose, and Ipeirotis 2011; Lee and Bradlow 2011) to predicting stock market performance. For example, Tirunillai and Tellis (2012) investigate whether UGC can predict stock market performance, using aggregate content derived from multiple websites. They find that the volume of chatter is a good predictor of abnormal returns, with an asymmetric influence on negative (vs. positive) UGC. Rust et al. (2021) propose that social media data can be used for reputation tracking.
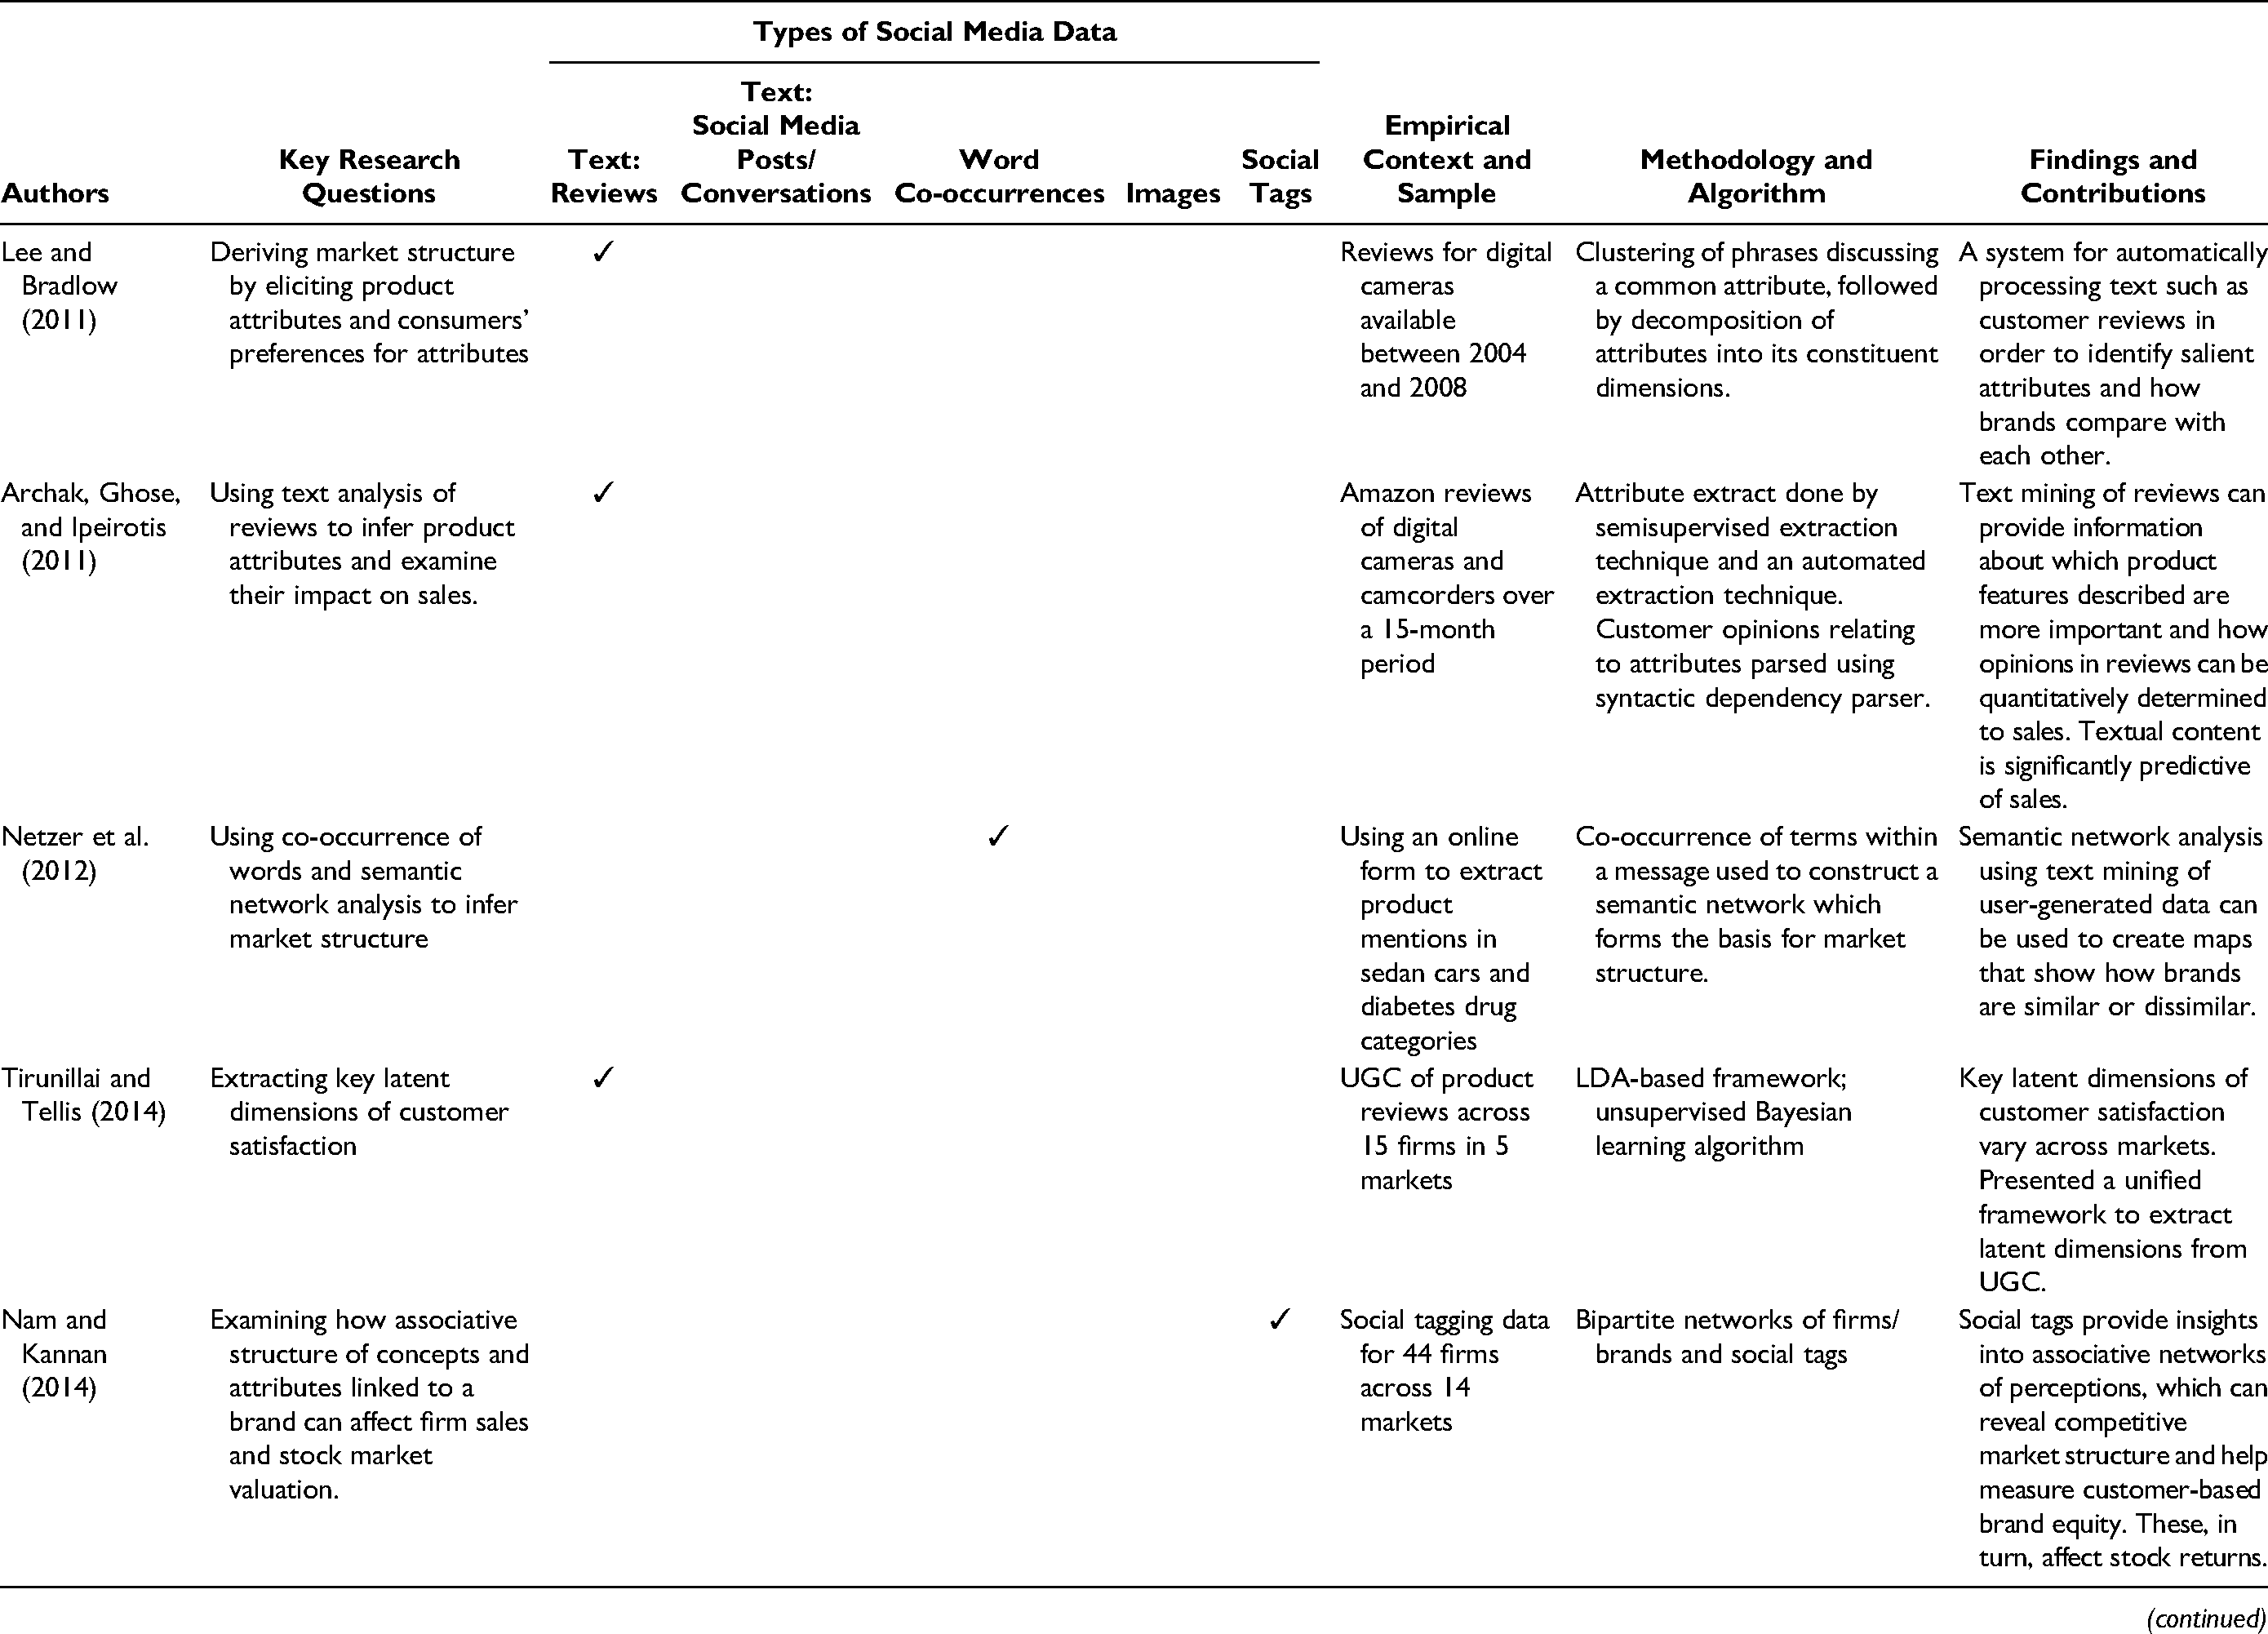
Subsequently, research in marketing evolved to focus more on extracting meaning from co-occurrences of words or social tags, in an effort to infer market structure and gain insights into brand positioning. Table 1 provides an overview of the research in marketing that uses text mining of social media and highlights key findings. For example, Netzer et al. (2012) use data from an online discussion forum and subject it to text-mining algorithms to build associative interbrand networks. They show how firms can employ this method to infer market structure. Tirunillai and Tellis (2014) evaluate product reviews from 15 firms over a four-year period to generate key inferences about consumer satisfaction and quality and its underlying dimensions. Nam and Kannan (2014) use user-generated social tags as proxies for diverse concepts and associations connected with a given brand and help predict unanticipated stock returns (see also Nam, Joshi, and Kannan 2017). Culotta and Cutler (2016) infer critical brand attributes relevant to a brand's positioning by examining a brand's social connections (i.e., cofollowers of the brand's followers on Twitter).
Studies Using Text and Visual Mining of UGC to Infer Brand Perceptions and Positioning.
Furthermore, text-mining research has examined novel strategies derived from topic models and addressed important substantive questions. Büschken and Allenby (2016) propose a model in which topics are constrained not to change within a sentence and show that this restriction led to more interpretable topic word probabilities in customer review data. Borah and Tellis (2016) examine whether online chatter about one brand in social media spill over to affect other brands, particularly when the brands share similar associations (e.g., country of origin). Cho, Fu, and Wu (2017) use topic modeling to model patterns of topics in the research literature and link them to coauthorship communities. Hu et al. (2019) examine how to infer a brand's personality from social media data on the basis of users’ imagery, official announcements, and the internal organizational culture of the brand's workplace.
We apply these approaches of mining unstructured data by employing open vocabulary to derive topics (i.e., groups of similar words) directly from social media messages. Our framework proposes ways of linking brands and topics and identifies applications of the proposed methodology to address key issues facing marketers. We introduce the concept of TTV to offer guidance to brand managers on how to predict future shifts in brand preferences and usage. These applications highlight novel use cases of language analysis for brand management decision making, and we use case studies from our data analysis to derive findings and insights to showcase these applications. In the next section, we provide a detailed overview of the approach and then outline the various applications.
Methodology
We base our approach of identifying topics of conversation on the topic modeling approach using LDA, a generative probabilistic model that allows clustering words into groups (namely, “topics”) on the basis of other words to which they relate. This results in groups that tend to have similar or related meanings. More specifically, according to LDA, each document contains a mixture of a small set of topics, and each word (observed) within the document is attributable to one of the (unobserved) topics. The topics underlying these words are latent dimensions. With this model, the researcher can infer topics (words along with their probability of being in a given topic) on the basis of statistical distributions of words across documents. The words in a topic are topic definitions—namely, the model posteriors that indicate the probability of a topic given a word p(topic|word).
Beyond topic modeling, our interest is in examining how different topics correlate with different brands, and we use two approaches to construct these relationships. We determine this by assessing the average topic probabilities (averaged at the brand level). We propose various applications stemming from this first approach. The second approach to assessing brand–topic relationships involves a significance testing framework, which identifies the significance associated with positively and negatively correlated topics for each brand. We use the term “differential language analysis” to refer to this second approach. A typical application of differential language analysis is the correlation of language usage in UGC with known characteristics of the people posting, such as age, gender, or personality, with the ultimate goal of predicting these on the basis of language characteristics. For example, leveraging distinctive words, phrases, and topics, computational linguists can predict gender, age, personality, emotion, sentiment, and flirting (Holmes 1994; Jurafsky, Ranganath, and McFarland 2009; Mihalcea 2006; Pang, Lee, and Vaithyanathan 2002; Schwartz et al. 2013a, b). Monroe, Colaresi, and Quinn (2008) examine how political conflicts can be understood by examining language used by Republicans and Democrats. In the present context, we use differential language analysis to identify the topics that most distinguish brands/brand characteristics; this in turn forms the basis for identifying a set of topics that is uniquely related to each brand.
The framework used here can be described in distinct stages, namely (1) preprocessing and tokenization of the data, (2) generating and extracting topics using LDA, and (3) linking topics and brands using both average topic probabilities and significance tests using logistic regressions. We briefly outline each of these stages next, as it pertains to our empirical data analysis. Figure 1 provides a graphical summary of the key steps in this approach.
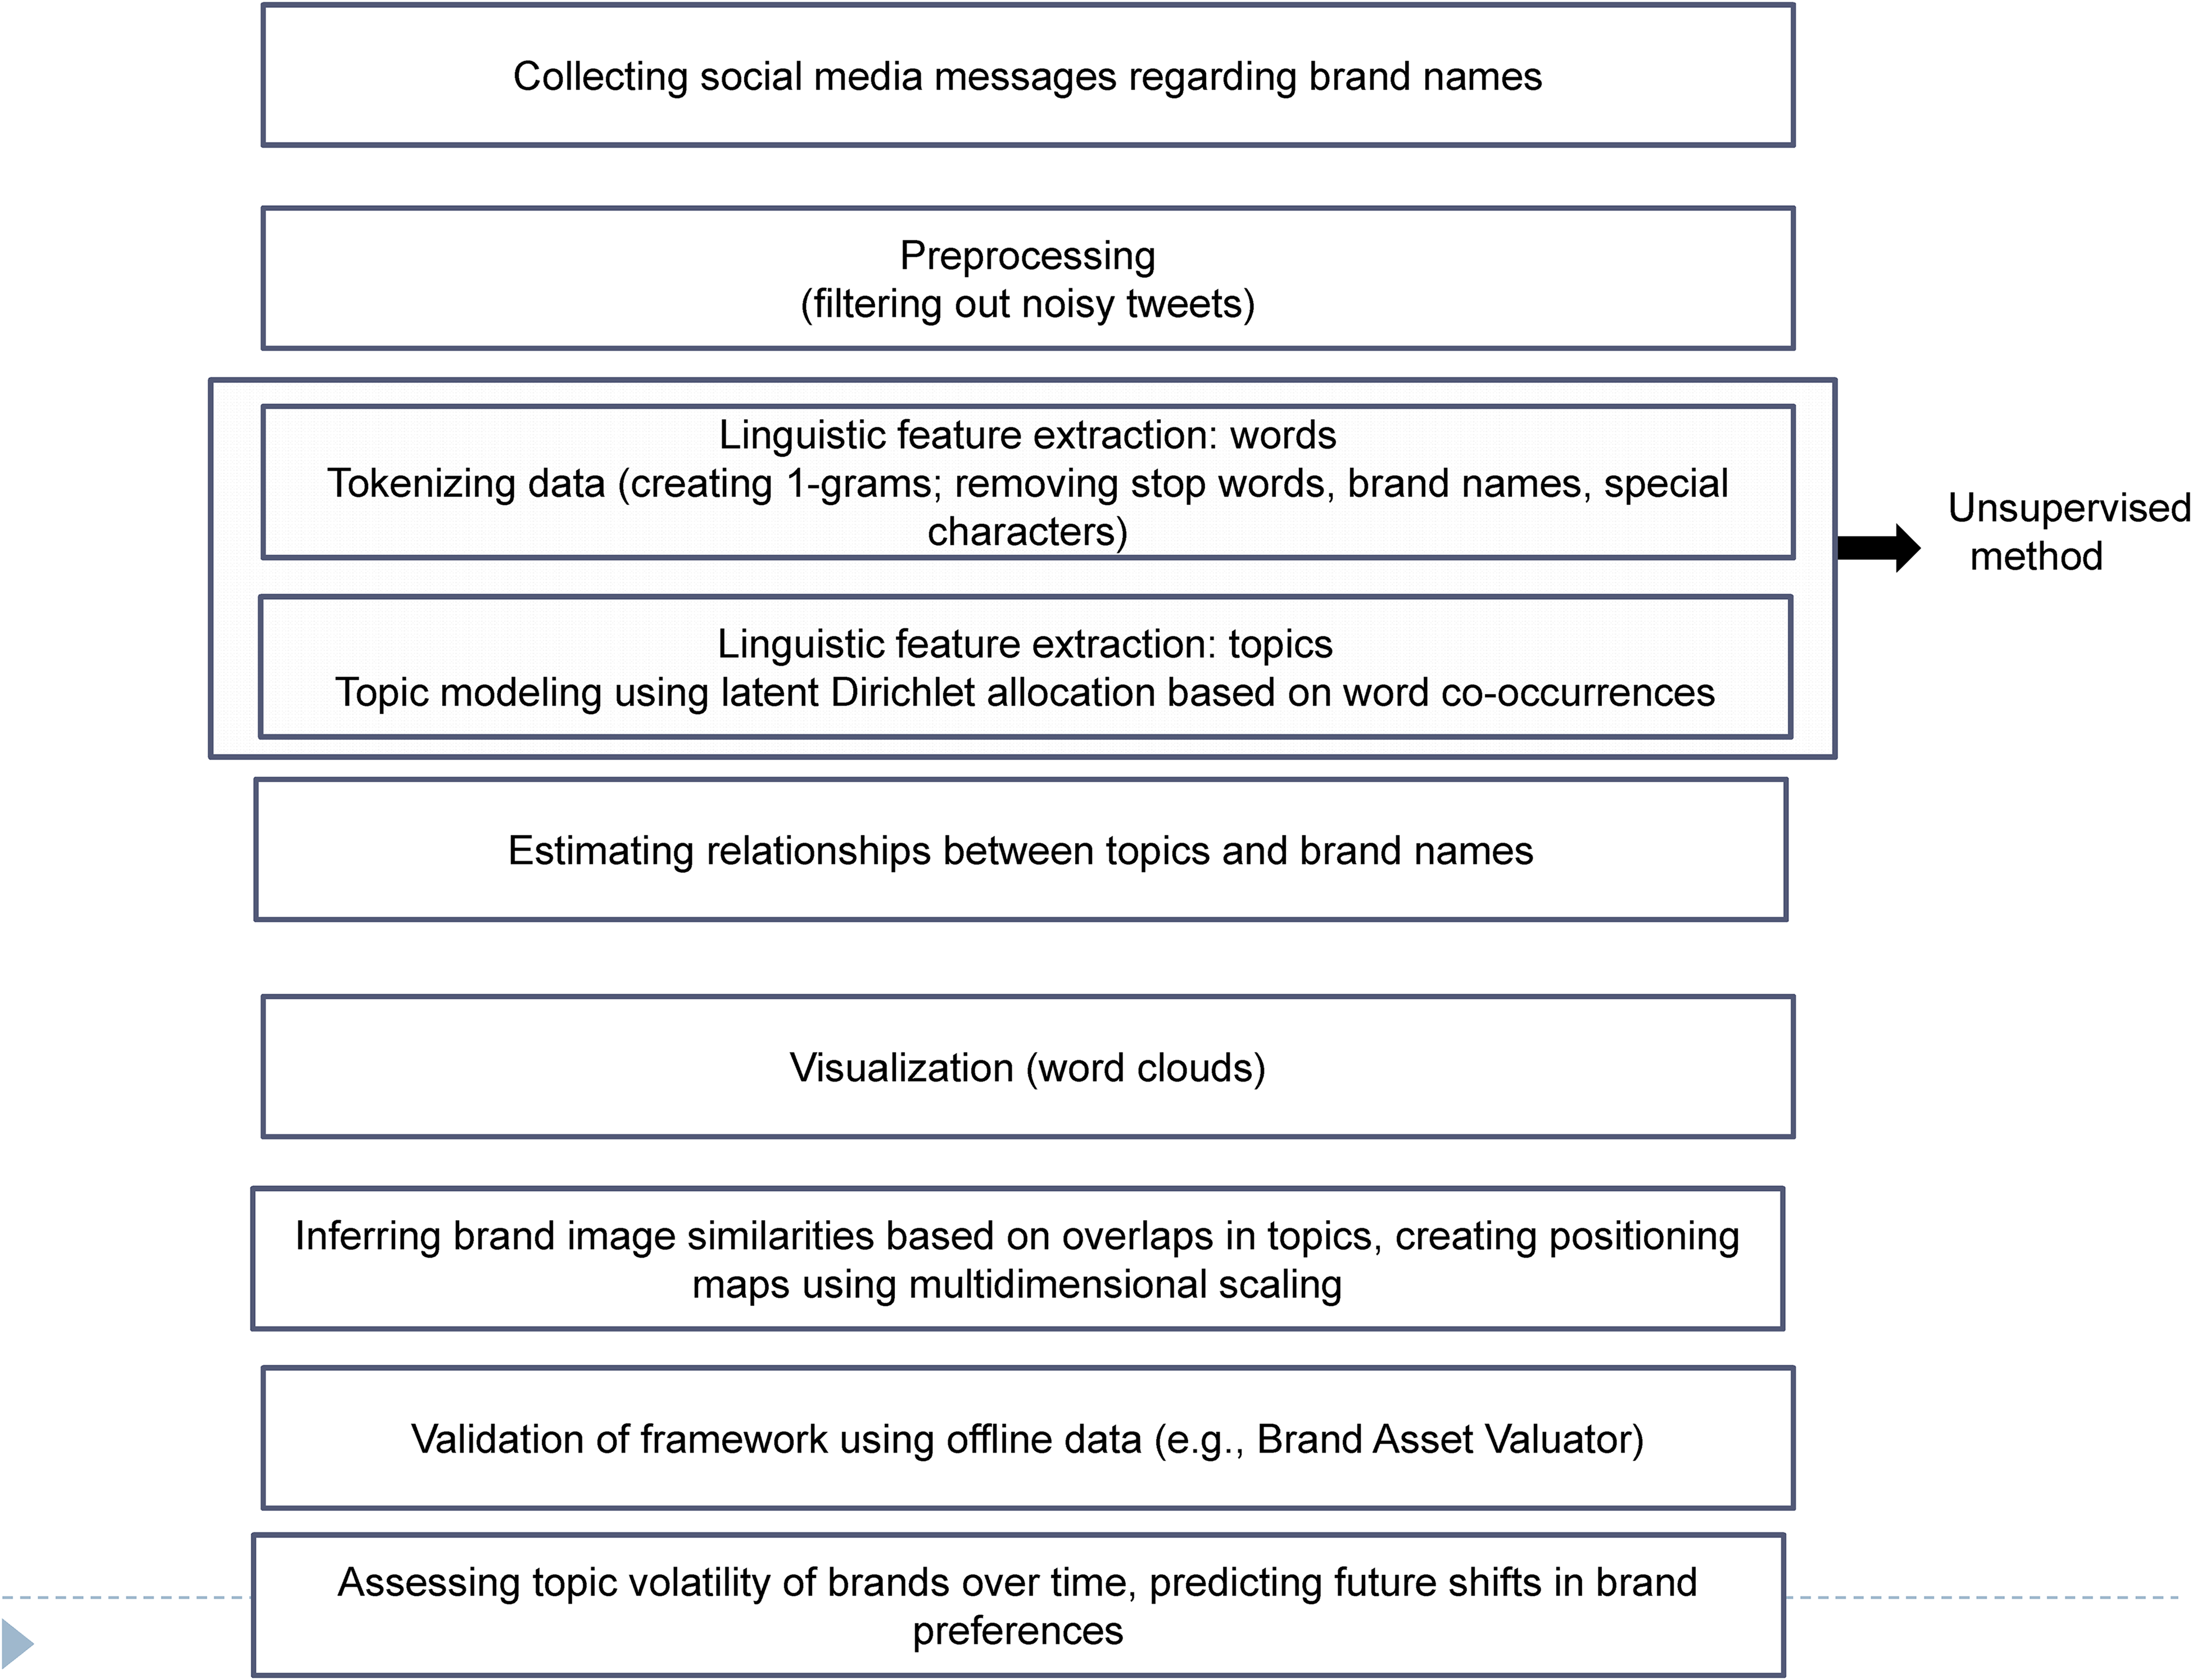
Overview of framework for mapping online brand image using differential language analysis of social media conversations.
Preprocessing and Tokenization
Preprocessing is a key step before topic modeling. Typically, this involves extracting words or phrases (one- to three-word sequences more likely to occur together than by chance). In our case, given that we examined Twitter data (restricted to 140 characters per message), we elected to focus primarily on 1-grams (single words) rather than phrases. We used Schwartz et al.’s (2017) social media tokenizer, which appropriately handles extra-linguistic social media content such as hashtags, emoticons, and “at-mentions” of other users.
In the second step, we calculate each brand's use of a topic, or the probability of a topic's usage at the brand level. We follow Griffiths and Steyver (2004), who use a generative model and envision each document as produced by choosing a distribution over topics. Alternatively, they view each document as having a latent structure consisting of a set of topics and use LDA to uncover the topics within each document (Equations 5 and 7 of Griffiths and Steyvers highlight the use of LDA to uncover topics within documents).
In our setting, each message (which is an individual message pertaining to a brand) can be viewed as a mixture of topics. We derive the average topic probability for each message pertaining to a brand, and the average of topic probabilities for each message for each brand provides us the average brand–topic probability. To some extent, the conceptual framework for brand–topic relationships is also akin to author–topic models, where brands (instead of authors) are linked to various topics (Rosen-Zvi et al. 2012). 1
We also use a second approach to assess the brand–topic relationships by estimating the significant positive and negative topic correlates of each brand. To do this, we conduct significance testing to identify which topics significantly predict that a message pertains to a given brand through a series of logistic regressions, where the outcome of interest was whether a given message pertained to a particular brand name (vs. not), and used message-topic probability as an independent variable, as summarized next: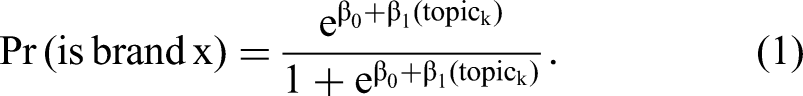
Model Estimation and Findings
The data set contains 134,953 tweets about specific brands (i.e., including a brand's Twitter handle) from a larger corpus of 1.2 million tweets collected over a three-week period beginning mid-February 2015 using Twitter application programming interface. We identified messages that referenced brand names (and explicitly included brand Twitter handles). Our data set of messages referenced 193 brand names in a range of categories. These categories included airlines, banks, beer, health and beauty, beverages, clothing, coffee, computers, consumer/household goods, credit cards, online and brick-and-mortar retailers, entertainment, fast food/restaurants, food, beverage, grocery, hotels, household goods, insurance, shoes, television shows, soft drinks, sports, grocery stores, telecommunications, and travel. 2 An initial frequency analysis of the 1.2 million tweets across brands demonstrated significant differences in the total number of messages. This situation poses a challenge for topic modeling because of the likelihood that the topic model we estimate will be dominated by a few brands with a large volume of tweets. Therefore, we used random samples of 2,000 Tweets per brand, which we then subjected to a series of preprocessing steps described subsequently.
To reduce noise in the data (to ensure that a tweet was actually about a particular brand), we restricted our focus to tweets that listed a defined Twitter handle pertaining to the brand. We also considered an alternative approach that involved searching for tweets containing the brand name itself. However, this process also yielded messages that pertained to commonly used words in the English language for certain brand names (e.g., visa, tide) that were unrelated to the brand name. Identifying the brand-related tweets would involve manually combing through vast numbers of social media messages or spending time separately developing a brand disambiguator. Instead, our approach of using the Twitter handle accurately identified brand-related tweets while minimizing the need for a human coder to comb through the social media posts to remove any unrelated posts. Thus, we believed our approach was justifiable because it is scalable to new or larger data.
Our results are based on brand name handles contained within the tweets, but the topic models excluded the actual brand names and handles themselves, to concentrate on the context in which the brand appeared and not to have the name itself skew the results (i.e., putting all brands on equal footing). After the preprocessing steps, the average sample size per brand was around 700 tweets (SD = 286). We then estimated topic models based on this overall sample (N = 134,953).
Data Processing
Constraints based on number of tweets per user
Twitter bots and trolls can skew results, and identifying which posts originated from legitimate users and which were posted by trolls or bots is difficult. One potential way to pinpoint these bots and trolls is to identify Twitter users who have a high volume of posts within a certain period (Gallagher 2015). As our data set was already constrained to a three-week period, we removed all tweets beyond the tenth tweet in the data set for any given user. Although this removal may not eliminate bots entirely, it significantly minimizes the issue without completely removing legitimate users who post frequently (we compromised between Type 1 and Type 2 errors for identifying bots).
Filtering tweets with special characters or URLs and sponsored tweets
We removed 1-grams, which are characterized by special characters (e.g., %@%), or tweets that included URLs (%http% or %<URL>%). We also removed any sponsored tweets or promotional messages originating from the brand (i.e., messages that indicate that the tweets are sponsored or are ads).
Removing stop words
Stop words are commonly occurring words such as “the,” “is,” “at,” “which,” and “on.” Because our concern was with content rather than style, consistent with standard approaches using LDA, we removed these from the data before extracting topics.
Removing brand names
We removed the actual brand names present in the tweets, as these brand names do not have direct relevance to our assessment of topics. To do this, we searched for all instances of the brand names in tweets identified for the brand and removed these words. The removal of brand names also has an important rationale from an empirical standpoint. Brand names appear excessively frequently in the data and do not fall within the Dirichlet distributions assumed by the LDA model. Because brand names are the criteria for tweet collection, such words are overrepresented in the data and essentially become outliers in the distribution of word counts. To demonstrate this further, we ran the model again including brand names and found that the topics observed were less meaningful. For brevity, we do not present these results, but they are available on request.
Creating a topic file
After filtering out the brand names, we focused on extracting topics from a pooled sample consisting of all brands. To choose the number of topics, we specified the number of topics that LDA can generate. Across multiple topic models based on 25, 50, 100, 200, 250, 500, 1,000, and 2,000 topics, the 100-topic model generated the ideal solution, based on perplexity, coherence scores, and a qualitative assessment of the topics generated.
Model selection using perplexity and coherence
To identify the optimal number of topics that we need to choose, we calculated these scores across a range of models estimated by specifying different numbers of topics (25, 50, 100, 200, 250, 500, 1,000, and 2,000). We calculated the perplexity score using the following formula:
3
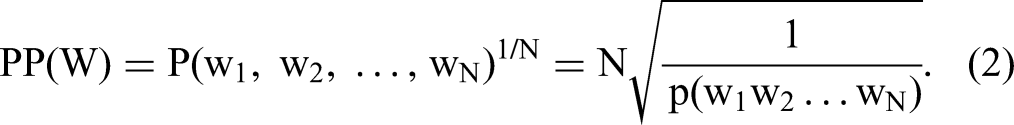
To calculate this, we first estimated a topic model by specifying a number of topics (e.g., 100, 200). We then read all the messages to calculate N (total corpus size or number of messages). From this topic model estimation, we outputted the probabilities associated with each message calculated as log[p(w1,w2,w3)] = log[p(w1) × p(w2) × p(w3)] = log[p(w1)] + log[p(w2)] + log[p(w3)], and so on, until arriving at log p(wN), where N is the number of messages and W1 is the first message.
In general, lower perplexity scores indicate a better model. We provide the perplexity scores across a range of topic models in Figure WA1 of the Web Appendix. As we examine the perplexity scores, across the number of topics, the 200-topic model has the lowest score of 18.0. This is identical to the 250-topic model score (18.0), with the 100-topic model also providing similar, though slightly higher, scores (18.3). Because the 100-topic model is a more parsimonious representation without a significant trade-off in terms of the perplexity calculation, we chose the 100-topic model based on this analysis.
A second metric we examined is the coherence score, or topic coherence, which is based on the semantic coherence of the words. Research has found ways to automatically measure topic coherence with humanlike accuracy using a score based on pointwise mutual information (Mimno et al. 2011; Newman, Bonilla, and Buntine 2011). We calculated the average coherence score of each of the topic models across various numbers of topics (see Web Appendix Figure WA2). We considered two measures of topic coherence: C_v and C_umass. 4 Based on C_umass, the 50-topic model also had the best topic coherence, which was closest to zero (–980.6). This was followed by the 100-topic model (–996.7). Optimizing across the two metrics of perplexity and coherence required us to make some trade-offs. We deemed the 100-topic model as offering the best combination of these two metrics.
Visualizing the data
We used word clouds to visualize the topics. Clusters of words that are semantically related form topics, and each brand is associated with the topics to varying degrees. Within the word cloud, the size corresponds to the prevalence of the word within the topic (i.e., p(word|topic)).
Evaluating brand positioning using topic probabilities
A straightforward approach to assessing the relationships between topics and brands is to use the topic probabilities averaged at the brand level. We conduct a correlation analysis of the various brands using the average topic probability across the 100 topics. 5 We specify these correlations as one approach that managers can use to identify brands that are similar or dissimilar on the basis of social media topics.
Assessing lexical differences across brands using significance testing
One of the goals of our research is to use social media language and topics to predict the presence or absence of brand names in a conversation. After uncovering topics and connecting these topics with brands, we use Schwartz et al.’s (2017) software to conduct regressions of topic use across brands, via significance testing (see Appendix A for details on this step). We then use this analysis of positive and negative topic correlates of a given brand and describe applications for brand management derived from this analysis.
Results
Given our open-vocabulary approach, we present words associated with each of the 100 topic IDs. We do not focus on labeling these topics in this article, though there are approaches available to do so using the incidence of words within a topic (Tirunillai and Tellis 2014). Rather, our focus is on using these topics of conversation as a way to identify brand similarities and differences. However, a few general observations are worth noting regarding the types of topics described:
Positive or negative incidents: Some of the topics identified described a news story or feature, some of which were positive (e.g., topic 17) and others negative (e.g., topic 21). Activities and lifestyles: Topics were also identified by different activities and lifestyles, including music and entertainment (topic 82) and holidays/special occasions (topic 73).
Temporal Topic Variability as a Predictor of Future Shifts in Brand Preference
From the output of the topic models, we introduce temporal topic variability (TTV), which can help accurately “predict” brand preference shifts that occur in the future. TTV is a summary of changes in relationships between specific social media topics and a given brand, and we predict that these can affect future shifts in brand preferences. Thus, we empirically test the likelihood that shifts in topic–brand relationships will have an impact on future changes in brand preference. Note that the topic meanings are kept constant and the changes in relationship between specific topics and brands over time is what constitutes this metric. In other words, we address the following questions: if a brand such as Google observes high variability expressed in social media topics in period t (as measured by changes in topic probabilities associated with a brand from the previous period to the current period), will this result in a greater likelihood of brand preference shifts in period t + 1? Will these shifts be present even after we control for category differences?
To answer these questions, and to identify brand preference shifts, we integrated the social media data with brand outcomes data from Young & Rubicam's Brand Asset Valuator (BAV) survey for a future period (here, “future” refers to the period t + 1 vs. t). Using these brand outcomes as dependent variables, we regressed these against a current-period change in social media topic probabilities (we define the current period subsequently). We controlled for category random effects in our model.
We considered three brand outcomes: brand preferences, net promoter score, and percentage of lapsed users. Brand preferences are measured across the same set of brands in the BAV data, using a survey approach. Specifically, the BAV survey asks respondents to review a brand preference question and to select one of the four response categories regarding each brand (“the one I prefer,” “one of several I’d consider,” “would only consider when no alternative,” or “would never consider”). We viewed those who selected the first two responses as those who prefer the brand, and the percentage of those who indicated preference formed the dependent variable. The net promoter score was based on the percentage of respondents who said that they would recommend the brand to a friend, and lapsed users were the percentage who indicated that they had lapsed in brand usage. If TTV can predict future shifts in these important brand outcomes, this would mean that our proposed approach functions as an early warning system to measure changes in a brand's positioning in the marketplace.
We gathered additional data from Twitter, using the same Twitter handles but going back to the 2011–2015 time frame. We used the same 100-topic solution previously generated and searched for topic terms that we had identified using the analysis described previously. We then examined the probabilities of topics for each brand and each year and calculated the average difference in probabilities for each year relative to the previous year (e.g., 2012 [vs. 2011], 2013 [vs. 2012], 2014 [vs. 2013], 2015 [vs. 2014]) for each of the 100 topics for each brand. We then took the sum of the absolute value of differences in topic probabilities. Our metric of brand–topic associations for brand x across topics k and time t is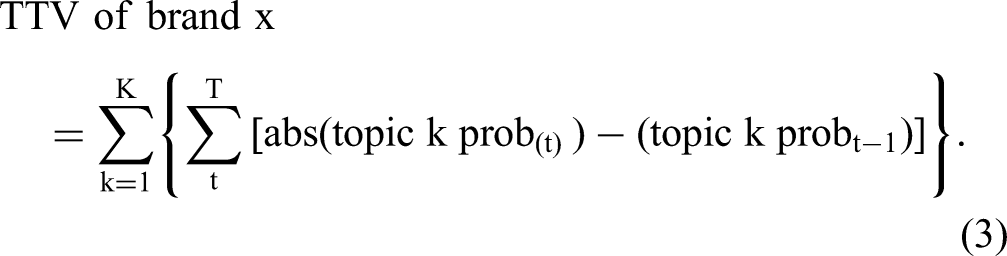

Overall, the results of this analysis using TTV provides further evidence that identifying topics from social media and assessing how their associations with brands shift over time (while keeping the topic meanings the same) can help predict how a brand is likely to be perceived in the future. The results also confirm that the suggested approach to extracting brand image information from social media can be used as a predictive tool to forecast future shifts in key brand metrics such as future brand preferences and percentages of lapsed users. This type of predictive validation is a key step in establishing construct validity (Cronbach and Meehl 1955), in that our metric effectively correlates with other, known approaches to measurement of brand image that are costly and time-consuming. It provides insights into the nature of brand image by identifying topics of conversation that relate to a brand. In addition, the TTV concept provides a novel approach to predicting future shifts in brand image. In the next section, we outline various applications of the differential language analysis of social media topics as they relate to various brands and describe the implications for data-driven brand management decision making.
Applications of the Proposed Approach in Data-Driven Brand Management
Our proposed approach employs the standard approach to mining social media data using topic models and LDA and identifies similarities among brands using both average topic probabilities and significance testing. This approach has various applications to brand management (see Appendix B for a summary of the applications described next).
Uncovering Key Brand Associations/Topics Using Differential Language Analysis
We evaluate the benefits of understanding brand–topic relationships using differential language analysis (see Appendix A for technical details), which can help brand managers identify top positive and negative topic correlates. To illustrate this further, we use the differential language analysis approach and examine the top five most positively and negatively correlated topics for a small sample of brand names. We include the top five positive predictors in Panel A of Table 2 and the top five negative predictor topics in Panel B. We find some notable similarities and differences across competing brands. For example, in Panel A, both Pizza Hut and Papa John's have the same topic appearing as the most highly correlated topic for both brand names. Similarly, in Panel B, Pizza Hut and Papa John's have the same topic appearing as the least correlated topic for both brand names. The same is true of CNN and Fox News. In this way, by examining patterns of positively and negatively correlated topics, a brand can identify primary points of similarity and differentiation with key competitors.
Five Topics Most and Least Likely to Be Mentioned with Brand Names.
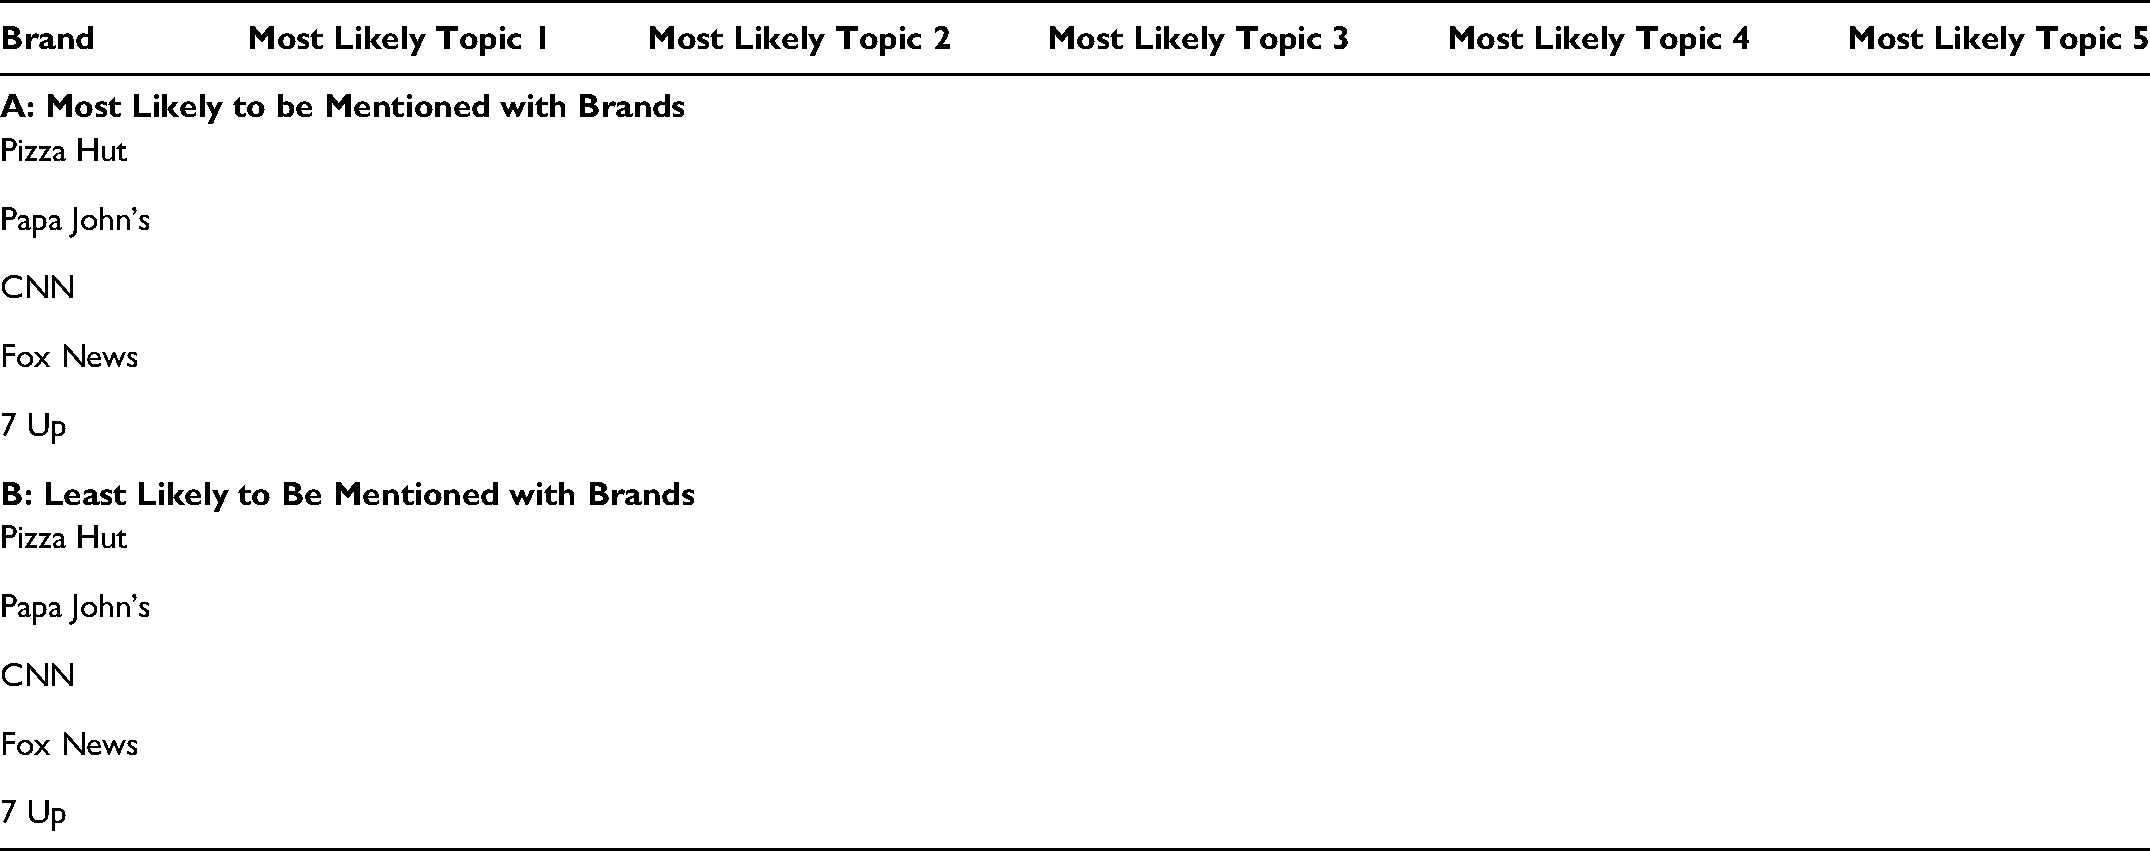
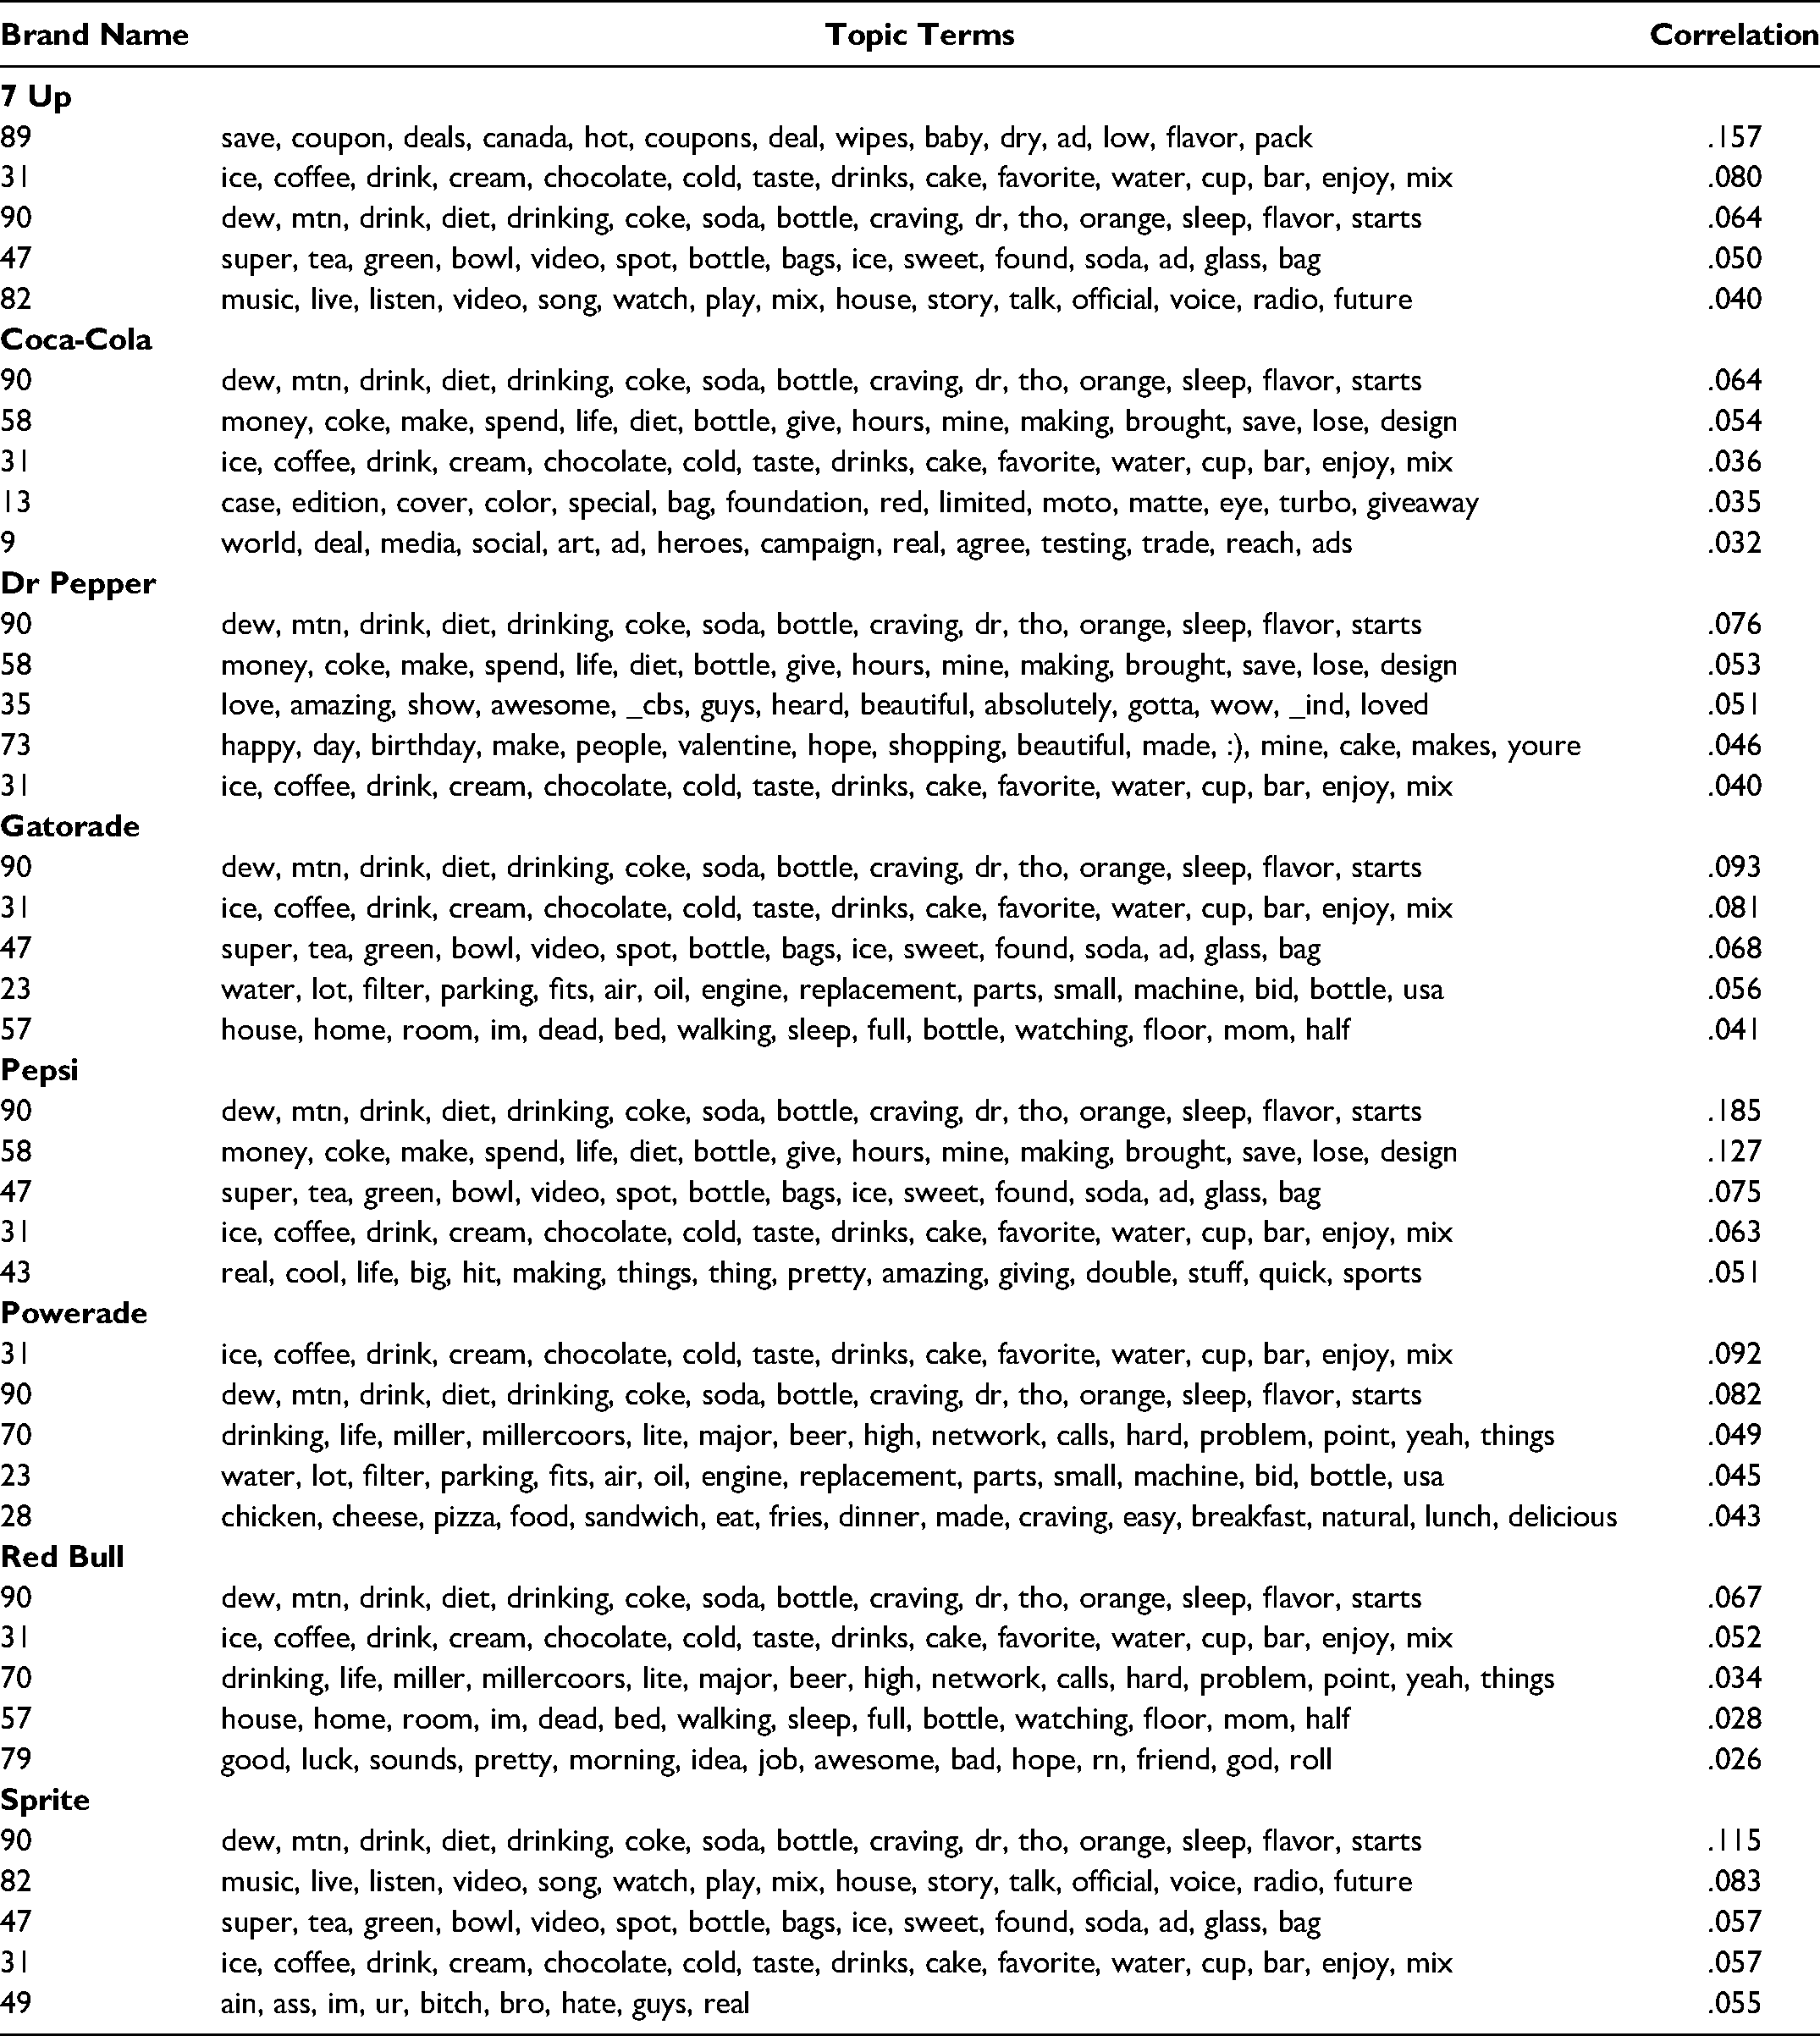
Table 3 provides a list of the top five topics that link to various brands. To further illustrate the use of this information, we highlight how the 7 Up brand's key associations can be identified using topic model outputs and bag-of-words. We show the word clouds for the 7 Up brand in Figure 2. 6 In each of these word clouds, the sizes of the words indicate the frequency of the words within a topic. As Table 3 shows, 7 Up has two topics linked to the brand that may provide some insights into key brand associations. The first (topic 89) has a list of bag-of-words that has to do with savings, deals, and coupons, indicating that 7 Up is a rather promotion-intensive brand. Brand managers can use this insight to determine whether this is a desirable association for the brand. Second, topic 31 lists several related categories, such as ice, chocolate, drink, bar, and enjoy, which may indicate usage-related associations for 7 Up. Perhaps consumers perceive 7 Up as a complement to other drinks and food. This insight into usage-related associations may also be valuable to managers aiming to manage the brand.
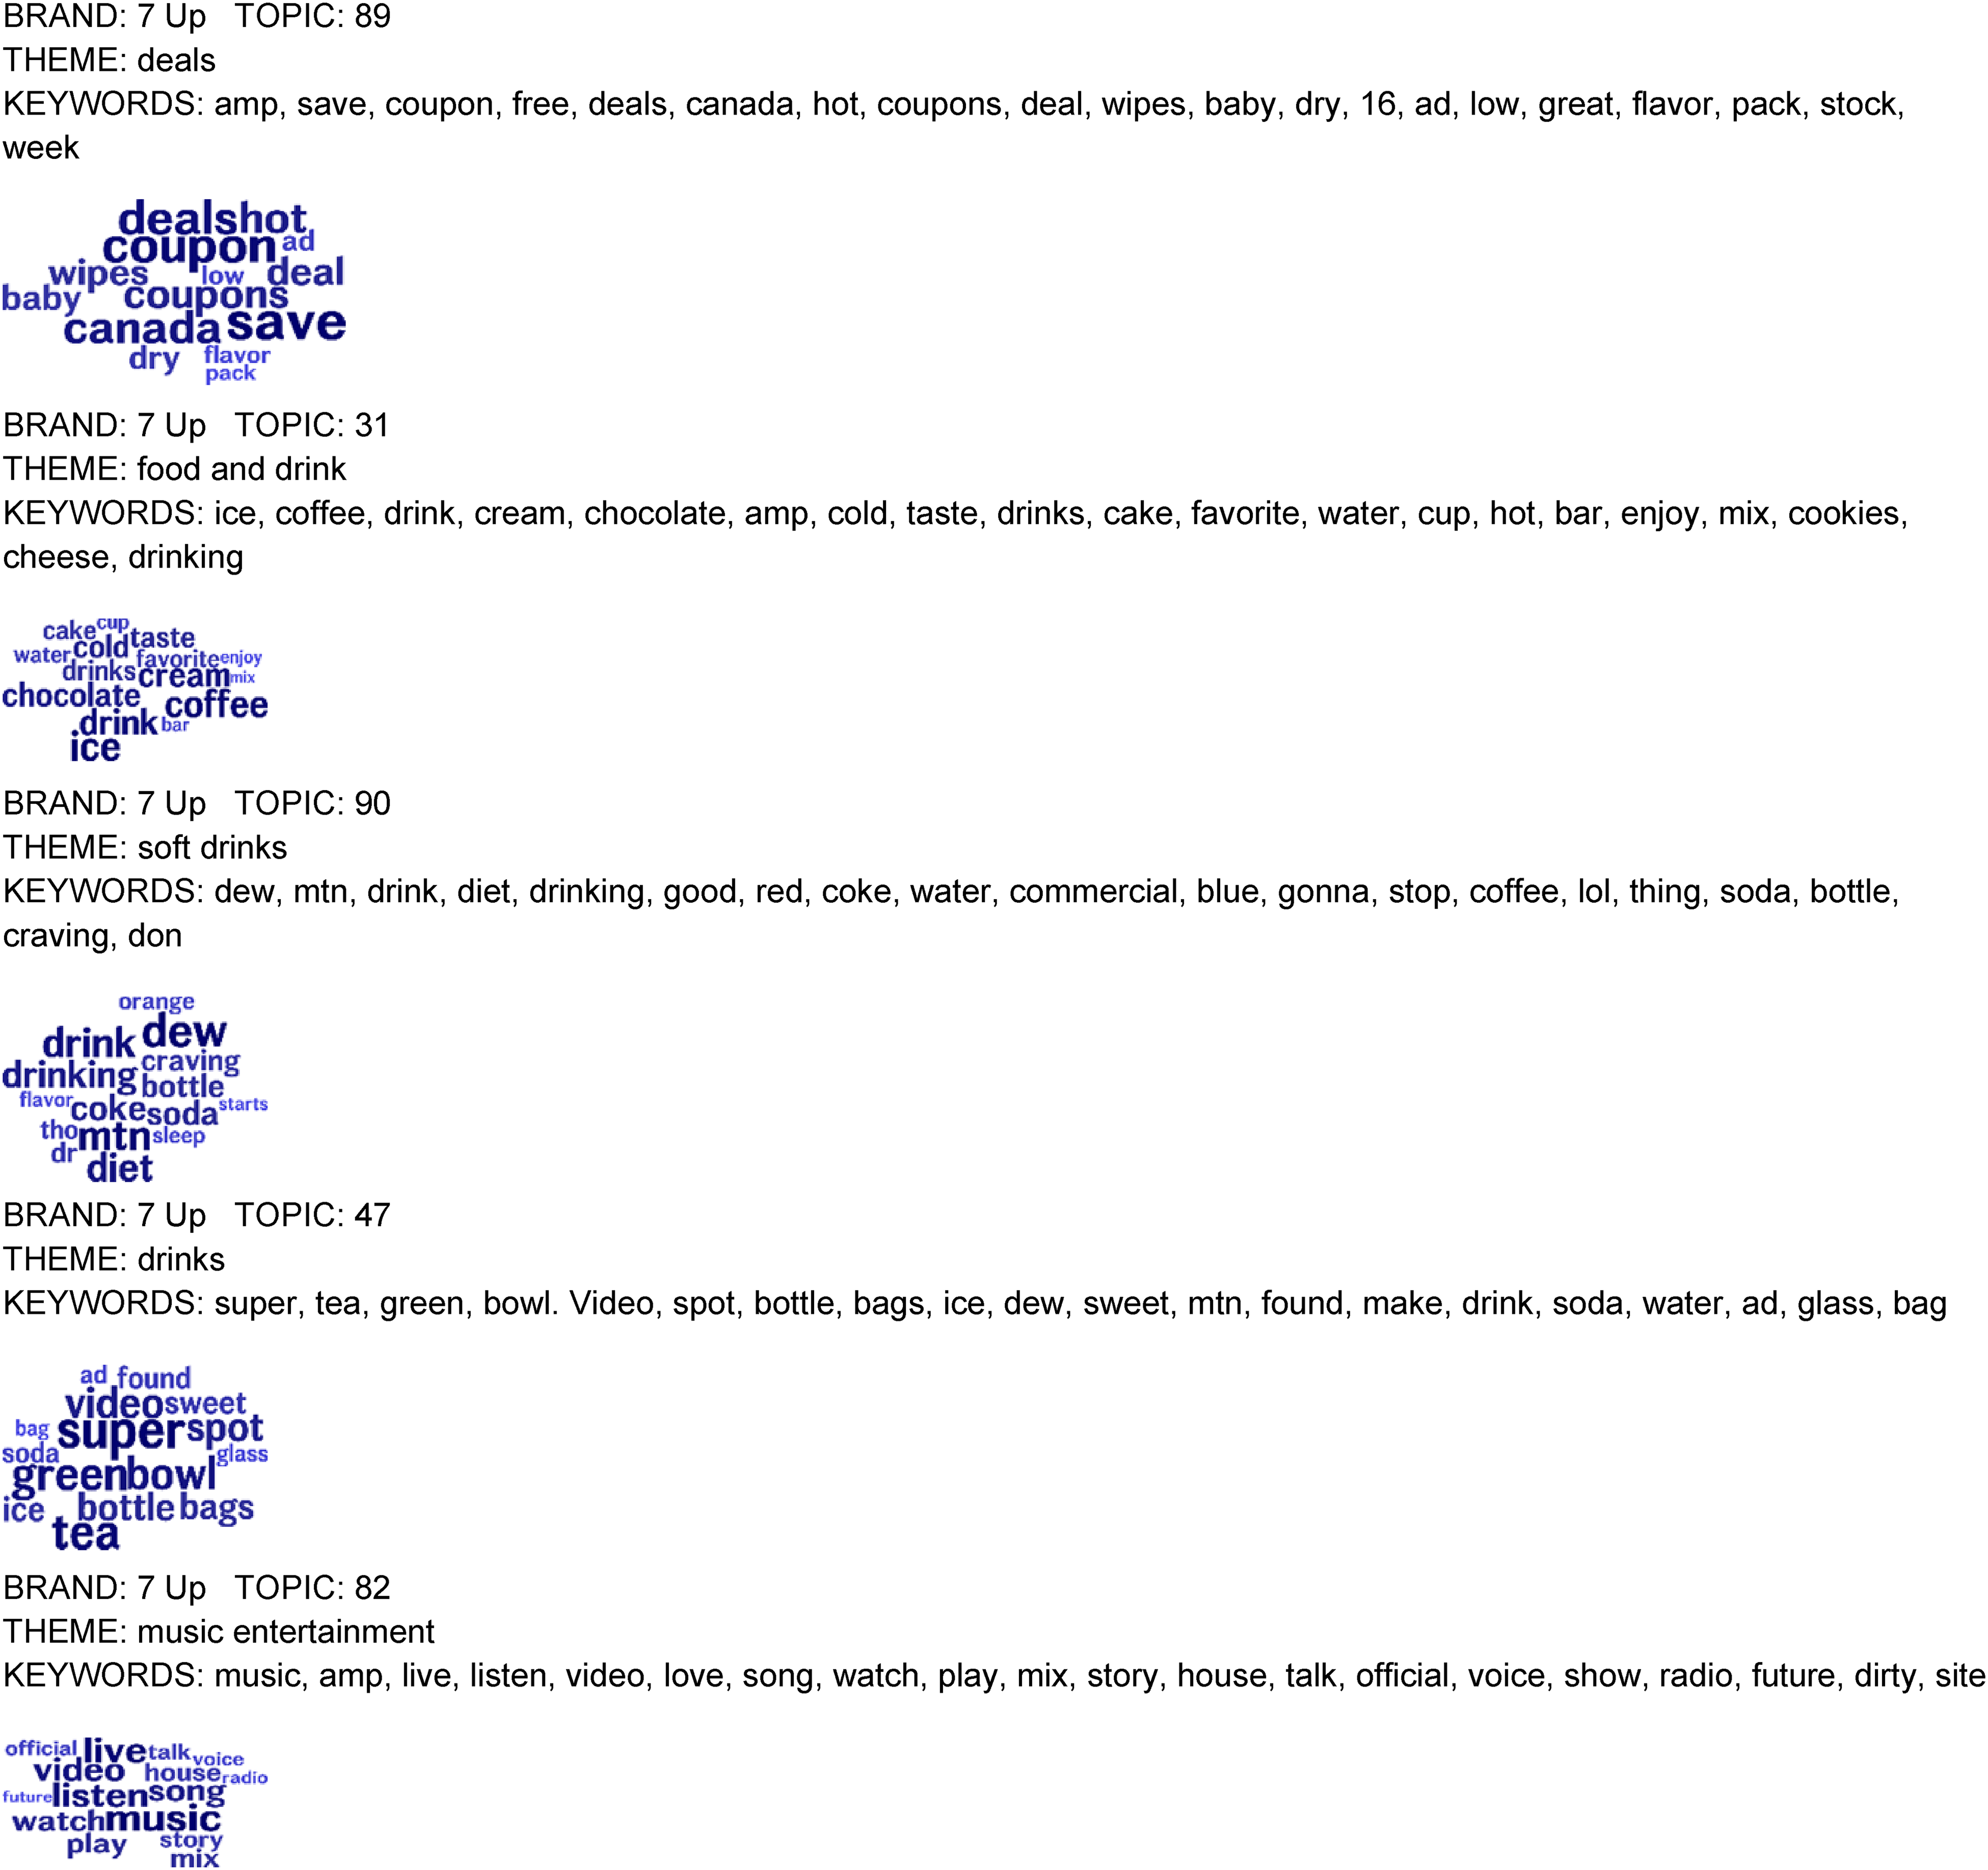
Word clouds pertaining to top five positive predictors (7 Up example).
Sample Brand Names and Top Topics: Beverage and Energy Drinks.
Brand Safety and Monitoring Negatively Correlated Topics
A related application of the differential language analysis approach is to identify negative topic correlations that are linked to a brand, which could provide important information critical to brand safety. The term “brand safety” has been used to describe everything from ad fraud and viewability to user experience and adjacency or placement in contextually appropriate environments (see Jones 2021). This concept of brand safety requires monitoring and tracking of both positive and negative associations of a brand in online settings. For example, a brand may engage in contextual targeting and end up placing ads next to content that is violent or meant for a more mature audience, both of which could pose risks for a brand's reputation. Marketers who are concerned about potential reputational damage due to these content associations may want to track the negatively correlated words and topics of a brand to ensure that the brand not only has distanced itself from such content but also is actually negatively correlated with such content. Our differential language analysis approach allows for this type of analysis because it identifies significant, negative topic correlations for each brand (in addition to positive topic correlations).
Uncovering Brand Similarities Using Topic Probabilities
One of the key benefits of the topic modeling of brand data is the ability to understand brand similarities based on relationships between topics and brands. Topic similarity between brands in various product categories could become a novel approach to identifying and selecting brand alliance partners, as it allows assessing a brand's cultural relevance and identifies a set of partners that occupy a similar space in the cultural conversations of consumers.
The literature on brand partnerships has identified similarity and fit as key factors influencing brand alliance success. Attitudes toward the alliance are enhanced when a high degree of fit exists. Prior research has focused on the importance of fit based on attribute fit, product category, or brand image (Rao, Qu, and Ruekert 1999). We next discuss an approach for identifying similar brands using the output of LDA that relies on average topic probabilities.
The bag-of-words model is a representation of the topic model that highlights key associations for each topic that is linked to a brand. The mean topic probabilities associated with each brand (average across all messages pertaining to a brand) can be used directly to examine which topics are linked to which brands. Using the approach of averaging topic correlations at the brand level, we constructed a correlation matrix of various brands across different categories such as cars, restaurants, and beverages (Table 4, Panels A–C). Table 5 provides a summary of the across-category correlations for a set of beverage brands. Figure 3 presents the same information as a two-dimensional positioning map for the car industry. 7
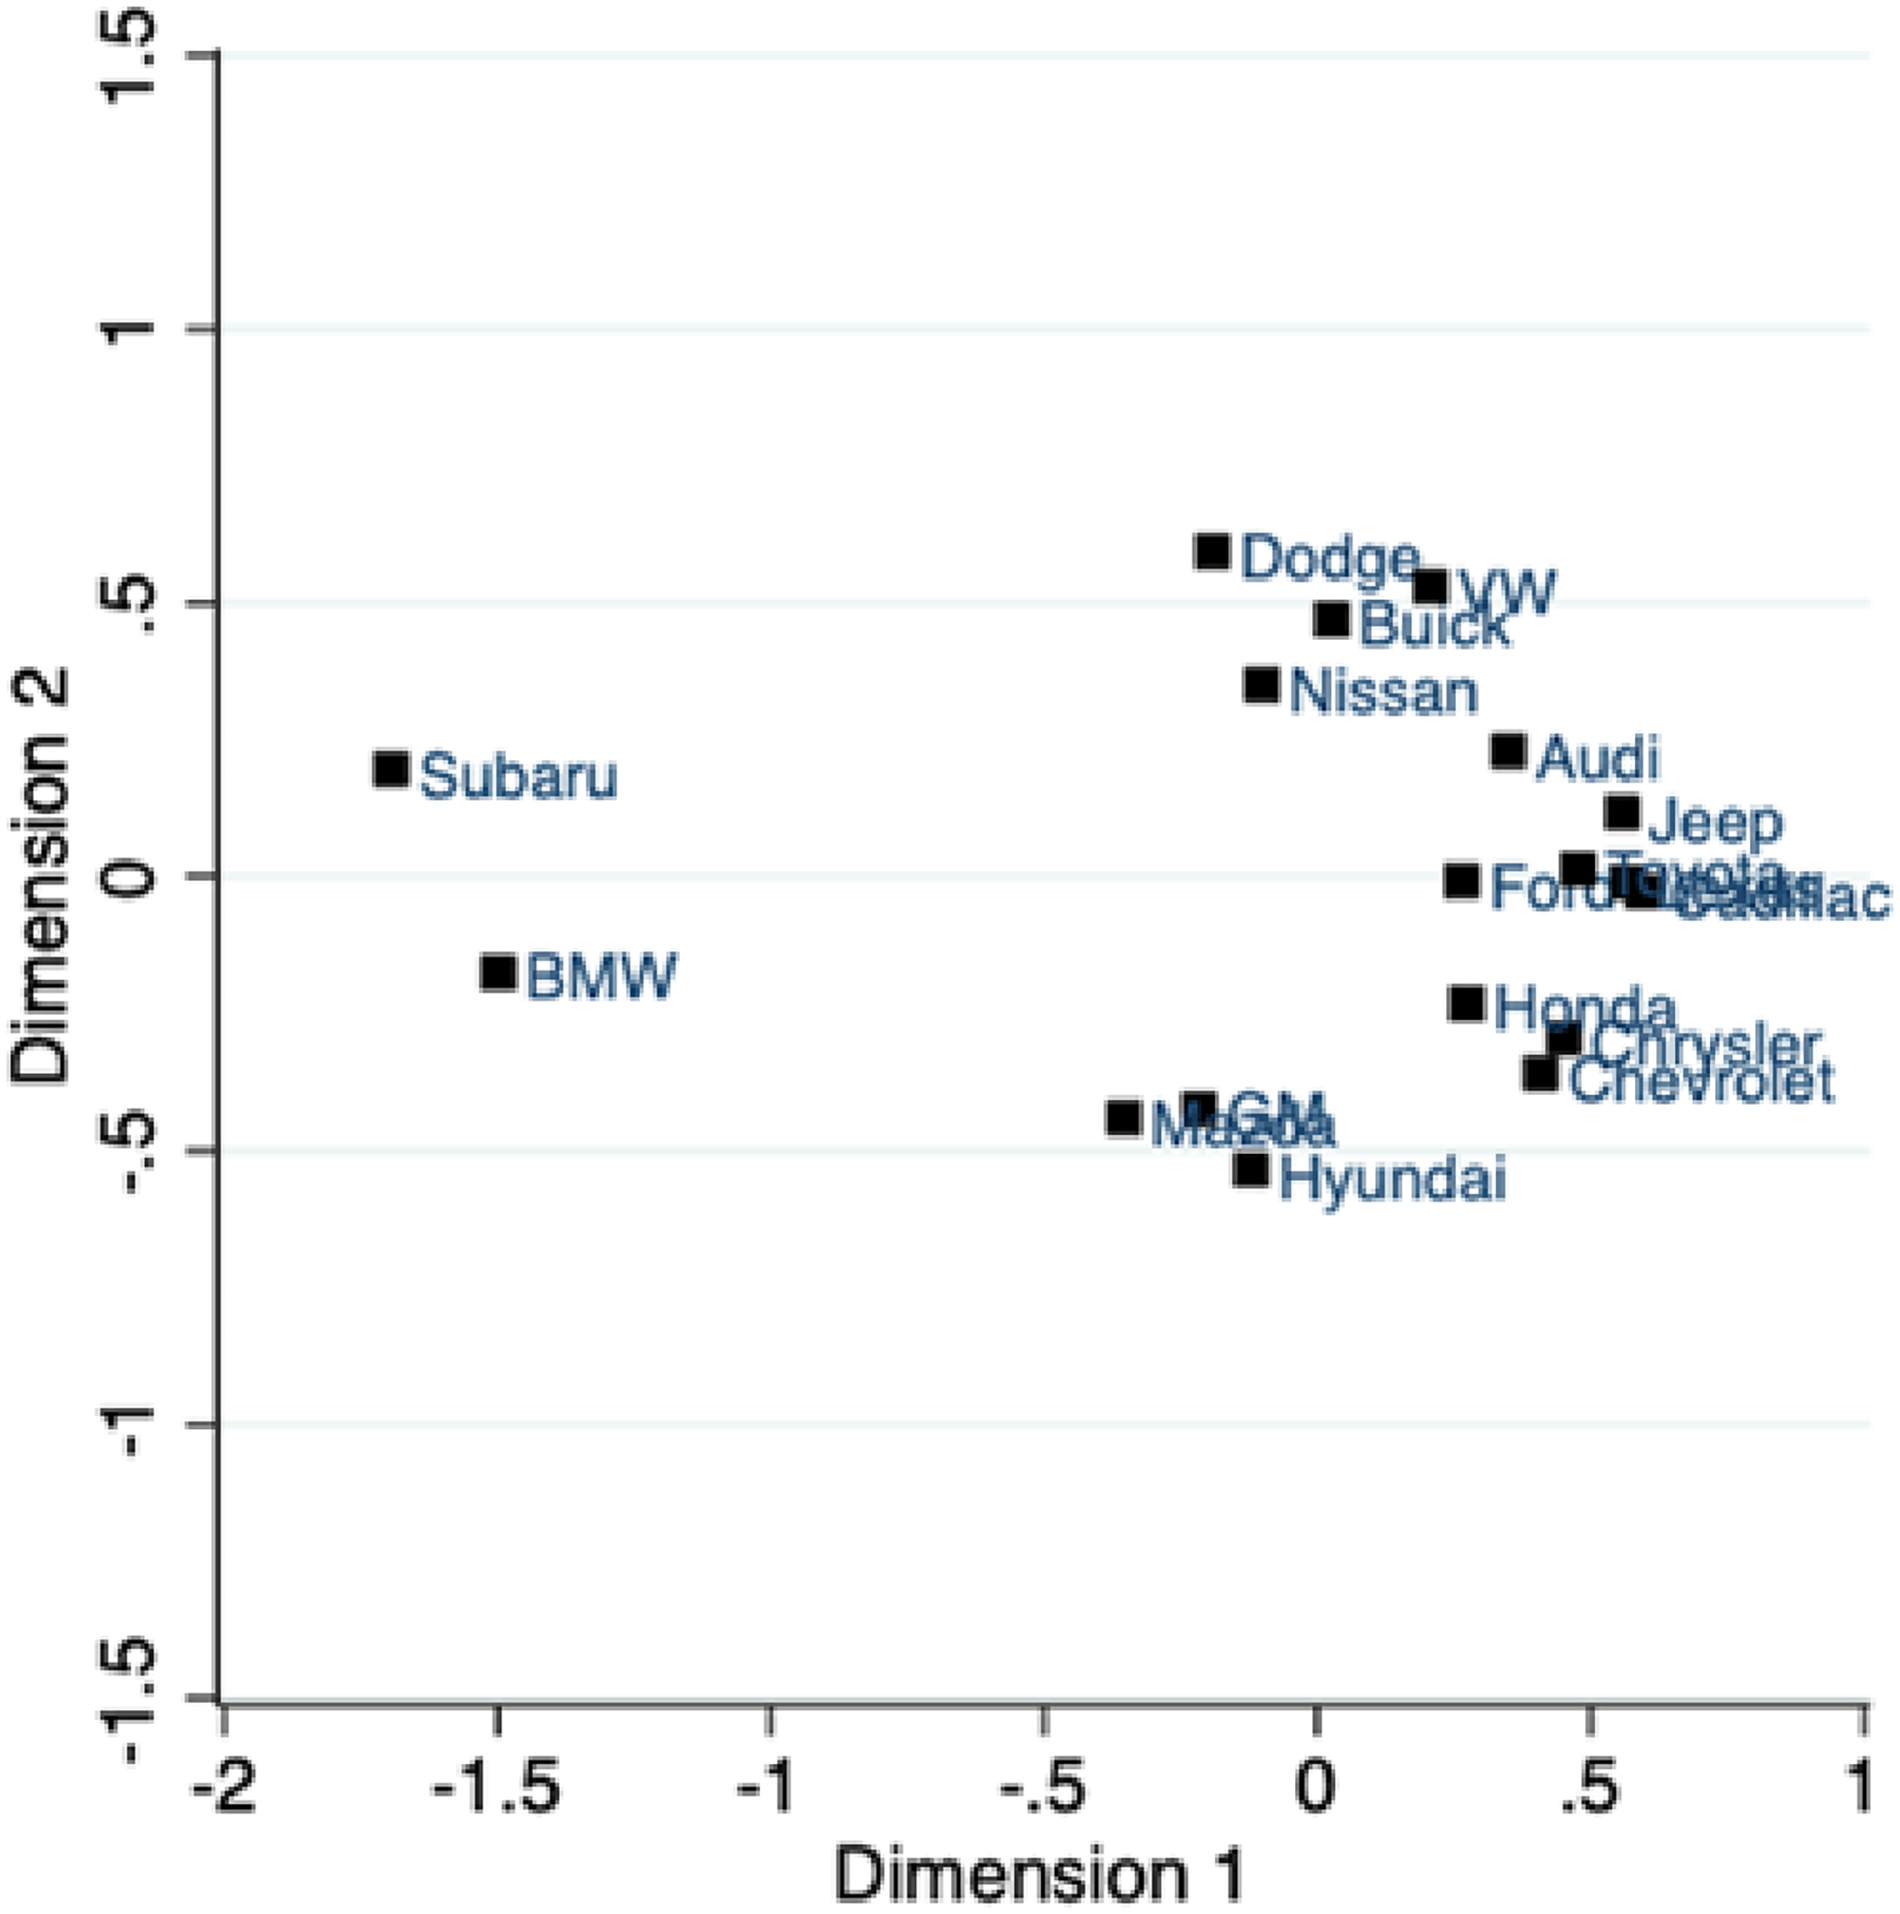
Brand positioning map based on topic modeling.
Correlations Among Brands Based on Average Topic Probabilities.
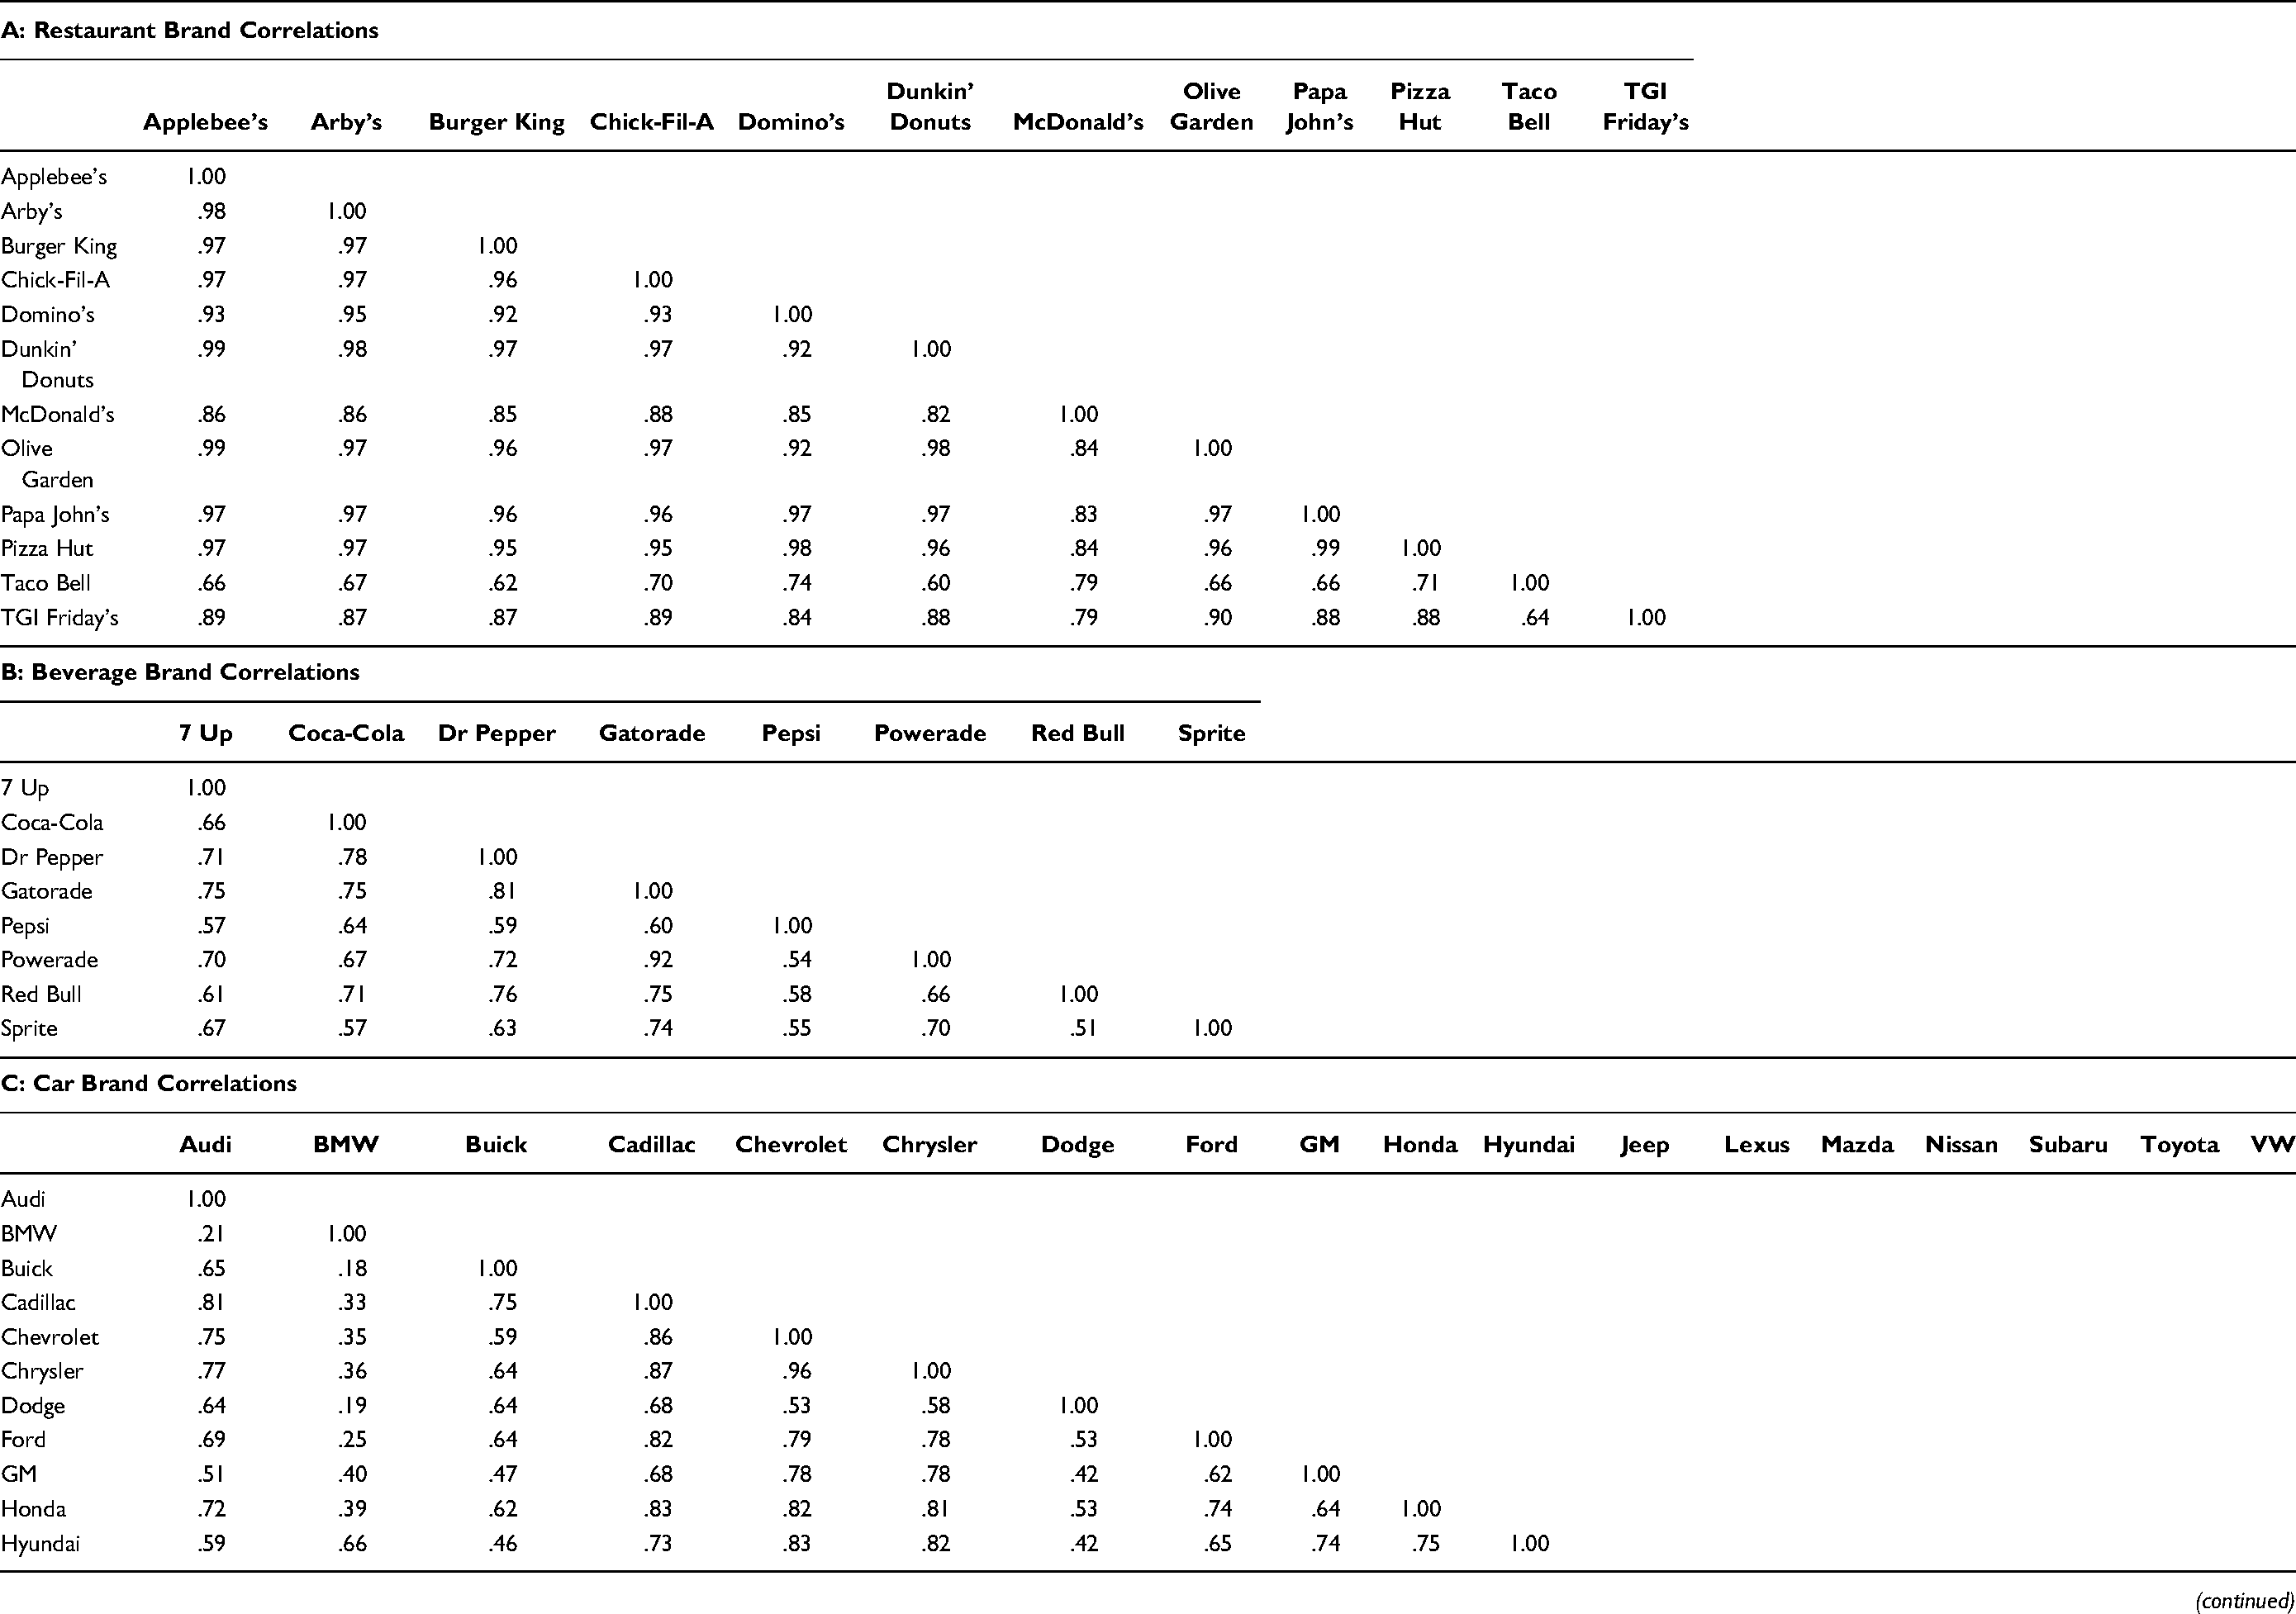
Notes: We used the average topic probabilities outputted from LDA to construct the correlation matrix (see Method 1).
Average Correlations Among Sample Brands and Across Industry Brands (Based on Average Topic Probabilities for 100 Topics).
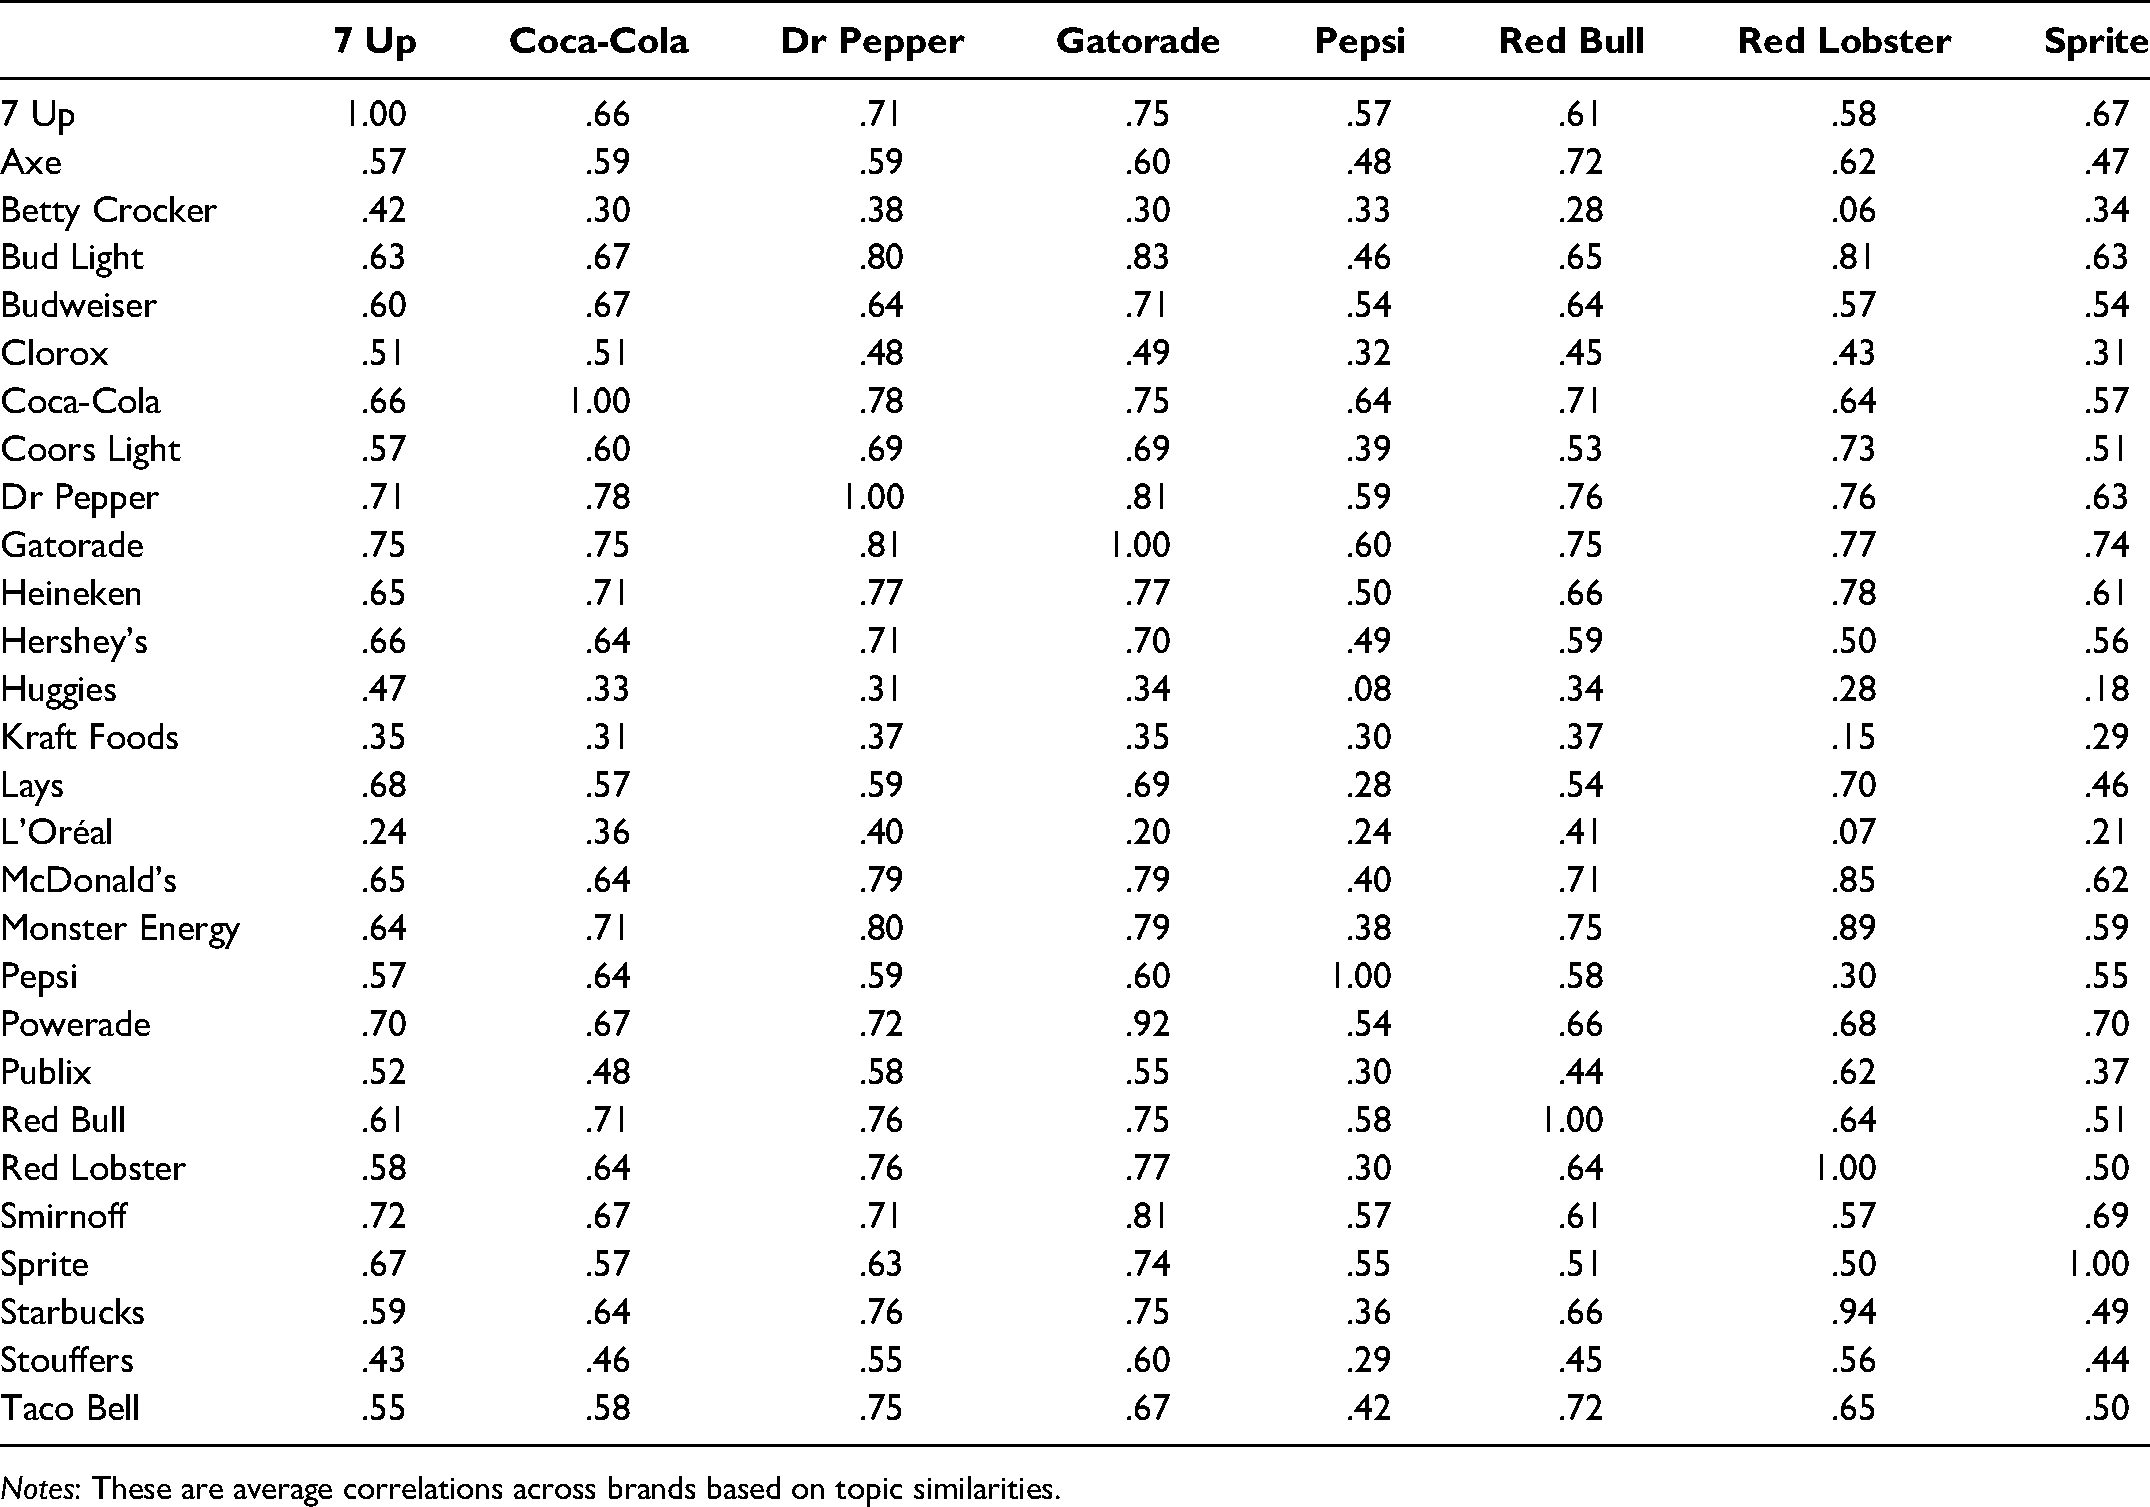
Notes: These are average correlations across brands based on topic similarities.
As the correlation matrix in Panel A (restaurant brands) of Table 4 shows, Applebee's is highly correlated with Olive Garden (r = .99), and both represent chain restaurants. Pizza Hut is highly correlated with both Papa John's (r = .99) and Domino's (r = .98), though it also shows strong correlations with restaurants across the board. Of these, Taco Bell has lower correlations across the board with all the restaurants, which is perhaps due to its distinct cuisine of Mexican-inspired foods.
Overall, the pattern of correlations is consistent with what we would expect given the types of restaurants (fast-food vs. chain restaurants) and foods (pizza vs. fast food) that are characterized by these brands. Beyond the product type, these patterns of correlations are reflective of a different type of underlying similarity between brands, based on their cultural relevance to different groups of customers as reflected in the social media language. Similarly, notable insights can be gleaned by examining the beverage brand correlations (Table 4, Panel B) or car brand correlations (Panel C).
We present the second analysis of the beverage brand correlation matrix in Panel B of Table 4. As the panel shows, Gatorade has a high correlation with Powerade (r = .92) and with brands such as 7 Up (r = .75) and Dr Pepper (r = .81). Brand managers could use this information to identify potential new cobranded opportunities featuring brands with high correlations. Table 5 presents correlations of beverage brands across a range of brands in other categories to highlight the benefits of going across categories to identify similar brands. In this example, Gatorade and Smirnoff (r = .81) present a possibility for cobranding, given high correlations of social media conversations. Our analysis of brand correlations based on average topic probabilities reveals new opportunities for collaborations.
Forecasting Shifts in Brand Positioning and Future Brand Preference
Brand–topic probabilities from one year to the next can be used at an aggregate level as an early warning of future shifts in brand preferences. The previous section provides a detailed overview of our measure TTV and also an empirical application of the concept. We show that our measure of topic probability can help predict changes in future brand preference, as well as future lapsed users. To demonstrate the value of this as a meaningful metric, we present some model-free evidence; we compare the brand preference shifts and lapsed users at high and low levels of TTV in our database. At low levels of TTV (brands with the lowest 10% of TTV have scores of .016), we find that the corresponding average shift in future brand preference is 1.83% and shift in future lapsed users is 1.06%. By contrast, for brands with the highest 10% levels of TTV, we find that the change in future brand preference is 8.13% and the change in future lapsed users is 4.29%. This additional model-free evidence provides some indication about using TTV as a predictor of key changes that are likely to occur in the future. Brand managers can use TTV as an early warning system to predict future shifts in brand preference and intervene to limit the likely increase in lapsed customers in the future.
Designing Marketing Communications Using Topic Models
A brand can improve its target audience appeal by basing its marketing communications on the results of topic modeling. By identifying culturally relevant themes that emerge from topics, a brand can situate its marketing communications within these topics or emergent themes, thus improving its target market appeal. Branding scholars have highlighted the benefit of incorporating consumer narratives and stories into the brand to create open-source brands (Fournier and Avery 2011). Consumers can cocreate brand meanings and identities by developing and circulating narratives about the brand, and firms can also facilitate this process by making digital platforms and processes that lead to brand meaning cocreation (Swaminathan et al. 2020).
One approach that can help incorporate UGC into marketing communications is by designing brand dashboards that highlight the latest topics that feature a brand. As an illustrative example, we highlight the topics featuring the CNN brand name (see Appendix C). This dashboard contains the following information: (1) the top three topics linked to a brand at any given point in time, (2) shifts in brand topics over multiple years, (3) the words that are linked to a given topic, and (4) brands that feature similar topics. For example, the keywords for topic 30 are linked primarily to sports, and these could form the basis of an advertising campaign that features a sports theme. CNN could use this analysis of the topic conversation topics to identify persistent themes that are linked to the brand over time. When the relationship to a given topic weakens, CNN could use the feedback to evaluate whether the brand is losing its cultural relevance and then design a new advertising campaign or change its marketing communications accordingly. Finally, the list of brands that feature similar topics could help CNN decide which related websites it could leverage to advertise and promote its shows.
New Product Opportunities Using Topic Models
Another useful application of the proposed topic modeling is to identify new product opportunities. The bag-of-words associated with a brand could present novel ideas that stimulate creative new product opportunities. For example, the second most likely topic to appear with Red Bull's topics (in Table 3) is topic 31. The keywords associated with topic 31 include ice, coffee, drink, cream, chocolate, cold, taste, drinks, cake, favorite, water, cup, bar, enjoy, and mix. This indicates that Red Bull could perhaps enter the ice cream or chocolate categories. It could also offer cobranded cocktails or drinks to be served in bars. As the heat map in Table 5 shows, Red Bull could also consider entering into a cobranded partnership with Taco Bell (r = .72). In a similar vein, Dr Pepper could offer a cobranded new product with Coca-Cola (r = .78). Thus, topic similarity is a useful guide to help identify cobranding partners for new product introduction. A high degree of topic similarity is indicative of a higher likelihood that the cobranded new products will be successful.
Discussion
Our framework helps systematically unpack a brand's image by outlining an approach to quantify its image through differential language analysis and topic modeling of online social media conversations. Our framework interprets higher-level interactions of words giving rise to topics. In doing so, it provides insights into how unique brand associations can be deduced via clusters of words that may be attributable to certain (but not all) brands. Firms can use topics uncovered in differential language analysis to judge positive and negative topic correlates associated with different brands within a category. There are a number of theoretical and practical implications of this analysis, as we outline next.
Theoretical and Practical Implications
The framework captures the extent to which social media data offer important insights into brand image perceptions and offers an approach to quantify a brand's positioning. We build on prior research (e.g., Nam and Kannan 2014; Netzer et al. 2012; Tirunillai and Tellis 2012) by identifying how managers can use topic modeling to identify which brands consumers view as similar or dissimilar to each other, based on topics that are both positively and negatively correlated with the brands. The framework shows how the topics extracted from differential language analysis can be linked to future shifts in brand preferences, using TTV as a key metric.
We also highlight applications in the context of new product introduction and cobrand partner selection, thus providing insights into potential ways topic modeling can serve as a critical input to data-driven brand management. Topics can be linked to brands across multiple categories, thus giving managers opportunities for partnering with brands across categories and in identifying opportunities for cross-promotions, joint advertising, and the like. The Gatorade and Smirnoff example is one instance of how such partnership opportunities could be identified with the analysis.
Another benefit of the proposed approach is its ability to forecast sudden volatile shifts in brand perceptions before they are detected by traditional survey-based approaches. Social media data can be further analyzed to understand the causes driving changes in brand perceptions. Furthermore, this approach can help address whether cultural conversation have shifted, such that the brand is now less relevant to consumers. Knowing this can help managers increase the relevancy of a brand's advertising to its audience by understanding which topics dominate the conversation when consumers are discussing a given brand. Such data can reveal important clues that could help marketing managers become proactive in directing brand perceptions in the marketplace. Social media insights into brand perceptions can be important vehicles for instituting improvements that can reposition the brand and change the conversation surrounding it.
Limitations and Future Research Directions
Although our approach offers several advantages over traditional survey-based or qualitative approaches to brand image tracking, we acknowledge the possible biases that may exist even when using social media data. The data may be disproportionately skewed in favor of certain types of consumers and may not reflect the broader target audience for a given brand. In addition, our focus was primarily on Twitter, though other types of social media (e.g., Facebook) may also provide useful insights.
Potential extensions of our framework are worth pursuing. One possible direction is to combine the proposed unsupervised LDA technique with more supervised approaches such as Linguistic Inquiry and Word Count, which may offer insights into a brand's positioning. The role of topics in defining brand positioning provides a starting point for understanding how brands are categorized in consumers’ minds and how this categorization (or groupings of brands with other brands having a similar topic correlations) can be exploited to generate insights into competitive market structures. However, there are ways of augmenting the text-mining approach with visual image–based data as well as videos to generate further insights into brand image (for a recent example of image-based feature extraction, see Liu, Dzyabura, and Mizik [2020]). Another potential direction for future research is to take a closer look at the dispersion statistics (standard deviation) surrounding a topic's relationship with a given brand across a corpus of a brand's messages. This could provide additional novel insights about the relationship of a topic with a brand, and when the variance increases, this could indicate a weakening of the topic–brand relationship. This analysis could also provide some important clues that could help predict future shifts in a brand's positioning.
Managers can also use the approach outlined here to examine how brand positioning shifts over time, based on external shocks such as brand crises incidents or introduction of new products within a category. This type of dynamic analysis (potentially using dynamic topic modeling) can build on previous research on the social media effects of crisis incidents (Borah and Tellis 2016). Research has also begun examining the morphology of tweets to assess how certain characteristics can drive engagement, and further research in this vein would benefit from using the proposed approach to identify topics of conversation that drive engagement.
Conclusion
Social media offers a unique opportunity for brands and their managers to understand consumers’ mindsets. The approach suggested here shows how conversations can be effectively mined to offer a window into consumers’ mindsets, which can then be translated into marketing strategy. The current state of the art of the social-listening dashboards typically includes only basic information about a brand's sentiment (valence of brand mentions as positive or negative). Our approach provides a novel way to gain insights into a brand's relative positioning by using social media data and analyzing brand–topic correlations to evaluate how consumers perceive a brand relative to others in a category.
Footnotes
Acknowledgments
The authors would like to acknowledge and thank Young & Rubicam's Brand Asset Valuator for sharing the data used in this research. The technical help of Om Patel (School of Computing and Information at the University of Pittsburgh) is gratefully acknowledged. The authors also acknowledge the technical assistance of Swetambari Verma. The authors are thankful for the thoughtful feedback and input from Nikhil Behari (Harvard University) and Professor Michel Wedel (University of Maryland) on previous versions of the paper.
Editor
Wendy Moe
Declaration of Conflicting Interests
The author(s) declared no potential conflicts of interest with respect to the research, authorship, and/or publication of this article.
Funding
The author(s) received no financial support for the research, authorship, and/or publication of this article.