
Abstract
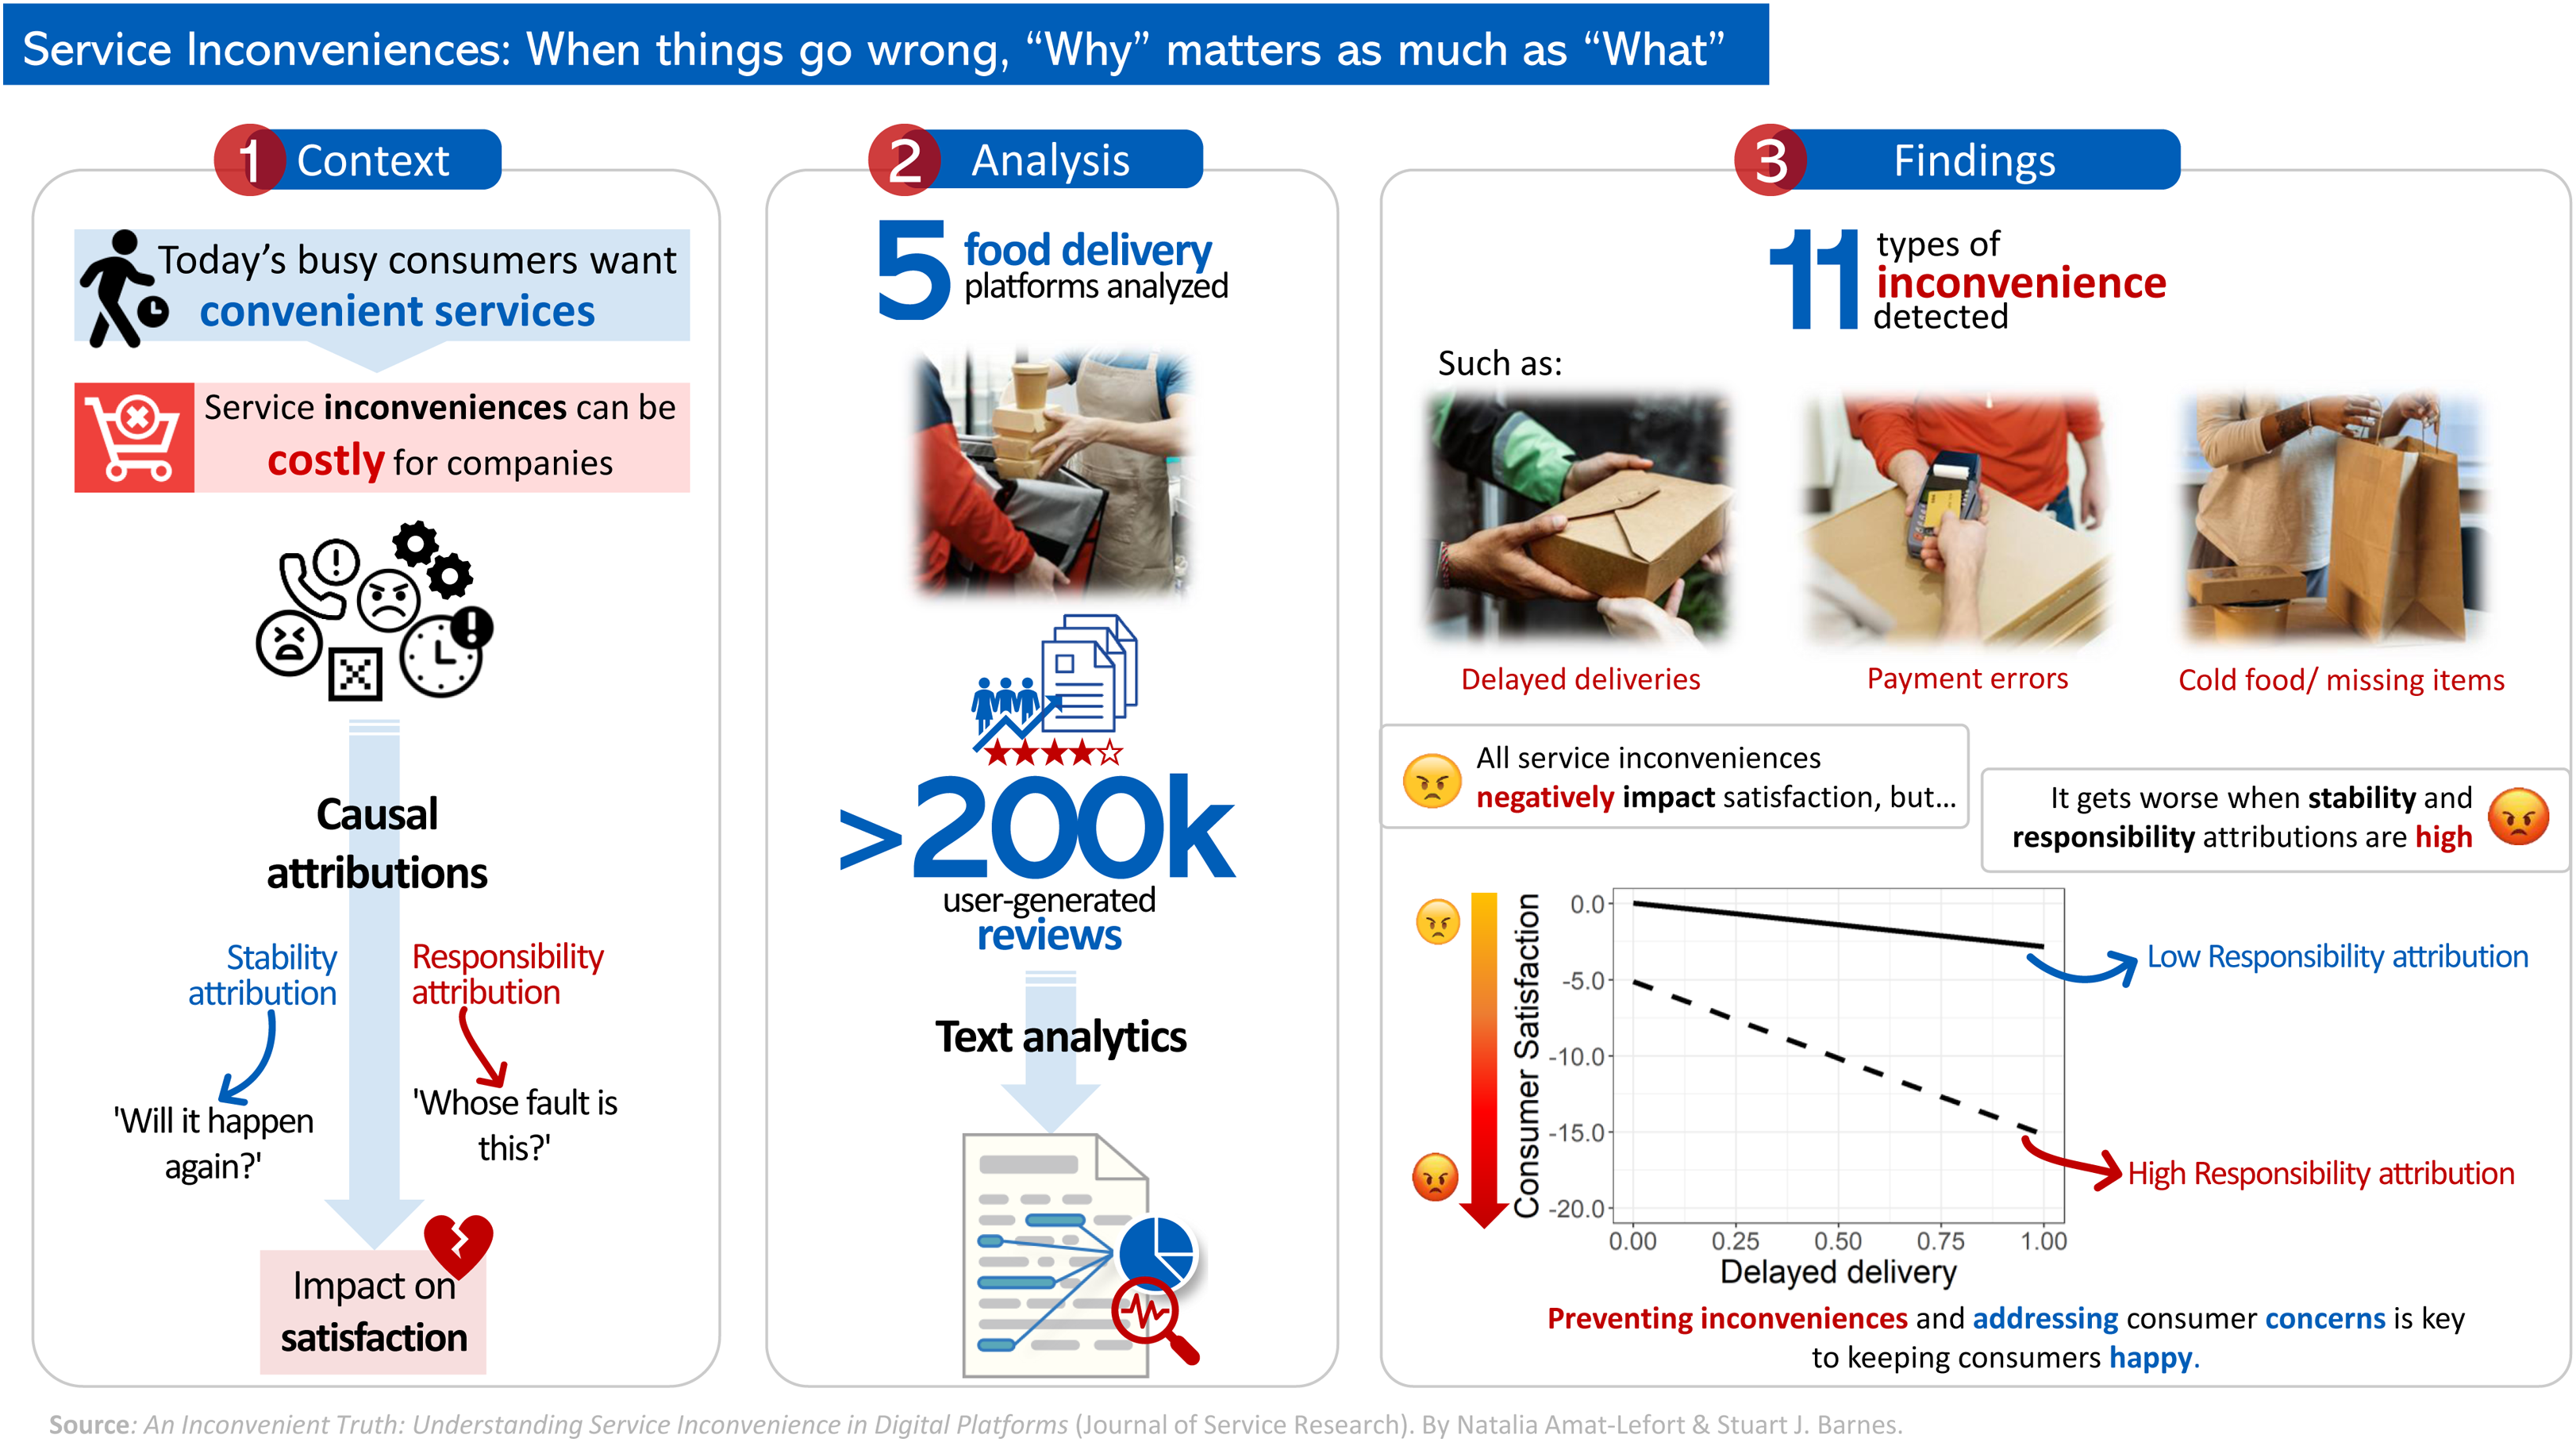
In today’s busy world, convenience is on the rise. On-demand services (e.g., food delivery services) promise swift solutions to our daily needs. However, limited research explores how service inconveniences (e.g., order cancelations and delays) impact consumer satisfaction, and which factors exacerbate such impact. This study addresses this gap by leveraging text analytics on a dataset of 222,371 user-generated reviews in food delivery platforms. Building on the Model of Service Convenience and Attribution Theory, we hypothesize that when consumers experience an inconvenience, it is not only what happened that matters to them, but also why they think it happened (causal attributions). Given that these two models have not been jointly tested, it is unclear how attributions moderate the effect of different service inconveniences on satisfaction. We present a scalable approach to measure service inconvenience attributions, allowing us to identify not only critical inconveniences but also a new construct: remote support inconvenience. Our results show that when stability or responsibility attributions are present, the effect of inconveniences on satisfaction can be over four or eleven times stronger (−426% and −1,140% from baseline, respectively). These insights contribute to the theoretical understanding of service inconveniences and offer actionable guidance for platforms to improve their services.
Keywords
Introduction
From one-click ordering to 10-minute home deliveries, today's busy consumers expect convenience in every part of their service experiences. Service convenience, as defined by Berry, Seiders, and Grewal (2002), relates to consumers' perceptions of time and effort saved in purchasing or using a service. Conversely, service inconvenience can be defined as the consumers' perceptions of wasted time or unnecessary effort when buying or using a service, reflecting inefficiencies or unnecessarily complex processes. Since the COVID-19 pandemic began, the shift toward more convenient products and services, like online shopping and home deliveries, has greatly accelerated. Initially driven by lockdowns, these services gained immense popularity and have remained preferred choices for many consumers even after the lifting of mobility restrictions (Wang et al. 2021).
The rise of on-demand services underscores this shift, allowing consumers to use a service whenever they experience a need, anywhere and anytime (van der Burg et al. 2019). Taylor (2018) defines on-demand service platforms as those connecting time-sensitive consumers seeking a service with independent service providers, who receive a payment from the platform for each service completion. One of the most popular examples of on-demand services are food delivery platforms, which connect restaurants with consumers, emerging as a convenient alternative to restaurant dining. Given the relevance of convenience from the consumers' perspective, service inconveniences can be very costly for companies. Nearly all of us have experienced service inconveniences, and a study that surveyed 2949 U.S. consumers found that 97% of participants had backed out of a purchase because it was inconvenient to them (National Retail Federation 2020). These negative experiences can have a lasting impact, but what factors influence how strongly they affect consumer satisfaction?
While research shows convenience directly impacts consumer satisfaction (e.g., Colwell et al. 2008), there is a gap in our understanding of how consumers make sense of service inconveniences. Attribution theory suggests that when faced with negative events, we naturally seek explanations (Weiner 1985). We ask ourselves: “Will this happen again?” (stability attribution) and “Whose fault is this?” (responsibility attribution). The answers to these questions likely influence how dissatisfied we feel with the service provider. For instance, consumers may feel more disappointed if they cannot attend a music festival because a company sold them fake tickets than if the event is canceled because of poor weather conditions. Even though existing research has analyzed the direct effect of service convenience on consumer satisfaction, the interactive effects of inconvenience attributions on satisfaction remain unexplored. According to Tsiros, Mittal, and Ross (2004), stability and responsibility attributions can impact consumer satisfaction in a complex manner, which cannot be captured fully by a simple main effects approach. In the context of negative service experiences, we posit that stability and responsibility attributions can intensify the relationship between inconveniences and consumer satisfaction. To address this gap, we integrate two pre-existing models—service inconvenience and consumer attributions—and test them using a large-scale dataset of consumer reviews. To our knowledge, these two models have not been jointly tested, precluding an assessment of contingent effects—such as when inconveniences (combined with causal attributions) can have weaker or stronger effects on consumer satisfaction.
Although attribution theories have been widely applied in service research, they have been tested predominantly in an experimental setting, as opposed to analyzing consumers' feedback from their real experiences. For example, a common approach has been to ask participants how they would react in a hypothetical service encounter. In contrast, user-generated reviews are increasingly becoming regarded as a valuable tool to capture users' or consumers' real thoughts and generate marketing insights (Huang and Rust 2021; Mejia, Mankad, and Gopal 2021; Ye et al. 2022). This research provides an original contribution by presenting a scalable approach for measuring service inconveniences and their attributions. Traditional methods such as cross-sectional surveys or scenario-based experiments can be costly and limited in their scope (with respect to respondent samples). To overcome such limitations, we propose that text analytics can be useful for leveraging large-scale and widely available datasets of user reviews. This answers the call for the use of more advanced techniques based on text analytics to obtain theoretical insights in the fields of business and marketing (Berger et al. 2020; Huang et al. 2021).
Using text analytics, we explore real-life service experiences, detect the key topics within each type of service inconvenience, and identify a novel type of service inconvenience (remote support inconvenience). This allows us to extend and update the Model of Service Convenience proposed by Berry, Seiders, and Grewal (2002) by adapting it to the context of on-demand services offered through digital platforms. Additionally, we study the attributions of service inconveniences and their impact on satisfaction at different stages of the service process. In this way, we determine which stages are more critically exposed to inconvenience attributions. These insights can help companies identify the areas in which they need to focus their efforts to improve their services and attract convenience-oriented consumers.
The structure of the paper is as follows. First, we explain the underlying theories in the literature review section. Subsequently, we develop our hypotheses and present the study’s proposed research model in section three. Section four describes the research process and methodology applied. Section five details the empirical results of the analysis. Finally, the last section discusses the results of the research, providing implications for theory and practice, limitations and directions for future research, and conclusions.
Literature Review
The Rise of Convenience
In today’s fast-paced world where time is our most valuable asset, convenience is on the rise. According to Berry, Seiders, and Grewal (2002), service convenience refers to the consumer’s perceptions regarding the amount of time and effort necessary to purchase or use a service. Due to several socioeconomic developments and technological advances, there has been a constant growth in the demand for more convenient products and services. This trend has been documented for decades (e.g., Anderson 1971; Kelley 1958), but it was exacerbated by the COVID-19 pandemic lockdowns in 2020, when online shopping and home deliveries grew exponentially (Sheth 2020; Wang et al. 2021). The increase in consumers' expectations of convenience and immediacy have driven companies to adopt on-demand service models (van der Burg et al. 2019), allowing consumers to use a service anywhere and anytime.
Assessment of Service Convenience
Following the growing popularity of convenience-oriented services, several studies have proposed frameworks to evaluate the dimensions, antecedents, and consequences of service convenience (see Table 1). One of the first and most well-known conceptualizations of this construct is the Model of Service Convenience introduced by Berry, Seiders, and Grewal (2002). In their comprehensive analysis, Berry et al. presented different types of convenience based on consumers' perceptions of time and effort costs: • Decision convenience: The time and effort necessary to decide whether to use a service or not, as well as to choose among competing services. • Access convenience: The time and effort necessary to initiate service delivery. • Transaction convenience: The time and effort necessary to conduct a transaction or payment to use or purchase a service. • Benefit convenience: The time and effort necessary to experience the service’s core benefit. • Post-benefit convenience: The time and effort necessary to re-initiate contact with the service provider. This refers to re-initiating contact after the benefit stage of the service, for purposes such as when a patient returns to a surgeon for a postoperative evaluation (as described by Berry, Seiders, and Grewal 2002) or when a customer wants to repurchase the same service (in food delivery services: reorder the same meal). Summary of the Principal Existing Studies Related to Service Convenience.
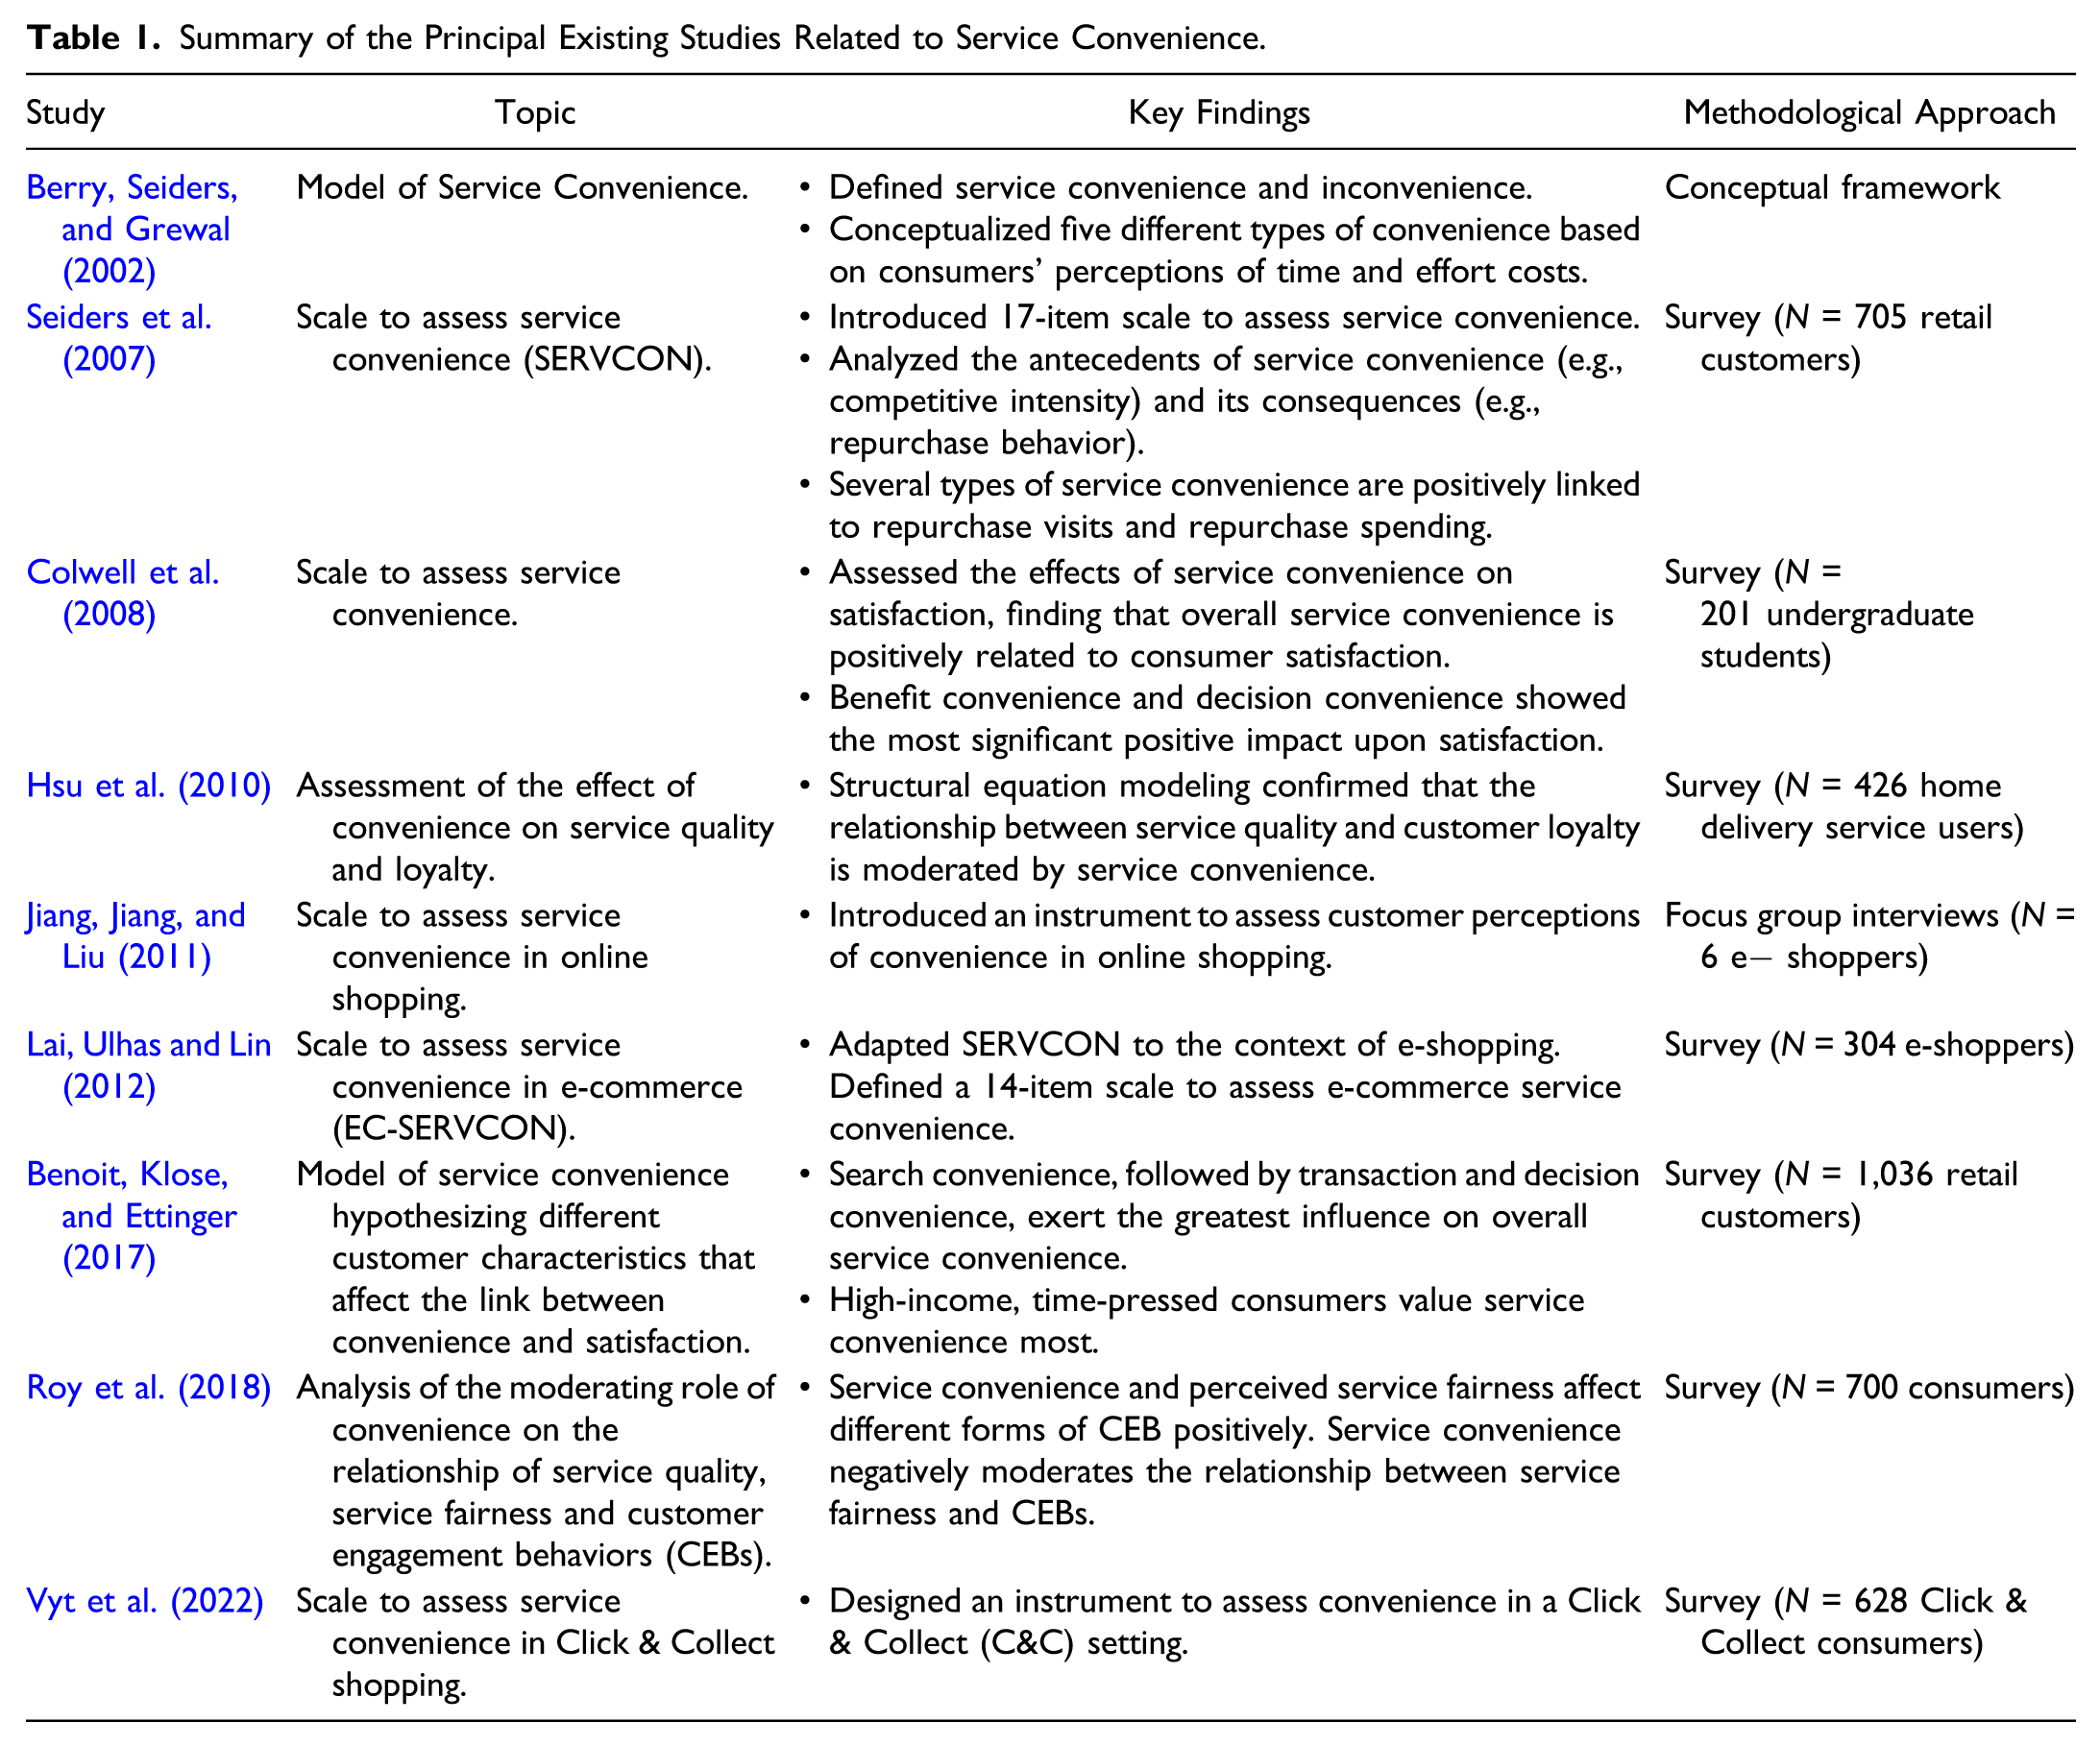
Building on this conceptual framework, Seiders et al. (2007) developed and validated a multidimensional scale of service convenience, which they named SERVCON. Their scale, which was tested via a survey of 705 retail customers, contained 17 items to measure each one of the five dimensions proposed by Berry, Seiders, and Grewal (2002). For instance, access convenience was evaluated through items such as “convenient parking” or “convenient store hours.” They also provided insights into the antecedents of service convenience, such as competitive intensity, and its consequences, such as repurchase behavior. Remarkably, Seiders et al. found that several types of service convenience were positively linked to repurchase visits and repurchase spending. In particular, decision convenience showed a significant positive relationship with repurchase visits, and benefit convenience had a direct positive effect on repurchase spending. Colwell et al. (2008) used a similar scale to measure the effects of service convenience on satisfaction. Analyzing the responses of 201 undergraduate students, they found that overall service convenience is positively related to consumer satisfaction. More specifically, benefit convenience and decision convenience showed the most significant positive impact on satisfaction. These scales were designed for “traditional” services, based mainly on in-person interactions.
In the context of online shopping, Jiang, Jiang, and Liu (2011) explored digital convenience dimensions by conducting focus group interviews with online consumers. As a result, they introduced an instrument to assess consumer perceptions of convenience in online shopping, measuring aspects such as the website’s download speed, personal data protection, and several other factors. On the other hand, Lai, Ulhas, and Lin (2012) studied how SERVCON could be adapted to the context of e-shopping. By conducting a survey of 304 online shoppers, they defined a 14-item scale to assess e-commerce service convenience, EC-SERVCON (Lai, Ulhas, and Lin 2012). More recently, Vyt et al. (2022) conducted a survey of 1,078 Click & Collect (C&C) consumers and presented an instrument to assess convenience in this setting. C&C represents a “hybrid” type of service encounter, where clients order products online and then collect them afterward in a physical store. For this reason, the scale designed by Vyt et al. (2022) evaluates both traditional and digital convenience. Most of these studies proposed item-level variations to measure each construct of service convenience, adapting them to different sectors and contexts. However, the fundamental dimensions of the model to assess service convenience remained the same (or very similar) to those originally introduced by Berry, Seiders, and Grewal (2002).
Even though previous research has analyzed service convenience in different sectors, inconvenience attributions and their potential impact on consumer satisfaction remain unexplored. Furthermore, existing research has mainly used traditional approaches (such as interviews, focus groups, and surveys) to evaluate consumers' perceptions of service (in)convenience. Thus, despite the importance of understanding service (in)convenience, measuring (in)convenience in a scalable manner remains a challenging task, due to the limitations of conventional methods. For example, surveys and focus groups used in the studies in Table 1 may be costly and limited in terms of sample size and diversity. As a solution to these limitations, we propose that large-scale user-generated content (such as service reviews and ratings) provide an alternative source of consumer insights. This study addresses these aspects by using text analytics to examine user-generated content and to assess service (in)convenience attributions.
Attribution Theory
The goal of attribution theories is to explain how humans perceive or infer the causes of other people’s behaviors (Kelley and Michela 1980). According to Weiner’s three-dimensional model (1985), individuals assess the causes they perceive via the following dimensions: • Locus of causality, which depends on who is perceived as responsible for the outcome. It can be internal (if the consumer thinks that they are responsible for the situation) or external (if they think that someone else, such as the service provider, is responsible for it). • Stability, which refers to how constant over time the outcome is perceived to be. The more stable (vs. temporary) the outcome is believed to be, the more it is expected to repeat in the future (Folkes 1984; Weiner 1985). • Responsibility, which reflects the extent to which the outcome is regarded to be under the control of the agent causing the event (controllable). If the consumers hold the service provider responsible for the outcome, it is more likely that they believe it could have been avoided or that it was caused intentionally.
In the context of service inconveniences, the attributions related to the locus dimension are not as relevant as those linked to stability and responsibility experiences (Hess, Ganesan, and Klein 2003; van Vaerenbergh et al. 2014). The reason is that service inconveniences are inherently caused by the service provider (Bitner, Booms, and Tetreault 1990). Given that this study aims to analyze consumer reactions to service inconveniences caused by the provider, we will focus solely on stability and responsibility attributions.
Service Inconveniences, Attributions, and Satisfaction: Direct and Interactive Effects
A service failure is defined as service performance that falls below a customer's expectations (Hess, Ganesan, and Klein 2003). Service inconveniences are a particular type of service failure in which consumers' feel that their time or effort has been wasted (during the service encounter). These inconveniences reflect inefficiencies or overly complex processes within the service delivery system. While research specifically dedicated to service inconveniences is scarce, existing literature links various types of service inconveniences to broader consumer dissatisfaction. For instance, service processes that inconvenience consumers through long delays may lead to them feeling unsatisfied with the service experience (Danaher and Mattsson, 1998). Likewise, an inattentive customer service representative can be a source of consumer discontent (Bitner 1990). Additionally, service inconvenience has been identified as one of the critical factors prompting consumers to switch to alternative service providers (Liang, Ma, and Qi 2013).
From previous research, it is evident that service inconveniences can have a direct negative impact on consumer satisfaction. Similarly, prior studies have analyzed the direct effects of stability and responsibility on different consumer outcomes. For instance, van Vaerenbergh et al. (2014) found that when consumers make stability and/or responsibility attributions, they are more likely to experience negative emotions.
Notwithstanding, existing research has not analyzed how inconvenience attributions can moderate and influence the effect of service inconveniences on satisfaction. According to attribution theories, our causal attributions of a negative experience can alter our emotional and cognitive responses to such an experience (Weiner 1985). In related research contexts, it has been demonstrated that consumer attributions can have both direct and interactive effects (e.g., when combined with disconfirmation) on consumer satisfaction (Tsiros, Mittal, and Ross 2004).
We suggest that when consumers experience an inconvenience, it is not only what happened that matters to them (direct effect of the inconvenience on satisfaction) but also why consumers think it happened (moderating effect of the causal attribution). Did the inconvenience emanate from a stable or unstable cause? To what extent is the service provider held responsible for that inconvenience? These judgments can potentially alter the impact of such inconvenience on consumer satisfaction. Hence, we aim to analyze how causal attributions and inconveniences combine to affect consumer satisfaction. In this regard, we hypothesize that:
Stability attributions will moderate the effect of inconveniences on satisfaction, such that the relationship between an inconvenience and satisfaction will be stronger when stability attributions are high, than when they are low.
Responsibility attributions will moderate the effect of inconveniences on satisfaction, such that the relationship between an inconvenience and satisfaction will be stronger when responsibility attributions are high, than when they are low.
Furthermore, we aim to explore which service inconveniences (and their associated attributions) lead to greater dissatisfaction. Building upon the Model of Service Convenience, we conceptualize different types of service inconveniences corresponding to each stage of the service experience: decision, access, transaction, benefit, post-benefit, and remote support inconveniences. Each type of service inconvenience could exert distinct effects on consumer satisfaction, especially when combined with attributions. To the best of our knowledge, existing literature has not addressed this issue. As a result, the effects on consumer satisfaction of different types of inconveniences (and the moderating effects of inconvenience attributions) are unclear.
Stability, in this context, reflects the extent to which inconveniences are viewed as temporary (expected to vary over time) or permanent (expected to persist over time). Hess, Ganesan, and Klein (2003) conducted a study to explore how stability attributions influence consumer satisfaction in service failures related to the service's core benefit. Their research revealed a noteworthy and statistically significant negative impact on consumer satisfaction. The core benefit of a service refers to the primary reason for the service encounter (Hess, Ganesan, and Klein 2003), such as enjoying a meal at a restaurant or watching a movie at a theater. Consumers invest resources (including time and effort) to access this benefit (Berry, Seiders, and Grewal 2002). As Berry, Seiders, and Grewal (2002, p. 7) succinctly put it, “moving consumers efficiently and effectively to the benefit stage of the service process only to inconvenience them at this point can have a powerfully negative effect because the perception of burden interferes with the perception of the service’s benefit.” When consumers perceive such inconveniences as stable, it can negatively affect their expectations regarding the future provision of the core benefit. Thus, we anticipate that stability attributions will exert a more pronounced moderating effect on the relationship between benefit inconveniences (e.g., order canceled or delayed) and consumer satisfaction (compared to other types of inconvenience). Furthermore, we also expect that inconveniences related to the fundamental elements necessary for consumers to access the service's core benefit will also be significantly influenced by stability attributions. Therefore, we expect that the impact on satisfaction of benefit inconveniences and access inconveniences (e.g., log-in issues or functional errors in the app) will be the most notably affected by stability attributions. Consequently, we hypothesize that:
The moderating effect of stability attributions (on the relationship between service inconveniences and consumer satisfaction) will be stronger for Benefit and Access inconveniences than for other types of inconvenience.
Conversely, responsibility attributions (i.e., was the company responsible for this inconvenience?) are closely tied to unfairness perceptions (Seiders and Berry 1998). Judgments of unfair company behavior can significantly impact consumer satisfaction (Oliver and Swan 1989; Seiders and Berry 1998). To identify the events that trigger judgments of unfair company behavior, Seiders and Berry (1998) conducted a survey and in-depth interviews involving consumers and managers. Their findings indicated that unfairness perceptions can arise when employees are disrespectful, advertised items or discounts are unavailable, consumers are overcharged, or when company communications are inadequate, misleading, or unclear. In terms of service inconvenience, these events would mainly fall into the categories of Transaction inconvenience (e.g., discount code issues and payment issues) and remote support inconvenience (e.g., poor or inadequate treatment from employees). Indeed, Huppertz, Arenson, and Evans (1978) found that when consumers experience bad customer service due to poor treatment, perceptions of unfairness lead to complaints and can motivate them to discontinue their association with the company. Furthermore, Choi and Mattila (2008) investigated the effect of payment process issues (moderated by responsibility attributions) on consumer responses. They found that when consumers believe that the service firm could have easily prevented such issues, there was a negative impact on consumer reactions, even if the service’s core benefit was satisfactory. Therefore, we anticipate that responsibility attributions will exacerbate the impact of service inconveniences on consumer satisfaction, especially when: (i) consumers are treated poorly, and (ii) when they experience problems regarding how their money and/or payment is handled. Hence, we hypothesize that:
The moderating effect of responsibility attributions (on the relationship between service inconveniences and consumer satisfaction) will be stronger for transaction and remote support inconveniences than for other types of inconvenience.
To assess such effects on satisfaction, we analyze user-generated star ratings as a proxy for consumer satisfaction. When consumers are dissatisfied with a particular service provider, they often react by posting a negative review and/or a low rating on the provider’s online platform. In fact, recent research shows that experience-based dissatisfaction is directly related to the writing of negative reviews (Nam et al. 2020), also known as negative electronic word-of-mouth (eWOM). For this reason, user ratings are regarded as a useful way to capture the consumer’s degree of satisfaction with a product or service (Engler, Winter, and Schulz 2015). Similarly, textual reviews posted by users have been shown to be a valuable source of information about the dimensions and antecedents of consumer satisfaction (Guo, Barnes, and Jia 2017).
Based on the foregoing, our research model (shown in Figure 1) suggests specific patterns of interactive effects between each type of service inconvenience, attributions, and satisfaction. Additionally, a new dimension of service (in)convenience (identified as a result of the topic modeling analysis, which will be described later) has also been included in Figure 1. Conceptual model. Note. Independent variables: white (new dimension identified marked with a dashed line); moderator variables: black; dependent variable: gray.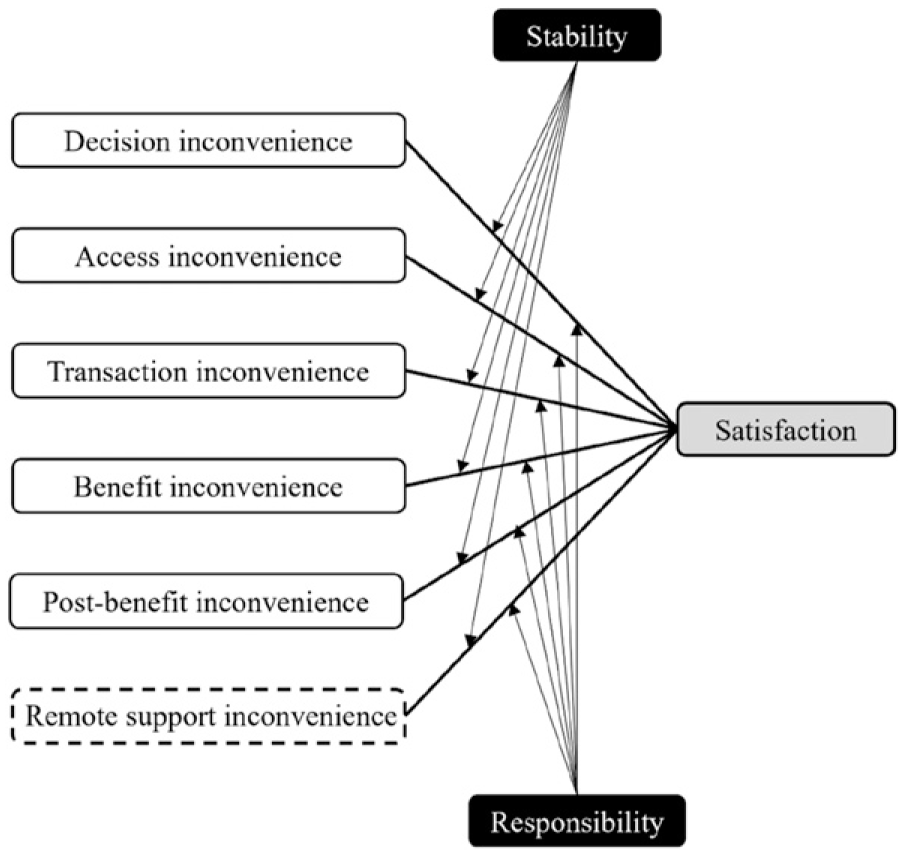
Methodology
This section describes the methodology applied in the current study, which uses topic modeling algorithms and cumulative link models to analyze user reviews and ratings from food delivery applications. First, data was collected and pre-processed. Second, exploratory data analysis was conducted. In particular, relevant keywords were identified and organized into dictionaries, which were necessary for the topic modeling analysis. Subsequently, keyword-assisted topic modeling was used to measure the constructs proposed in the research model. Finally, the impact of these constructs on consumers' star ratings was assessed through cumulative link model analysis (to test the study’s hypotheses). Figure 2 shows the workflow of the methodology applied, along with examples of each step. Workflow of the methodology applied.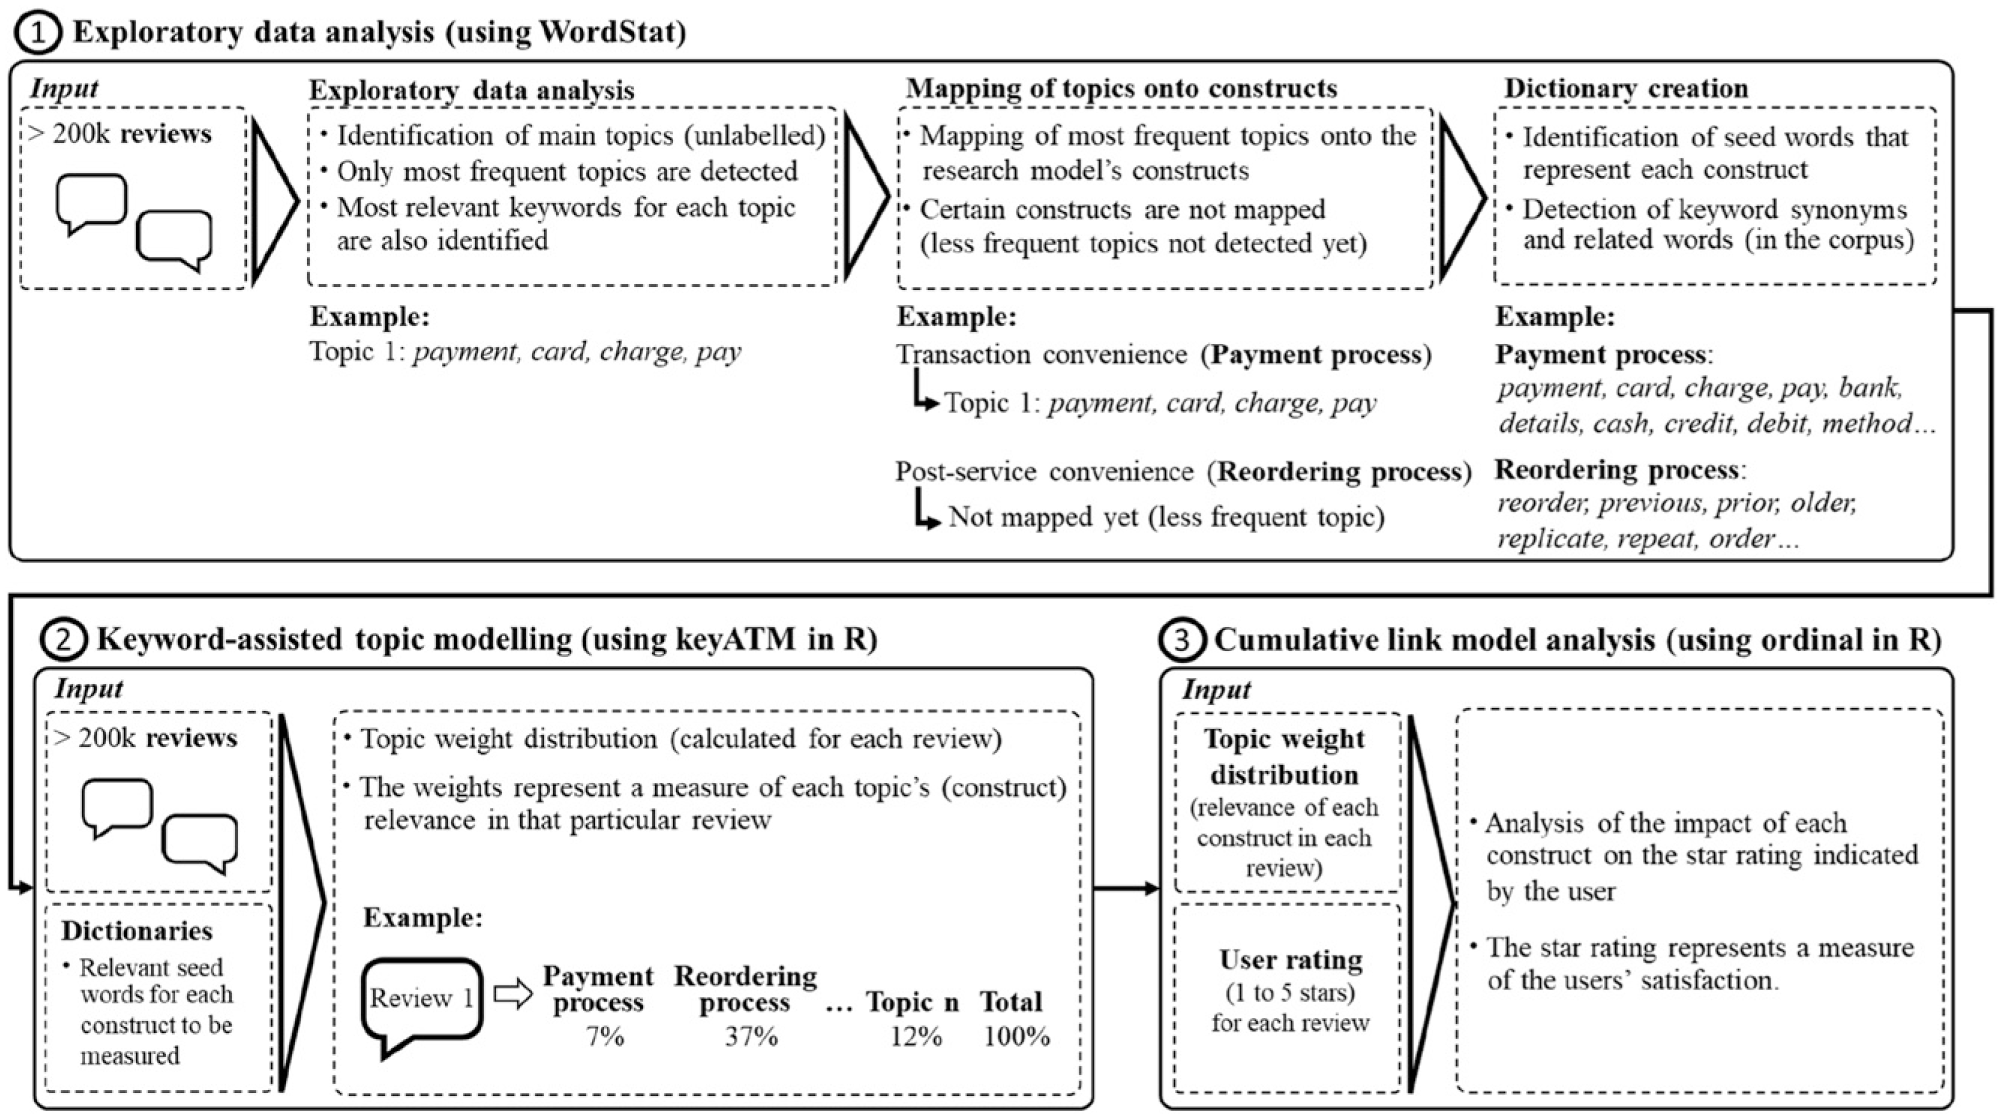
Data Collection
The dataset used in this study was extracted from Google Play using web-scraping techniques. Google Play is an online store that offers more than 2 million free and paid mobile applications (apps), which are used by billions of people all over the world (Google Play 2022a). In this marketplace, users can rate (from 1 to 5 stars) and review the apps available in the store, including food delivery apps. Google Play has been taking measures to make its app ratings and reviews as genuine as possible. According to their Comment Posting Policy (Google Play 2022b), Google Play actively filters out suspicious reviews and bans users who repeatedly or excessively violate their policies.
Based on their significance in terms of U.S. market share (Statista 2021), four leading food delivery apps were selected for this study: Uber Eats, DoorDash, Grubhub, and Postmates (Figure 3 shows the review distribution amongst these platforms). The choice of food delivery platforms as the subject of this research is motivated by the remarkable growth in this sector and the pivotal role of convenience in shaping these services. With a global market valuation exceeding $150 billion (Ahuja et al. 2021), food delivery revenues have more than tripled since 2017, successfully attracting convenience-oriented consumers worldwide. Moreover, these food delivery platforms embody the essential characteristics of on-demand services: high availability, responsiveness, and scalability, all made possible by advancements in technology (van der Burg et al. 2019). Review distribution amongst different rating scores and platforms.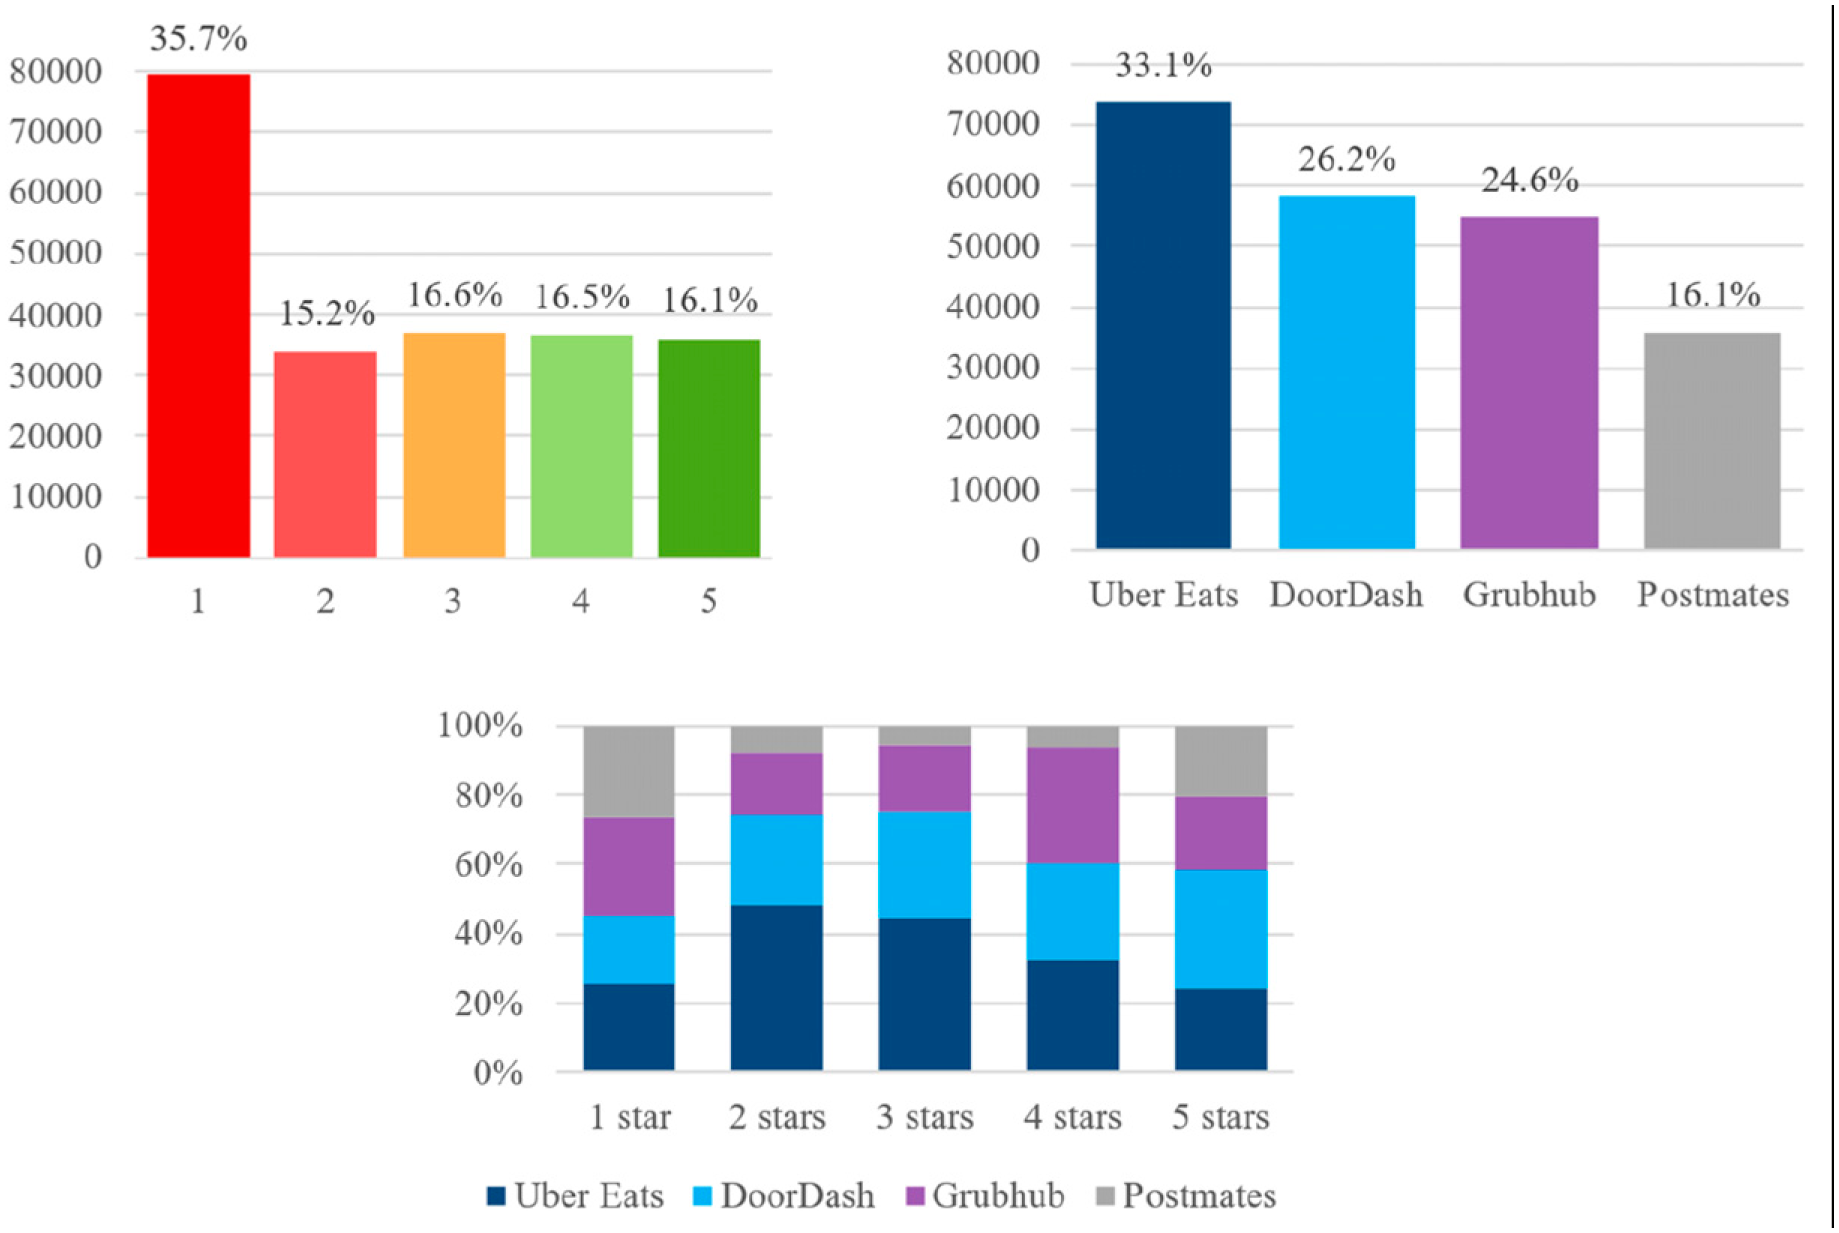
Reviews were collected using a Python script, with review dates ranging from 2010 to 2021. To select the most noteworthy reviews, the script prioritized the reviews marked as “most relevant.” These are generally the reviews with a higher number of “thumbs-up” votes from other consumers. With a thumbs-up vote, consumers can indicate that they found the review useful. The average rating was 2.62, with 35.7% of reviews having a 1-star rating (Figure 3 shows the review distribution amongst the different star rating scores). The fields collected were as follows: review ID, username, user image (URL), review content (text), star rating, review date, app ID, and thumbs-up count.
Data Pre-processing
Due to the unstructured nature of user-generated content, it is necessary to pre-process text so that it can be analyzed via text-mining techniques (Feinerer, Hornik, and Meyer 2008). The following pre-processing techniques were applied: • A language-detection filter to exclude non-English reviews. • Conversion of all text into lowercase. • Elimination of punctuation, numeric characters, emojis, and common English stop words (e.g., “or,” “the,” “and”). • Removal of duplicate reviews and reviews shorter than 10 words. • Tokenization, that is, dividing each sentence into smaller units such as words (tokens). • Lemmatization, establishing each word’s root by eliminating inflectional endings and derivations (e.g., “ordering” and “ordered” would be reduced to their stem, “order”). • Bi-gram and tri-gram analysis to detect frequently co-occurring words and convert them into unigrams (e.g., “home delivery” to “home_delivery”).
After completing the pre-processing stage, the dataset consisted of 222,371 reviews.
Exploratory Data Analysis
In order to conduct exploratory data analysis, WordStat 9.0 (Provalis Research 2022) was used. WordStat is a text-mining software package designed to process large quantities of unstructured data. It has been used in several marketing research studies (e.g., Barnes, Diaz, and Arnaboldi 2021; Teresa Borges-Tiago et al. 2021). One of WordStat’s key features is its topic analysis module, which can be used to quickly obtain an overview of the most salient topics from an extensive collection of documents. WordStat incorporates automated topic extraction based on words, sentences, and related terms (including misspellings). This functionality requires that the user enter the number of topics (K) to be extracted. To ensure a comprehensive topic exploration, we used an iterative approach, evaluating different scenarios with K ranging between 8 and 17 topics. This iterative approach is recommended in WordStat’s user manual. During the topic exploration, we carefully inspected the topics detected across several topic models. Moreover, using WordStat’s Word Frequency Analysis module, we classified reviews by their rating and examined the most and least frequent keywords and phrases in positive (4 or 5 stars) and negative (1 or 2 stars) reviews. We also used WordStat’s Keyword-in-Context feature to examine frequent phrases in their context. We aimed to ensure that we identified the topics that accurately represented the service inconveniences present in the dataset.
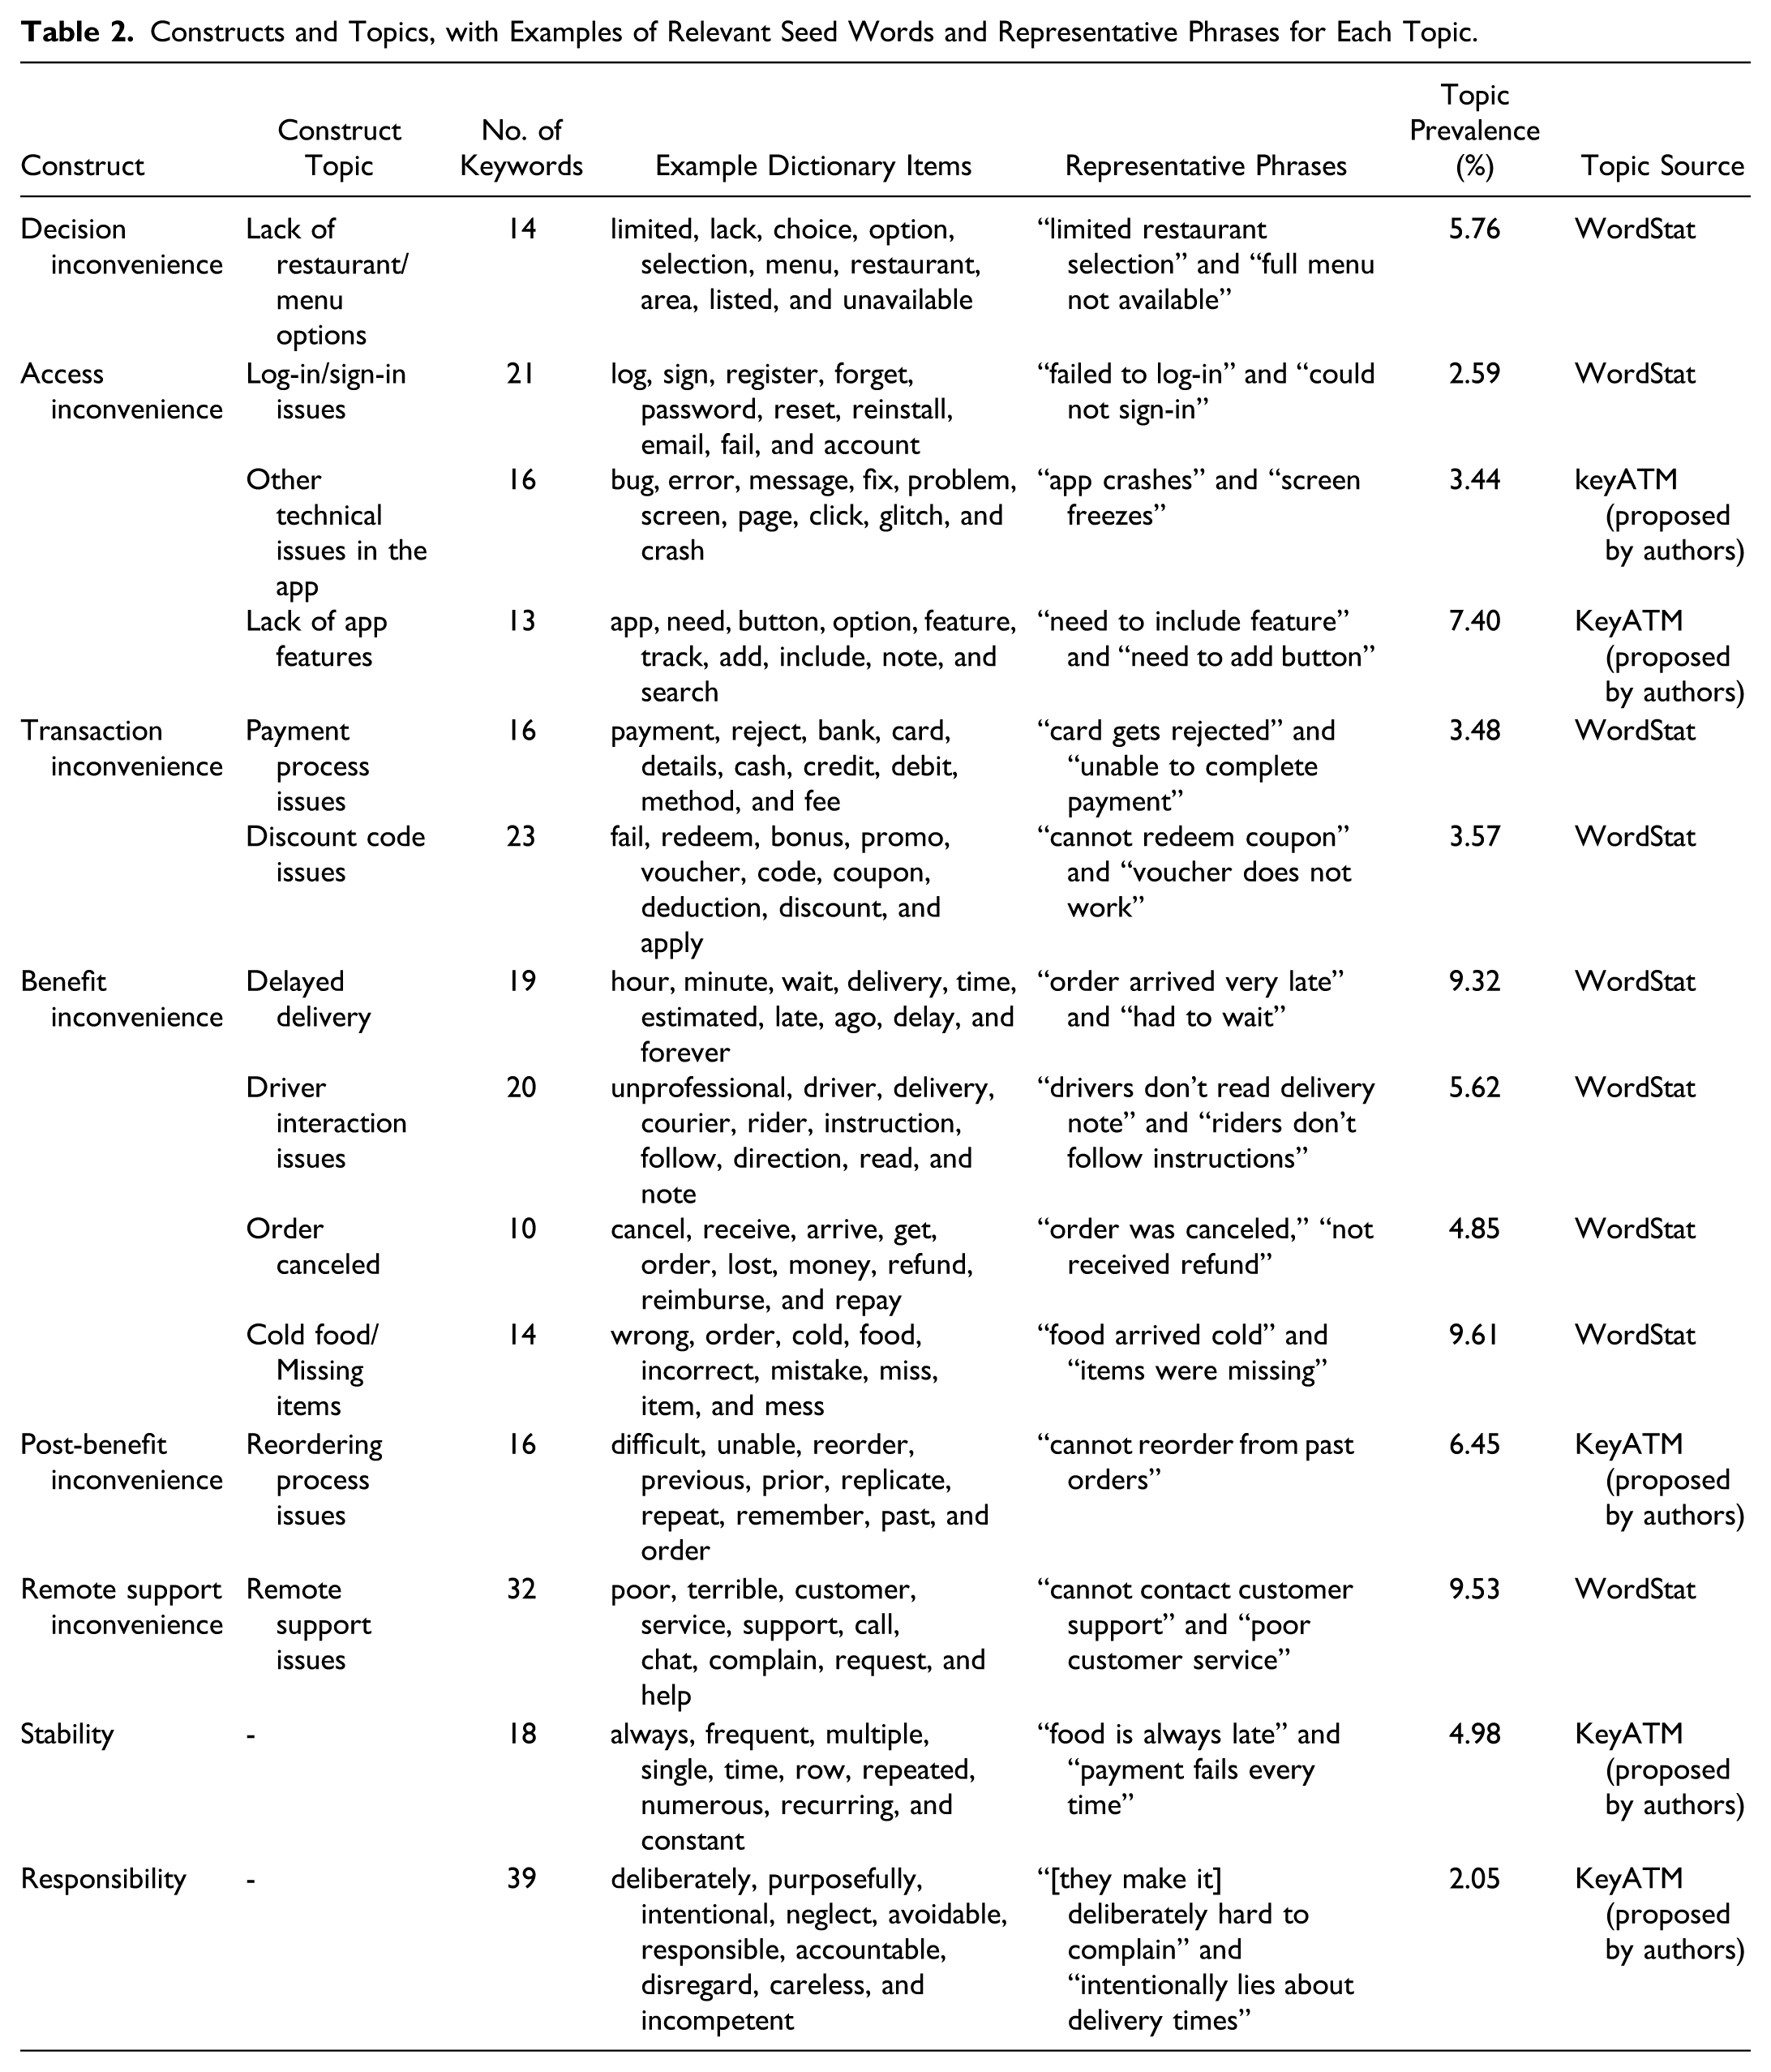
Constructs and Topics, with Examples of Relevant Seed Words and Representative Phrases for Each Topic.
The exploratory approach enabled by WordStat is only able to detect the most frequent themes, and it does not provide a document-level topic distribution. Consequently, some of the research model’s constructs could not be detected with this technique. Even though these constructs were not necessarily reflected in the most popular topics in the corpus, they could be observed when reading some of the reviews in the dataset. Hence, a more advanced technique is necessary to: (i) identify topics of our choice (related to our research model’s constructs) and (ii) measure the importance of each construct in each review. Moreover, some of the topics detected in WordStat were linked to both positive and negative comments about a specific service aspect (e.g., regarding food temperature: “food was cold”/“food was warm”). In these cases, we needed an approach that would allow us to focus solely on the negative keywords related to the service inconvenience. To address these needs, keyATM (a Keyword-Assisted Topic Modeling tool) was selected to conduct a more in-depth analysis of the reviews. As its name suggests, one of the necessary inputs to run keyATM is a set of user-defined keywords that represent each one of the constructs to be measured (dictionaries).
Given that WordStat also provides unique assistance for dictionary building, it was used to gather the most representative seed words for each construct. The dictionary approach to construct development and analysis relies on word frequency, and it can be used for marketing research purposes (e.g., Barnes, Diaz, and Arnaboldi 2021; Teresa Borges-Tiago et al. 2021). In this study, dictionaries were created through WordStat’s WordNet functionality and the Dictionary Builder module. WordNet is a large lexical database of semantic relations between words, originally created in the Cognitive Science Laboratory of Princeton University. WordNet groups related words (including synonyms, hyponyms, and meronyms) into structures known as synsets. With WordStat, this network of meaningfully related words and concepts created by WordNet can be used to semantically examine large datasets of unstructured text.
Starting with an initial set of representative keywords for each topic (e.g., payment process issues: “payment,” “card,” “reject,” and “debit”) the described functionality of WordStat was used to determine which words were appropriate to build and expand each construct’s dictionary. WordNet allowed us to identify synonyms (and other related words present in the dataset) associated with each of the topic’s initial keywords. Together with the initial keywords, the synonyms and related words were then added to each dictionary in WordStat’s Dictionary Builder module. As a result, 271 words were captured and included in the dictionaries. Table 2 shows the distribution of terms for each construct, along with examples. The number of words in each construct’s dictionary ranged from 10 to 39.
Interestingly, a new type of service inconvenience (remote support inconvenience) emerged when analyzing the most frequent topics via exploratory topic modeling in WordStat. This dimension refers to the time and effort spent by consumers to obtain remote assistance from the platform's customer support representatives (e.g., via live chats, chatbots, and outsourced call centers) before, during, or after purchasing and experiencing the service. For example, when a customer faces technical difficulties while using the service and reaches out to customer support for troubleshooting assistance. To the best of our knowledge, this construct does not appear in the original Model of Service Convenience (Berry, Seiders, and Grewal 2002) nor in any of the model’s later versions. However, the following concepts were measured only through keyATM: Lack of app features, other technical issues in the app, reordering process issues, stability, and responsibility. Even though these constructs are relevant to our research, they were not detected by WordStat, either because they are more subtle/specific or because they were merged into other topics (when measured in WordStat).
Construct Measurement: Keyword-Assisted Topic Modeling
The next step in the process was to obtain a document-level measurement of each one of the proposed constructs, which can be achieved through topic modeling. A topic model is a type of probabilistic model that can be used to detect latent semantic structures (topics) within a text corpus (Blei 2012). Our analysis focused on uncovering specific topics that captured negative and inconvenient aspects of the service.
While Latent Dirichlet Allocation (LDA) is a widely known unsupervised topic modeling technique (Blei 2012), it has certain limitations when measuring specific concepts in a text corpus (Eshima, Imai, and Sasaki 2023). In particular, LDA models frequently generate topics with similar content and merge different subjects into a single topic (Newman, Bonilla, and Buntine 2011). LDA also prioritizes generalizing across more prominent themes, frequently overlooking more specific or subtle topics. These limitations can impact the model’s coherence and the accurate measurement of particular concepts.
To address these concerns, we used keyATM, an extension of LDA that overcomes these limitations (Eshima, Imai, and Sasaki 2023). KeyATM is a semi-supervised method that allows researchers to label topics by incorporating seed words of their choice before fitting the model. By using keyATM, we were able to identify and measure topics relevant to our research model while focusing solely on keywords that reflected negative and inconvenient aspects of the service. For example, the topic of “discount code” could encompass both positive and negative mentions of the platform’s discount codes (e.g., “free,” “good_deal,” or “expired,” “fail”). With keyATM, we measured the specific topic of “discount code issues,” focusing on negative and inconvenient experiences related to the use of discount codes, with keywords such as “error,” “invalid,” “fail,” or “expired.” This approach allowed us to accurately measure the constructs in our study.
KeyATM calculates each topic’s relevance in a particular document and expresses it as a percentage. In this study, the dictionaries prepared with WordStat (see Table 2) were used as input for keyATM. Each dictionary contains seed words that represent each one of the concepts of interest. As a result, keyATM provided a document-level measure (as a percentage) of the constructs proposed in the study’s research model: Stability, responsibility, and the different types of service inconvenience identified. To interpret and validate the topic model, we extracted the most representative reviews for each topic (see Appendix 1 for examples of representative reviews for each topic). As a result, we confirmed that the topic model identified the reviews related to each type of inconvenience, while computing the distribution of topic weights in each review. The “topic prevalence” column in Table 2 shows the average weight (%) of each topic in the corpus. Hence, topic prevalence is a vector that sums up to one for each individual document (consumer reviews, in our case).
Assessment of Consumer Outcomes
Based on the results obtained from keyATM, the next step was to analyze how service inconveniences (combined with stability and responsibility attributions) impact upon consumer satisfaction with food delivery services. To this end, the document-level measurements of each type of service inconvenience (calculated with keyATM) are used as the independent variables in a Cumulative Link Model (CLM). In this model, stability and responsibility act as moderators between service inconveniences and the dependent variable, consumer satisfaction. In this way, the model’s estimates reveal the impact of each variable on consumer satisfaction (reflected in the star rating). The star rating can be classified as an ordered categorical variable—a category variable with an intrinsic ordering. In this case, there are five categories (from 1 to 5 stars).
Researchers have found that a phenomenon known as the “binary bias” plays a relevant role in determining how individuals perceive different rating categories (Fisher, Newman, and Dhar 2018). Due to this bias, consumers tend to make a categorical distinction between “positive” ratings (e.g., 4 and 5 stars) and “negative” ratings (e.g., 1 and 2 stars). Nevertheless, within those categories, individuals do not sufficiently differentiate between more extreme values (5s and 1s) and less extreme values (4s and 2s) (Fisher, Newman, and Dhar 2018). Furthermore, different consumers can have varying opinions on what is considered, for example, a 4- or a 5-star service experience. Given that both ratings are positive, collapsing them into a single positive category removes any bias from inconsistency in the sensitivity of anchors for different respondents. For this reason, the ratings were collapsed into three categories to conduct the CLM analysis: Negative ratings (1 or 2 stars), neutral ratings (3 stars), and positive ratings (4 or 5 stars).
CLMs are a powerful model class when it comes to analyzing ordered categorical data such as star ratings (Agresti 2010). Unlike other types of models, CLMs take into account the data’s ordered and categorical nature, and their flexible regression framework facilitates in-depth analyses (Vargas, Gutiérrez, and Hervás-Martínez 2020). Therefore, the R package ordinal (Christensen and Brockhoff 2013) was used to conduct the CLM analysis and evaluate the hypotheses proposed.
To select an appropriate link function for our CLM, different functions were compared in terms of the fit indices of their respective models. In particular, we examined the change in the Akaike Information Criterion (AIC), an indicator used commonly to assess how well a model fits the data it was generated from.
The link functions tested were: logit, probit, complementary log-log or cloglog, log-log, and cauchit. Given that the lowest AIC (387,471.65) is obtained with logit as the link function, the following cumulative logit model was fitted to the data:
The following section explains the results obtained from the analysis.
Results
Updated Model of Service Convenience
Using text-mining techniques, this study detected the service inconveniences mentioned in consumer reviews, which were then classified into the categories proposed in Berry et al.’s Model of Service Convenience (see Table 2). In this way, we identified which types of inconvenience are associated with each stage of the service experience in on-demand services.
Interestingly, there was one type of inconvenience that had a notable presence in the corpus (with an average topic weight of 9.53%, ranking as the third-highest topic prevalence) but that did not fit into any of Berry et al.’s model’s existing categories. We named this category ‘remote support (in)convenience’, as it refers to the time and effort spent by consumers in contacting customer service representatives, receiving answers to their inquiries, and obtaining appropriate compensation for a platform’s mistakes. Remarkably, this inconvenience is not tied to a specific service stage, as it can happen at any moment when the consumer requires help and does not receive proper assistance. Figure 4 shows how this new dimension fits into the existing Model of Service Convenience, resulting in an updated model. Updated Model of Service Convenience. Dimensions of service (in)convenience based on time and effort costs, along with examples of each stage in the process.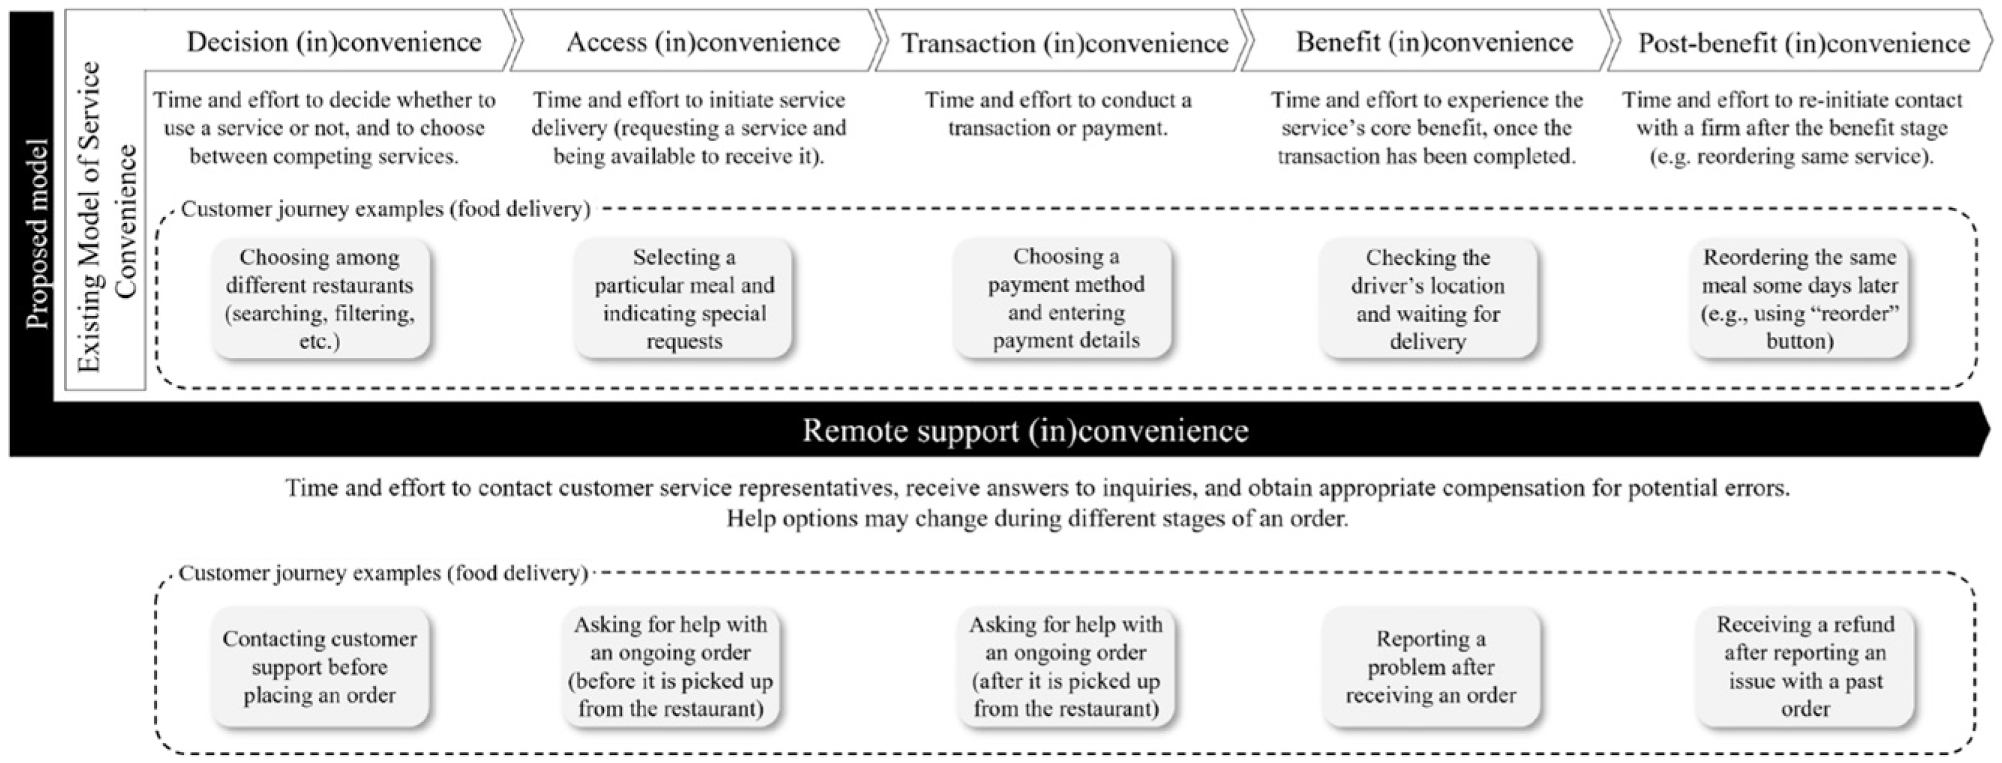
Test of Hypotheses: Impact of Service Inconvenience Attributions on Satisfaction
This study analyzed inconvenience attributions and their relation to consumer satisfaction at different stages of the service experience. We hypothesized that stability (H1) and responsibility (H2) attributions would moderate the effect of service inconveniences on satisfaction, so that the relationship between inconvenience and satisfaction would be stronger when attributions are high, than when they are low.
Results of the CLM and Simple Slopes Analyses.
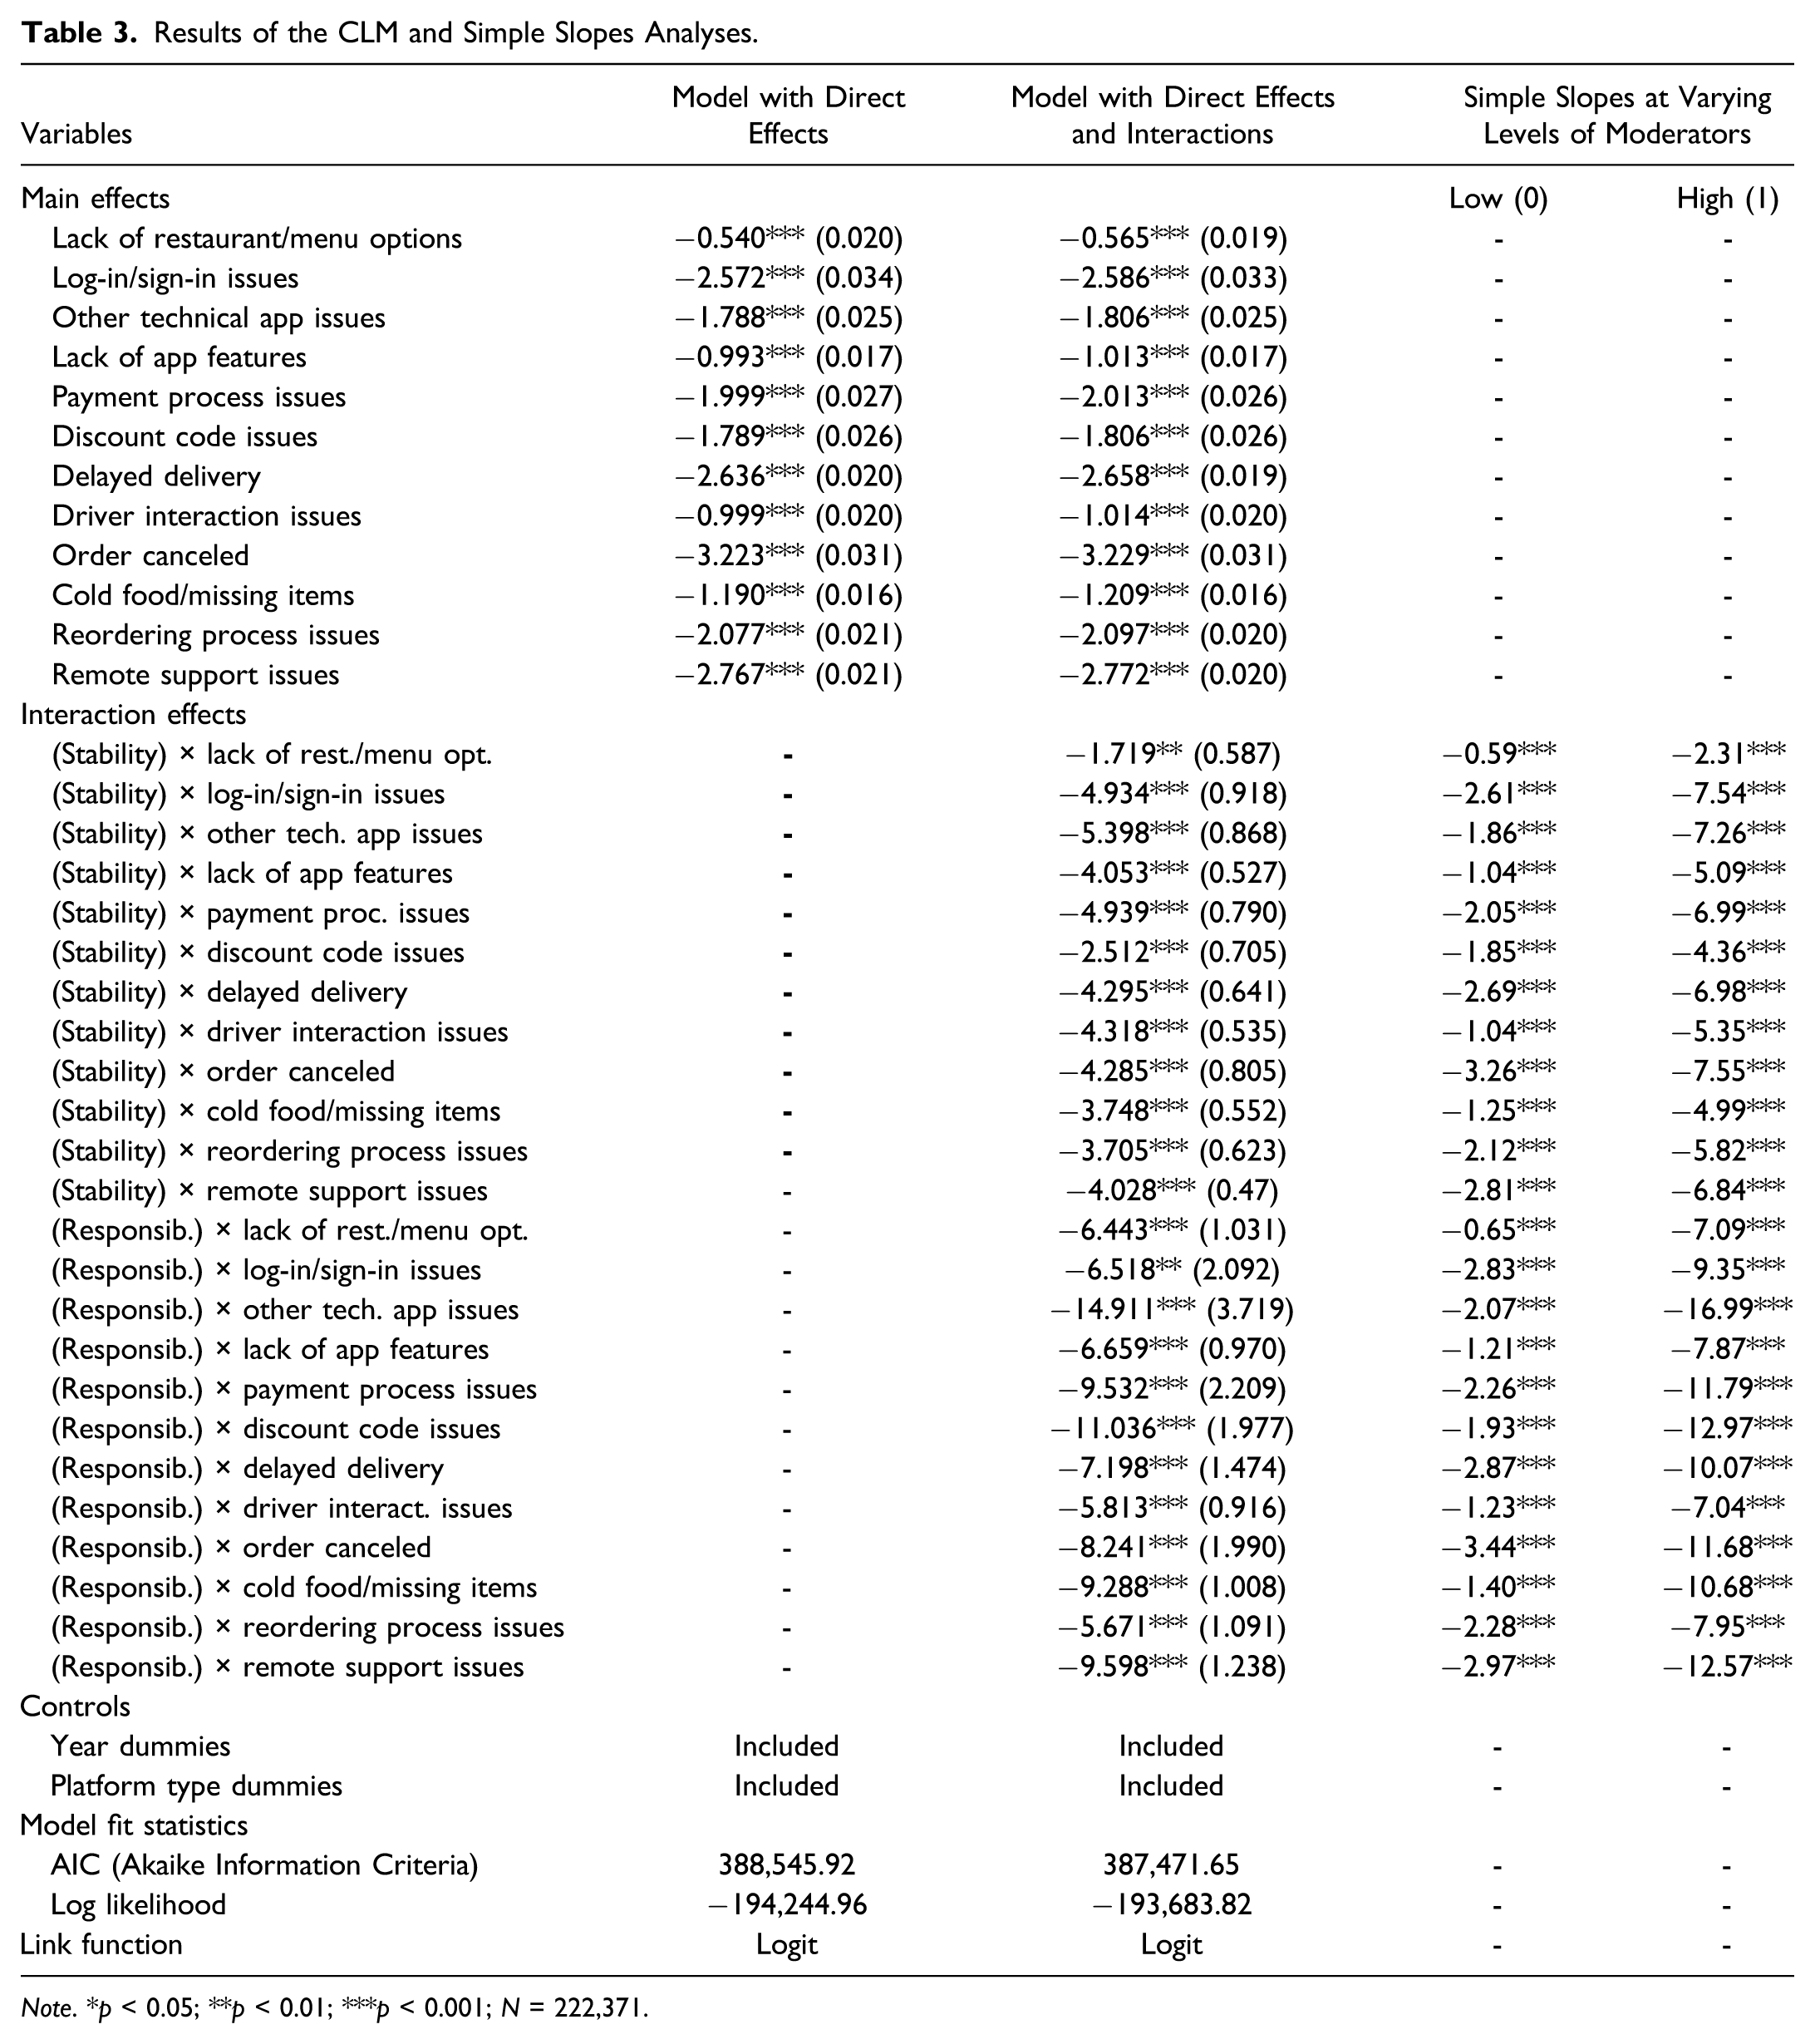
Note. *p < 0.05; **p < 0.01; ***p < 0.001; N = 222,371.
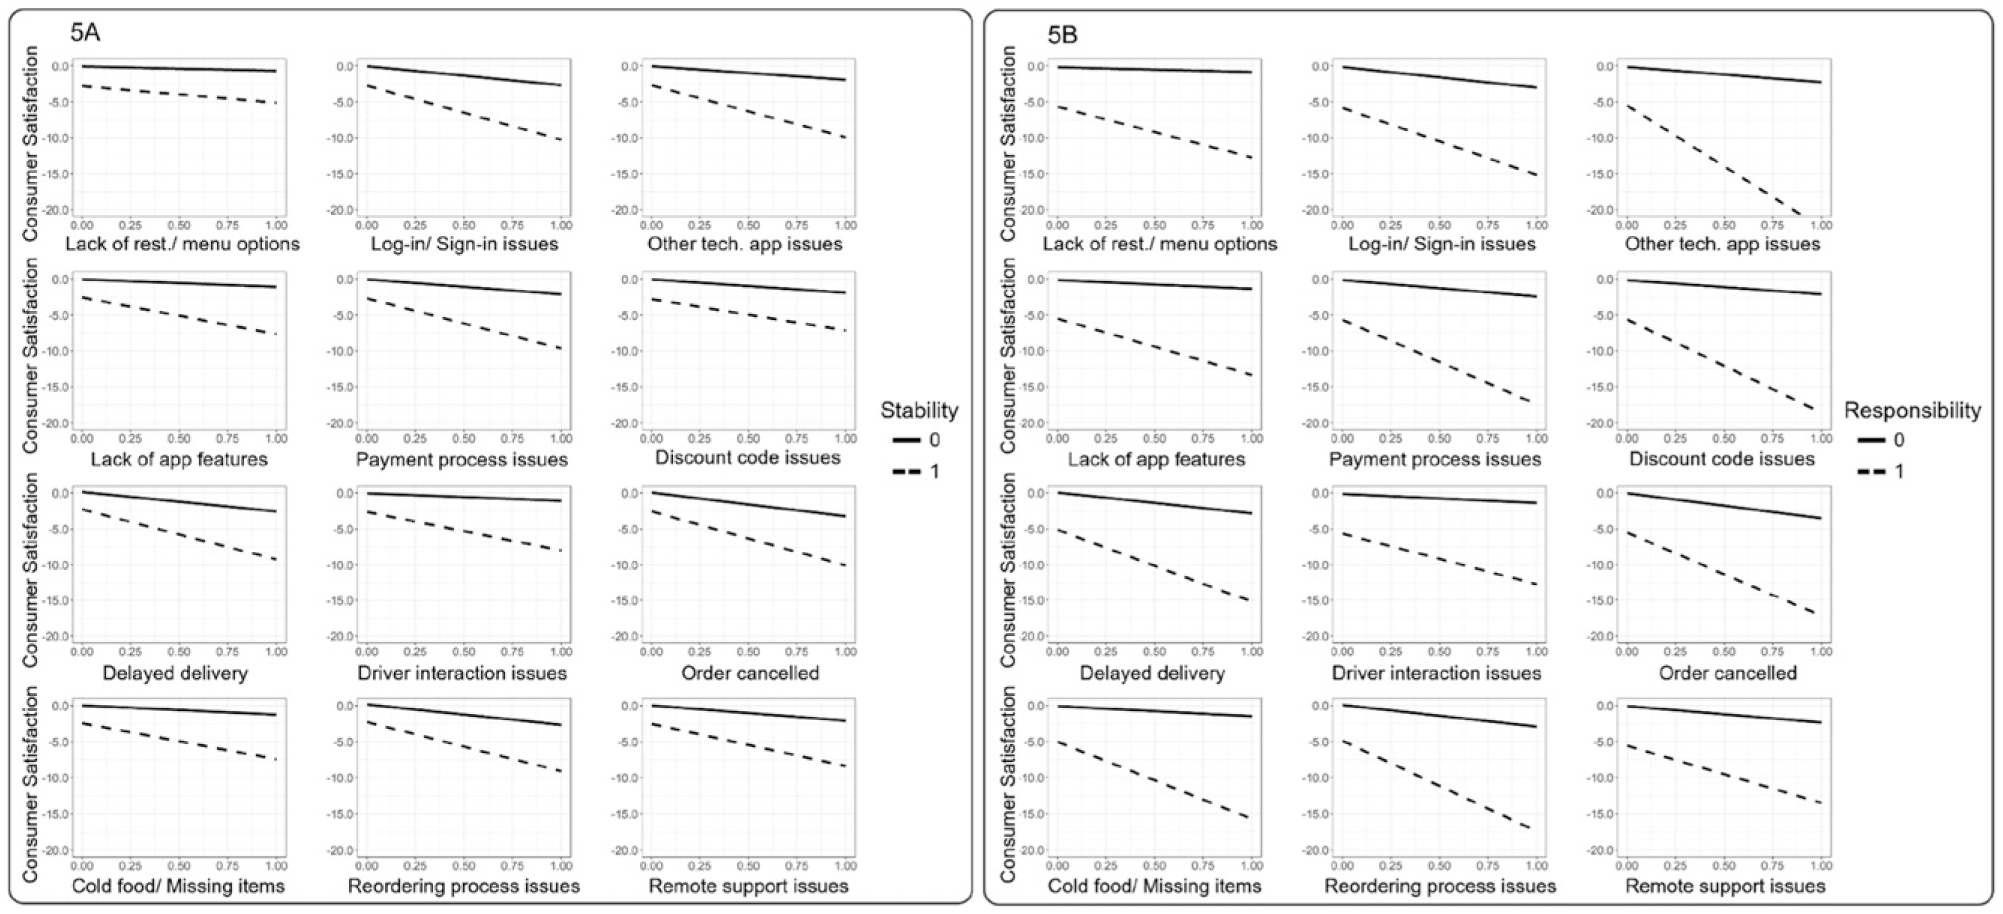
Simple slopes analysis: Moderating effects of stability and responsibility attributions on the relationship between different service inconveniences and consumer satisfaction.
In evaluating hypothesis H1, we identified a significant interaction effect of stability attributions. This suggests that consumers' dissatisfaction intensifies when they anticipate the inconvenience will recur in the future (see Table 3 and Figure 5(A)). In fact, when stability attributions are present, the impact of an inconvenience can be up to 4.3 times stronger (compared to its direct effect on satisfaction), as can be observed in Table 3. The greatest proportional difference is found in the case of “driver interaction issues,” which refers to inconveniences related to the person who delivers the order. The direct effect of “driver interaction issues” on satisfaction is significant, with a coefficient of β = −1.01 (p < 0.001). However, when stability attributions are factored in, the total effect (i.e., the sum of the direct effect and the interaction effect) on satisfaction is −5.33 (p < 0.001). This represents an increase of 426% in the effect size, indicating a substantial amplification due to stability attributions. Here are two examples of reviews in which stability attributions are combined with Driver interaction issues: “Every single time I order through this app, the time frame given is always wrong […] Also, the drivers never come to the door, rarely speak English, and always go to the wrong location despite specific instructions. This is highly irritating, and will most likely be my last order through this app.” “By far the worst food delivery application ever […] drivers are terrible always messing up your order, or dropping it off [at the] wrong address, or being super late with your order, up to 2 hours! […]”
On average, the effect of an inconvenience on satisfaction is around 2.4 times stronger if consumers think that it is stable (−244% from the baseline). When perceived as stable, “log-in/sign-in issues” shows the greatest effect on consumer satisfaction (−7.52, p < 0.001), followed by “order canceled” (−7.51, p < 0.001) and “other technical issues in the app” (−7.20, p < 0.001).
Regarding hypothesis H2, the interaction effect of responsibility attributions is significant and even more pronounced than that of stability attributions. This finding implies that consumers' dissatisfaction increases markedly when they attribute responsibility for the inconvenience to the platform (see Table 3 and Figure 5(B)). For example, “lack of restaurant/menu options” shows a direct effect on satisfaction of β = −0.57 (p < 0.001). When moderated by responsibility attributions, the total effect on satisfaction escalates to −7.01 (p < 0.001), translating to an 1,140% increase from the baseline effect. Here are two examples of reviews in which responsibility attributions are combined with a lack of restaurant/menu options: “Their dishonest and deceptive practice of listing restaurants they have no affiliation with, inaccurate menu prices and overcharging with multiple fees is just not acceptable.” “Beware! Restaurants in my area were added as partner restaurants but have no relationship with this company - I've confirmed with two owners. [Platform] used old/ outdated menus with items no longer available, added $1.50 extra fee for each item […].”
When responsibility attributions are present, the influence of an inconvenience on satisfaction is, on average, around 5.4 times stronger (−537%) compared to its direct effect. The inconveniences linked to “other technical issues in the app” are identified as manifesting the most negative effect on satisfaction if consumers perceive that they could have been prevented (−16.72, p < 0.001). Additionally, “discount code issues” (−12.84, p < 0.001) and “remote support issues” (−12.37, p < 0.001) show the second and third most significant negative effects when responsibility attributions are present. These outcomes support H2.
Wald Chi-square tests to Compare Moderating Effects of Attributions.
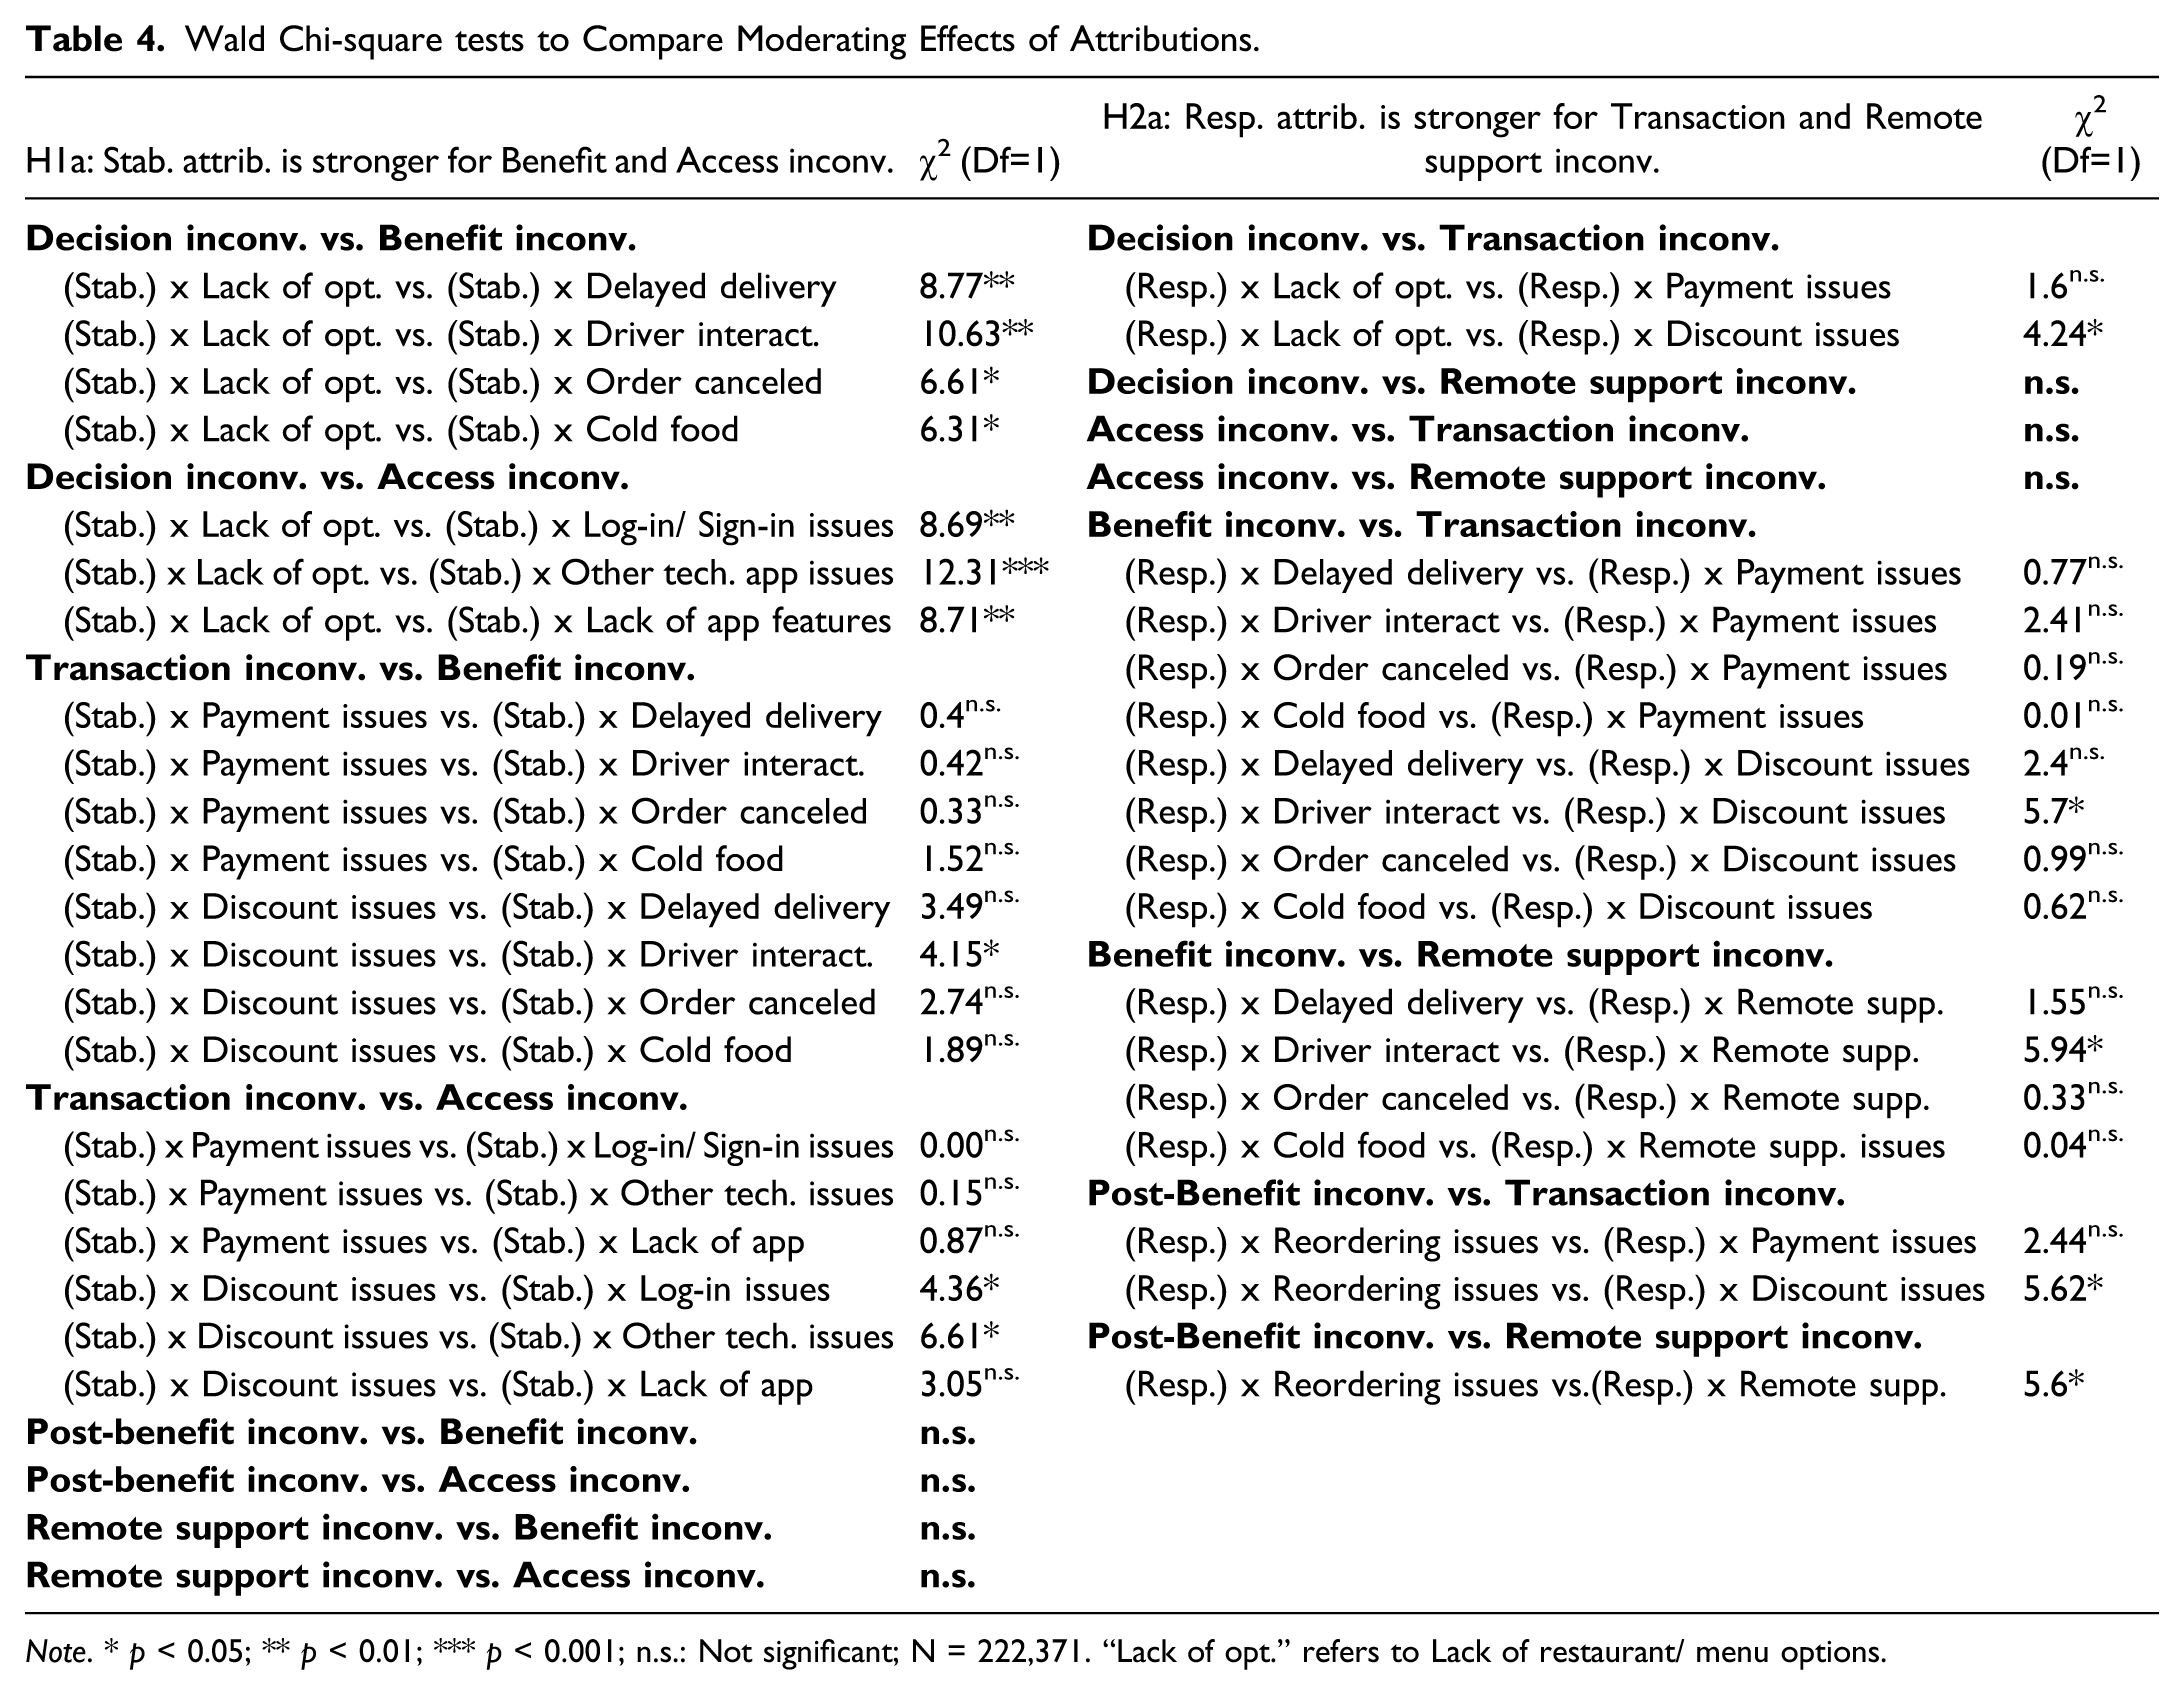
Note. * p < 0.05; ** p < 0.01; *** p < 0.001; n.s.: Not significant; N = 222,371. “Lack of opt.” refers to Lack of restaurant/ menu options.
Similarly, the Wald chi-square test partially supported our hypothesis H2a, which posited that responsibility attributions would exhibit a stronger moderating effect when coupled with transaction and remote support inconveniences. In particular, we found statistically significant differences when comparing the effects of responsibility in combination with post-benefit inconveniences and remote support inconveniences. The results also show certain significant differences when assessing the effect of responsibility attributions in combination with discount code issues (a type of transaction inconvenience) and remote support issues. However, as shown in Table 4, this pattern was not consistently observed.
In conclusion, we find that: (i) all service inconveniences have a negative influence on consumer satisfaction, (ii) the interaction effects of stability and responsibility attributions are significant, and (iii) the effects of attributions are particularly relevant for certain types of inconveniences, especially canceled orders and authentication errors (combined with high stability attributions), and technical issues in the app (with high responsibility attributions). Overall, the impact of service inconveniences intensifies when consumers perceive them as stable (likely to repeat in the future), and the effects are exacerbated even further when combined with responsibility attributions. Subsequently, we can infer that the model supports hypotheses H1 and H2, and partially supports H1a and H2a.
Discussion and Conclusions
This research aims to explore the moderating role of inconvenience attributions on the relationship between service inconveniences and consumer satisfaction. Previous studies have lacked a clear comprehension of service inconvenience attributions and their potential effects on consumer satisfaction, particularly at different stages of the service experience. This is especially pertinent in on-demand services, which target convenience-oriented consumers. Our study addresses these gaps by introducing a scalable method to assess service inconveniences and their attributions, employing keyword-assisted topic modeling to analyze unstructured data. The following sub-sections outline the key contributions of our research.
Theoretical Implications
The first contribution of this study is the integration of attribution theory with the established Model of Service Convenience. Incorporating attribution theory into the analysis allowed us to reach a deeper layer of understanding about how service inconveniences are perceived and evaluated by consumers. As a result, this study presents a valuable framework that can be leveraged by future research in service marketing and consumer behavior.
Second, we present an extended version of the Model of Service Convenience introduced by Berry, Seiders, and Grewal (2002). Based on our analysis of user-generated content, we detected an additional type of inconvenience (remote support inconvenience) that did not appear in the original Model of Service Convenience. This modification allows us to take into account the time and effort spent by consumers in contacting customer support representatives, receiving answers to inquiries, and obtaining appropriate compensation for the platform’s errors. Research shows that the technical and behavioral skills of customer support employees can have a great impact on overall consumer satisfaction (Ramasubbu, Mithas, and Krishnan, 2008). In the case of on-demand service platforms (including food delivery platforms), providing satisfactory customer service is a particularly difficult task. A key challenge is to mediate the interaction between waiting-time-sensitive consumers and independent service providers (Taylor 2018). Whenever there is an issue with their order, consumers will often contact the platform’s customer service area, even if an independent provider (such as the restaurant) is the source of the problem. To deal with these requests, platforms typically use live chats, chatbots, and outsourced call centers (Ostrom et al. 2021). While using these technologies allows organizations to meet the growing expectations of on-demand consumers, the constant need for immediacy places an enormous strain on service procedures (Ostrom et al. 2021). Given the importance of providing high-quality customer support, we believe that adding this new dimension to the Model of Service Convenience allows it to better capture the needs of digital consumers.
Third, our results indicate that when a service inconvenience is perceived as stable or controllable, its impact on satisfaction intensifies. More specifically, a service inconvenience’s effect on satisfaction can be over four or eleven times stronger when stability or responsibility attributions are present, respectively. By analyzing stability attributions at each stage of the service experience, we find that the incidences related to technical issues in the app can have the greatest impact on consumer satisfaction when consumers believe that these are likely to repeat in the future (i.e., they are stable). Similarly, technical incidences can have the strongest effect on satisfaction if consumers perceive that the service provider is responsible for the problem.
Fourth, this research provides a better understanding of how different service inconveniences and their attributions impact consumer satisfaction. By breaking down the process into stages and analyzing the influence of inconvenience attributions on satisfaction at each stage, we find that their impact can differ greatly across distinct types of inconveniences (see Table 3). In terms of the direct effects of service inconveniences on consumer satisfaction, the greatest impact is registered when the consumer’s order gets canceled, followed by remote support issues and delayed orders. While the latter and the first are inconveniences related to the service’s core benefit stage (i.e., having food delivered at home), remote support inconveniences can occur at any stage of the service experience. Moreover, our simple slopes analysis (see Table 3) allows us to compare the interaction effects of stability and responsibility attributions in combination with different service inconveniences. We find that the effects of attributions are particularly relevant when combined with certain types of inconveniences. The negative effect of stability attributions stands out in inconveniences related to canceled orders and accessing services (e.g., “log-in/sign-in issues”). When consumers face canceled orders (i.e., the core benefit is not delivered) and perceive them as stable and recurring, it will probably diminish their expectations of safely obtaining the service’s core benefit in the future. Similarly, repeated difficulties in accessing the service, such as log-in issues, disrupt the initial engagement, potentially setting a negative tone for the entire interaction. On the other hand, the effect of responsibility attributions is particularly strong when combined with technical errors in the app, together with incidences related to discount codes and remote support issues. This can be explained by consumers' perception that problems such as technical errors and discount code issues (being under the direct control of the service provider) should have been foreseeable and manageable—and could have been avoided. If consumers attribute a high level of responsibility to the service provider when experiencing these inconveniences, it may lead to increased dissatisfaction and a sense of mistrust. Similarly, problems in remote support may heighten frustration as consumers seek assistance during challenging situations. Overall, the results provide novel insights into how different attributions and service inconveniences can influence consumer satisfaction.
As a final contribution, this study responds to the call for the use of unstructured data and new data analysis techniques to further advance service research (Huang et al. 2021). Although big data and machine learning-based analytics are becoming increasingly popular in marketing research (Huang and Rust, 2021), these techniques still present an enormous untapped potential. This research proposes a scalable approach to measure service inconveniences and their attributions, using keyword-assisted topic modeling and cumulative link model analysis. The method presented can be useful for measuring specific concepts in large data sets of unstructured text and evaluating their effects on consumer satisfaction (via user ratings). This technique can be valuable for scholars who wish to test theory using text analytics. We believe that our approach contributes to embracing the opportunities (and tackling the challenges) of our increasingly digital world.
Managerial Implications
According to our results, all types of service inconvenience can negatively impact consumer satisfaction, with some being more critical than others. Moreover, the intensity of such effects varies greatly depending on how stable or controllable the inconvenience is perceived to be. Consequently, this research offers several relevant implications for managers.
First, effective customer service is crucial for on-demand platforms, and managers should prioritize ensuring that their platforms consistently provide efficient remote assistance. This involves investing in comprehensive training for customer service representatives, empowering staff with the necessary skills to resolve consumer issues effectively and empathetically. Furthermore, our research highlights that canceled orders and delayed deliveries significantly impact consumer satisfaction. To mitigate this, it is vital for on-demand platforms to implement robust policies for compensating consumers affected by these particular inconveniences. This compensation should be both fair and timely, aimed at restoring consumer trust and maintaining service credibility. By proactively addressing these key areas of concern, on-demand platforms can enhance consumer satisfaction.
Second, we encourage practitioners to take specific actions to prevent inaccurate or adverse causal attributions regarding the service’s potential inconveniences. For example, they could be proactive and respond swiftly to negative consumer reviews. To avoid stability attributions, the platform must ensure that consumers know that the firm wants to use their feedback to avoid similar issues in the future. This is particularly relevant in the case of technical app issues, payment process issues, and log-in/sign-in issues, which have the strongest effect on satisfaction when perceived as stable. It is important that consumers understand that the platform is committed to avoiding the repetition of such problems in the future. Regarding responsibility attributions, remote support incidences can have the most significant effects on satisfaction if consumers perceive that the platform could have prevented these issues. Similarly, technical incidences, faulty discount codes, and payment process issues have the largest impact on satisfaction when responsibility attributions are present. In these cases, it is important that platform representatives clearly explain that the firm did not intentionally cause such inconveniences, aside from apologizing and offering adequate compensation.
Finally, service companies can benefit from incorporating text-mining techniques to obtain consumer insights and enhance their operations. Using the methodology introduced in our study, they could analyze user-generated content and systematically identify the most critical service inconveniences experienced by their consumers. Furthermore, our approach can also be used to measure the stability and responsibility attributions associated with each inconvenience. These insights can help a company obtain a deeper understanding of how their consumers perceive their platform, as well as how they can better react to consumer complaints and improve their services.
Limitations and Opportunities for Future Research
This research has several limitations, which in turn present opportunities for future research. First, the analysis is based on data generated by consumers of food delivery platforms in the United States. Future research should aim to test the model using data from other regions and sectors to improve the generalizability of our conclusions. Second, the consumers' star ratings are used as an overall heuristic of satisfaction in our study. To examine the robustness of our hypotheses, it would be useful to select an alternative measurement of consumer satisfaction (e.g., sentiment score) and to compare the results. Finally, this research did not analyze the potential impact of recovery strategies as a response to service inconveniences. It would be interesting to examine different recovery strategies and explore how these can mitigate the negative effects of service inconveniences (and their causal attributions) on consumer satisfaction.
Supplemental Material
Supplemental Material - An Inconvenient Truth: Understanding Service Inconvenience in Digital Platforms
Supplemental Material for An Inconvenient Truth: Understanding Service Inconvenience in Digital Platforms by Natalia Amat-Lefort and Stuart J. Barnes in Journal of Service Research
Footnotes
Declaration of conflicting interests
The author(s) declared no potential conflicts of interest with respect to the research, authorship, and/or publication of this article.
Funding
The author(s) received no financial support for the research, authorship, and/or publication of this article.
Supplemental Material
Supplemental material for this article is available online.
Author Biographies
References
Supplementary Material
Please find the following supplemental material available below.
For Open Access articles published under a Creative Commons License, all supplemental material carries the same license as the article it is associated with.
For non-Open Access articles published, all supplemental material carries a non-exclusive license, and permission requests for re-use of supplemental material or any part of supplemental material shall be sent directly to the copyright owner as specified in the copyright notice associated with the article.